Embed Size (px)
Citation preview

Copyright ©2014ENPLAS CORPORATION, All rights reserved
FY2014 Third-Quarter Results
January 30,2014
Enplas Corporation
2
Notes
・ “fiscal 2013” or “FY2013” refers to the year ending
March 31, 2013.
・ “fiscal 2014” or “FY2014” refers to the year ending
March 31, 2014.
Copyright ©2014ENPLAS CORPORATION, All rights reserved
3
Agenda
■ FY2014 Management Policy
■ FY2014 3rd Quarter Account Results (Consolidated)
■ Trend and Business Strategy for Each Segment
■ FY2014 Plan(Consolidated)
■ FY2014 3rd Quarter Action plan and Results
Copyright ©2014ENPLAS CORPORATION, All rights reserved
4
FY2014 Management Policy
Growth by continuous challenges for new
products and new business opportunity
Pursue the cutting-edge technology
Strengthen the global management
foundation
Copyright ©2014ENPLAS CORPORATION, All rights reserved
5
2013年3月期 損益実績
FY2014
Plan
FY2014
3Q(9Mcum.)
Results
FY2014
3Q Results
FY2014
2Q Results Change
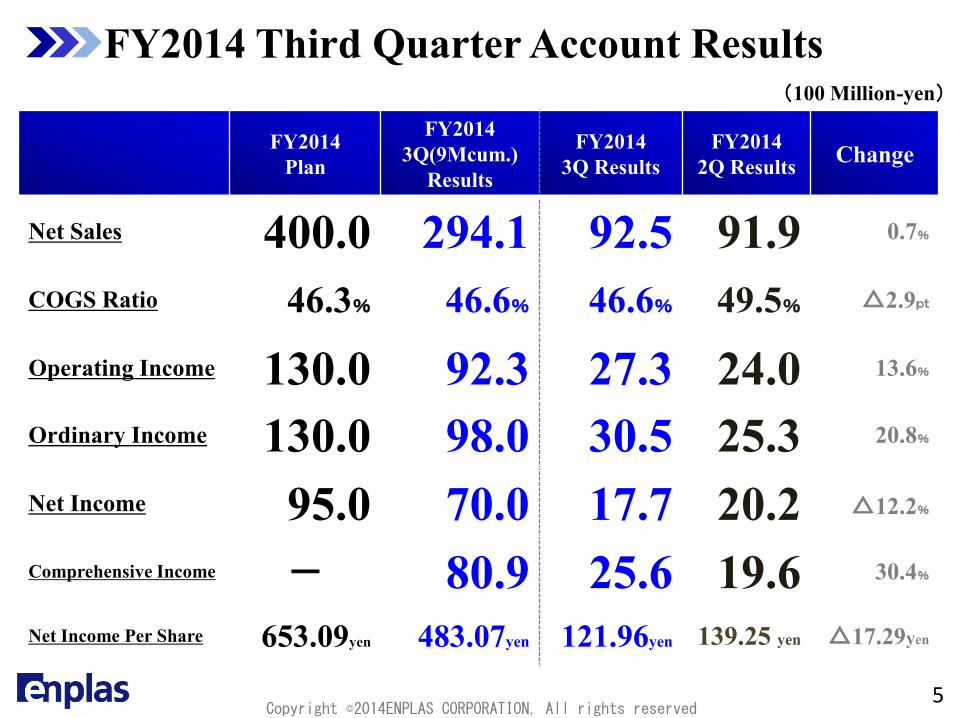
Net Sales 400.0 294.1 92.5 91.9 0.7%
COGS Ratio 46.3% 46.6% 46.6% 49.5% △2.9pt
Operating Income 130.0 92.3 27.3 24.0 13.6%
Ordinary Income 130.0 98.0 30.5 25.3 20.8%
Net Income 95.0 70.0 17.7 20.2 △12.2%
Comprehensive Income - 80.9 25.6 19.6 30.4%
Net Income Per Share 653.09yen 483.07yen 121.96yen 139.25 yen △17.29yen
(100 Million-yen)
FY2014 Third Quarter Account Results
Copyright ©2014ENPLAS CORPORATION, All rights reserved
6
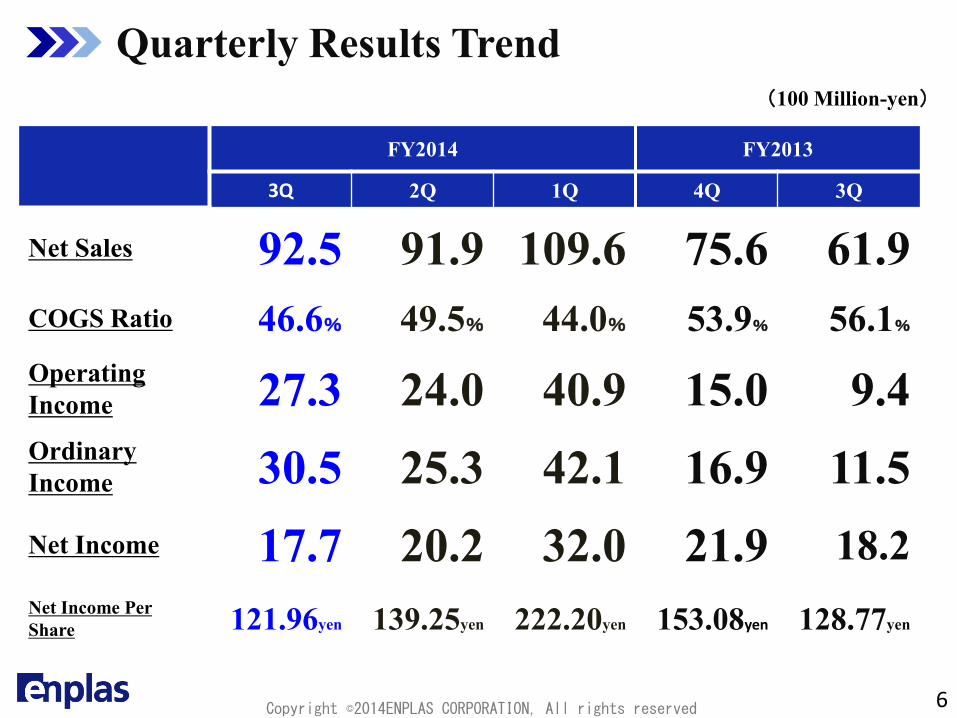
Quarterly Results Trend
(100 Million-yen)
FY2014 FY2013
3Q 2Q 1Q 4Q 3Q
Net Sales 92.5 91.9 109.6 75.6 61.9
COGS Ratio 46.6% 49.5% 44.0% 53.9% 56.1%
Operating
Income 27.3 24.0 40.9 15.0 9.4
Ordinary
Income 30.5 25.3 42.1 16.9 11.5
Net Income 17.7 20.2 32.0 21.9 18.2
Net Income Per
Share 121.96yen 139.25yen 222.20yen 153.08yen 128.77yen
Copyright ©2014ENPLAS CORPORATION, All rights reserved
7
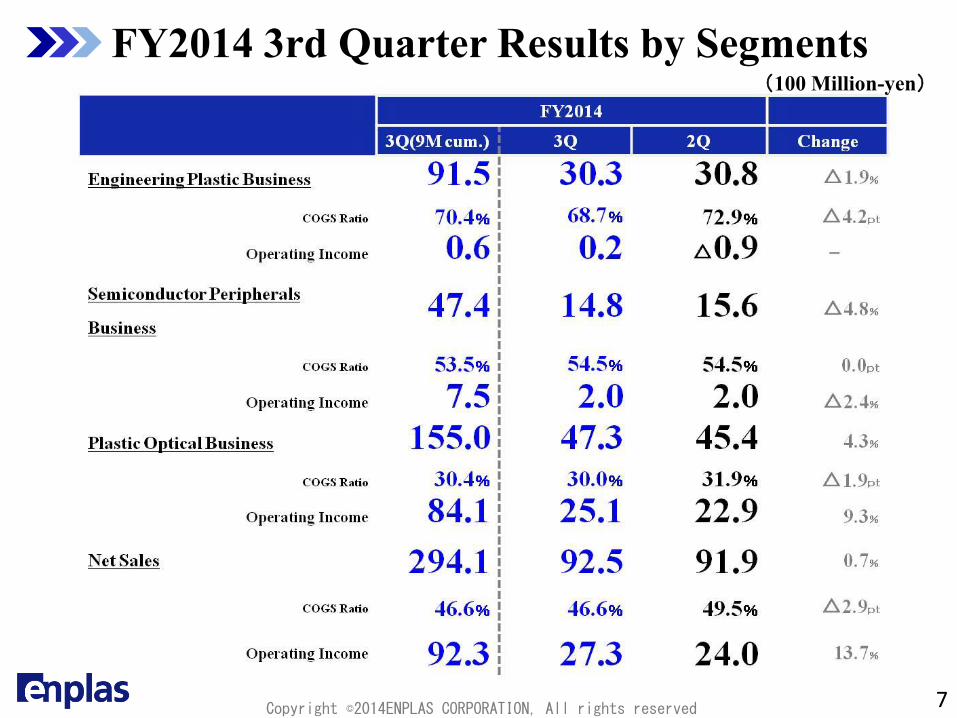
FY2014 3rd Quarter Results by Segments (100 Million-yen)
Copyright ©2014ENPLAS CORPORATION, All rights reserved
8
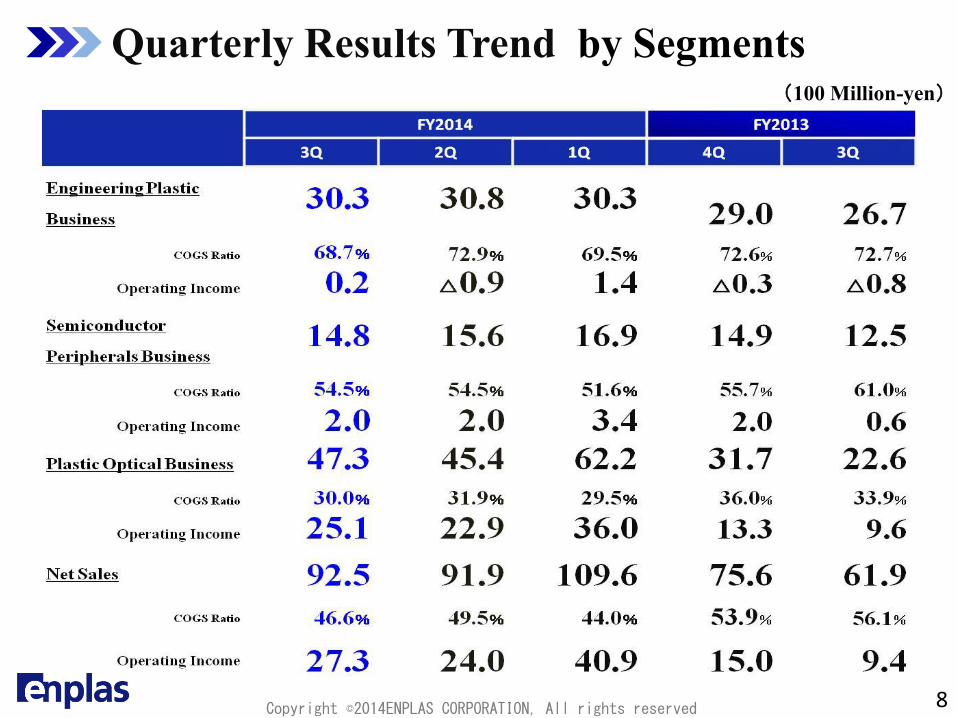
Quarterly Results Trend by Segments (100 Million-yen)
Copyright ©2014ENPLAS CORPORATION, All rights reserved
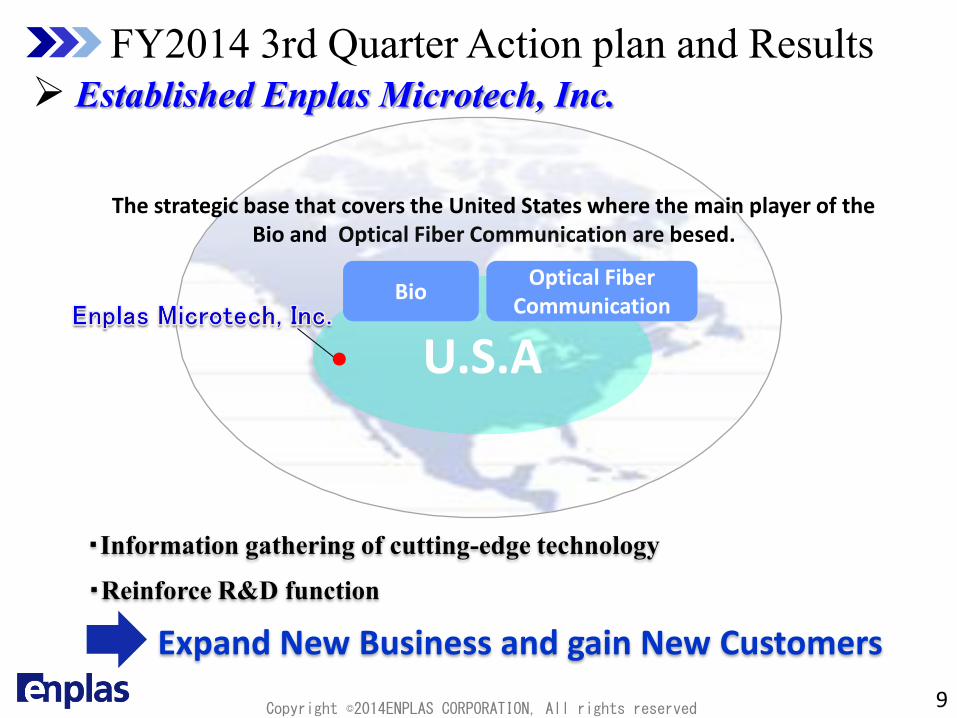
Established Enplas Microtech, Inc.
9 Copyright ©2014ENPLAS CORPORATION, All rights reserved
Expand New Business and gain New Customers
The strategic base that covers the United States where the main player of the Bio and Optical Fiber Communication are besed.
U.S.A
Bio Optical Fiber
Communication
●
・Information gathering of cutting-edge technology
・Reinforce R&D function
FY2014 3rd Quarter Action plan and Results
10 Copyright ©2014ENPLAS CORPORATION, All rights reserved
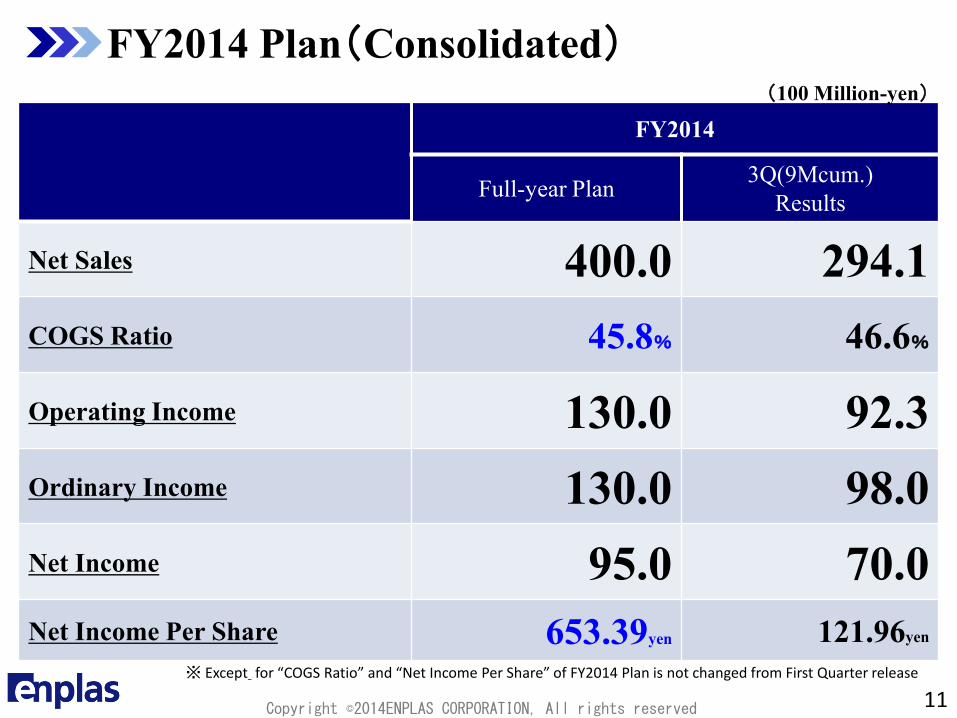
11
FY2014
Full-year Plan 3Q(9Mcum.)
Results
Net Sales 400.0 294.1
COGS Ratio 45.8% 46.6%
Operating Income 130.0 92.3
Ordinary Income 130.0 98.0
Net Income 95.0 70.0
Net Income Per Share 653.39yen 121.96yen
FY2014 Plan(Consolidated) (100 Million-yen)
Copyright ©2014ENPLAS CORPORATION, All rights reserved
※ Except for “COGS Ratio” and “Net Income Per Share” of FY2014 Plan is not changed from First Quarter release
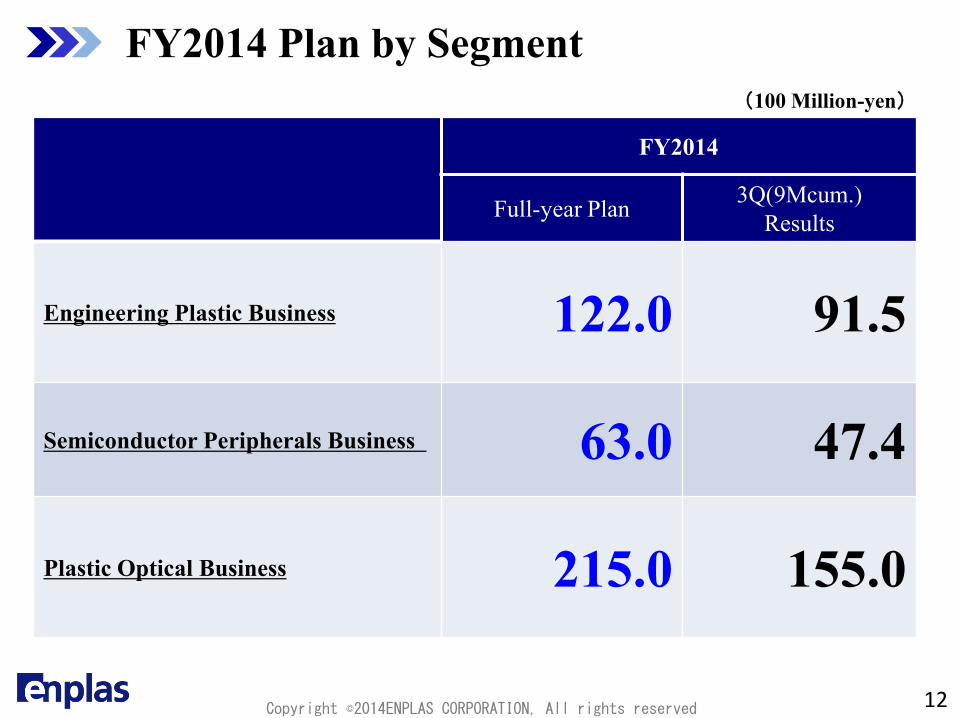
12
FY2014
Full-year Plan 3Q(9Mcum.)
Results
Engineering Plastic Business 122.0 91.5
Semiconductor Peripherals Business 63.0 47.4
Plastic Optical Business 215.0 155.0
FY2014 Plan by Segment
(100 Million-yen)
Copyright ©2014ENPLAS CORPORATION, All rights reserved
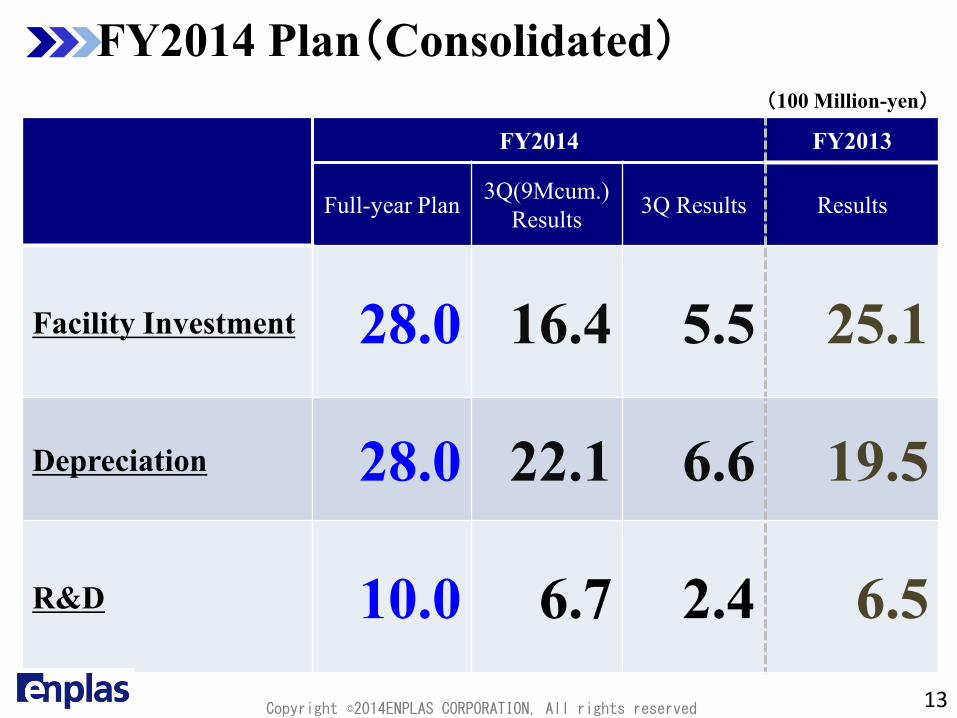
13
FY2014 FY2013
Full-year Plan 3Q(9Mcum.)
Results 3Q Results Results
Facility Investment 28.0 16.4 5.5 25.1
Depreciation 28.0 22.1 6.6 19.5
R&D 10.0 6.7 2.4 6.5
FY2014 Plan(Consolidated) (100 Million-yen)
Copyright ©2014ENPLAS CORPORATION, All rights reserved
14
Trend and Business Strategy for Each Segment
Copyright ©2014ENPLAS CORPORATION, All rights reserved
15
Gain new customers by developing business in new domain
Establish elemental technology and technical theory
Establish manufacturing basis that can adjust to changes in
business environment
Strengthen the headquarters function and global network
FY2014 Business Strategy
Copyright ©2014ENPLAS CORPORATION, All rights reserved
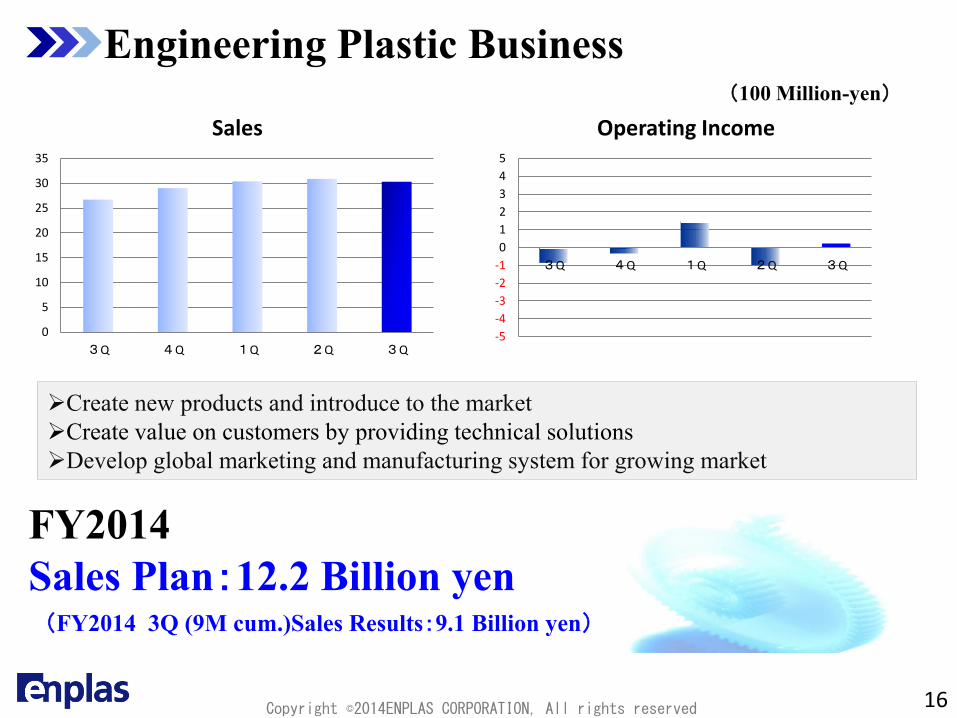
FY2014
Sales Plan:12.2 Billion yen (FY2014 3Q (9M cum.)Sales Results:9.1 Billion yen)
28 26 26 26
16
Create new products and introduce to the market
Create value on customers by providing technical solutions
Develop global marketing and manufacturing system for growing market
Engineering Plastic Business (100 Million-yen)
Copyright ©2014ENPLAS CORPORATION, All rights reserved
0
5
10
15
20
25
30
35
3Q 4Q 1Q 2Q 3Q
Sales
-5
-4
-3
-2
-1
0
1
2
3
4
5
3Q 4Q 1Q 2Q 3Q
Operating Income
13
17
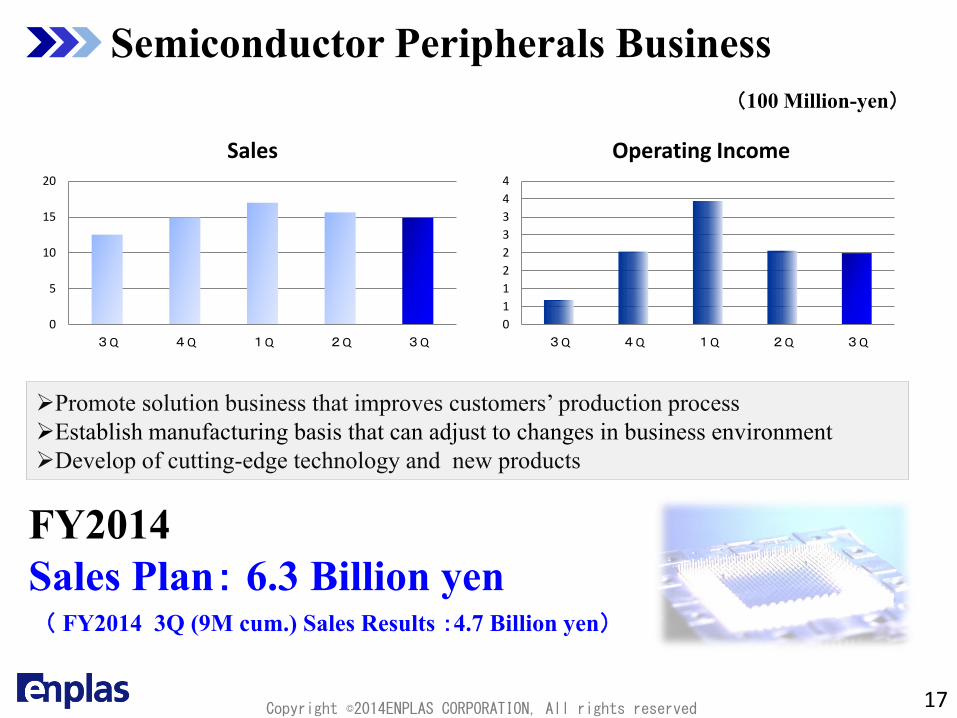
Promote solution business that improves customers’ production process
Establish manufacturing basis that can adjust to changes in business environment
Develop of cutting-edge technology and new products
FY2014
Sales Plan: 6.3 Billion yen ( FY2014 3Q (9M cum.) Sales Results :4.7 Billion yen)
(100 Million-yen)
Semiconductor Peripherals Business
Copyright ©2014ENPLAS CORPORATION, All rights reserved
0
5
10
15
20
3Q 4Q 1Q 2Q 3Q
Sales
0
1
1
2
2
3
3
4
4
3Q 4Q 1Q 2Q 3Q
Operating Income
24
24
18
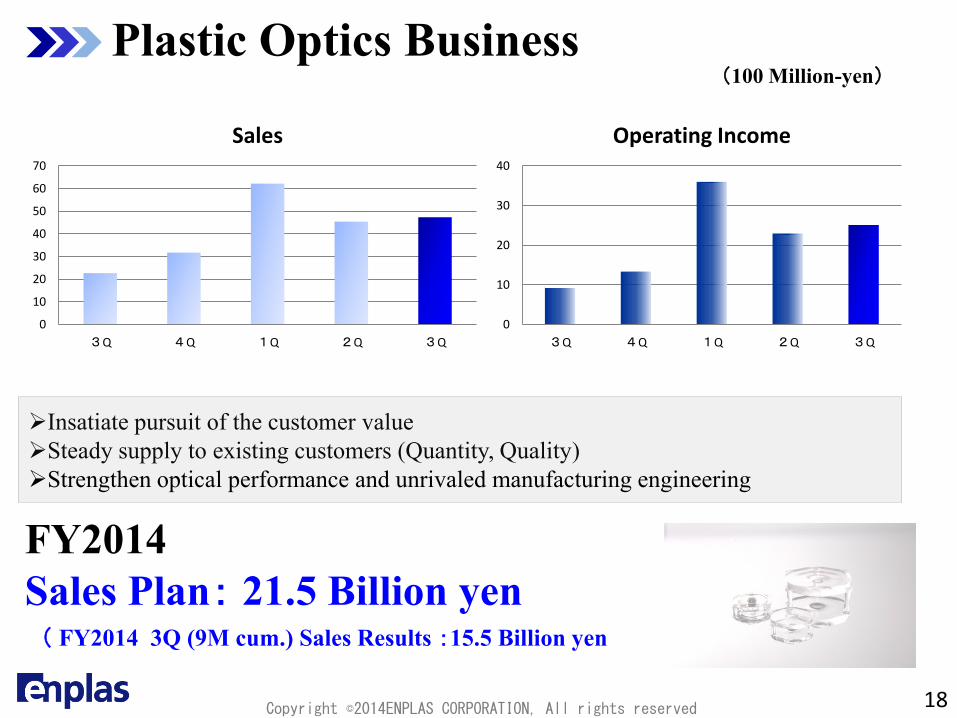
Insatiate pursuit of the customer value
Steady supply to existing customers (Quantity, Quality)
Strengthen optical performance and unrivaled manufacturing engineering
FY2014
Sales Plan: 21.5 Billion yen ( FY2014 3Q (9M cum.) Sales Results :15.5 Billion yen
(100 Million-yen)
Plastic Optics Business
Copyright ©2014ENPLAS CORPORATION, All rights reserved
0
10
20
30
40
50
60
70
3Q 4Q 1Q 2Q 3Q
Sales
0
10
20
30
40
3Q 4Q 1Q 2Q 3Q
Operating Income
19
0.0
5.0
10.0
15.0
20.0
25.0
30.0
35.0
2010 2011 2012 2013 2014 2015 2016 2017 2018 2019 2020
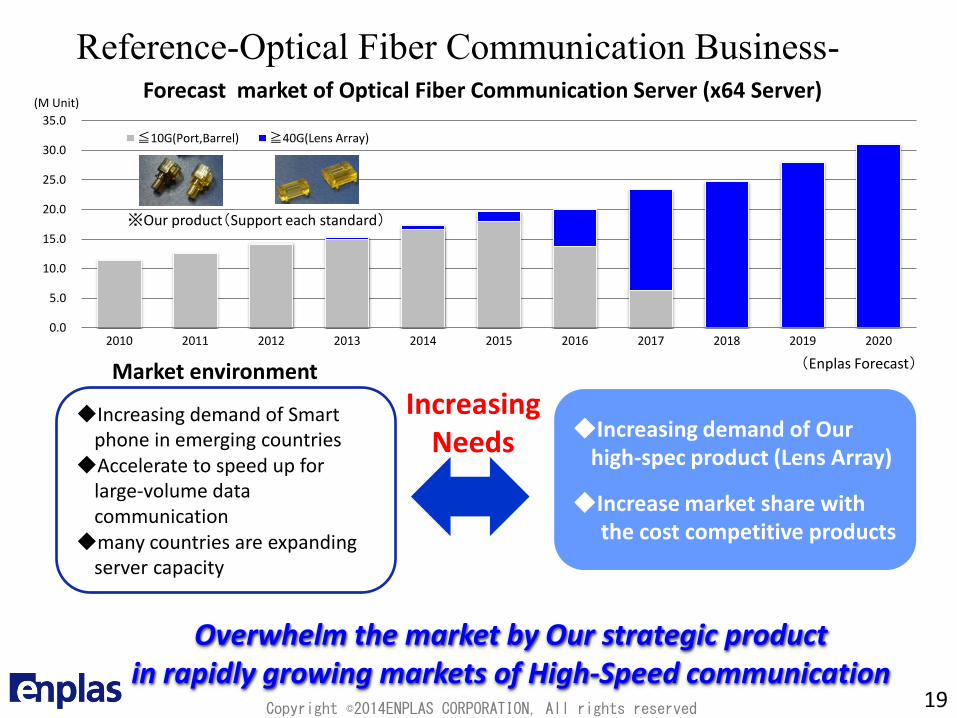
Forecast market of Optical Fiber Communication Server (x64 Server)
≦10G(Port,Barrel) ≧40G(Lens Array)
(M Unit)
※Our product(Support each standard)
Market environment
◆Increasing demand of Smart phone in emerging countries
◆Accelerate to speed up for large-volume data communication
◆many countries are expanding server capacity
◆Increasing demand of Our high-spec product (Lens Array)
◆Increase market share with the cost competitive products
(Enplas Forecast)
Increasing Needs
Reference-Optical Fiber Communication Business-
Copyright ©2014ENPLAS CORPORATION, All rights reserved
Overwhelm the market by Our strategic product in rapidly growing markets of High-Speed communication
Copyright ©2014ENPLAS CORPORATION, All rights reserved 20
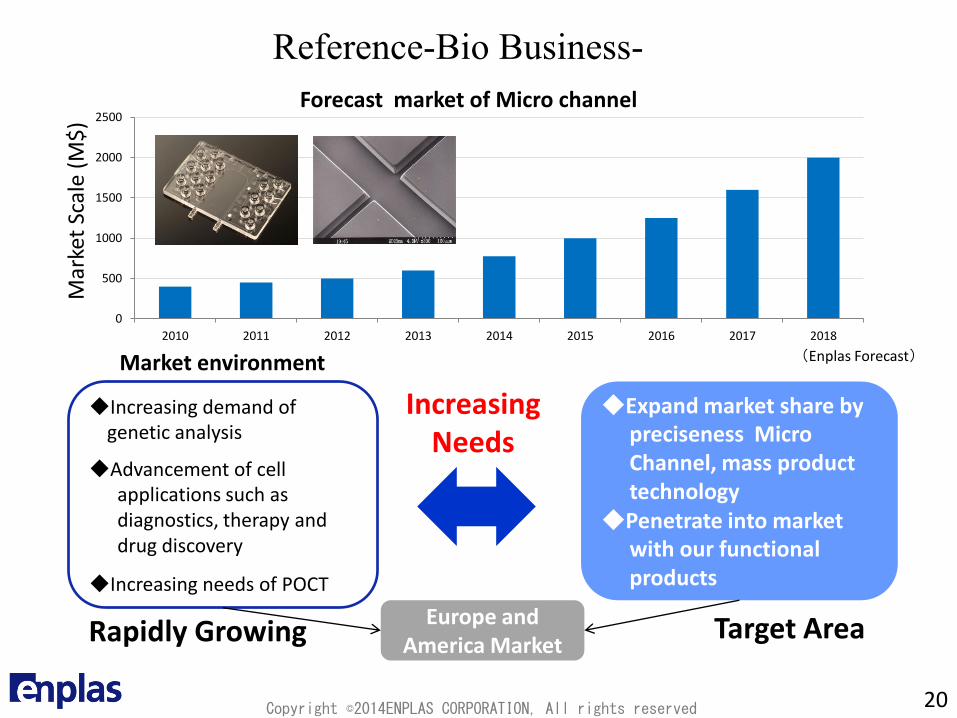
Europe and America Market
◆Increasing demand of genetic analysis
◆Advancement of cell applications such as diagnostics, therapy and drug discovery
◆Increasing needs of POCT
◆Expand market share by preciseness Micro Channel, mass product technology
◆Penetrate into market with our functional products
Rapidly Growing Target Area
0
500
1000
1500
2000
2500
2010 2011 2012 2013 2014 2015 2016 2017 2018
Forecast market of Micro channel M
arke
t Sc
ale
(M$
) Reference-Bio Business-
(Enplas Forecast) Market environment
Increasing Needs

Financial Results for the Third Quarter of
the Year Ending March 31, 2014
http://www.enplas.co.jp/
Any statements in this presentation which are not historical are future projections based on certain assumptions and executive judgments drawn from currently available information. Please note that actual performance may vary significantly from any particular projection due to various factors. Factors affecting our actual performance include but are not limited to: (i) changes in economic conditions or demand trends related to Enplas’s business operations; (ii) fluctuation of foreign exchange rates or interest rates; and (iii) our ability to continue R&D, manufacturing and marketing in a timely manner in the electronics business sector, where technological innovations are rapid and new products are launched continuously. All the information in this document is the property of Enplas Corporation. All parties are prohibited, for whatever purpose, to copy, modify, reproduce, transmit, etc. this information regardless of ways and means without prior written permission of Enplas Corporation.
Enplas Corporation
Copyright ©2014ENPLAS CORPORATION, All rights reserved