Embed Size (px)
Citation preview
D.A.Consortium Inc.August 5, 2015
FY2015-1QFinancial Results Briefing
©2015 D.A.Consortium All rights reserved
Table of Contents
Overview of Financial Results(Consolidated/Non-consolidated)
Business Trends
Key Measures
-1-
©2015 D.A.Consortium All rights reserved
Overview of Consolidated Financial Results
-2-
©2015 D.A.Consortium All rights reserved
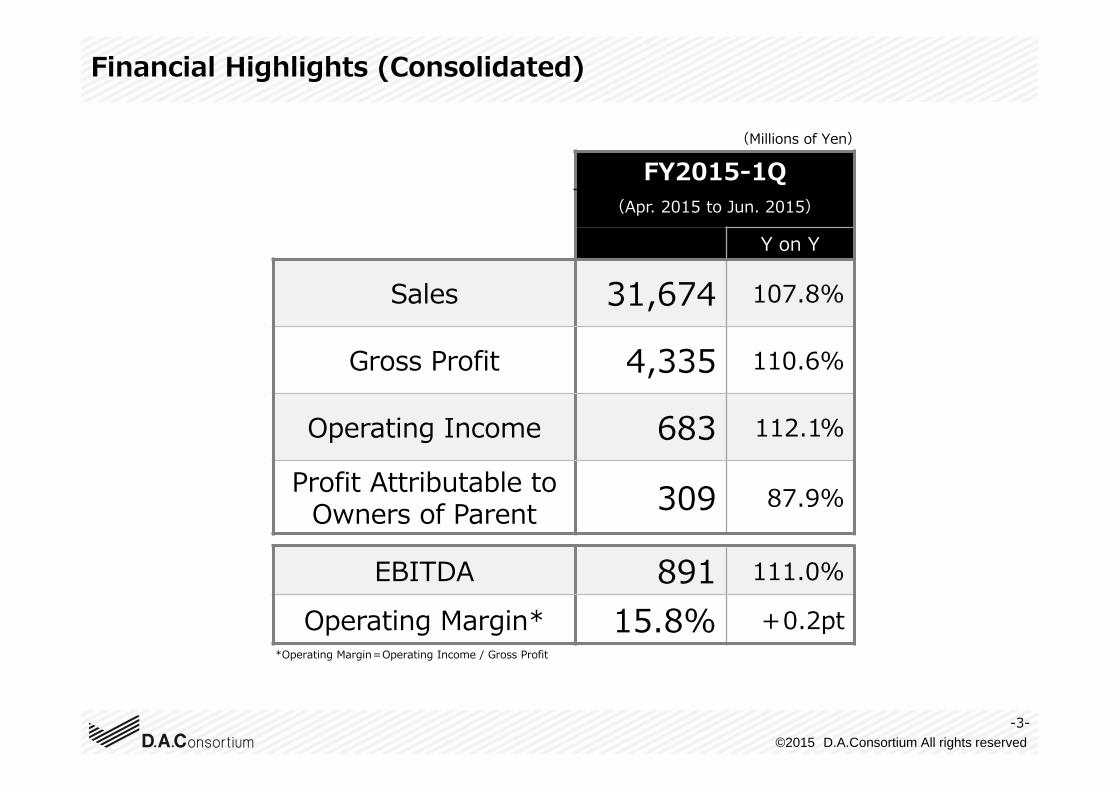
*Operating Margin=Operating Income / Gross Profit
Financial Highlights (Consolidated)
FY2015-1Q(Apr. 2015 to Jun. 2015)
Y on Y
Sales 31,674 107.8%
Gross Profit 4,335 110.6%
Operating Income 683 112.1%
Profit Attributable to Owners of Parent 309 87.9%
EBITDA 891 111.0%
Operating Margin* 15.8% +0.2pt
(Millions of Yen)
-3-
©2015 D.A.Consortium All rights reserved
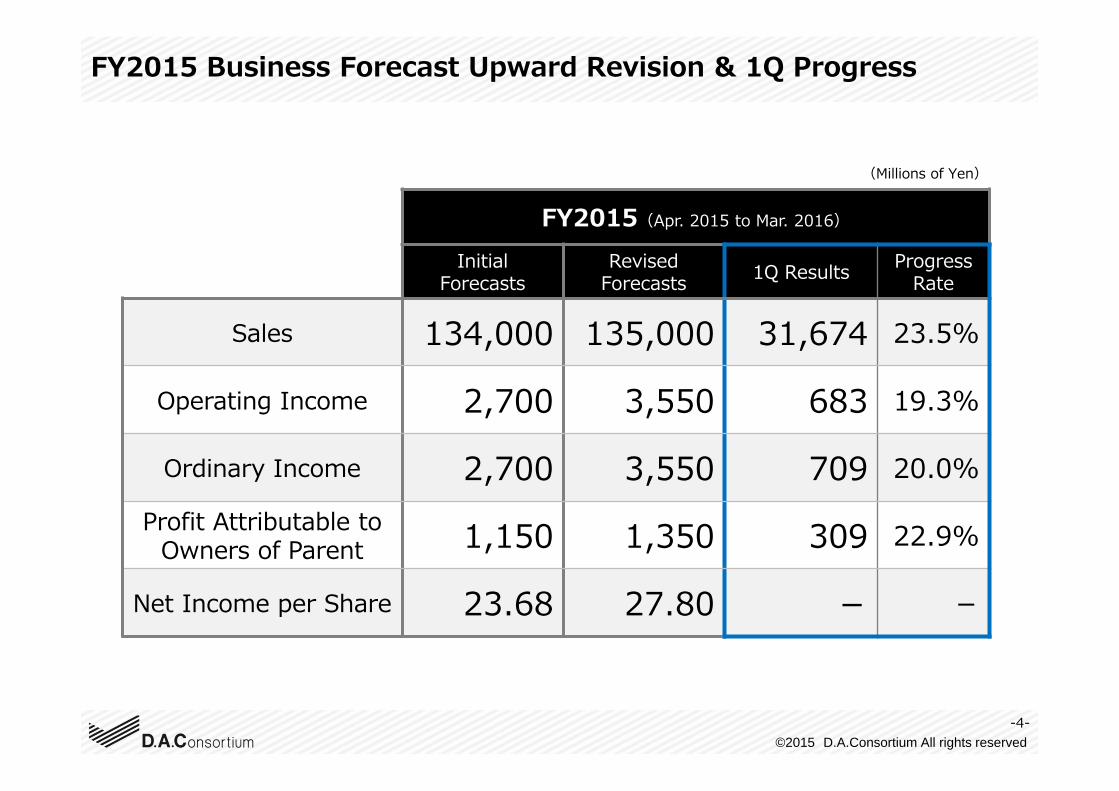
FY2015 Business Forecast Upward Revision & 1Q Progress
-4-
FY2015(Apr. 2015 to Mar. 2016)
Initial Forecasts
Revised Forecasts 1Q Results Progress
Rate
Sales 134,000 135,000 31,674 23.5%
Operating Income 2,700 3,550 683 19.3%
Ordinary Income 2,700 3,550 709 20.0%
Profit Attributable to Owners of Parent 1,150 1,350 309 22.9%
Net Income per Share 23.68 27.80 - -
(Millions of Yen)
©2015 D.A.Consortium All rights reserved
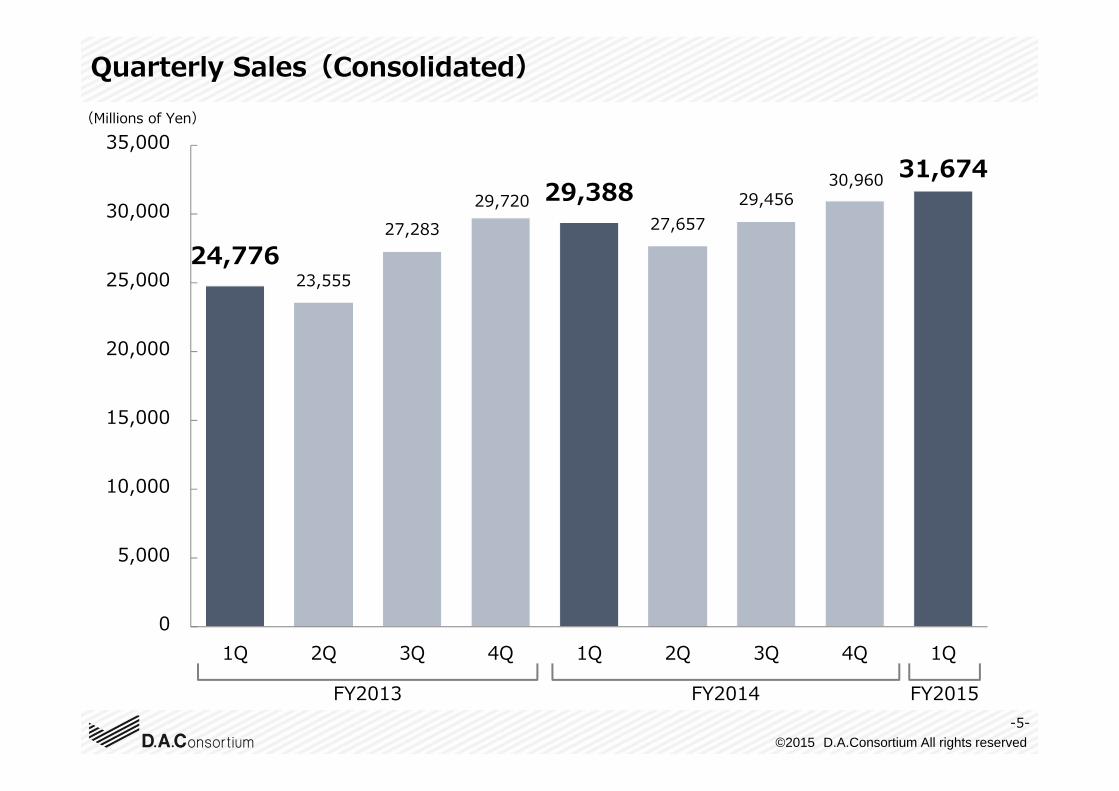
24,77623,555
27,28329,720 29,388
27,65729,456
30,960 31,674
0
5,000
10,000
15,000
20,000
25,000
30,000
35,000
1Q 2Q 3Q 4Q 1Q 2Q 3Q 4Q 1Q
Quarterly Sales(Consolidated)(Millions of Yen)
-5-
FY2013 FY2014 FY2015
©2015 D.A.Consortium All rights reserved
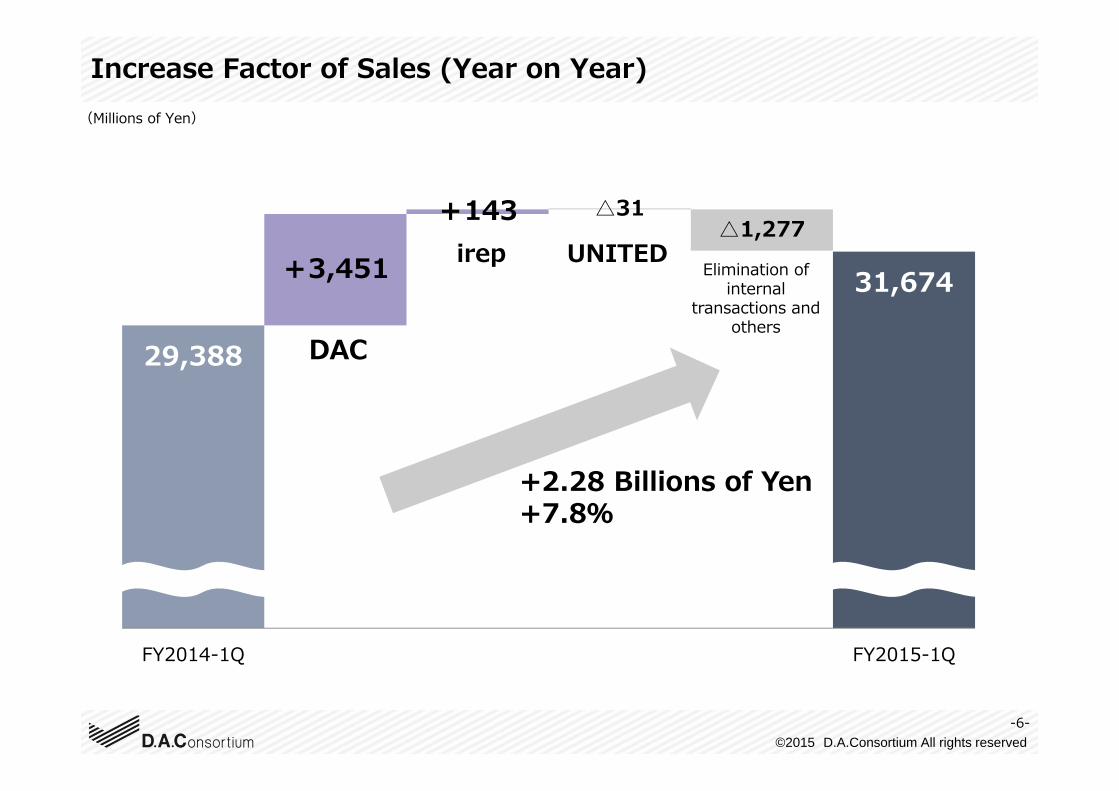
Increase Factor of Sales (Year on Year)
-6-
29,388
31,674 +3,451
+143 △31△1,277
FY2014-1Q FY2015-1Q
+2.28 Billions of Yen+7.8%
DAC
irep UNITEDElimination of
internal transactions and
others
(Millions of Yen)
©2015 D.A.Consortium All rights reserved
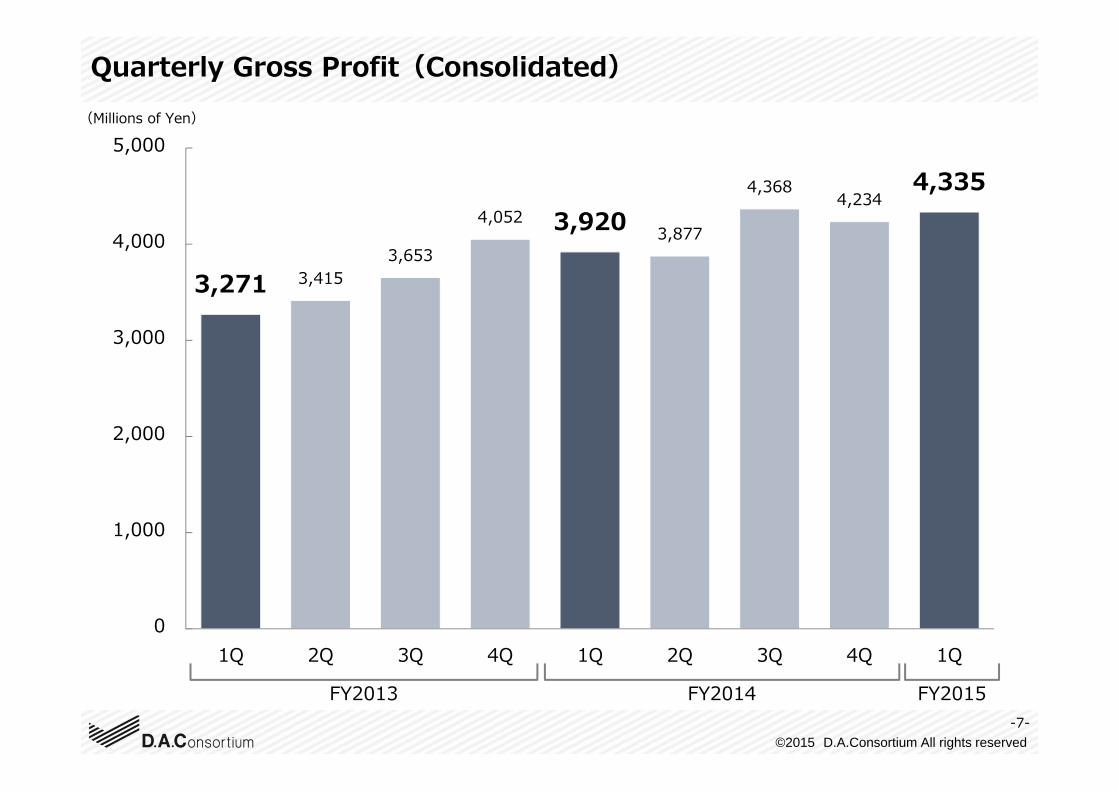
3,271 3,4153,653
4,052 3,920 3,877
4,3684,234
4,335
0
1,000
2,000
3,000
4,000
5,000
1Q 2Q 3Q 4Q 1Q 2Q 3Q 4Q 1Q
Quarterly Gross Profit(Consolidated)
-7-
FY2013 FY2014 FY2015
(Millions of Yen)
©2015 D.A.Consortium All rights reserved
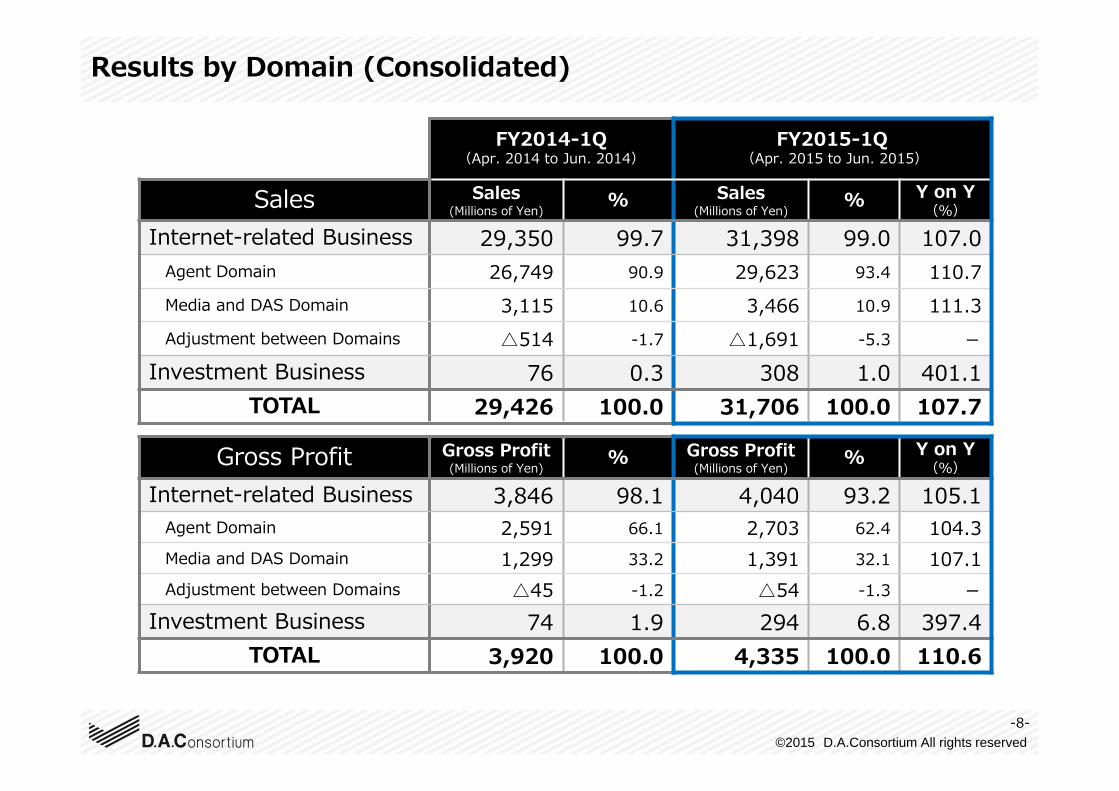
FY2014-1Q(Apr. 2014 to Jun. 2014)
FY2015-1Q(Apr. 2015 to Jun. 2015)
Sales Sales(Millions of Yen) % Sales
(Millions of Yen) % Y on Y(%)
Internet-related Business 29,350 99.7 31,398 99.0 107.0Agent Domain 26,749 90.9 29,623 93.4 110.7Media and DAS Domain 3,115 10.6 3,466 10.9 111.3Adjustment between Domains △514 -1.7 △1,691 -5.3 -
Investment Business 76 0.3 308 1.0 401.1TOTAL 29,426 100.0 31,706 100.0 107.7
Gross Profit Gross Profit(Millions of Yen) % Gross Profit
(Millions of Yen) % Y on Y(%)
Internet-related Business 3,846 98.1 4,040 93.2 105.1Agent Domain 2,591 66.1 2,703 62.4 104.3Media and DAS Domain 1,299 33.2 1,391 32.1 107.1Adjustment between Domains △45 -1.2 △54 -1.3 -
Investment Business 74 1.9 294 6.8 397.4TOTAL 3,920 100.0 4,335 100.0 110.6
Results by Domain (Consolidated)
-8-
©2015 D.A.Consortium All rights reserved
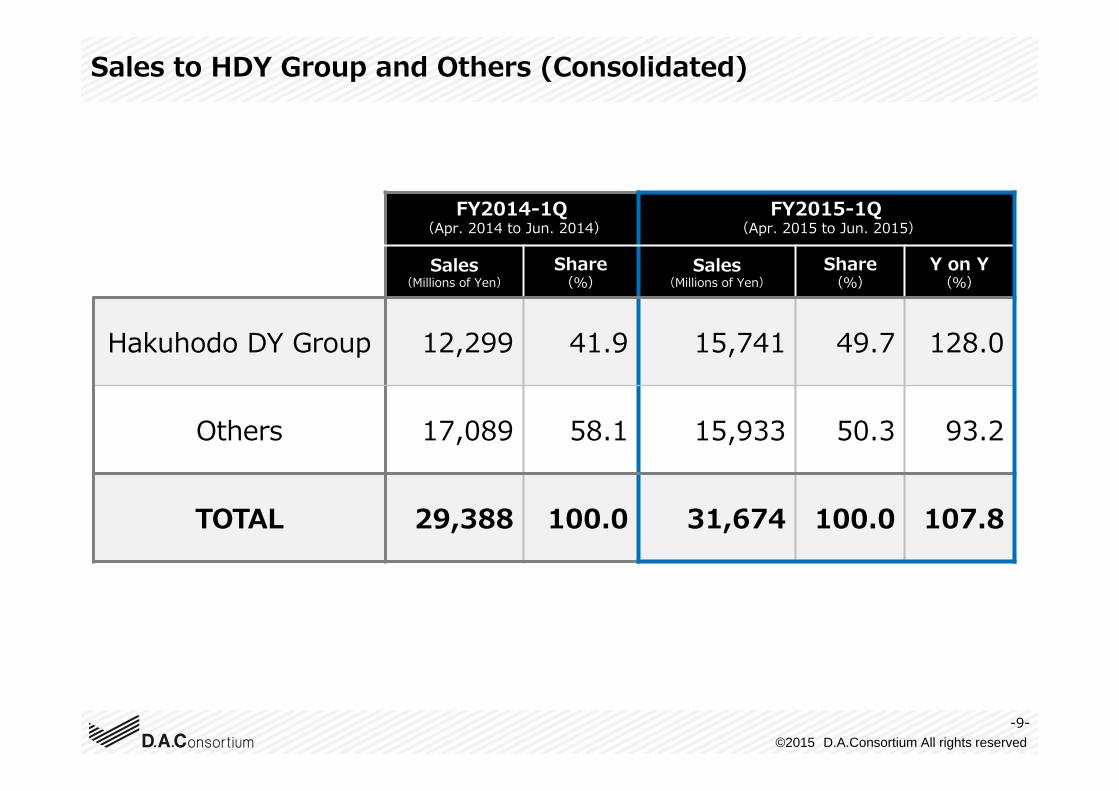
FY2014-1Q(Apr. 2014 to Jun. 2014)
FY2015-1Q(Apr. 2015 to Jun. 2015)
Sales(Millions of Yen)
Share(%)
Sales(Millions of Yen)
Share(%)
Y on Y(%)
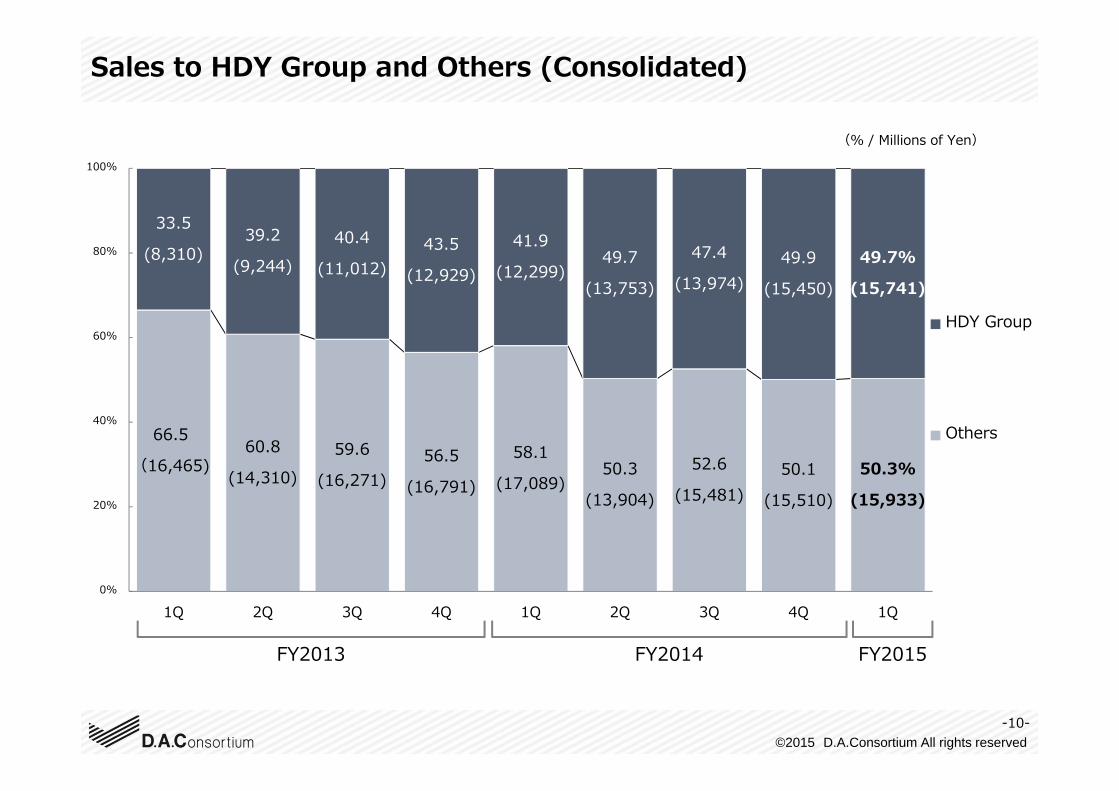
Hakuhodo DY Group 12,299 41.9 15,741 49.7 128.0
Others 17,089 58.1 15,933 50.3 93.2
TOTAL 29,388 100.0 31,674 100.0 107.8
Sales to HDY Group and Others (Consolidated)
-9-
©2015 D.A.Consortium All rights reserved
66.5
(16,465)60.8
(14,310) 59.6
(16,271) 56.5
(16,791)
58.1
(17,089) 50.3
(13,904)
52.6
(15,481) 50.1
(15,510)
50.3%
(15,933)
33.5
(8,310) 39.2
(9,244) 40.4
(11,012) 43.5
(12,929)
41.9
(12,299)49.7
(13,753)
47.4
(13,974) 49.9
(15,450)
49.7%
(15,741)
0%
20%
40%
60%
80%
100%
1Q 2Q 3Q 4Q 1Q 2Q 3Q 4Q 1Q
HDY Group
Others
(% / Millions of Yen)
Sales to HDY Group and Others (Consolidated)
-10-
FY2015FY2013 FY2014
©2015 D.A.Consortium All rights reserved
2,996 3,053 2,9963,365 3,310 3,389 3,552
3,901 3,651
12.1 13.0
11.0 11.3 11.3 12.3 12.1
12.6 11.5%
0
1,000
2,000
3,000
4,000
5,000
6,000
1Q 2Q 3Q 4Q 1Q 2Q 3Q 4Q 1Q
Personnel Others SG&A Expense Rate(Millions of Yen)
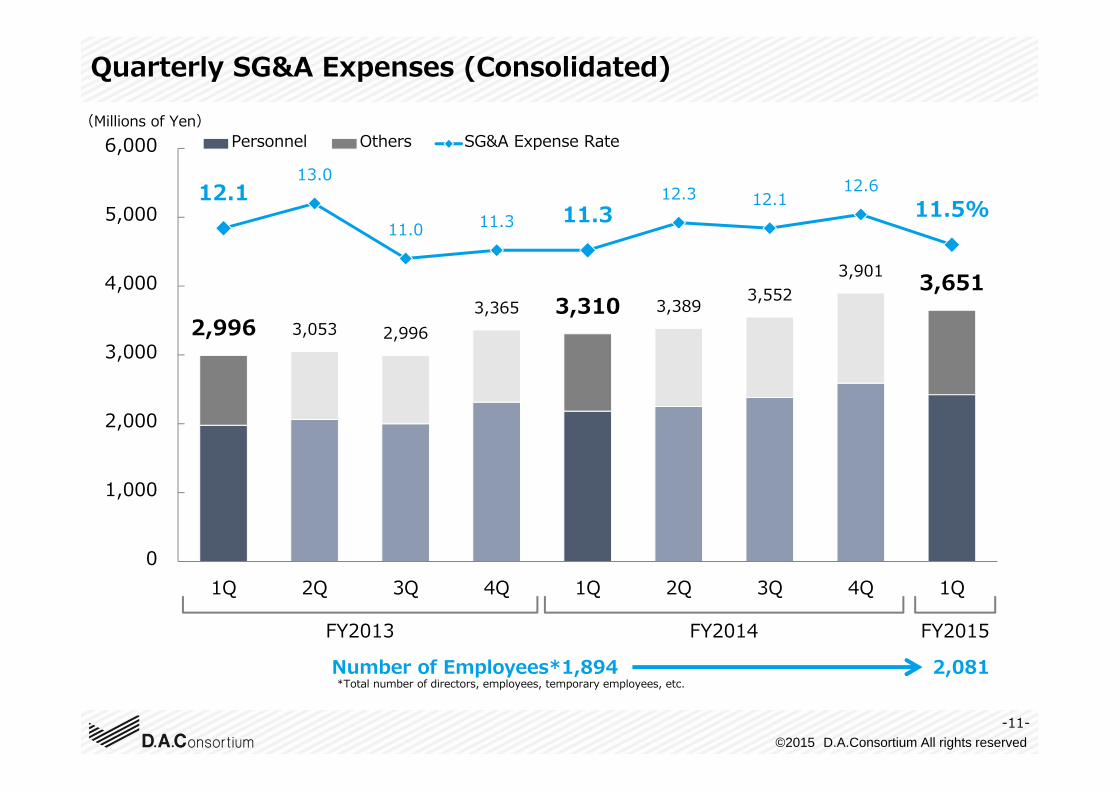
*Total number of directors, employees, temporary employees, etc.2,081Number of Employees*1,894
Quarterly SG&A Expenses (Consolidated)
-11-
FY2015FY2013 FY2014
©2015 D.A.Consortium All rights reserved
275 362
657 686 610
488
815
332
683 8.4
10.6
18.0 16.9 15.6
12.6
18.7
7.9
15.8%
0
500
1,000
1Q 2Q 3Q 4Q 1Q 2Q 3Q 4Q 1Q
Operating Income Operating Margin
(Millions of Yen)
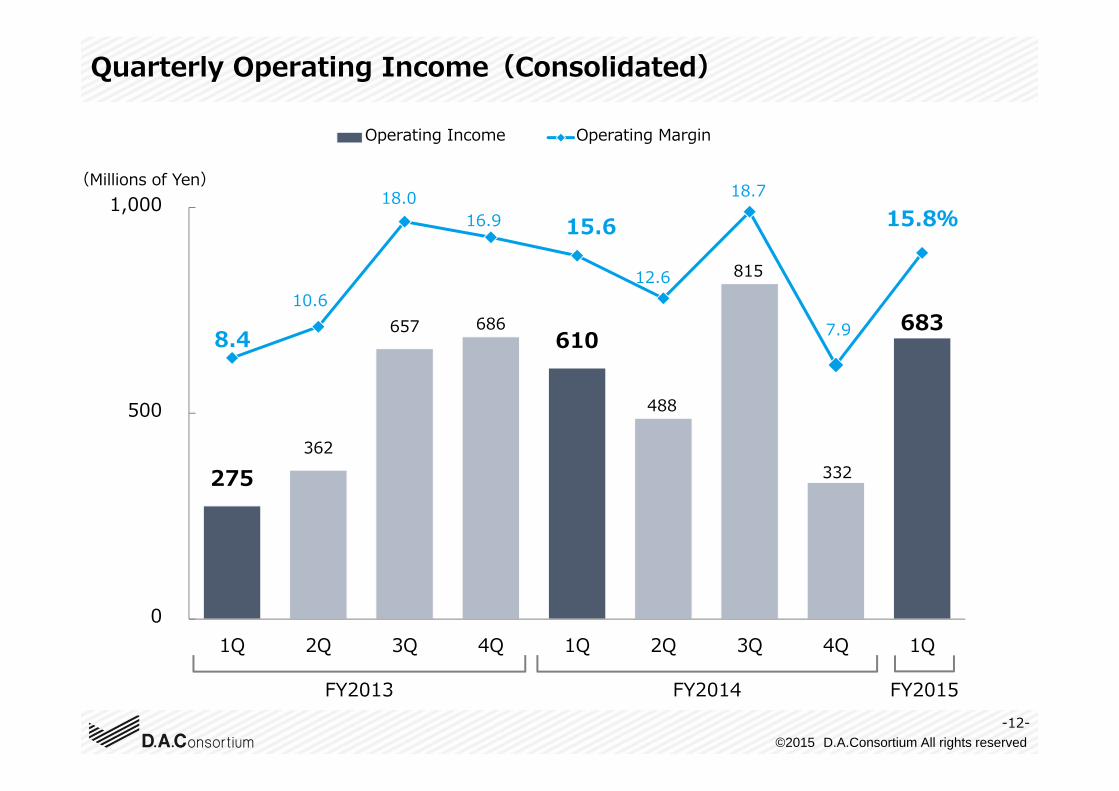
Quarterly Operating Income(Consolidated)
-12-
FY2015FY2013 FY2014
©2015 D.A.Consortium All rights reserved
466562
886 876803
694
1,033
556
891
0
200
400
600
800
1,000
1,200
1Q 2Q 3Q 4Q 1Q 2Q 3Q 4Q 1Q
(Millions of Yen)
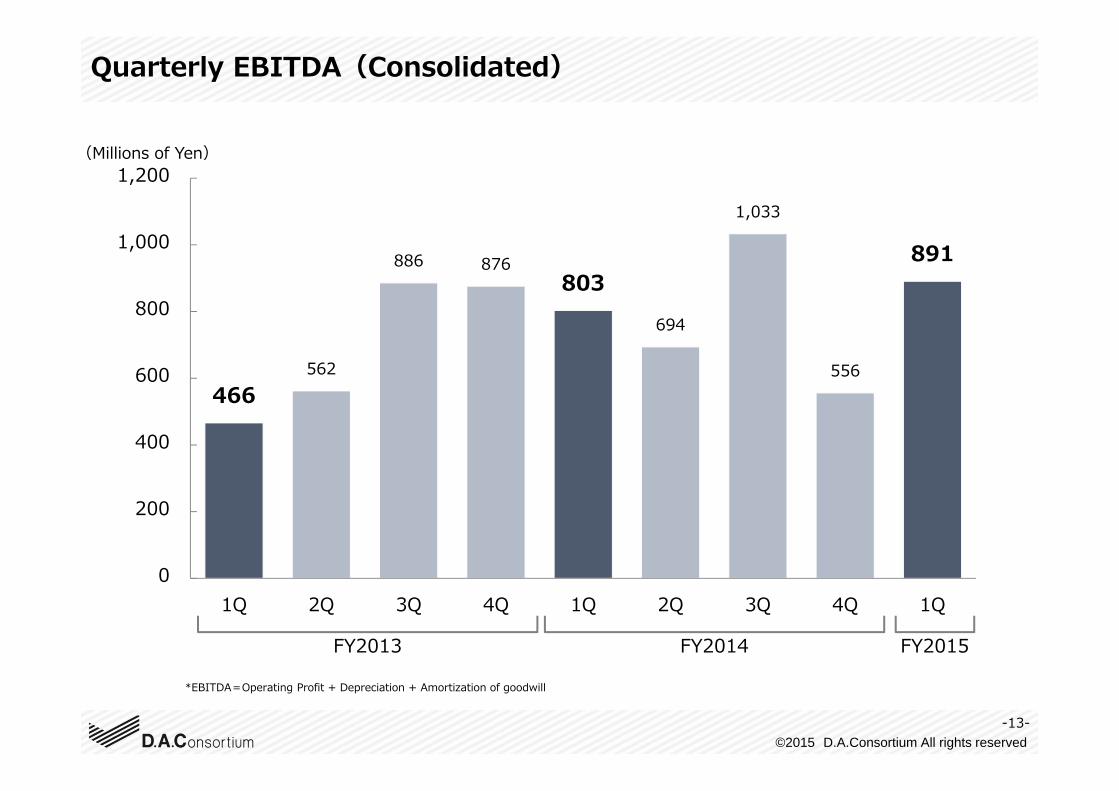
*EBITDA=Operating Profit + Depreciation + Amortization of goodwill
Quarterly EBITDA(Consolidated)
-13-
FY2015FY2013 FY2014
©2015 D.A.Consortium All rights reserved
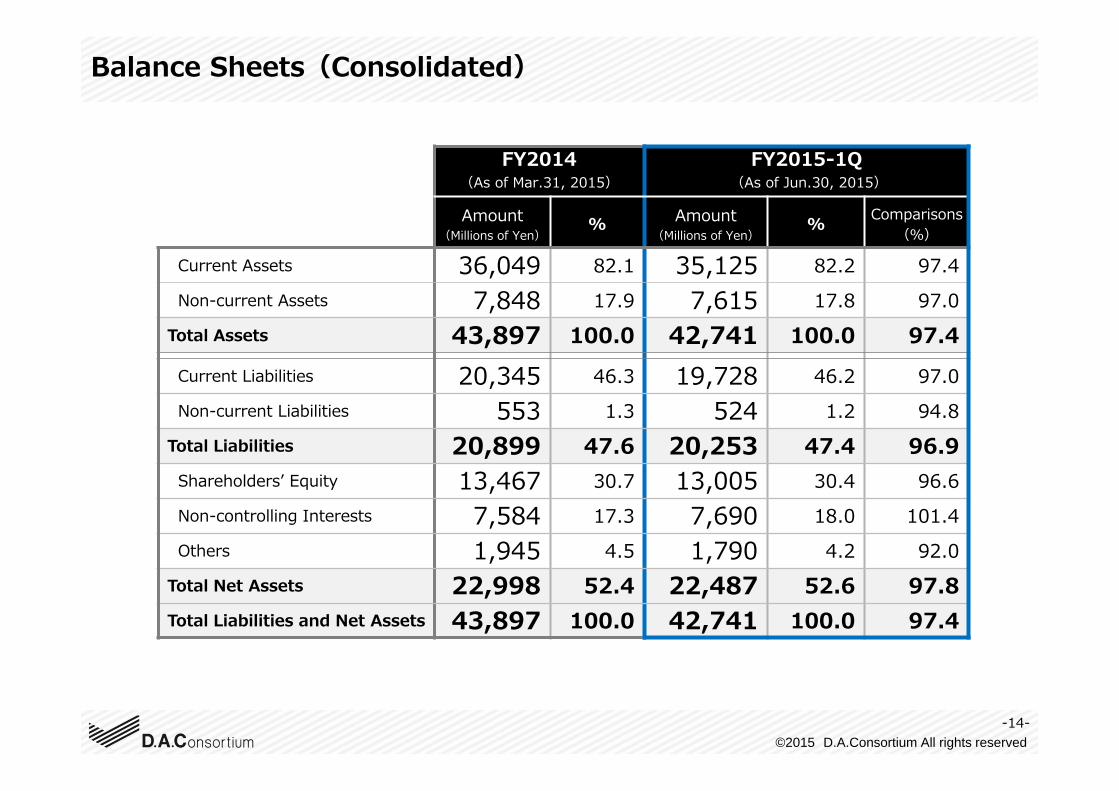
FY2014(As of Mar.31, 2015)
FY2015-1Q(As of Jun.30, 2015)
Amount(Millions of Yen)
% Amount(Millions of Yen)
% Comparisons(%)
Current Assets 36,049 82.1 35,125 82.2 97.4Non-current Assets 7,848 17.9 7,615 17.8 97.0
Total Assets 43,897 100.0 42,741 100.0 97.4Current Liabilities 20,345 46.3 19,728 46.2 97.0Non-current Liabilities 553 1.3 524 1.2 94.8
Total Liabilities 20,899 47.6 20,253 47.4 96.9Shareholdersʼ Equity 13,467 30.7 13,005 30.4 96.6Non-controlling Interests 7,584 17.3 7,690 18.0 101.4Others 1,945 4.5 1,790 4.2 92.0
Total Net Assets 22,998 52.4 22,487 52.6 97.8Total Liabilities and Net Assets 43,897 100.0 42,741 100.0 97.4
Balance Sheets(Consolidated)
-14-
©2015 D.A.Consortium All rights reserved
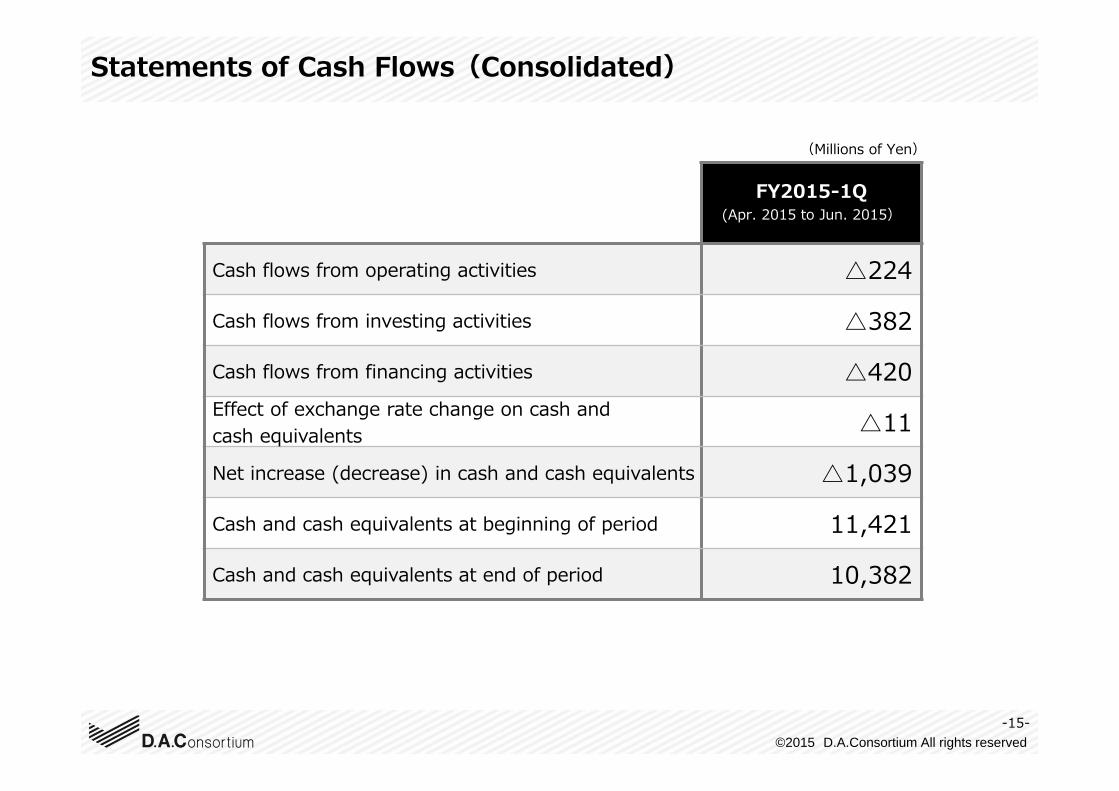
FY2015-1Q(Apr. 2015 to Jun. 2015)
Cash flows from operating activities △224
Cash flows from investing activities △382
Cash flows from financing activities △420Effect of exchange rate change on cash and cash equivalents △11
Net increase (decrease) in cash and cash equivalents △1,039
Cash and cash equivalents at beginning of period 11,421
Cash and cash equivalents at end of period 10,382
Statements of Cash Flows(Consolidated)
(Millions of Yen)
-15-
©2015 D.A.Consortium All rights reserved-16-
Overview of Non-consolidated Financial Results
©2015 D.A.Consortium All rights reserved
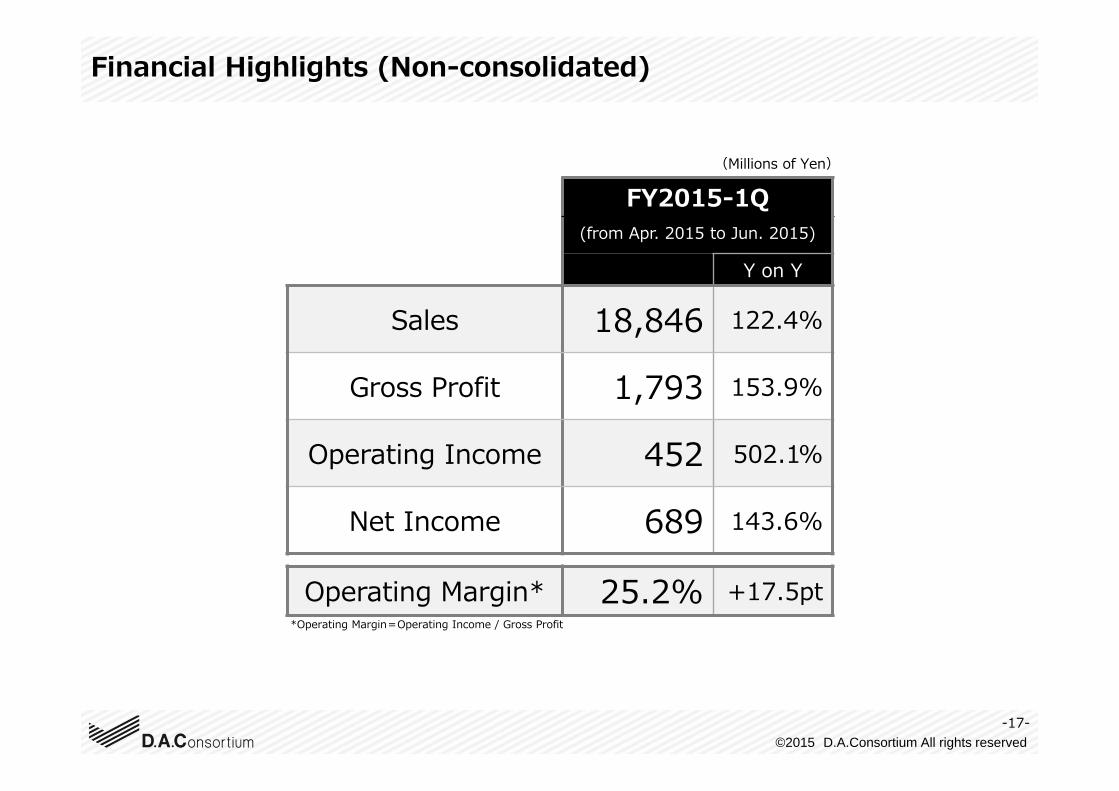
Financial Highlights (Non-consolidated)
(Millions of Yen)
-17-
FY2015-1Q(from Apr. 2015 to Jun. 2015)
Y on Y
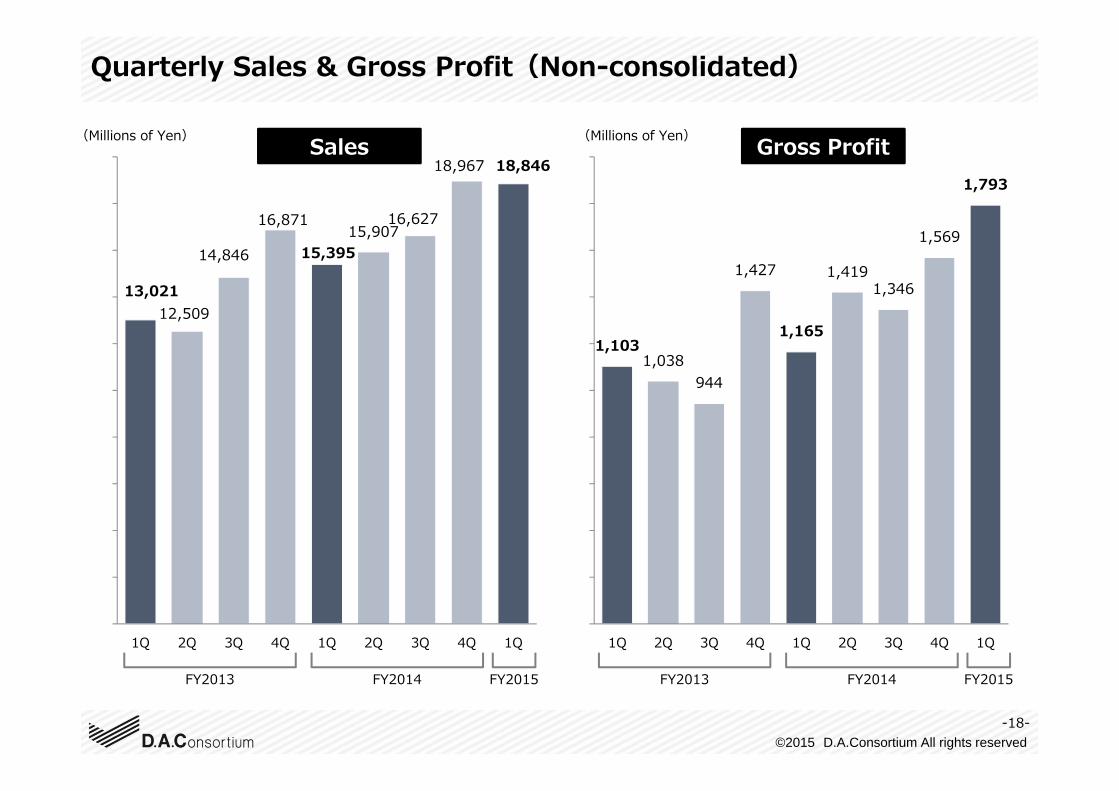
Sales 18,846 122.4%
Gross Profit 1,793 153.9%
Operating Income 452 502.1%
Net Income 689 143.6%
Operating Margin* 25.2% +17.5pt*Operating Margin=Operating Income / Gross Profit
©2015 D.A.Consortium All rights reserved
1,1031,038
944
1,427
1,165
1,4191,346
1,569
1,793
0
200
400
600
800
1,000
1,200
1,400
1,600
1,800
2,000
1Q 2Q 3Q 4Q 1Q 2Q 3Q 4Q 1Q
13,02112,509
14,846
16,871
15,39515,907
16,627
18,967 18,846
0
000
000
000
000
000
000
000
000
000
000
1Q 2Q 3Q 4Q 1Q 2Q 3Q 4Q 1Q
FY2015
(Millions of Yen) Sales Gross Profit
Quarterly Sales & Gross Profit(Non-consolidated)
-18-
FY2013 FY2014 FY2015FY2013 FY2014
(Millions of Yen)
©2015 D.A.Consortium All rights reserved
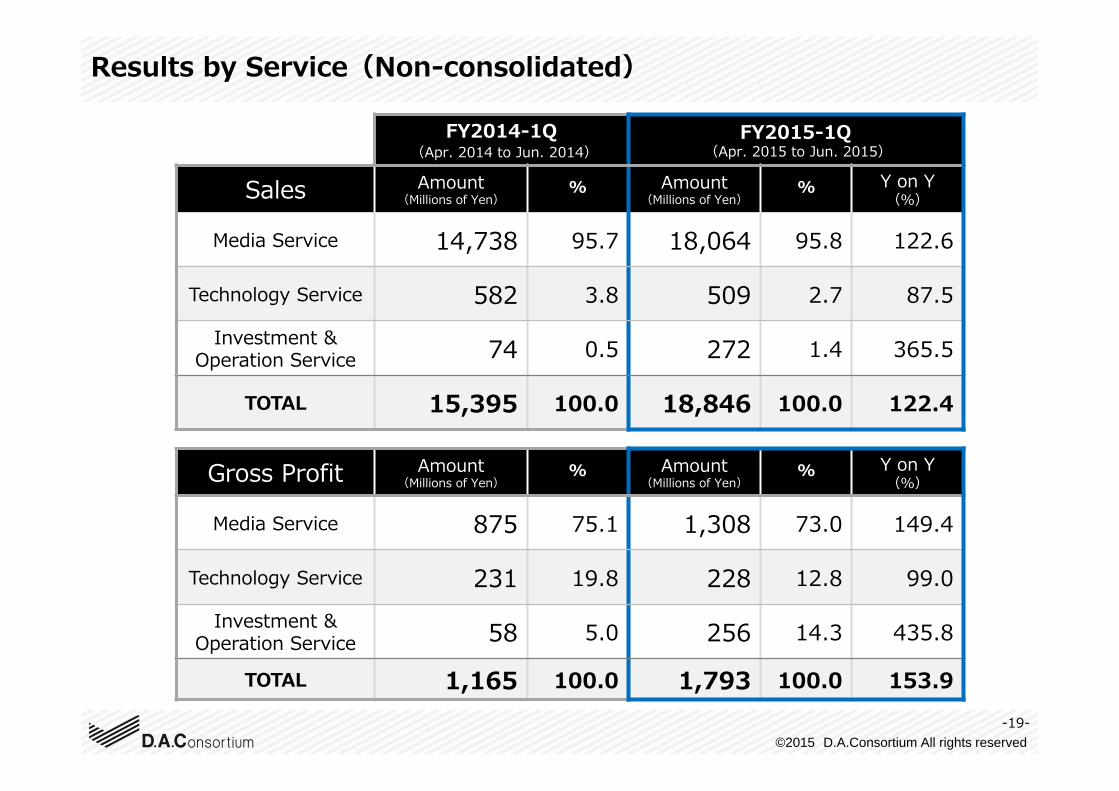
Results by Service(Non-consolidated)
FY2014-1Q(Apr. 2014 to Jun. 2014)
FY2015-1Q(Apr. 2015 to Jun. 2015)
Sales Amount(Millions of Yen)
% Amount(Millions of Yen)
% Y on Y(%)
Media Service 14,738 95.7 18,064 95.8 122.6
Technology Service 582 3.8 509 2.7 87.5
Investment &Operation Service 74 0.5 272 1.4 365.5
TOTAL 15,395 100.0 18,846 100.0 122.4
Gross Profit Amount(Millions of Yen)
% Amount(Millions of Yen)
% Y on Y(%)
Media Service 875 75.1 1,308 73.0 149.4
Technology Service 231 19.8 228 12.8 99.0
Investment &Operation Service 58 5.0 256 14.3 435.8
TOTAL 1,165 100.0 1,793 100.0 153.9-19-
©2015 D.A.Consortium All rights reserved
Business Trends
-20-
©2015 D.A.Consortium All rights reserved
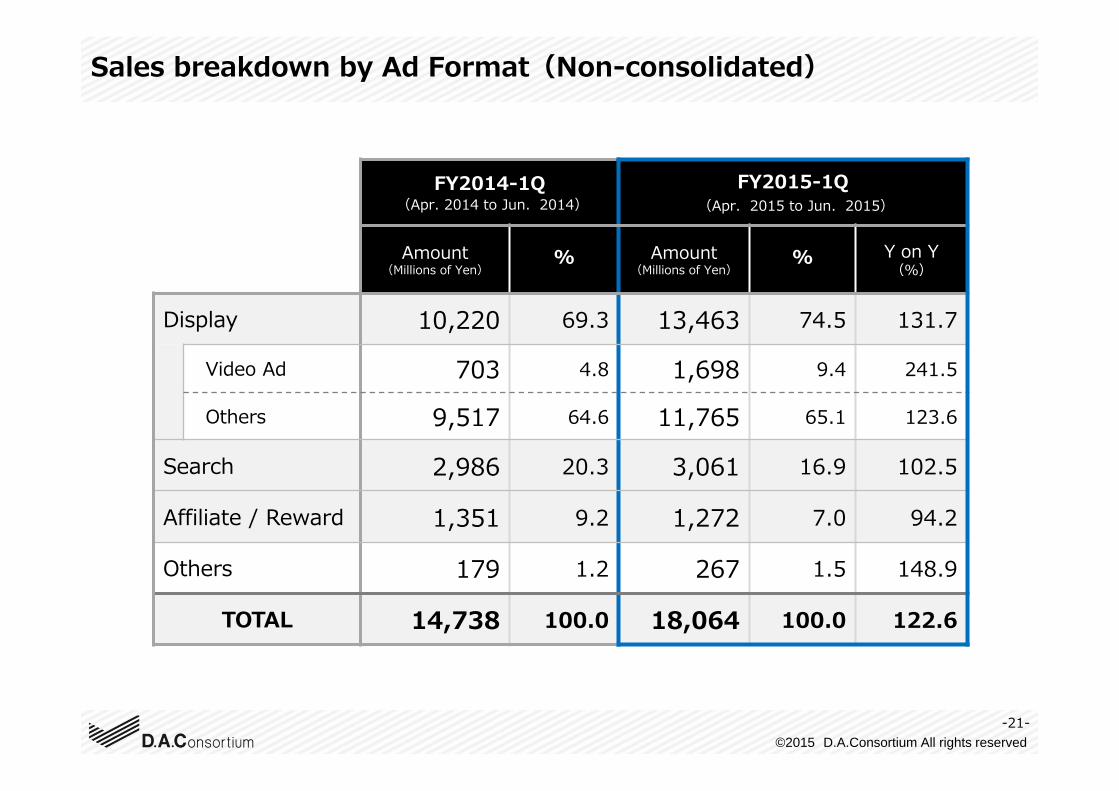
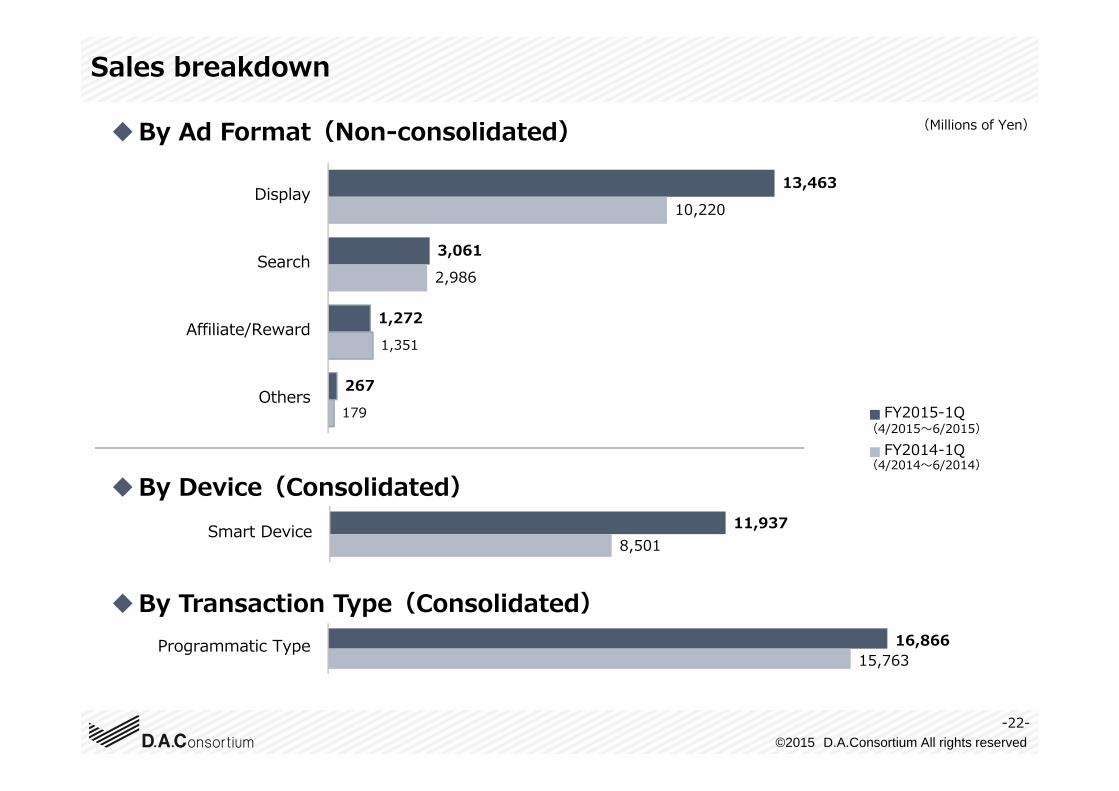
Sales breakdown by Ad Format(Non-consolidated)
FY2014-1Q(Apr. 2014 to Jun. 2014)
FY2015-1Q(Apr. 2015 to Jun. 2015)
Amount(Millions of Yen)
% Amount(Millions of Yen)
% Y on Y(%)
Display 10,220 69.3 13,463 74.5 131.7
Video Ad 703 4.8 1,698 9.4 241.5
Others 9,517 64.6 11,765 65.1 123.6
Search 2,986 20.3 3,061 16.9 102.5
Affiliate / Reward 1,351 9.2 1,272 7.0 94.2
Others 179 1.2 267 1.5 148.9
TOTAL 14,738 100.0 18,064 100.0 122.6
-21-
©2015 D.A.Consortium All rights reserved
13,463
3,061
1,272
267
10,220
2,986
1,351
179
Display
Search
Affiliate/Reward
OthersFY2015-1Q
FY2014-1Q
(Millions of Yen)
(4/2015〜6/2015)
(4/2014〜6/2014)
By Ad Format(Non-consolidated)
By Device(Consolidated)
16,866 15,763
Programmatic Type
-22-
By Transaction Type(Consolidated)
11,937 8,501
Smart Device
Sales breakdown
©2015 D.A.Consortium All rights reserved
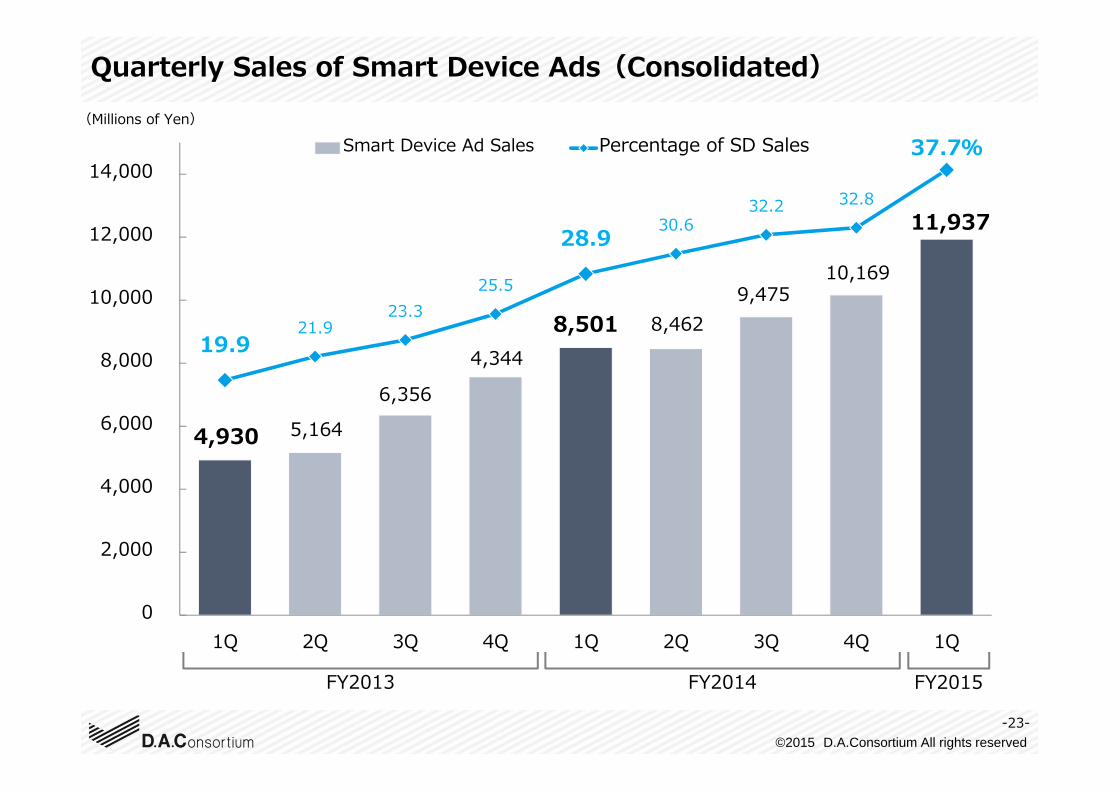
4,930 5,164
6,356
4,3448,501 8,462
9,475 10,169
11,937
19.921.9
23.325.5
28.9 30.632.2 32.8
37.7%
0
2,000
4,000
6,000
8,000
10,000
12,000
14,000
1Q 2Q 3Q 4Q 1Q 2Q 3Q 4Q 1Q
Smart Device Ad Sales Percentage of SD Sales
Quarterly Sales of Smart Device Ads(Consolidated)(Millions of Yen)
-23-
FY2015FY2013 FY2014
©2015 D.A.Consortium All rights reserved-24-
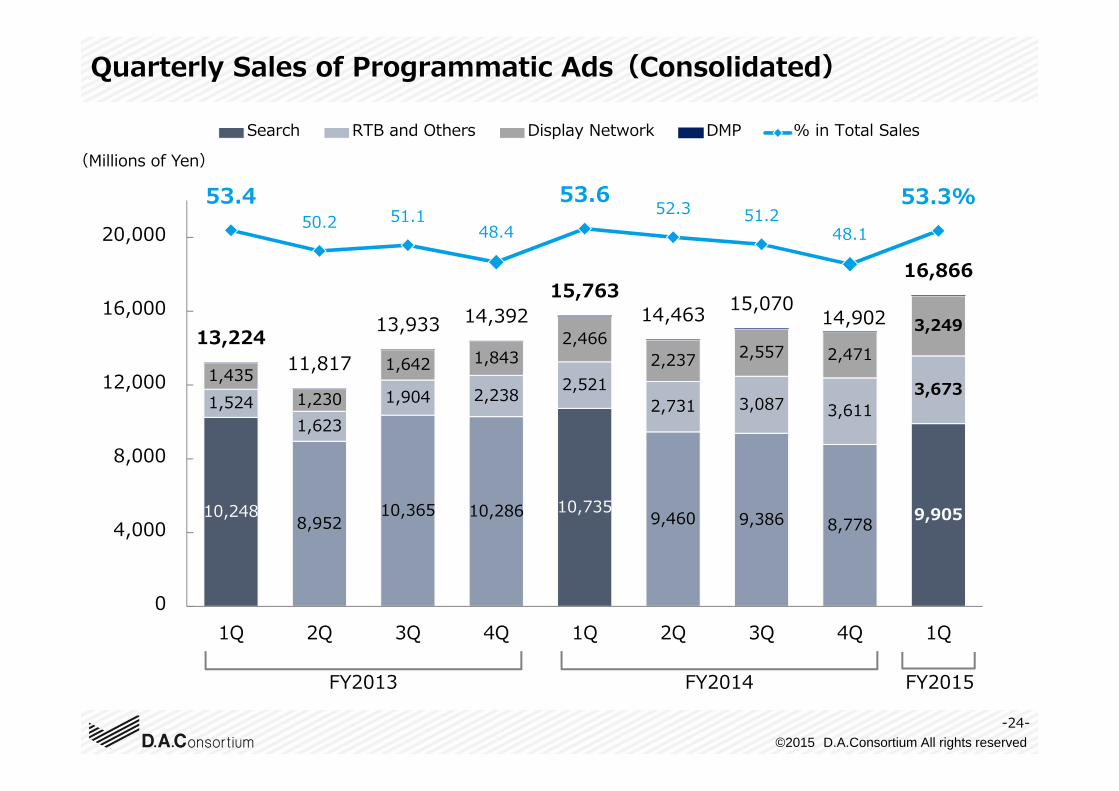
10,248 8,95210,365 10,286 10,735 9,460 9,386 8,778 9,905
1,524 1,623
1,904 2,238 2,521 2,731 3,087 3,611
3,673 1,435
1,230
1,642 1,843 2,466
2,237 2,557 2,471 3,249 13,224
11,817
13,933 14,39215,763
14,463 15,07014,902
16,866
53.4 50.2 51.1
48.4
53.6 52.3 51.2
48.1
53.3%
0
4,000
8,000
12,000
16,000
20,000
1Q 2Q 3Q 4Q 1Q 2Q 3Q 4Q 1Q
Search RTB and Others Display Network DMP % in Total Sales
(Millions of Yen)
FY2015FY2014FY2013
Quarterly Sales of Programmatic Ads(Consolidated)
©2015 D.A.Consortium All rights reserved-25-
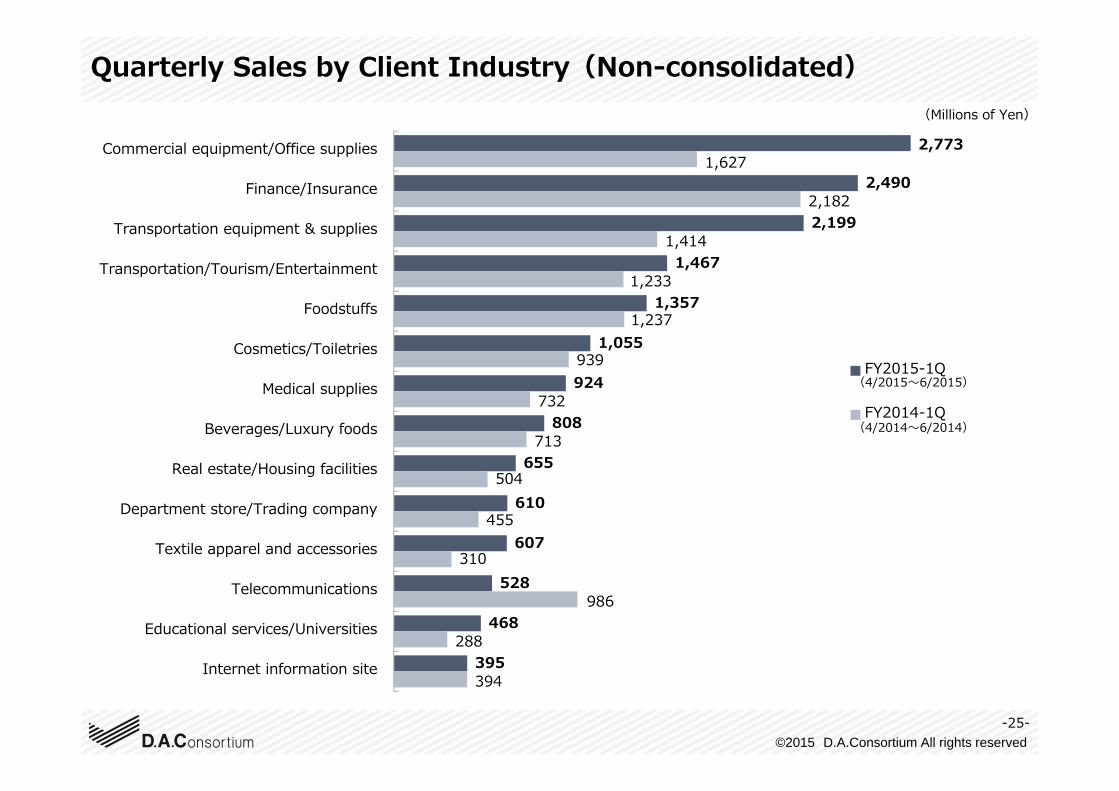
(Millions of Yen)
2,773
2,490
2,199
1,467
1,357
1,055
924
808
655
610
607
528
468
395
1,627
2,182
1,414
1,233
1,237
939
732
713
504
455
310
986
288
394
Commercial equipment/Office supplies
Finance/Insurance
Transportation equipment & supplies
Transportation/Tourism/Entertainment
Foodstuffs
Cosmetics/Toiletries
Medical supplies
Beverages/Luxury foods
Real estate/Housing facilities
Department store/Trading company
Textile apparel and accessories
Telecommunications
Educational services/Universities
Internet information site
FY2015-1Q
FY2014-1Q
(4/2015〜6/2015)
(4/2014〜6/2014)
Quarterly Sales by Client Industry(Non-consolidated)
©2015 D.A.Consortium All rights reserved
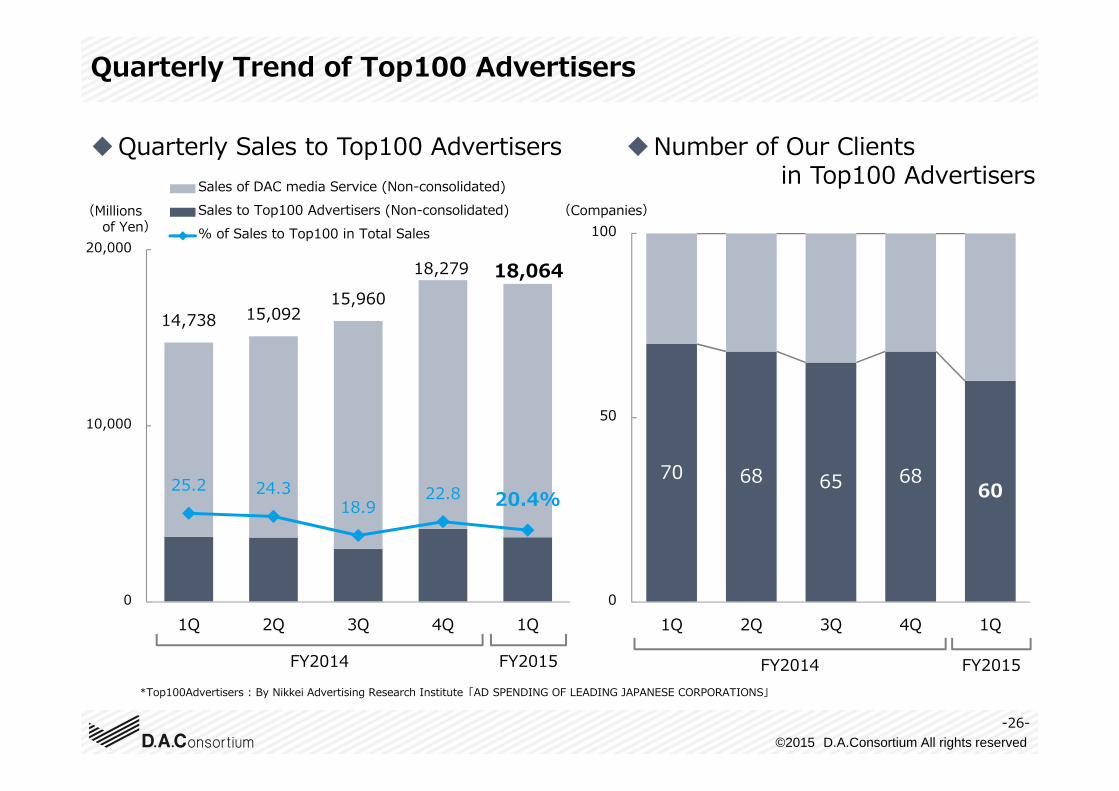
Quarterly Sales to Top100 Advertisers Number of Our Clientsin Top100 Advertisers
14,738 15,09215,960
18,279 18,064
25.2 24.3 18.9
22.8 20.4%
0
10,000
20,000
1Q 2Q 3Q 4Q 1Q
Sales of DAC media Service (Non-consolidated)Sales to Top100 Advertisers (Non-consolidated)% of Sales to Top100 in Total Sales
70 68 65 6860
0
50
100
1Q 2Q 3Q 4Q 1Q
*Top100Advertisers : By Nikkei Advertising Research Institute「AD SPENDING OF LEADING JAPANESE CORPORATIONS」
(Millions of Yen)
(Companies)
Quarterly Trend of Top100 Advertisers
FY2014
-26-
FY2015 FY2014 FY2015
©2015 D.A.Consortium All rights reserved
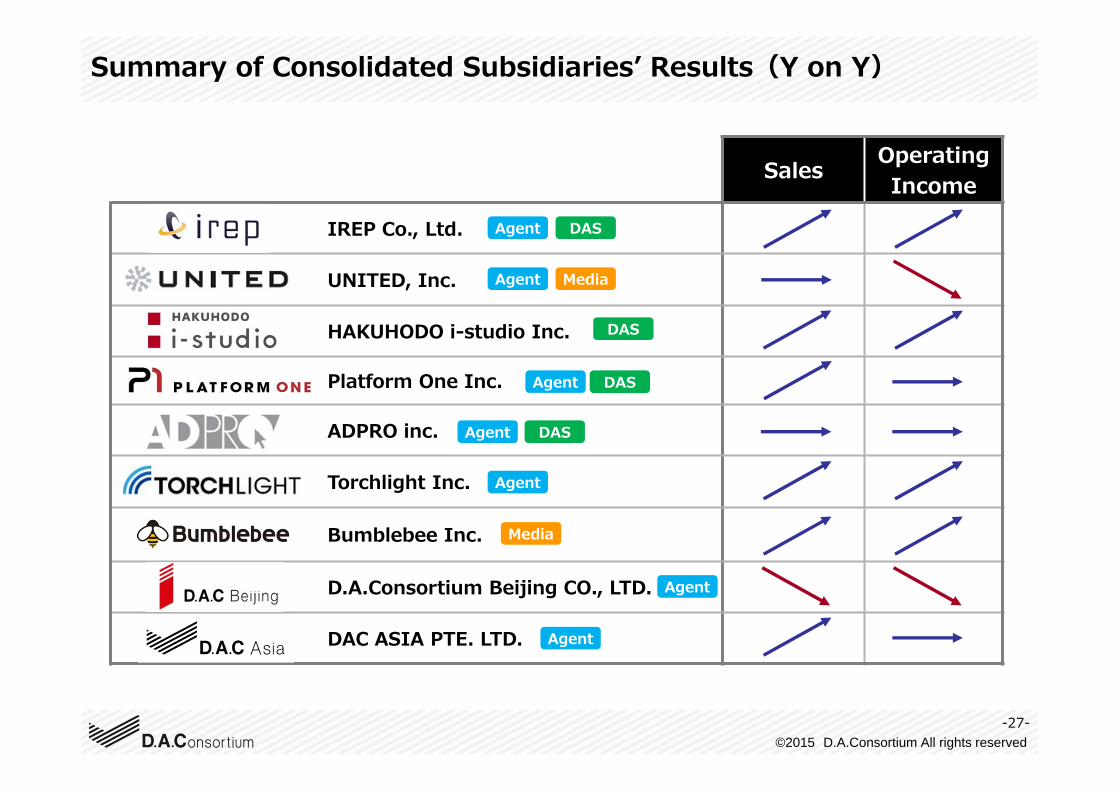
Sales OperatingIncome
IREP Co., Ltd.
UNITED, Inc.
HAKUHODO i-studio Inc.
Platform One Inc.
ADPRO inc.
Torchlight Inc.
Bumblebee Inc.
D.A.Consortium Beijing CO., LTD.
DAC ASIA PTE. LTD.
Summary of Consolidated Subsidiariesʼ Results(Y on Y)
Agent DAS
Media
Agent
Agent
Agent
Agent
Agent
Agent
DAS
Media
-27-
DAS
DAS
©2015 D.A.Consortium All rights reserved
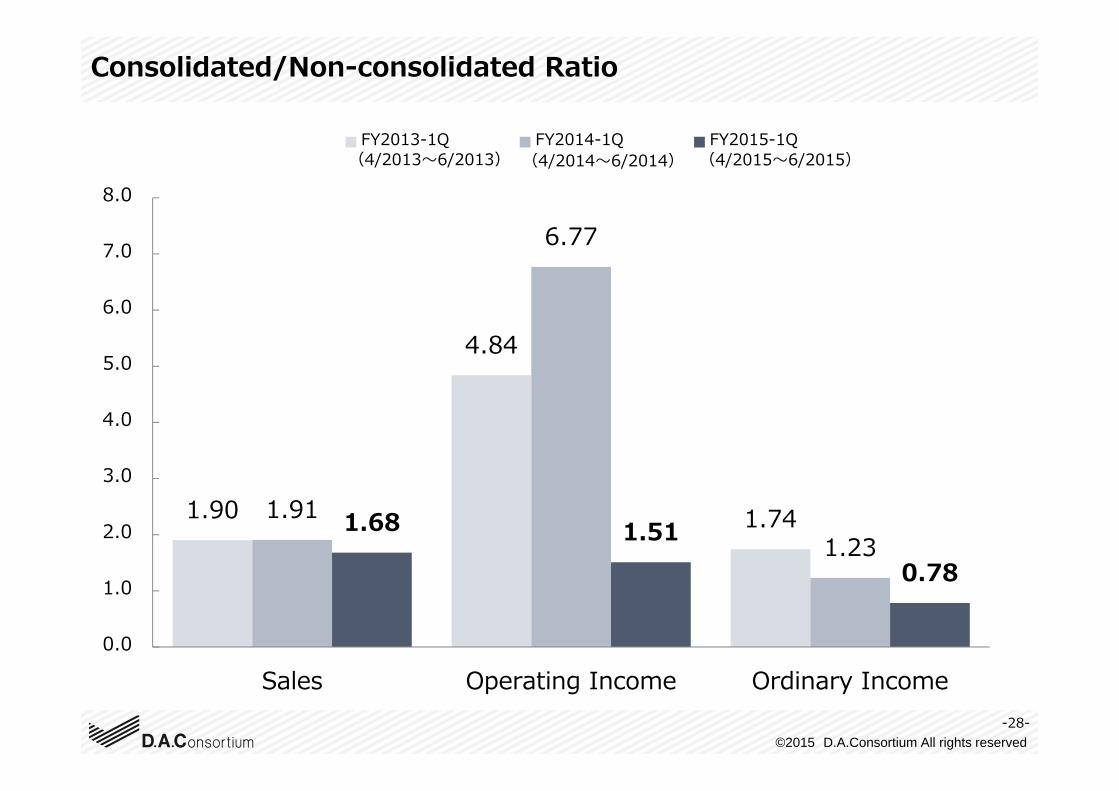
1.90
4.84
1.741.91
6.77
1.231.68 1.51
0.78
0.0
1.0
2.0
3.0
4.0
5.0
6.0
7.0
8.0
Sales Operating Income Ordinary Income
FY2013-1Q FY2014-1Q FY2015-1Q
Consolidated/Non-consolidated Ratio
(4/2014〜6/2014)(4/2013〜6/2013) (4/2015〜6/2015)
-28-
©2015 D.A.Consortium All rights reserved
Key Measures
-29-
©2015 D.A.Consortium All rights reserved
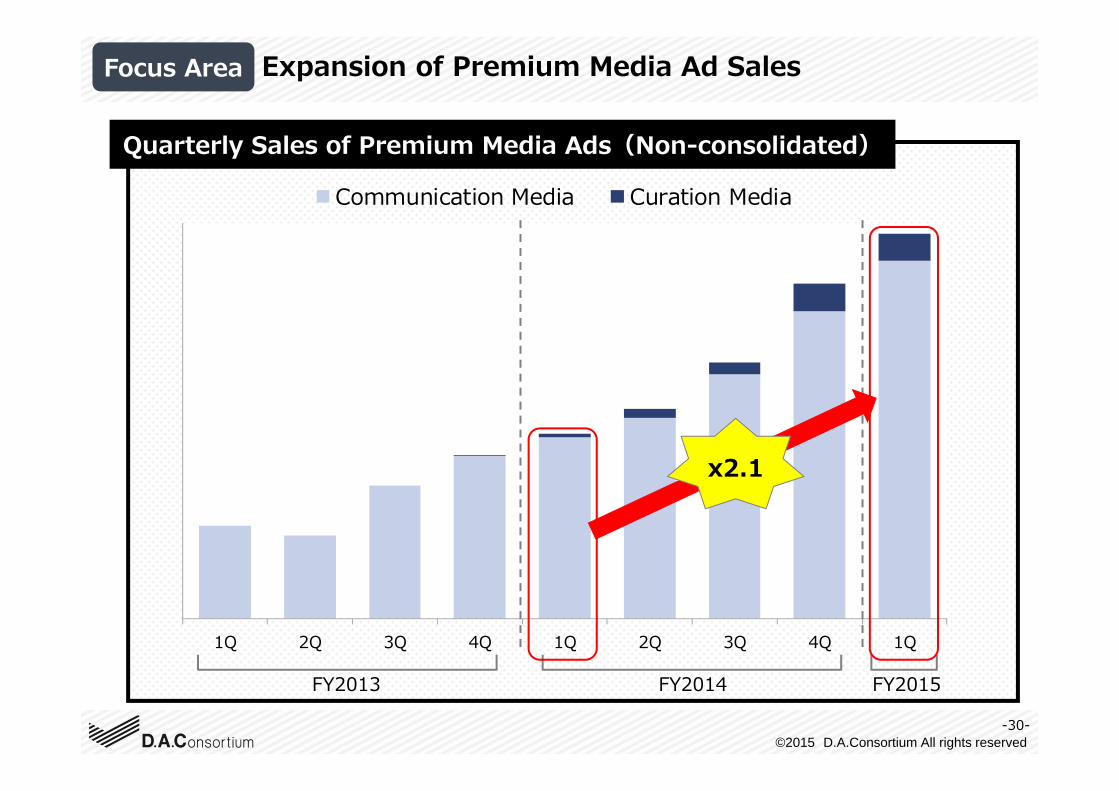
1Q 2Q 3Q 4Q 1Q 2Q 3Q 4Q 1Q
Communication Media Curation Media
-30-
FY2013 FY2014
Focus Area
FY2015
x2.1
Expansion of Premium Media Ad Sales
Quarterly Sales of Premium Media Ads(Non-consolidated)
©2015 D.A.Consortium All rights reserved-31-
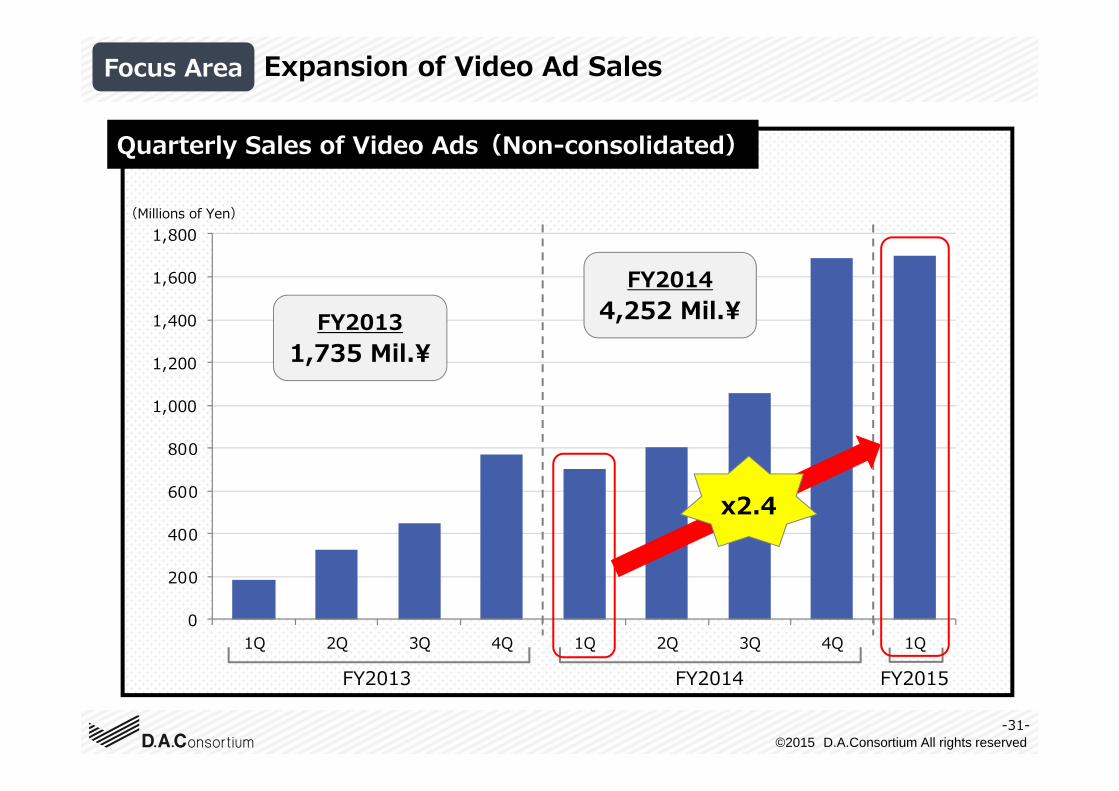
Expansion of Video Ad Sales
0
200
400
600
800
1,000
1,200
1,400
1,600
1,800
1Q 2Q 3Q 4Q 1Q 2Q 3Q 4Q 1Q
Quarterly Sales of Video Ads(Non-consolidated)
FY2013 FY2014 FY2015
x2.4
FY20131,735 Mil.¥
FY20144,252 Mil.¥
(Millions of Yen)
Focus Area
©2015 D.A.Consortium All rights reserved
Appendix
-32-
©2015 D.A.Consortium All rights reserved
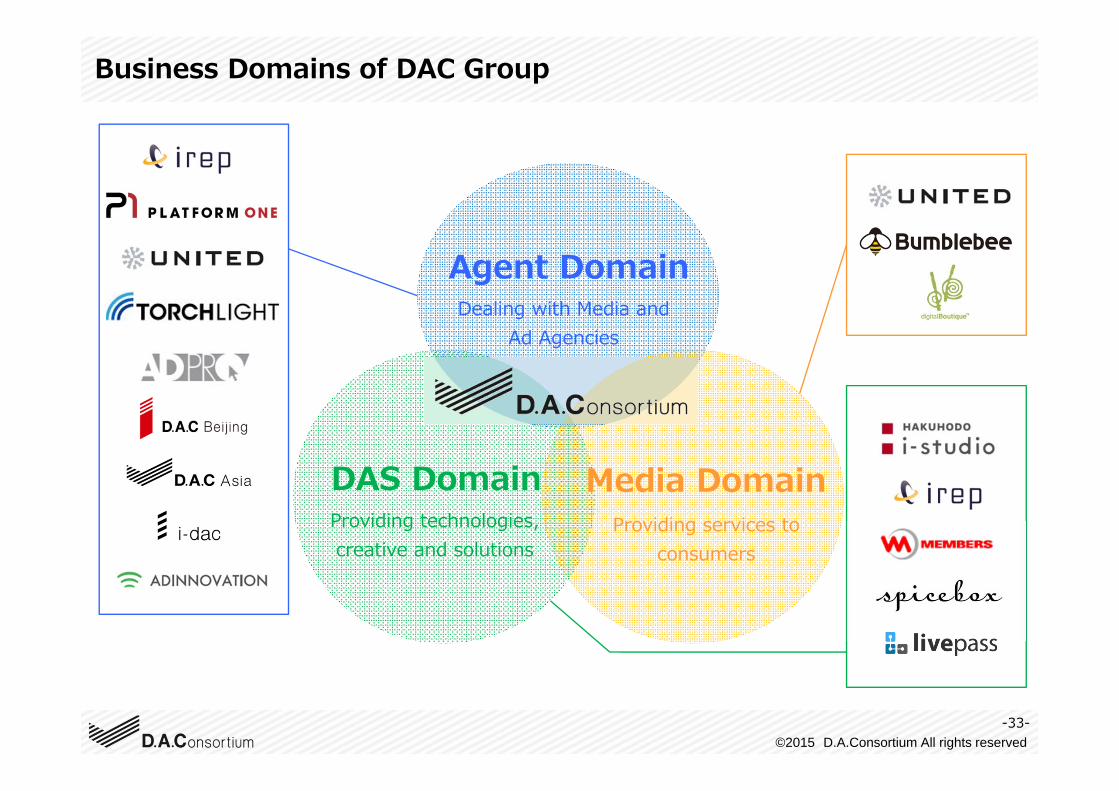
Business Domains of DAC Group
Agent Domain
DAS Domain Media DomainProviding services to
consumersProviding technologies, creative and solutions
-33-
Dealing with Media and Ad Agencies
©2015 D.A.Consortium All rights reserved
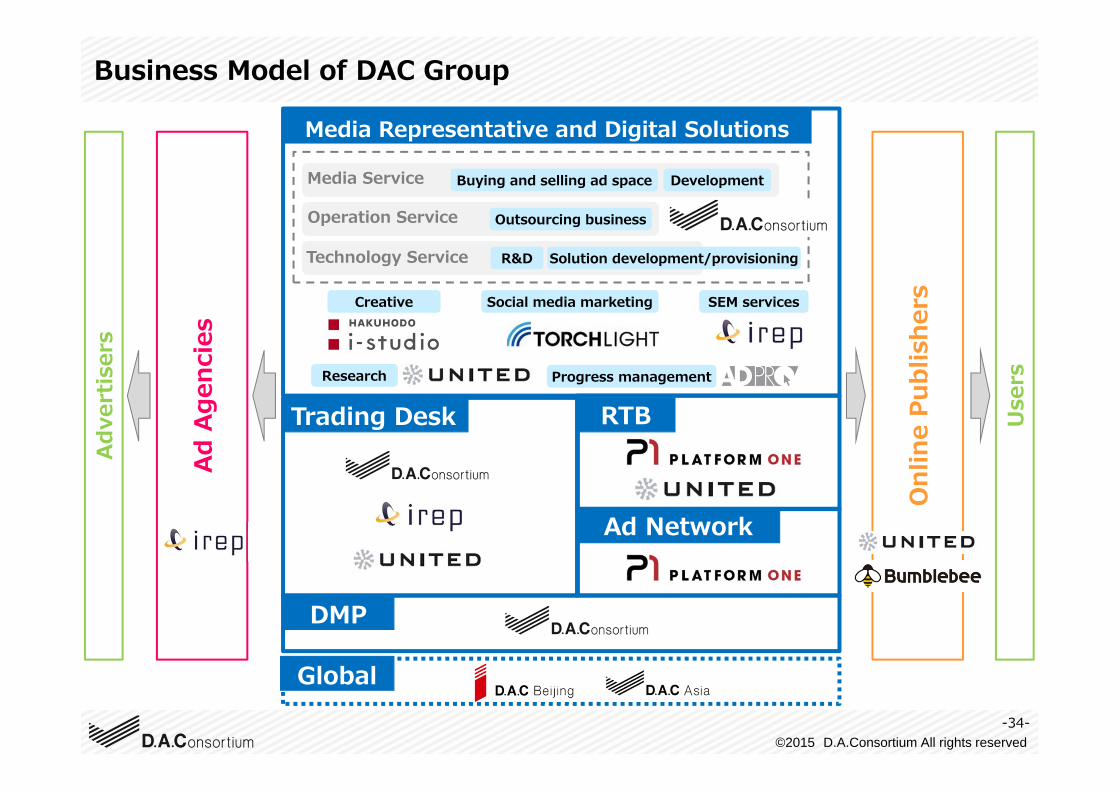
Business Model of DAC GroupAd
vert
iser
s
Use
rs
-34-
Media Representative and Digital Solutions
RTB
DMP
Ad Network
Global
SEM servicesCreative Social media marketing
Research
Media Service Buying and selling ad space Development
Operation Service Outsourcing business
Technology Service Solution development/provisioningR&D
Progress management
Trading Desk
Onl
ine
Publ
ishe
rs
Ad A
genc
ies
©2015 D.A.Consortium All rights reserved
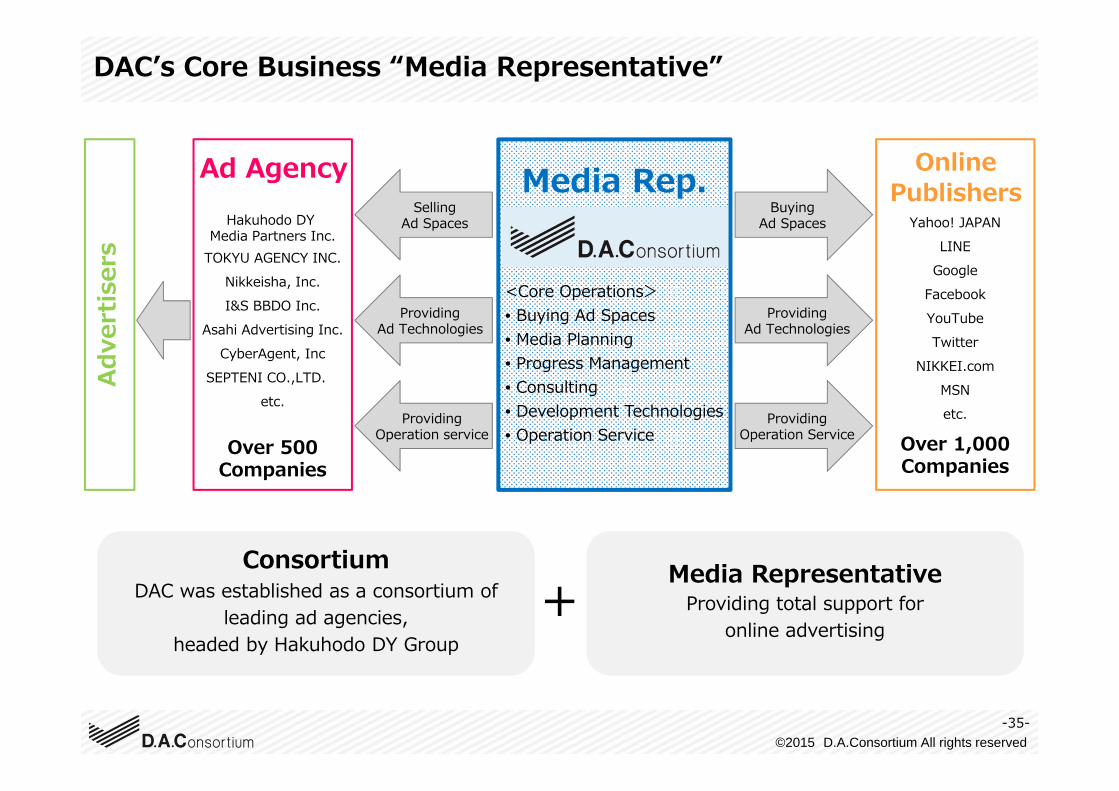
OnlinePublishers
ConsortiumDAC was established as a consortium of
leading ad agencies, headed by Hakuhodo DY Group
Media RepresentativeProviding total support for
online advertising
Adve
rtis
ers
<Core Operations>• Buying Ad Spaces• Media Planning• Progress Management• Consulting• Development Technologies• Operation Service
Media Rep.
DACʼs Core Business “Media Representative”
SellingAd Spaces
ProvidingAd Technologies
ProvidingOperation service
BuyingAd Spaces
ProvidingAd Technologies
ProvidingOperation Service
Ad AgencyHakuhodo DY
Media Partners Inc.TOKYU AGENCY INC.
Nikkeisha, Inc.I&S BBDO Inc.
Asahi Advertising Inc.CyberAgent, Inc
SEPTENI CO.,LTD.etc.
Over 500Companies
Over 1,000Companies
Yahoo! JAPANLINE
GoogleFacebookYouTubeTwitter
NIKKEI.comMSNetc.
-35-
+
©2015 D.A.Consortium All rights reserved
Adve
rtis
ers/
Ad A
genc
ies
Publ
ishe
rs
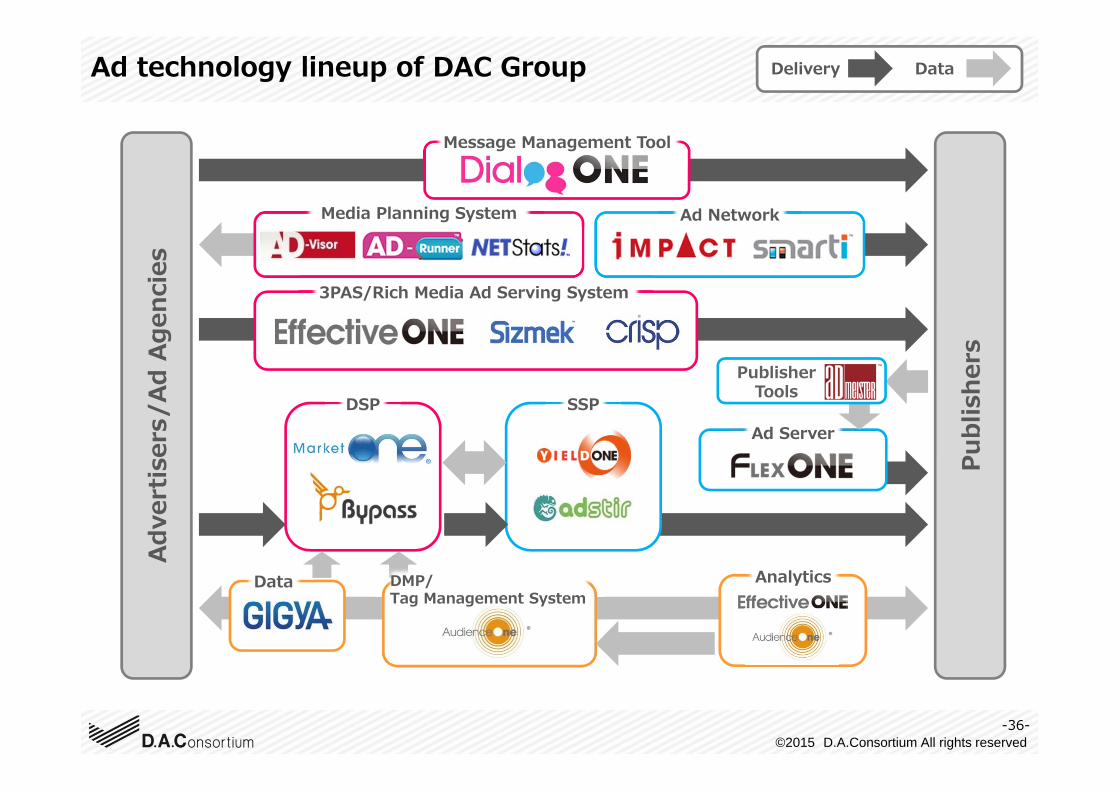
DSP
Analytics
Ad ServerSSP
Ad Network
3PAS/Rich Media Ad Serving System
Media Planning System
PublisherTools
Message Management Tool
Delivery Data
-36-
Ad technology lineup of DAC Group
Data DMP/Tag Management System
©2015 D.A.Consortium All rights reserved
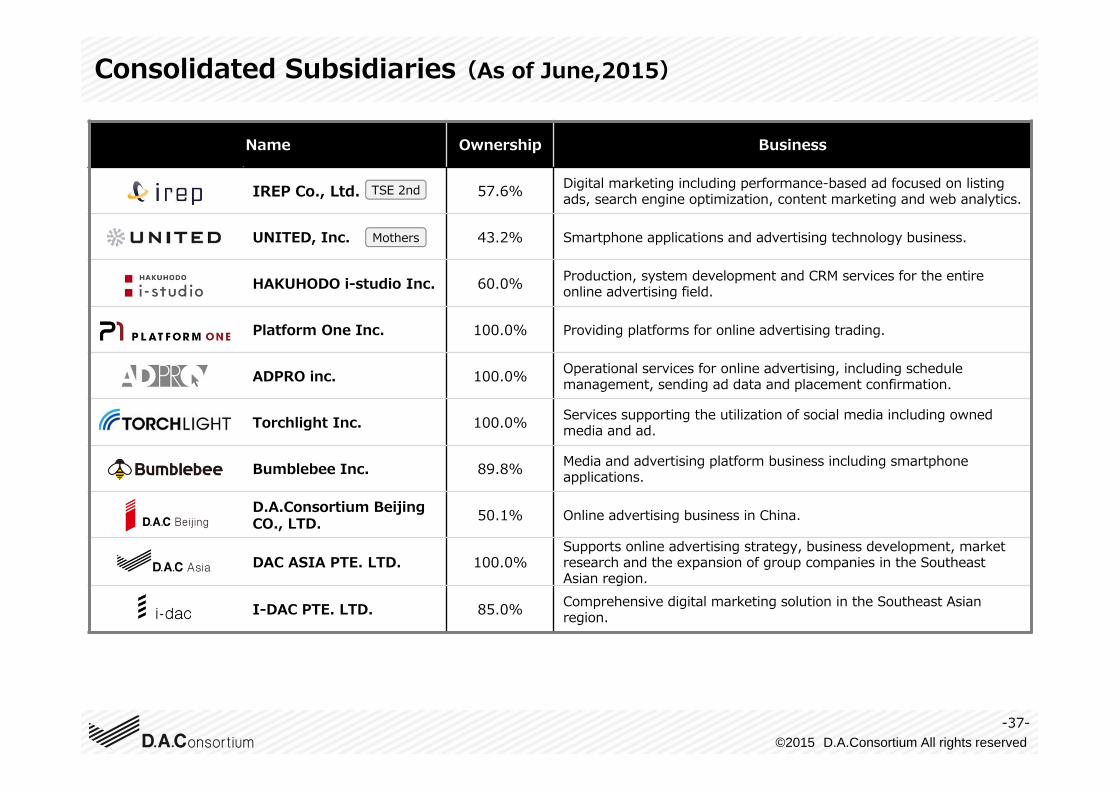
Name Ownership Business
IREP Co., Ltd. 57.6% Digital marketing including performance-based ad focused on listing ads, search engine optimization, content marketing and web analytics.
UNITED, Inc. 43.2% Smartphone applications and advertising technology business.
HAKUHODO i-studio Inc. 60.0% Production, system development and CRM services for the entire online advertising field.
Platform One Inc. 100.0% Providing platforms for online advertising trading.
ADPRO inc. 100.0% Operational services for online advertising, including schedule management, sending ad data and placement confirmation.
Torchlight Inc. 100.0% Services supporting the utilization of social media including owned media and ad.
Bumblebee Inc. 89.8% Media and advertising platform business including smartphone applications.
D.A.Consortium Beijing CO., LTD. 50.1% Online advertising business in China.
DAC ASIA PTE. LTD. 100.0%Supports online advertising strategy, business development, market research and the expansion of group companies in the Southeast Asian region.
I-DAC PTE. LTD. 85.0% Comprehensive digital marketing solution in the Southeast Asian region.
Consolidated Subsidiaries(As of June,2015)
TSE 2nd
Mothers
-37-
©2015 D.A.Consortium All rights reserved
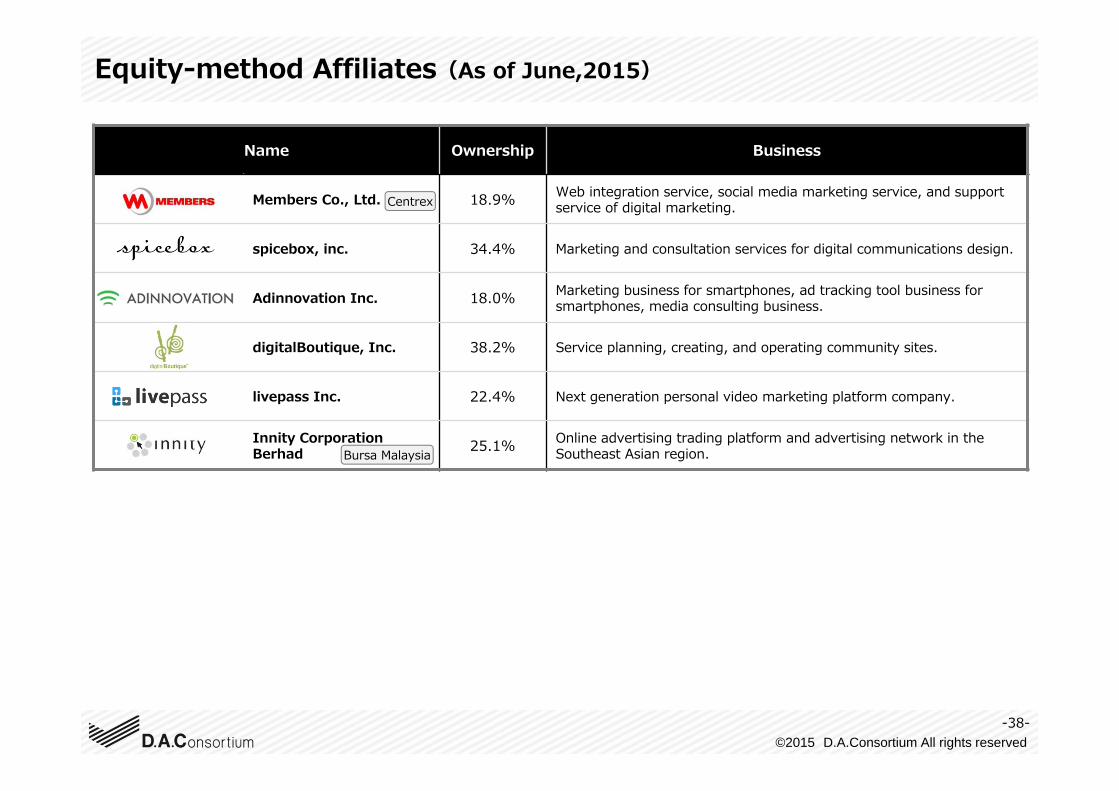
Name Ownership Business
Members Co., Ltd. 18.9% Web integration service, social media marketing service, and support service of digital marketing.
spicebox, inc. 34.4% Marketing and consultation services for digital communications design.
Adinnovation Inc. 18.0% Marketing business for smartphones, ad tracking tool business for smartphones, media consulting business.
digitalBoutique, Inc. 38.2% Service planning, creating, and operating community sites.
livepass Inc. 22.4% Next generation personal video marketing platform company.
Innity Corporation Berhad 25.1% Online advertising trading platform and advertising network in the
Southeast Asian region.
Equity-method Affiliates(As of June,2015)
Centrex
Bursa Malaysia
-38-
©2015 D.A.Consortium All rights reserved
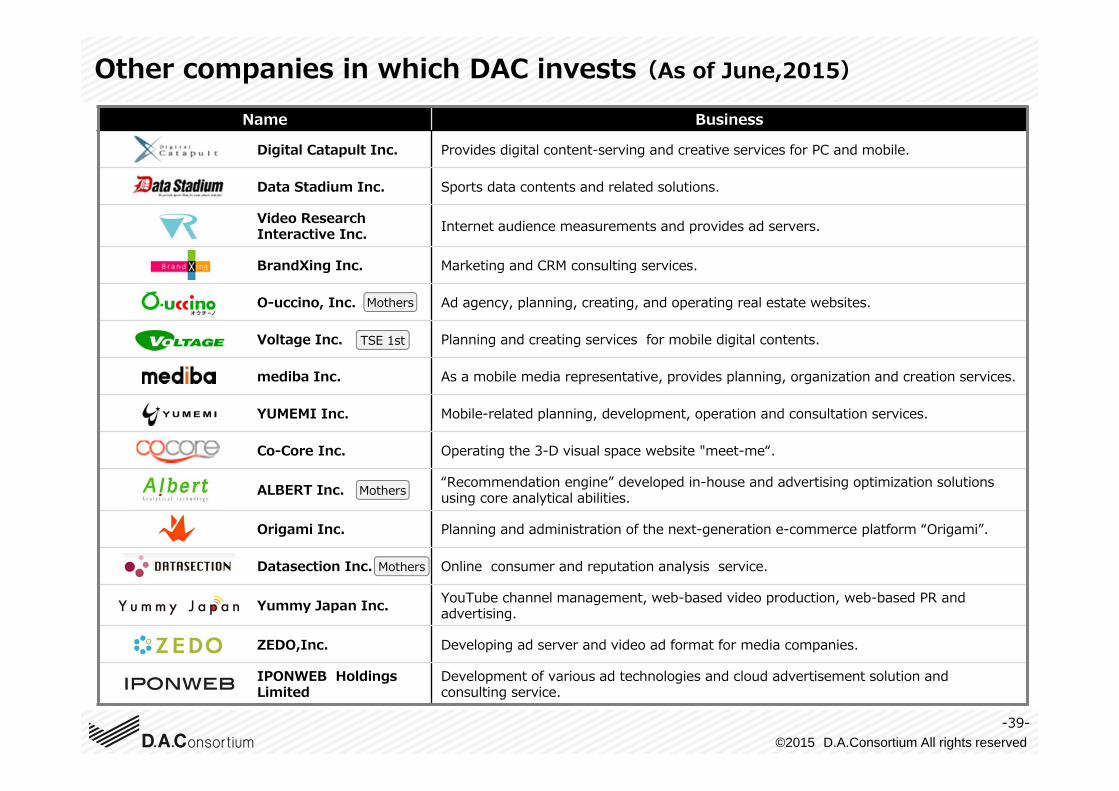
Name Business
Digital Catapult Inc. Provides digital content-serving and creative services for PC and mobile.
Data Stadium Inc. Sports data contents and related solutions.
Video Research Interactive Inc. Internet audience measurements and provides ad servers.
BrandXing Inc. Marketing and CRM consulting services.
O-uccino, Inc. Ad agency, planning, creating, and operating real estate websites.
Voltage Inc. Planning and creating services for mobile digital contents.
mediba Inc. As a mobile media representative, provides planning, organization and creation services.
YUMEMI Inc. Mobile-related planning, development, operation and consultation services.
Co-Core Inc. Operating the 3-D visual space website "meet-me“.
ALBERT Inc. “Recommendation engine” developed in-house and advertising optimization solutions using core analytical abilities.
Origami Inc. Planning and administration of the next-generation e-commerce platform “Origami”.
Datasection Inc. Online consumer and reputation analysis service.
Yummy Japan Inc. YouTube channel management, web-based video production, web-based PR and advertising.
ZEDO,Inc. Developing ad server and video ad format for media companies.
IPONWEB HoldingsLimited
Development of various ad technologies and cloud advertisement solution and consulting service.
Other companies in which DAC invests(As of June,2015)
TSE 1st
Mothers
-39-
Mothers
Mothers
©2015 D.A.Consortium All rights reserved
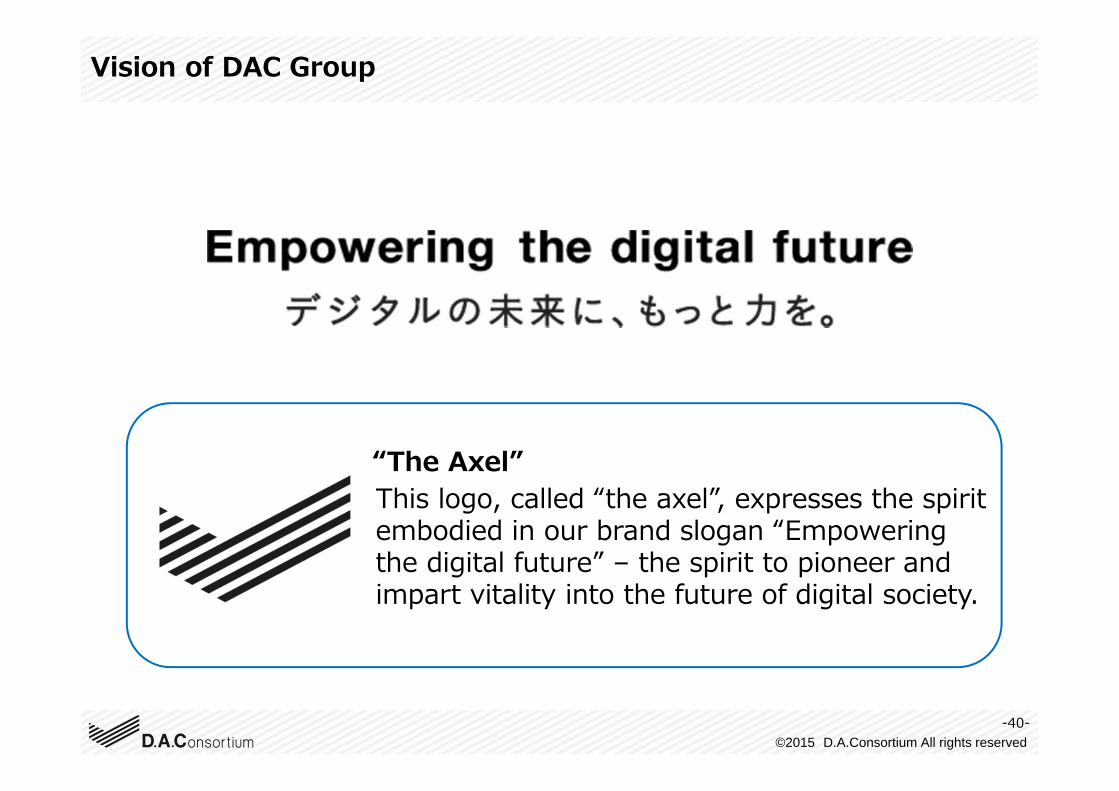
Vision of DAC Group
-40-
“The Axel”This logo, called “the axel”, expresses the spiritembodied in our brand slogan “Empowering the digital future” – the spirit to pioneer and impart vitality into the future of digital society.