Embed Size (px)
Citation preview
Childhood & Adolescent Nutrition
Accredited Continuing Professional Education Course
7950 Jones Branch Drive, 7th Floor, McLean, VA 221071-800-866-0919 • www.nutritiondimension.com
Qua
lity
ContinuingEducation
Since 1985
30years
Childhood &Adolescent Nutrition
8th edition • Revised March 2010by Kala Shipley, rd, ld

Childhood & Adolescent Nutrition
Editing/proofreading: Dale Ames Kline, Gwen HulbertDesign/Production: Knotwork Graphic Design & Typesetting
© 1989-2010 OnCourse Learning CorporationNo part of this course may be reproduced, duplicated or copied in any way without the written permission of
the copyright holder. (See note on Page ii)
7950 Jones Branch Drive, 7th Floor, McLean, VA 221041-800-866-0919 (US & Canada) • 1-847-839-1700 (overseas)
FAX:1-847-839-1711 • e-mail: [email protected]
Important - Read Before ProceedingEXPIRATION DATE: Students of all professions must submit this course for credit no later than December 31, 2015. Credit will not be awarded for this course after that date.
Course Code: RD69, CHES69, FIT69, AT69
This course approved for RD, DTR ................................8 CPEUCDM ................. 8 Clock HoursCHES ............................ 8 CECHACE ............................... 0.9 CEC NATABOC ....................7 CEU ABMP ...............................9 CEU NSCA-CC ...................0.9 CEU ACSM ............................. 9 CEU**equivalent to ACE CECs
Childhood &Adolescent Nutrition
8th Edition • Revised March 2010
By Kala Shipley, rd, ld Contains material written by Susan Magrann, MS, RD, and published in previous editions of this course.
About the author:Kala Shipley, rd, ld is a registered dietitian and has over 15 years of experience providing nutri-tion education to families of young children at WIC clinics and Head Start classrooms, as well as providing technical assistance as a community health consultant with the state WIC Program and the Iowa Nutrition Network. She has also provided program planning for communities in the areas of child welfare and early childhood health and education. Currently employed as the executive officer for the health promotion unit at the Iowa Department of Public Health, Kala serves as the education liaison to the Iowans Fit for Life program. Education: Dietetic Intern-ship, University of Iowa Hospitals and Clinics; BA University of Iowa.

Childhood & Adolescent Nutrition ii
How to Earn Continuing Education Credit
1. Read or watch the course material. Don’t forget to review the course objectives and take note of course tools available to you. The objectives provide specific learning goals and an overview of the course. Read the material in the order presented. If you need help with the material, please e-mail [email protected] with your specific question. We will forward your inquiry to the author, so allow adequate time for a reply.
2. CE credit will not be awarded for this course after December 31, 2015.
3. If you have an account on Nurse.com, TodayinPT.com, or TodayinOT.com, or NutritionDimension.com, please use that account username and password to sign in on ContinuingEduation.com. If you don’t already have one, please sign up for a user account. Click “sign up” or “login” in the upper right hand corner of any page on ContinuingEducation.com. If you have a CE Direct login ID and password (generally provided by your employer), please log in as you normally would at lms.nurse.com and search for this topic title.
4. Go to the “my courses” section of “my account.” Click on the title of the course you want to com-plete and then on “start course.”
5. Click “start test” to begin the exam. To earn contact hours, you must achieve a score of 75% on your multiple-choice exam for most courses. For webinar courses, you will need to achieve a score of 100%. You may retake the test as many times as necessary to pass. Clues are not provided on the exam. Certificates will be date/time stamped with the time and date of the day the user passes the test (Eastern Time, U.S.).
6. After successfully completing your exam click, “complete required survey.” In order to complete the test process and receive your certificate of completion, you must take a few moments to answer a brief survey about the course material.
7. After completing the survey, you will be taken to your transcript. Under Courses Completed, you can view, print, or e-mail your certificate.
8. Three months after you complete a course, you will receive an e-mail asking you to complete a follow-up survey. This is vital to our educational requirements so we can report our quality outcomes and effectiveness.
We report course completions to National Commission for Health Education Credentialing (NCHEC) quarterly and The Association of Nutrition & Foodservice (ANFP, formerly DMA) monthly. Other professions should follow their certifying organization’s reporting instructions. We keep a record of course completions for 7 years.
A Word About Copyrights: We encourage health professionals to use material from this course in their practice. Please follow these guidelines: (1) Credit the author, OnCourse Learning Corporation and any referenced source. (2) Course material may not be sold, published, or made part of any program for which a fee is charged, without written
permission from OnCourse Learning Corporation. (3) Inform OnCourse Learning Corporation by letter if you wish to make significant use of material from this course
(e.g. if you wish to duplicate Appendix pages for a training session or patient handout).
Childhood & Adolescent Nutrition iii
1 Introduction Nutrition Objectives for the Year 2010 Defining terms
7 Chapter One: Growth and Development Changes in weight, height, stature and body composition • Skeletal maturity
13 Chapter Two: Identifying Potential Problems Dietary assessment • Exercise: Determining BMI
19 Chapter Three: Nutritional Assessment Nutrients at risk • Social indicators
27 Chapter Four: Food Choices and Menu Planning The Food Guide Pyramid • Planning healthy meals What American children are eating • Vitamin and Mineral Supplements
39 Chapter Five: Eating Behaviors Creating a positive environment /Emotional and social factors Food "jags" • Adolescent food choices • Family meals
47 Chapter Six: Cholesterol and Children Measuring cholesterol • Lowering cholesterol • The population approach The individual approach • Genetic factors • Cholesterol testing Cholesterol-lowering medications
65 Chapter Seven: Obesity, Overweight and Eating Disorders Health risk • Health factors related to obesity • Obesity into adulthood Treating overweight children • Setting goals • Expert committee recommendations Eating disorders: anorexia, bulimia, binge eating disorder, "orthorexia"
87 Chapter Eight: Food Allergies and Sensitivities Defining and diagnosing food allergies • The allergic reaction Treatment • Prevention of food allergies
103 Chapter Nine: Hyperactivity The Feingold Diet • Biochemical and environmental factors Treatment • Sugar
111 Chapter Ten: Comprehensive School Nutrition Programs School food service programs • Other foods on campus School-based nutrition education
125 Chapter Eleven: Food Choices for Children TV and Food Choices • Dietary "bad guys" • Fast foods Fat, cholesterol and sugar traps • Healthier fast food selections
135 Chapter Twelve: Young Athletes and Nutrition Protein needs • Supplements and ergogenic aids • Weight gain and loss Pre-exercise meal • Fluids • Glycogen loading • Post-event meals
145 Chapter Thirteen: Dental Health Tooth development • Dental Caries Prevention • Fluoride
153 Appendices
175 Examination
Contents
• Growth Charts• Calcium Contents of Foods & Supplements• Triceps Skinfolds Percentiles• Obesity Treatment Guidelines• DRI and RDA for Children and Adolescents• Food Frequency Form
• Dietary Guidelines for Americans-2005• Vitamin & Mineral Supplements• Diagnostic Criteria for ADHD• Popular Selections at Fast Food Restaurants• Healthier Selections at Fast Food Restaurants

Childhood & Adolescent Nutrition
Learning Objectives
iv
Upon successful completion of the course, the student will be able to:
1. Describe the nutrition guidelines for healthy eating for children and adolescents and how growth and development are assessed.
2. Identify environmental, cultural, socio-economic and family influences for the prevention of childhood overweight.
3. Understand current legislation that influences the school meals program and how this program can improve the health and academic success of students.
4. State pros and cons of vitamin/mineral supplements for children and adolescents.
5. Define food allergies and discuss methods of diagnosing and treating.
6. State scientifically documented relationships between hyperactivity and food; psychoses/behav-ior and food; and performance/learning abilities and food.
7. State why nutritional counseling and intervention strategies should be targeted at the teen him/herself rather than the parents.
8. State three areas of concern regarding nutrition in adolescent athletes and state how to evaluate the diet for adequacy.
9. Describe the following nutrition-related problems and list how to treat or prevent: nutritional anemias, obesity, anorexia and bulimia.
10. State the nutrition problems related to fast food consumption and list three optimal meal choices to minimize these problems.
11. Describe food jags, at what ages they usually occur, and how parents can best handle them.
12. Describe the influence television has on children’s food choices and recommend two ways for parents to cope with it.
13. Discuss the ramifications of high serum cholesterol in children, including etiology of athero-sclerosis, risk assessment and measuring techniques, and treatment modalities.
14. Discuss how nutrition affects dental health.

Childhood & Adolescent Nutrition 1
This course is designed to increase knowledge, confidence and competence inhandling nutrition problems of children and teenagers. It provides tools to identifynutrition problems and how to handle them, such as height and weight charts, andguidelines for types and amounts of food necessary for health and growth.
Most importantly, this course is designed to give practitioners a sense of inspira-tion about the teenagers and children with whom they work in the area of nutrition.Practitioners working with children and adolescents face some big challenges — theintention of this course is to help you feel that you can make a difference.
The US Department of Health and Human Services (DHHS) has defined severalobjectives related to nutrition in children and adolescents (Healthy People 2020, 1990;Splett and Story, 1991). In 1990, DHHS released Healthy People 2000 which listed healthobjectives for Americans. In 2000, these objectives were revised and released as HealthyPeople 2010, most recently revised to Healthy People 2020. It is critical that health careprofessionals, parents, teachers and all school personnel are committed to accomplish-ing the nutrition and overweight objectives listed in Healthy People 2020.
The nutrition and physical activity objectives related to children and adolescentsare:
Nutrition:• NWS-1: Increase the number of States with nutrition standards for foods and
beverages provided to preschool-aged children in child care.• NWS-2: Increase the proportion of schools that offer nutritious foods and bever-
ages outside of school meals.• NWS-5: Increase the proportion of primary care physicians who regularly mea-
sure the body mass index (BMI) in the patients.• NWS-10: Reduce the proportion of children and adolescents considered obese.
Introduction

Childhood & Adolescent Nutrition 2
• NWS-11: Prevent inappropriate weight gain in youth and adults.• NWS-12: Eliminate very low food security among children.• NWS-14: Increase the proportion of fruit in the diets of the population aged 2
years and older.• NWS-15: Increase the contribution of total vegetables to the diets of population
aged 2 years and older.• NWS-16: Increase the contribution of whole grains to the diets of population
aged 2 years and older.• NWS-17: Reduce the consumption of calories from solids fats and added sugars
in the population aged 2 years and older.• NWS-18: Reduce the consumption of saturated fat in the population aged 2 years
and older.• NWS-19: Reduce the consumption of sodium in the population aged 2 years and
older.• NWS-20: Increase consumption of calcium in the population aged 2 years and
older.• NWS-21: Reduce iron deficiency among young children and females of child-
bearing age.
Physical Activity:• PA-3: Increase the proportion of adolescents who meet current Federal physical
activity guidelines for aerobic activity and for muscle-strengthening activity.• PA-4: Increase the proportion of the Nation's public and private schools that
require daily physical education for all students.• PA-5: Increase the proportion of adolescents who participate in daily school
physical education.• PA-6: Increase regularly scheduled elementary school recess in the US.• PA-7: Increase the proportion of school districts that require or recommend
elementary school recess for an appropriate period of time.• PA-8: Increase the proportion of children and adolescents who do not exceed
recommended limits for screen time.• PA-9: Increase the number of States with licencing regulations for physical
activity provided in child care.• PA-10: Increase the proportion of the Nation's public and private schools that
provide access to their physical activity spaces and facilities for all periodsoutside of normal school hours (that is, before and after the school day, onweekends, and during summer and other vacation.).
• PA-13: Increase the proportion of trips made by walking.• PA-14: Increase the proportion of trips made by bicycling.• PA-15: Increase legislative policies for the built environment that enhance access
and availability of physical activity opportunities.

Childhood & Adolescent Nutrition 3
It will take parents, schools, health professionals and communities working to-gether as a team to achieve the targets set in Health People 2020.
The nutritional health of our nation’s children is the basis of our nation’s futurepublic health. It will impact how many people will be diagnosed with chronic disease ordie of heart attacks or strokes in the future, reduce their quality of life and their abilityto work and produce healthy future generations.
An investment of time, planning, reserves, programming and care will providesignificant dividends now and in the next century. With this in mind, most of the abovegoals have been addressed in this course, to further support you in your work towardthe national nutrition objectives.
In order to better assess and understand the needs of children, it is important tohave a clear understanding of the various periods of childhood. These distinct periodsare defined in the chart on the following page. Note that, as children move into theschool years, there’s an age distinction between females and males. Males actually beginto develop two years later than females. The school years for boys are between age 6and 12, versus 6 to 10 years for girls. The distinction continues through the periods ofadolescence. This is important to keep in mind when dealing with children’s nutritionaland dietary problems. Boys and girls are not all on the same track.
First, we’ll look at growth and development patterns in kids. Knowing how chil-dren change in terms of weight, height, body composition, skeletal maturation andbrain growth at certain ages provides a good basis for understanding nutrition needsand problems.
To do this, the distinctions between growth and development will be specified.Growth is the increase in physical size of the body or any of its parts. Development, incontrast, is all the remaining changes that go on, both in maturation and function.
Periods of Childhood
INFANCY – Birth to 2 years
CHILDHOOD – Female: 2 to 10 years Male: 2 to 12 yearsPreschool Years: Female: 2 to 6 years
Male: 2 to 6 years
School Years: Female: 6 to 10 yearsMale: 6 to 12 years
ADOLESCENCE – Female: 10 to 18 years Male: 12 to 20 yearsPrepubescence: Female: 10 to 12 years
Male: 12 to 14 yearsPubescence: Female: 12 to 14 years
Male: 14 to 16 yearsPostpubescence: Female: 14 to 18 years
Male: 16 to 20 years

Childhood & Adolescent Nutrition 4
There are three phases of growth:• Hyperplasia is an increase in cell number. Organ systems go through this fairly
consistently when they’re growing.• Hyperplasia and hypertrophy is usually the next step; it is an increase in both
cell size and cell number.• Hypertrophy, the final stage, is an increase in cell size only — the organism is
growing by increasing the size of its cells, not creating new cells.
Logically, which of these is the most critical time when a nutritional deficiency isthe most dangerous to the organism? The answer is, during hyperplasia, when the cellsare actually being created. This is true particularly in the brain. About 2 to 3 monthsbefore birth, when the glial cells (components of the central and peripheral nervoussystem) are being formed, may be one of the only times when a nutrition deficit causespermanent damage and can’t be made up later. From that time until about 2 years ofage, both hyperplasia and hypertrophy are seen. After age 2 to 3, we see no more in-creases in cell number; growth occurs due to hypertrophy alone.
Compare that to what goes on in fat tissue, or the adipose organ in the body. Up toabout 2 to 3 months before a child is born, fat cells grow in number (hyperplasia) alone.Then there’s a phase where fat increases by hyperplasia and hypertrophy — the childcreates fat cells all the way up to about age 2.
From then on, the child increases the size of the fat organ mainly by increasing thesize of the fat cells (hypertrophy). Typically, children don’t create new cells until theadolescent growth spurt, when hyperplasia and hypertrophy occur again. After that, inthe postpubescent period, fat cell size is the main way that fat in the body increases. Inthis respect adipose tissue is distinct from other organs.
Debate and research on fat cells continues. New theories hold that if calorie con-sumption is high enough, human beings, even after pubescence, can increase the num-ber of fat cells indefinitely through adulthood. The issue is not yet resolved.
There are four factors that influence growth and development: genetics, hormones,environment (specifically nutrition) and behavior.
Some may argue for genetics, but until proven otherwise, nutrition is the number oneinfluence, thought to be most critical in growth and development.
As evidence of the relative importance of genetic heritage and environment, con-sider what happens when Japanese families move to America. When they arrive, Japa-nese children are usually below our national norms for height and weight. After two orthree generations in the United States, the Japanese-American population approximatesthe national norms. Why? Obviously it is more than just genetics. They are consumingan increased amount of calories, protein and calcium.
Something that is often considered genetic, such as height, may be influenced byenvironmental factors like nutrition. If we consider genetic heritage as potential — as ageneral population tendency — and environment as actual —an individual application,we come closer to understanding the proper influence of these factors.

Childhood & Adolescent Nutrition 5
That’s why infant and childhood nutrition is so important, and why any significantdeviation from normal growth or development should be a signal to look at the child’snutritional status.
Whether you are a health care professional, school food service worker, fitnessprofessional, nutritionist — or simply an interested parent, consider what this coursehas to say about children and nutrition and apply it to your own daily experiences.Children are human beings, and because we want them to become the best people theycan be, we need to respect their individuality.
In today’s changing health care environment, dental professionals often are themost continuously involved professional in a child's life and a chapter on dentalhealth is included. Accordingly, they can and should play a proactive role in children’shealth and nutrition. We hope dental professionals taking this course will be encour-aged to study nutrition and intervene whenever appropriate.
REFERENCES__________Healthy People 2010: National Health Promotion and Disease Prevention, US Dept. of Health
and Human Services, Public Health Services, Washington DC, 2010 www.healthlypeople.gov/2020/default.aspx
Splett PL and Story M. Child Nutrition: Objectives for the decade. J Am Diet Assoc, 91(6): 665-668, 1991.
GROWTH• Increase in physical size
-- increasing cell number-- increasing cell size
DEVELOPMENT• Changes that occur during maturation
-- cell differentiation-- maturation of individual organ systems
THREE PHASES OF GROWTH• Hyperplasia
-- increase in cell number
• Hypertrophy-- increase in cell size
• Hyperplasia and Hypertrophy
Growth and Development

Childhood & Adolescent Nutrition 6
Notes

Childhood & Adolescent Nutrition 7
Growth charts are an essential tool to help monitor growth and identify poten-tial health- or nutrition-related problems. In May 2000, a revised version of the growthcharts originally developed by the National Center for Health Statistics in 1977 werereleased by the Centers for Disease Control and Prevention (CDC). The developmentof these revised charts is a collaborative effort between the Division of Health Exami-nation Statistics and the Division of Nutrition and Physical Activity at CDC. Appendi-ces #1a and #1b are the clinical length and weight charts for boys and girls, birth to 36months. Appendices #2a and #2b are the clinical height and weight charts for boys andgirls aged 2 through 20. Age is plotted across the horizontal axis, and cumulativeweight and height is entered over the age in years.
Although one measurement plotted on a growth chart can be used to screenchildren for nutritional risk, it does not provide adequate information to determine thechild’s growth pattern. When plotted correctly, a series of accurate weight and heightor length measurements offer important information about a child’s growth pattern,which may be influenced by such factors as gestational age, birth weight, parentalstature and environmental factors.
Growth charts, sometimes referred to as distance or cumulative charts, are valuablefor individual assessment, but velocity charts, such as those provided on the next fewpages, give a better picture of what’s going on with weight and height at different ages,since they identify growth patterns more clearly.
Chapter One:Growth and Development
Childhood & Adolescent Nutrition 8
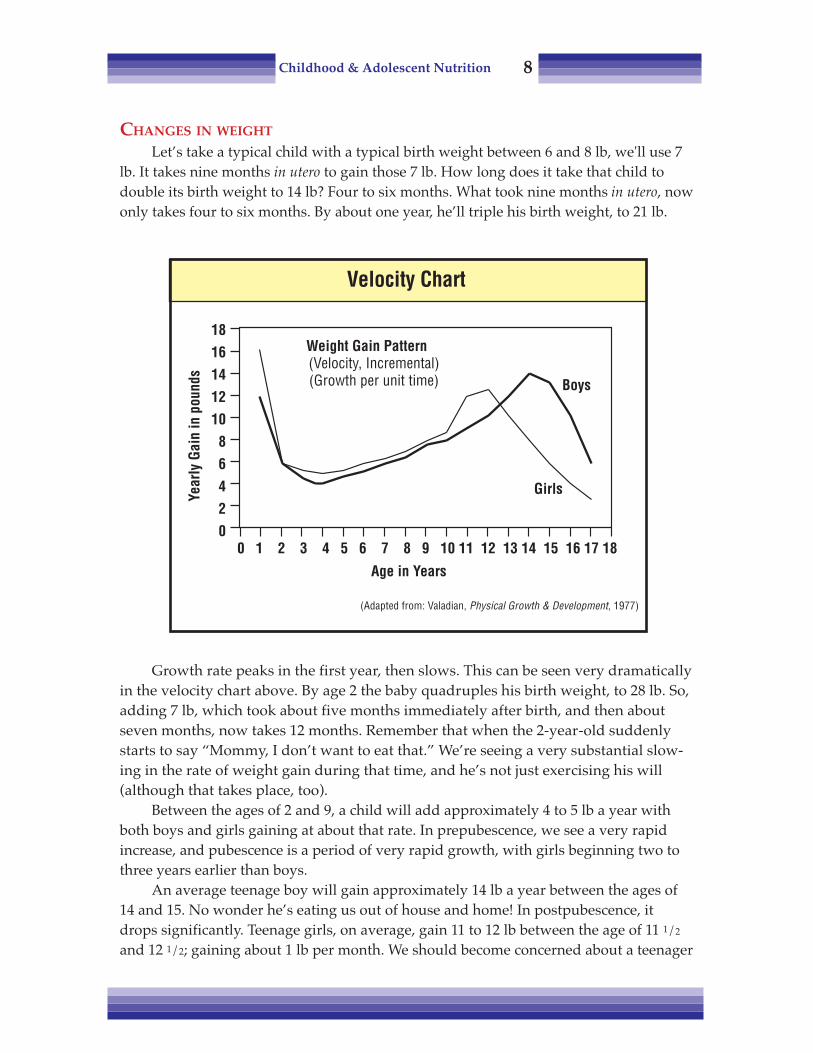
CHANGES IN WEIGHT
Let’s take a typical child with a typical birth weight between 6 and 8 lb, we'll use 7lb. It takes nine months in utero to gain those 7 lb. How long does it take that child todouble its birth weight to 14 lb? Four to six months. What took nine months in utero, nowonly takes four to six months. By about one year, he’ll triple his birth weight, to 21 lb.
Growth rate peaks in the first year, then slows. This can be seen very dramaticallyin the velocity chart above. By age 2 the baby quadruples his birth weight, to 28 lb. So,adding 7 lb, which took about five months immediately after birth, and then aboutseven months, now takes 12 months. Remember that when the 2-year-old suddenlystarts to say “Mommy, I don’t want to eat that.” We’re seeing a very substantial slow-ing in the rate of weight gain during that time, and he’s not just exercising his will(although that takes place, too).
Between the ages of 2 and 9, a child will add approximately 4 to 5 lb a year withboth boys and girls gaining at about that rate. In prepubescence, we see a very rapidincrease, and pubescence is a period of very rapid growth, with girls beginning two tothree years earlier than boys.
An average teenage boy will gain approximately 14 lb a year between the ages of14 and 15. No wonder he’s eating us out of house and home! In postpubescence, itdrops significantly. Teenage girls, on average, gain 11 to 12 lb between the age of 11 1/2
and 12 1/2; gaining about 1 lb per month. We should become concerned about a teenager
Weight Gain Pattern(Velocity, Incremental)(Growth per unit time) Boys
Girls
(Adapted from: Valadian, Physical Growth & Development, 1977)
Velocity Chart
Year
ly G
ain
in p
ound
s
1816141210
86420
0 1 2 3 4 5 6 7 8 9 10 11 12 13 14 15 16 17 18
Age in Years

Childhood & Adolescent Nutrition 9
on a weight-reduction diet during this stage. Teen girls normally would be putting onover 1 lb per month, but instead are dieting to lose weight. This is not healthy.
These growth rates are averages. Not everybody is average. In fact, there’s a widerange; some kids gain faster, some slower. Children all go through these growth stages,although the exact ages will vary.
Significant changes in weight that do not follow the child's growth curve mayrequire further evaluation, including physical, dietary and socioeconomic factors.Limited resources or access to food are just two examples of the many potential causesof considerable weight change.
CHANGES IN HEIGHT/STATURE
From Appendices #1 and #2 we can see changes in height that show a fairly steadyincrease from about age 2, a little more rapid increase in the pubescent growth spurt,then a slowing in the post pubescent phase.
The velocity graph on this page makes changes in height even clearer. The averagelength of a newborn is somewhere between 19 and 20 in. It takes that child nine monthsin utero to grow 20 in., then to grow just half of that, 10 in., takes a full year.
It takes three years to double the birth length and grow 20 in. Between the age of 3and the pubescent growth spurt, on average, a child is going to be growing between 2and 3 in. a year. During the pubescent growth spurt, girls will be putting on a solid 2 to3 in., and boys a bit more than that.
Height / Stature Growth Pattern
Age in Years
(Adapted from: Valadian, Physical Growth & Development, 1977)
Annu
al G
ain
in In
ches
Height Gain Pattern(velocity, incremental)(Growth per unit time)
0 1 2 3 4 5 6 7 8 9 10 11 12 13 14 15 16 17 18
Girls �
Boys�
1110
9876543210

Childhood & Adolescent Nutrition 10
There are various growth rates among adolescents. Some are early bloomers, somelate. Some aren’t going to reach peak growth until the ages of 17 and 18. I’ve even seenkids who don’t move into their major growth spurt until they’re 19 or 20.
“Early bloomer” boys reach their peak growth about the age of 12. Girls, on theother hand, get their peak in growth about the age of 10 1/2. We once thought that allgrowth in height was completed by the end of the second decade, but there’s some dataindicating that, due to bone accretion in the spinal column, there’s probably one-half tothree-quarters of an inch added during the third decade.
CHANGES IN BODY COMPOSITION
When a baby is born he looks kind of like a drowned rat. Six months later, he’s alittle butterball. What happened?
What is happening is an increase in the rate of fat accumulation. On average, thisoccurs until 6 months of age. Then, when he is seen at his first year checkup, he’s begin-ning to lengthen. There’s a substantial decrease in the rate of fat accumulation thatbegins to occur at about 6 months of age.
That decrease is continued. Children accumulate fat at a decreasing rate all the wayup to the prepubescent period, when we can begin to distinguish between boys and girls.
As shown in the BMI for age charts in Appendices #4a and #4b, the curve reachesthe lowest point between ages 4 and 6 years. The upward turn of the curve is known as“adiposity rebound.” It is unknown if the additional weight is truly the result of in-creased fat. This time period is when mothers become concerned: “I’m afraid he’s goingto have a potbelly.” Boys put on weight in the truncal area, around their middles, andoften around the upper arms and neck.
Fat Accumulation Patterns
(Adapted from: Valadian, Physical Growth & Development, 1977)
Mea
n Br
eadt
h (m
m)
10
9
8
7
6
50 5 10 15 20 25 30 35 40
Age in Years
Female
Male

Childhood & Adolescent Nutrition 11
Adolescents have a rapid increase in the rate of weight gain during the pubescentperiod and subsequent growth spurt. Boys have a large increase in muscle during thistime. Which is why when one looks at boys around 16 to 17 years old, it seems as if thephysique has suddenly developed — it has! They gain 13 or 14 lb per year during thatphase, and it is largely muscle.
Girls, on the other hand, have a larger percentage of the pubescent weight gain asfat. What we end up with, on average, is 21 to 22 percent body fat for teenage girls, andbetween 13 and 16 percent body fat for boys.
SKELETAL MATURITY
Height changes reflect skeletal maturation. One of the ways to look at this is withbone roentgenographic studies. We can actually find out how much bone mass a childstill has to lay down, because the bones develop in a very predictable, methodical way.
Children form certain bone centers in their hands at certain ages. From those bonecenters, or calcification centers, long bones gain tissue at their ends. Formation continuesat measurable rates, and by comparing a subject with the average, we can tell whetherbone growth is occurring the way it should. For example, we know that by age 2, a certaincenter should have formed and should be at a certain level of development. Skeletalmaturation occurs at fairly regular rates, and can thus be assessed to reveal problems.
Diet can influence bone growth and maturation; if the child isn’t getting enoughcalories, formation of the bone centers is delayed. The body is taking extra time to getextra calories so that it can reach its full stature.
If we do bone roentgenographic studies on obese children, we see that their skel-etal maturation is actually more advanced. By having extra nutrition, their bodies aregrowing more quickly, and they usually attain full stature a little more quickly and arefurther along in their bone/skeletal maturation.
Just to give an idea of the kinds of changes that go on, an infant is born with 200 to250 mg of calcium; by the time he’s an adult he has 1100 gm of calcium in his body.During growth phases, calcium for bone growth is needed, and it must come fromdietary sources. (Appendix #5 lists sources of calcium.)
OTHER GROWTH
From birth, there’s a rapid increase in the rate of brain growth. About 75 percentwill have occurred by age 2 but some data indicates that due to good nutrition intake inthis country, up to 90 percent of brain growth is accomplished by 18 months. The braincontinues to grow up to about 10 years of age (Mahan, 1984; Valadian, 1977).
After the hyperplasia is completed, additional growth is attained by an increase incell size. There’s little or no growth in the reproductive system until the pubescentperiod — prepubescence and pubescence — and then there’s a very rapid increase.
From the information in this chapter, we know that from birth up to age 2, there arevery rapid changes in height, weight, and muscle. Kids are growing quickly; and thereare not many eating problems. Then behavioral issues begin, and perhaps problems

Childhood & Adolescent Nutrition 12
with eating, because there’s a slowing in the rate of growth. Kids aren’t growing as fast,and their nutritional demands aren’t as high. Then there’s rapid growth at the adoles-cent growth spurt, and an increased nutritional need that must be met.
Not all “eating problems” are behavior problems. As growth slows, appetite mayalso be reduced. Assessing food intake over a one-day period and continuing to monitora child's growth routinely on the growth charts may provide reassurance to parents.Concerns regarding appetite and growth should be discussed with the child's healthcare provider. Routine well-child visits with the health care provider will provide amechanism for monitoring weight and height trends over time.
REFERENCES
Mahan LK and Rees JM. Nutrition in Adolescence, Mosby, St Louis, 1984.Pipes PL. Nutrition in Infancy and Childhood, (5th Ed.), Mosby, St Louis, 1993.Valadian I and Porter D. Physical Growth and Development, Little, Brown and Company, Boston, 1977.
Growth Patterns
(Adapted from: Valadian,Physical Growth & Development, 1977)
Age in years0 2 4 6 8 10 12 14 16 18 20 22
120
100
80
60
40
20
0
% to
tal p
ostn
atal
gro
wth

Childhood & Adolescent Nutrition 13
Chapter Two: Identifying Potential Problems
Nutrition assessment involves knowing how to determine adequate growth and
development. A proper nutrition assessment has three parts: anthropometric, biochemical/clinical and dietary assessment. An easy way to remember the components of nutritionsystem is by using the acronym ABCD. These tools can be used to determine if there is anutrition problem, identify what it is, and arrive at a strategy for solving it.
Probably the most critical assessment tools are anthropometrics measurements andevaluations. This is where the assessment process should begin. As discussed in Chap-ter One, the most widely used screening tools come from the Centers for Disease Con-trol and Prevention (CDC) and are found in Appendices #1 through #4. Growth chartsfrom the CDC website at: www.cdc.gov/growthcharts.
Anthropometric Measurements
HEIGHT & WEIGHT CHARTS• Growth charts• Population studies
OTHERS• Head circumference• Skinfold thickness• Body Mass Index• Mid-arm circumference• Bone roentgenographic studies

Childhood & Adolescent Nutrition 14
The CDC data come from thousands of ethnically diverse children nationwide whowere measured, weighed, and otherwise evaluated. The data were plotted on charts toarrive at national norms for a cross-section of the American population. In order to usethe charts properly, the measuring needs to be performed exactly the way it was per-formed for the studies.
• Weight. To measure weight, outer clothing and shoes should be removed. Abeam balance scale or a digital (electronic load cell or strain gauge) scale should beused. Scales should be recalibrated on a routine basis. The scale should be placed in the“zero” position before the child steps on the scale. The child should stand with both feetin the center of the platform.
• Height. Height is measured using a standing height board or stadiometer. Thedevice has a flat vertical surface on which a measuring ruler is attached. The childshould stand erect in stocking feet, with shoulders level, hands at sides, knees or thighstogether and weight evenly distributed on both feet. It is important to ensure the child'sheels are at the back of the stadiometer or the height measurement will appear lowerthan the actual height. For additional information, a self-directed training for takingmeasurements and using the growth charts is available from CDC’s web site:
<www.cdc.gov/growthcharts>
• Weight and Height Assessment: Weight change that does not follow the ex-pected growth curve should be evaluated further. Weight loss may be the result ofundernutrition; above average weight gain can be the result of excessive calories or toolittle physical activity. A large change of weight not following the normal pattern ofgrowth may also indicate illness. Height is usually not compromised until there is asignificant nutrition deficiency over time. It is important to assess both weight andheight from several plots on the growth chart to identify changes not typical of thechild's growth pattern.
• Head circumference. Is closely related to brain size and is often used to screenfor potential development or neurological disabilities among infants at birth to 24months. Older children and adults have a protuberance at the back of the head called theoccipital protuberance. For that reason, it is usually not advisable to measure headcircumference in children older than 3 years of age. Appendices #3a and #3b containcharts for head circumference for boys and girls.
Simply measure the child's head with a stiff tape measure. The tape should be kepthorizontal, slightly above the depression over the nose and a little above the eyebrows.There are variations from person to person, but about 0.8 in. (2 cm) above the depressionabove the bridge of the nose, and about 0.4 in. (1 cm) above the eyebrows, is about right.
The measurement is plotted on a growth chart and compared to the norm. Thattells us whether the head is growing the way it should, which is usually an indication ofproper brain development. It can also be an indication of other kinds of problems, butthe main use is to evaluate brain development. Children with a head circumference lessthan the 5th percentile or about the 95th percentile have health or developmental risksthat need further medical assessment.

Childhood & Adolescent Nutrition 15
• Skinfold thickness is another anthropometric measurement of value, particu-larly to determine body composition and obesity. Skinfold thickness is measured usingcalipers. Four measuring sites are used: triceps, subscapular (beneath the shoulderblades), iliac crest (the high part of the hips), and mid-thigh.
Usually the two most accessible ones, the triceps and subscapular or the tricepsalone, are used. Pull the fat layer away from the muscle, with a kind of “educated pull”and measure it. For accuracy, take three repeat measurements, average them, and plotthe average against national norms. Appendix #6 lists norms for triceps skinfolds.
Experience with calipers indicates that even for people who do thousands ofassessments, it can be very difficult to get accurate and repeatable measurements. Withsome very obese children, particularly teenagers, calipers cannot be used. A visualexamination can also tell a lot: Is there a roll of fat? Is there a double chin?
• Body Mass Index is an anthropometrics index of weight and height that is usedas a screening tool to identify individuals who are underweight or overweight. It is theonly indicator that allows healthcare professionals to plot a measure of weight andheight with age on the same chart.
Prior to 2000, BMI reference charts were not available for children. Now, we have agender-specific and age-specific measure to indicate excess fat. (It is important to notethat BMI is not a diagnostic tool, but a screening tool that indicates future assessmentneeds to be done. A "poor BMI" is only one indication that intervention might be appro-priate, and it must be seen for what it is: a shapshot of the child at that particular time.)Appendix #4a and #4b contain BMI charts for boys and girls.
The following are the formulas for converting height and weight into a BMI value:Determining BMI using the Metric System:
Weight (in kilograms) divided by Height (in meters) squaredBMI = Weight (kg)/[height (m)]2
Determining BMI using the English System:Weight (in pounds) divided by Height (in inches) squared times 703
BMI = Weight (lb)/[height (in)]2 X 703
When using English measurement, ounces and fractions offffff an inch must bechanged to decimal value. If doing the calculations for BMI seem overwhelming, thegood news is that BMI can also be determined by looking it up on a standard table ofBMI values (available at CDC web site) or using a Web calculator.
Once the BMI value is determined, it is plotted on the BMI-for-age chart. If thenumber falls at the 5th percentile or below, this is an indication of underweight. If it fallsat the 95th percentile or above that child is considered “obese.” If the number fallsbetween the 85th and 95th percentile, the child is considered to be as “overweight.” BMI-for-age is significantly correlated with subcutaneous and total body fat in adolescents. Itis not a direct measure of body fatness but rather a proxy for body fat. Further assess-ment is needed that might include triceps skinfold measurements, assessments of diet,health and physical activity.

Childhood & Adolescent Nutrition 16
As seen in Appendix #4, after about 1 year of age, BMI for age begins to decline andit continues to fall during preschool years until it reaches a minimum around 4 to 6 yearsof age. After 4 to 6 years of age, it begins a gradual increase (adiposity rebound). Thecurve continues through adolescence and most of adulthood.
Using the data below, let’s plot the BMI for age for a girl as she grows from age 3years to 9.5 years. On the chart, find the girl’s age on the horizontal scale, and follow avertical line to the BMI. Determine what percentile the child falls at for each of the years.
Girls Age in Years BMI
3 15.75 15.17 15.4
9.5 16.5
Answer: Although the BMI changes, the girl always remains at the 50th Percentile.There are several advantages to using BMI for age as a screening tool. It is consis-
tent with the adult index so it can be used continuously from 2 years of age to adult-hood. The difference is that for adults there are fixed cut off points to define overweight,while for children the BMI value indicating overweight varies according to age andgender. Another advantage of using BMI for children as a screening tool is that a highBMI correlates with clinical risk factors for cardiovascular disease includinghyperlidipemia, elevated insulin and high blood pressure.
Consider another example of how this information can be used. Adolescent girlsmay seek dietary counseling to lose weight because they want to look like the other girlsin their school. If a high BMI is plotted, further assessment is needed. Information mayreveal the adolescent has been a competitive athlete for several years. In this instance, thepercentage body fat should be calculated. It may show the adolescent is very lean, anddoes not need to lose weight. However, a dietary assessment may offer suggestions forhealthier food options to fuel the high level of activity. It is important for youth in thisexample to learn to accept themselves and be proud of their athleticism.
• Mid-arm circumference measurement is particularly useful in working withsevere malnourishment or starvation. Do this with a measuring tape and simply mea-sure the circumference of the arm at the point halfway between the shoulder and elbow,and then compare this figure to national norms, available from a number of sources.Mid-arm circumference is not usually used for normally developed kids.
• Bone roentgenographic studies were mentioned in Chapter One as a way oflooking at skeletal maturation. These are done by X-rays in the wrist and hand, so thatthey don’t involve the gonads. They are used to determine whether the centers are beingformed at the proper ages and how much more room there is for long bones to grow.
A colleague shared the story of a 12-year-old girl who was only 4' 10". They looked ather bone roentgenographic data and found she didn’t have much growth to go, given herbone development. She grew to 4' 11". There was no nutritional problem, however; shesimply came from a family of small stature.
Childhood & Adolescent Nutrition 17
DIETARY ASSESSMENT
Let us assume in working with a child that a problem in the anthropometric mea-surements has been identified, in either the height or weight. As a next step, a dietaryassessment should be done. There are four dietary assessment methods.
• First is the detailed dietary history, which is not used except in working withallergy cases. To do a proper diet history, one must go back to the earliest days, even inutero if one has access to this information, and look at the nutritional intake of the child.This is very difficult, time-consuming and expensive.
• A second, more common and quicker method is the 24-hour recall. The client isasked, “OK, what did your daughter eat in the last 24 hours? She got up and what didshe eat first? What next?” and so on through 24 hours. The idea is to look at their calo-rie, protein, vitamin and mineral intake and see what the child consumed. It is quickand easy, but keep in mind it is only one day and may not be representative of thechild's normal intake.
• A third dietary assessment method, instead of a 24-hour recall, is a three-to seven-day food record of what they consume. An introductory letter and a food recall formcould be sent to clients before an appointment, on which they keep a three-day foodrecord. Research has found that the data from a three-day food record is almost asaccurate as that from a seven-day or a five-day, based on studies which have actuallyobserved food intakes. So the three-day food record is pretty reflective of calories,protein, vitamin and mineral consumption in kids. Asking parents to identify non-typical occurrences that happened during the logging of the food record will yield morerepresentative data. For example, was the child ill during one of the days or did theyhave non-typical travel days during the recording time period.
After reviewing the three-day food record and educating the client, a 24-hour recallcan be done when they come back for follow-up visits and find out what headwaythey’re making with dietary changes.
• Another diet assessment that is used in many settings is the food frequency analy-sis, which is a good way to cross-check a 24-hour recall. Go through a list of foods, andsay, “How many times a week or a day do you drink milk? How many times do you eatcottage cheese, chicken, fish, etc.?” It can give you an idea of what they’re consuming,and compare it to the 24-hour recall. A food frequency form is included as Appendix #9.
A good application for the food frequency evaluation is in dental practice. It isuseful when a caries pattern has been identified to determine how many times a day thechild has cookies, candy, soda pop, etc.; it can also help detect other nutrition problems.
Once a problem has been determined via the dietary assessment, usually the clientwould be referred for more sophisticated analytical work. Iron status needs to be evalu-ated and if there was a particular nutrient that was felt to be of concern, that might beanalyzed individually, through blood tests. This information is beyond the scope of thiscourse, although iron deficiency is addressed in a later section. It is important to rein-force that more information yields better care, and that as a health professional it isimportant to know and use the resources available.

Childhood & Adolescent Nutrition 18
ASSESSMENT EXAMPLES
1) Let’s do a case study of a 4-year-old girl and see how her height/weight falls inthe BMI chart. The girl’s height is 39.2 in. and her weight is 38.6 lb.
Using the formula given previously (or CDC Table for Calculating Body MassIndex Values), what is her BMI? The answer: 17.8
Plot this figure on the BMI-for-age chart for girls (Appendix #4b). What percentiledoes she BMI fall in? The answer: 94th percentile, which is classified as being at risk foroverweight.
In this example we only have one measurement. We don’t know if this is hergrowth pattern or not. She may have gone through a phase where she put on extraweight but has not yet had a growth spurt in height. Since we don’t know what changesare going to occur with this little girl, she should be brought back for subsequent mea-surements. Depending on how concerned the parents are, I may complete a FoodFrequency Form with the parents and discuss basic nutrition and physical activity.
2) Consider another example of how this information can be used. I counseled a 14-year-old girl who was athletic — a competitive swimmer, in fact. She thought she wasunattractive, and wanted to lose weight to look like the other girls in her school. Be-cause she had been swimming since she was about 6, she was very muscular. In order tofind out if and how much she should lose, I plotted her weight for height. Her weightwas quite a bit higher than normal for her height because of all of her muscle mass.
Based on that information, the indication was for her to reduce her caloric intake tobring her weight closer to her age norm. But we looked at body composition, with atriceps skinfold, and determined that she was actually very lean. Her increased weightwas muscle mass, and she did not need to lose weight. Many children are so conform-ing; their main dread is being "different." One of our jobs is to assist this wonderfulyoung lady and others like her to learn to accept herself and be proud of her athleticism.
REFERENCES
__________ Centers for Disease Prevention: website: www.cdc.gov/growthchartsHassink SG. Pediatric Obesity. Prevention, Intervention, and Treatment Strategies for Primary Care
American Academy of Pediatrics, Elk Grove Village, IL, 2007.Mahan LK and Rees JM. Nutrition in Adolescence, Mosby, St Louis, 1984.Pediatric Nutrition Handbook, (6th Ed.), American Academy of Pediatrics, Committee on Nutrition, Elk
Grove, IL, 2009.Pipes PL. Nutrition in Infancy and Childhood, (5th Ed.), Mosby, St Louis, 1993.Valadian I and Porter D. Physical Growth and Development, Little, Brown and Company, Boston, 1977.

Childhood & Adolescent Nutrition 19
Chapter Three:Nutritional Assessment
Once growth patterns and eating habits have been evaluated, it is time to assessthe adequacy of a child’s diet.
In the past, the Recommended Dietary Allowances (RDA), last revised in 1989,have served as the standard to assess nutritional adequacy. The RDA are the levels ofintake of essential nutrients that, on the basis of scientific knowledge, are judged by theFood and Nutrition Board of the National Academy of Science to be adequate to meetthe known nutrient needs of practically all healthy people.
Since the last revision of the RDA, scientific knowledge regarding the roles ofnutrients has expanded dramatically. Current studies address topics ranging from theprevention of classical nutritional deficiency disease (i.e., rickets and scurvy), to thereduction of risk of chronic diseases (i.e., osteoporosis, cancer, heart disease). Thisexpansion of scientific knowledge is the basis for the development of a new referenceguide by the National Academy of Science — the Dietary Reference Intakes (DRI).
The Dietary Reference Intakes includes four categories of reference intakes. Therecommendations were made by a group of more than 30 US and Canadian scientistswho examined the results of hundreds of nutritional studies on both the beneficial aspectof nutrients and the hazards of taking too much of a nutrient. The four categories are:
• Recommended Dietary Allowance: The intake that meets the nutrient need ofalmost all of the healthy individuals in a specific age and gender group. The RDAshould be used in guiding individuals to achieve adequate nutrient intake aimed atdecreasing the risk of chronic disease. It is based on estimating an average requirementplus an increase to account for the variation within a particular group.

Childhood & Adolescent Nutrition 20
• Adequate Intake: When sufficient scientific evidence is not available to estimatean average requirement, Adequate Intakes (AI) have been set. Practitioners should usethe AI as a goal for intake where no RDA exists. The AI is derived through experimentalor observational data that show a mean intake, which appears to sustain a desiredindicator of health. For example, AI have been set for infants through 1 year of ageusing the average observed nutrient intake of populations of breast-fed infants as thestandard.
• Estimated Average Requirement: The intake that meets the estimated nutrientneed of half the individuals in a specific group. This figure is to be used as the basis fordeveloping the RDA and is to be used by nutrition policy-makers in the evaluation ofthe adequacy of nutrient intakes of the group and for planning how much the groupshould consume.
• Tolerable Upper Intake Level: The maximum intake by an individual that isunlikely to pose risks of adverse health effects in almost all healthy individuals in aspecific group. This figure is not intended to be a recommended level of intake, andthere is no established benefit for individuals to consume nutrients at the levels abovethe RDA or AI.
Refer to Appendix #8 for the currently available DRI for children and teens.
PROTEIN AND CALORIES
In the US, caloric and protein deficiencies are not usually an issue for children andadolescents, except for those in extreme poverty. Even so, it is important to evaluatethese nutrients. Individuals known to be at risk are teens of both sexes on weight-lossdiets (most often females for appearance; both sexes for athletic programs).
The chart on the following page shows the calorie needs for children based on the1989 RDA. Although energy information has been provided in DRI, the information isgeared for men and women 30 years of age. It is important that a child have sufficientprotein for growth and maintenance of body tissue, and sufficient calories to provideenergy, including energy for growth and development. If the child has insufficientcaloric intake, protein will be used for energy rather than growth and maintenance.
For more specific energy calculations, the 1989 RDA provides the 1985 WorldHealth Organization equations for Resting Energy Expenditure (REE), and activityestimates for all ages. Counselors doing individual assessments may prefer using thismore detailed assessment, especially if the individual has unusual activity patterns.

Childhood & Adolescent Nutrition 21
CASE STUDY
Let’s use the chart above to calculate the calorie needs of a 5-year-old boy whoweighs 40 lb. Since most nutrition literature has weight published in kilograms, weneed to convert pounds to kilograms. To do this divide pounds by 2.2; which converts40 lb into 18 kg.
In the chart, you’ll find the age group (4 to 6), and note that the RDA range forcalories for a 4- to 6-year-old is between 1300 and 2300 kcal, which is a large variance.
If you give this boy 2300 kcal and he should be getting 1300, he’ll become obese. Ifyou give him 1300 kcal when he needs 2300, he’ll look like a skeleton. That is why amore exact guideline for calories is needed and you should refer to the column "kcal perkilogram of weight" to make this determination. So, to determine the calorie needs forthis 5-year-old, you should use the following formula:
_____ kcal/kg X weight in kg = _____ kcal
90 kcal/kg X 18 kg = 1620 kcal
If you study the chart you will notice that the calorie needs per kilogram of weightdecreases as the child gets older. A 1- to 3-year-old needs 102 kcal per kg, while a 15- to18-year-old needs about 45 kcal per kg. So although teenagers may need more totalcalories, younger children need more calories per unit of body weight.
Energy & ProteinNUTRIENT
ENERGY
PROTEIN(gm)
Ages (kcal / kg) (total kcal)
1–3 102 (900–1800)4–6 90 (1300–2300)
7–10 70 (1650–3300)11–14 M 55 (2200–3700) F 47 (1500–3000)15–18 M 45 (2100–3900)
F 40 (1200–3000)
DRIAges (gm/kg/d) (gm protein)
1–3 1.05 134–8 0.95 19
9–13 0.95 3414–18 M 0.85 5214–18 F 0.85 46
FUNCTIONS/COMMENTS
• Growth & develop-ment
• Spare protein
• Growth & mainte-nance of body
• At risk: growingathletes on weightreduction, growingadolescent dieters
FOODSOURCES
All foods,breads,cereals,pastas, fruits& juices
Milk, cheese,yogurt, eggs,tuna, fish,meat, grains,legumes,vegetables

Childhood & Adolescent Nutrition 22
To determine the protein needs of this 5-year-old boy, you would use the followingformula:
_____ gm of protein/kg X weight in kg = _____ gm of protein
0.95 gm protein X 18 kg = 17.1 gm of protein
NUTRIENTS AT RISK
Folic acid or folate, zinc, calcium and iron have been identified as potential prob-lems for children. Iron is probably the single most frequently identified deficient nutri-ent. It is a critically important nutrient that enables red blood cells to carry oxygen(Pipes, 1993; Mahan, 1984). The highest incidence of iron deficiency appears in infants,young children, menstruating adolescent girls and young women. Iron-deficiencyanemia remains the most prevalent nutrition deficiency in children in the United States.
The objective in Healthy People 2010 is to reduce iron deficiency anemia for childrenaged 1 to 2 years from 9 percent to 5 percent, for children aged 3 to 4 years from 4percent to 1 percent and for nonpregnant females aged 12 to 49 from 11 percent to 7percent. The symptoms of anemia include: apathy, listlessness, behavioral disturbances,shortened attention span, hyperactivity, and learning disorders. Anemia can directlyimpact a child’s readiness to learn.
Iron, Zinc & Folic Acid
NUTRIENT
FOLATE(μg)
ZINC(mg)
IRON(mg)
DRI or RDAAges Amount
1–3 1504–8 200
9–13 30014–18 400
1–3 34–8 5
9–13 814–18 M 1114–18 F 9
1–3 74–8 10
9-13 814–18 M 1114–18 F 15
FUNCTIONS / COMMENTS
• Making protein, cell division• At risk: dieters/low caloric
intake
• Essential in many enzymesystems for DNA, proteins& mineralizing bone
• At risk: low & middle incomechildren
• Symptoms: decreased taste,appetite & growth
• Part of red blood cells,carries oxygen, increasedblood vol.& body stores ofiron during growth
• At risk: general population,adolescent athletes,adolescent females
• Take with vitamin C source
FOODSOURCES
Leafy greens,fruits, potatoes
Seafoods,meats, wholegrain cereal,
legumes
• Average US diet:6 mg/1000 kcal
• Organ meats,bread, shellfish,muscle meats,nuts, dried fruits,leafy greens

Childhood & Adolescent Nutrition 23
There appears to be a correlation between iron deficiency and high blood leadlevels. High blood lead levels are associated with developmental delays (AAP, 2009). Aniron intake that meets the RDA is needed to prevent iron deficiency and to decreaseabsorption of lead. Screening for anemia is needed for toddlers, young children in low-income populations and female adolescents.
Vitamin C-rich foods — citrus fruits, strawberries — enhance the absorption of iron.This is particularly important for the “non-heme” iron found in plant foods, which is notas absorbable as the “heme” iron found in animal foods. Good sources of iron are organmeats, bread, shellfish, muscle meats, nuts, dried fruits, and leafy green vegetables.
The diets of young children should be assessed for excessive milk intake. Morethan 3 cups of milk in a young child's diet may replace iron-rich foods in the diet.
Magnesium, Calcium, Vitamins B6, A & C
NUTRIENT
MAGNESIUM(mg)
CALCIUM(mg)
PYRIDOXINEVITAMIN B6(μg)
VITAMIN A(μg RE)
VITAMIN CAscorbic Acid(mg)
DRI or RDAAges Amount
1–3 804–8 130
9–13 24014–18 M 41014–18 F 360
1–3 5004–8 800
9–13 1300
1–3 0.54–8 0.6
9–13 1.014–18 M 1.314–18 F 1.2
1–3 3004–8 400
9–13 60014–18 M 90014–18 F 700
1–3 154–8 25
9–13 4514–18 M 7514–18 F 65
FOODSOURCES
Nuts, soybeans,whole grains,legumes,shellfish, greenvegetables
Dairy products,powdered milk,egg yolks, darkleafy greens,sardines, salmonwith bones
Fish, poultry,meats (pork),legumes
Dark green& yellowvegetables,milk products,liver
Citrus fruits & juices, spinach,strawberries,cantaloupe,tomato, broccoli
FUNCTIONS/COMMENTS
• 50% is in bone, 25% inmuscle.Needed for growth
• Factor in nerve & musclefunction
• Growth & development ofbones & teeth
• At risk: children & adoles-cents not consuming dairyproducts
• Involved in amino acid &energy metabolism
• Involved in the immuneresponse
• Visual process & develop-ment
• Developing bones & teeth• At risk: low-income black &
hispanic children & adoles-cents
• Involved in cellular struc-ture, protein metabolism,healing process, immunity

Childhood & Adolescent Nutrition 24
Calcium, along with phosphorus, is an important structural component of bonesand teeth and is at risk for being deficient in the diet of childhood and adolescentsespecially when there is a high intake of sodas.
Infants are born with about 200 to 250 gm of calcium in their immature skeletonand during the first year of life the skeleton develops rapidly in length, diameter andcomposition. Between ages 1 and 10, bone growth continues at a slower pace than ininfancy. From ages 10 to 18, bones grow visibly longer, as the adolescent grows taller.
Less obvious is the continued growth in density and thickness of the bones afterthey have reached their final length. In these years, large amounts of calcium are depos-ited daily into the skeleton.
By age 20, adult peak bone mass is almost fully attained. The adult skeleton of bothmales and females contains about 1100 to 1200 gm of calcium, most of it depositedduring adolescence if the intake of calcium is adequate.
Children with inadequate intake of calcium are at considerable risk for developingosteoporosis (“porous bones”), in which bone mass decreases in density, making bonesmore porous and fragile. The best strategy is to maximize bone mass during childhoodand adolescence through adequate calcium and vitamin D intake, as well as the recom-mended amounts of physical activity.
Scientists at the National Institutes of Health (NIH) has established the DRI forcalcium as:
ages 1 to 3: 500 mgages 4 to 8: 800 mgages 9 to 13: 1300 mg
The most recent surveys indicate that the average calcium intake of teenage girlsand young adult women is critically low. Although boys have a slightly higher level thangirls, their calcium intake is still less than recommended. Between 1977 and 1994, milkconsumption declined by 24 percent (boys) and 32 percent (girls aged 6 to 11) (J Am DietAssoc., 1999).
There is a common misconception that milk and dairy products — the richestsources of dietary calcium — are fattening. Actually, the non-fat, 1 percent (low-fat) and2 percent (reduced-fat) varieties provide a great deal of nutrition return for very little fatand calories. Three to four cups a day of low-fat or non-fat dairy products are optimal tomeet calcium needs at most ages. Under age 2, children should consume whole milkproducts since they need fat for energy and growth. The American Academy of Pediat-rics (AAP, 2009) recently stated that reduced-fat milk may need to be considered if thereis a BMI greater than the 85th percentile or a child has a strong family history of cardio-vascular disease or obesity. Appendix #5 lists calcium-rich food sources.
Adequate vitamin D intake is important for calcium absorption. The AdequateIntake is 5 mcg or 200 IU. The AAP states that older children and adolescents shouldreceive 400 IU of vitamin D through food and beverage sources. If the intake is less, avitamin D supplement should be provided in the amount of 400 IU per day. Caregivers

Childhood & Adolescent Nutrition 25
should be encouraged to discuss any potential supplementation with the child's healthcare provider.
Other nutrients — magnesium, vitamin B6 (pyridoxine), vitamin A, and vitamin C— can also be potential problems for children. If specific foods are missing from the diet,a nutrient inadequacy can be suspected, warranting further investigation. Keep this inmind when doing a nutritional assessment. The charts on the previous pages show DRIfor several nutrients. Most healthy diets based on MyPyramid will meet the recom-mended level of these key nutrients. Most goals are easily met in the average diet.
If a dietary deficiency is suspected, it may be beneficial to have a computerizednutritional assessment done. It is very difficult to calculate, by hand, all the nutrients inall the foods eaten over a three- or four-day period. If this comes back with specificnutrients deficient, then biochemical tests, such as blood tests, may be warranted.
SOCIAL INDICATORS
Two groups of children should be screened more closely for nutrition problems:low-income preschool children and teenagers. A recent article noted that adolescence isan especially nutritionally vulnerable period of life for several reasons. First is thegreater demand for nutrients because of the dramatic increase in physical growth anddevelopment. Second is the change in life-style and food habits of the adolescents thataffect both nutrient intake and needs. Third is that some adolescents have specialnutrient needs such as those who participate in sports, have a chronic illness, dietexcessively, or those who use alcohol and drugs (Spears, 2002).
Vegetarians can also be at risk, especially vegans who risk vitamin B12 deficiency.Those who eat eggs and drink milk — lacto-ovo vegetarians — get plenty of B12. Veg-etarian children have had documented growth problems as well as nutrient deficiencies.The problem is not that a vegetarian diet is harmful — it can be a very healthful diet foradults — but it takes more planning to ensure that children get enough protein, caloriesand nutrients.
REFERENCES
Dietary Reference Intakes. National Academy of Sciences - Institute of Medicine, 1998.__________ Dietary Reference Intakes for the antioxidant nutrients: Vitamin C, vitamin E, selenium and
carotenoids. J Am Diet Assoc, 100: 637-640, 2000.__________ Dietary Reference Intakes for energy, carbohydrates, fiber, fat, fatty acids, cholesterol, protein
and amino acids. J Am Diet Assoc, 102: 1621-1630, 2002.__________ Position of The American Dietetic Association: Dietary guidance for healthy children aged 2 to
11 years. J Am Diet Assoc, 99: 93-101, 1999.Healthy People 2010: National Health Promotion and Disease Prevention, US Dept. of Health and Human
Services, Public Health Services, Washington DC, 2000.Institute of Medicine. Dietary Reference Intakes: The Essential Guide to Nutrient Requirements. National
Academy of Sciences, 2006.Mahan LK and Rees JM. Nutrition in Adolescence, Mosby, St Louis, 1984.Pediatric Nutrition Handbook, 6th ed. American Academy of Pediatrics, Committee on Nutrition, Elk Grove,
IL, 2009.

Childhood & Adolescent Nutrition 26
Pipes PL. Nutrition in Infancy and Childhood, (5th Ed.), Mosby, St Louis, 1993.Recommended Dietary Allowances, (10th Ed.). National Research Council, National Academy of Sciences, 1989.Spears B. Adolescent growth and development. J Am Diet Assoc, 102 (suppl):S23-S29, 2002.Surgeon General’s Report on Nutrition and Health. US Dept. of Health and Human Services, Pub #88-50210,
Washington DC, 1988.Tamborlane W. The Yale Guide to Children's Nutrition. Yale University Press, New Haven, CT. 1997.

Childhood & Adolescent Nutrition 27
Chapter Four:Food Choices
and Menu Planning
In the previous chapters, information and tools to assess children’s nutritionalstatus have been reviewed. But nutrition, especially for children, isn’t just vitamins andminerals and carbohydrates and protein — it’s food. And kids don’t eat in milligrams,micrograms, ounces or grams — they eat meals, or more often, parts of meals, and partsof parts of meals, and snacks, and more snacks.
In the next chapters, we’ll look at some practical ways to assure that children getadequate nutrition — menu planning, supplements, and food behavior modification.
MYPYRAMID
MyPyramid was developed to help make meal planning easier for consumers. Thistool was released by the US Department of Agriculture (USDA) in April 2005, andreplaces the Food Guide Pyramid. MyPyramid was developed based on the revisedDietary Guidelines for Americans, 2005 (see Appendix #10) and the Dietary ReferenceIntakes from the National Academy of Sciences.
The Dietary Guidelines for Americans provides advice to promote health and toreduce risk for major chronic diseases through diet and physical activity. The Guidelinessummarize the most current scientific information regarding individual nutrients andfood components into recommendations for a healthy diet for individuals over twoyears of age. By law, the Dietary Guidelines are reviewed, updated if necessary, andpublished every five years. Creating the Dietary Guidelines is a joint effort of the USDepartment of Health and Human Services (HHS) and the US Department of Agricul-ture (USDA). For additional information about the Guidelines go to the USDA web siteat: www.health.gov/dietaryguidelines/dga2005/document
Detailed information about MyPyramid can be found at the interactive web site:www.MyPyramid.gov. From this site, a person can get an individualized version ofMyPyramid by entering their calorie information.

Childhood & Adolescent Nutrition 28
The five versions of the food guidance system provided by USDA are:• MyPyramid for teens and adults (general population)• MyPyramid for Kids (ages 6-11 years)• MyPyramid for Preschoolers (ages 2-5 years)• MyPyramid for Pregnant and Breastfeeding• MiPiramide in Spanish
MyPyramid for Kids is one of the USDA food guidance systems. It was developedespecially for children aged 6 to 11. Information on the web site includes lesson plansand activity sheets designed specifically for the classroom, a poster, “Tips for Families”and an interactive computer game called “MyPyramid Blast Off.”
The recommendations of MyPyramid fall under four overarching themes:• Variety—Eat foods from all food groups and subgroups• Proportionality—Eat more of some foods (fruits, vegetables, whole grains, fat-
free or low-fat milk products) and less of others (foods high in saturated or transfats, added sugars, cholesterol, salt)
• Moderation—Choose forms of foods that limit intake of saturated or trans fats,added sugars, cholesterol and salt.
• Activity—Be physically active every day. Including recommendations for physi-cal activity is a new addition to the food guidance system
MyPyramid for Kids

Childhood & Adolescent Nutrition 29
The major themes for MyPyramid for Preschoolers include:• Offer a variety of foods,• Provide small portions of food,• Serve scheduled snacks and meals, and• Choose smart beverages.
The MyPyramid website also provides information on daily physical activity,caregiver role modeling and tips for picky eaters.
MyPyramid is divided into five food groups, each represented by a color:• The Grain Group (Orange). This group provides complex carbohydrates, vita-
mins (B1, B2, B3, B6 and folic acid), and minerals (iron and zinc). It also provides fiber (ifthe food is whole grain). Foods from this group are relatively low in fat and cholesteroland should compose most of the diet.
Grains are divided into two subgroups, whole grains and refined grains.MyPyramid recommends at least half of the grain consumed be whole grain.
Whole grain contains the entire grain kernel — the bran, germ and endosperm.
MyPyramid for Preschoolers

Childhood & Adolescent Nutrition 30
Examples of whole grain include:whole-wheat flour oatmeal
(and products from the flour) whole cornmealbulgur (crack wheat) brown rice
Refined grains have been milled, a process that removes the bran and germ, whichalso removes dietary fiber, iron and many B vitamins. Most refined grains are enriched.This means certain B vitamins (thiamin, riboflavin, niacin, folic acid) and iron are addedback after processing. Examples of refined grain include:
white flour white bread(and products from the flour) white rice
degermed cornmeal
• The Vegetable Group (Green). Vegetables provide complex carbohydrates,vitamins (A, B6, C, folic acid), minerals (magnesium, potassium), and fiber, and are freeof cholesterol and fat. In addition, studies have indicated that adequate consumption ofvegetables may protect against certain forms of cancers.
Vegetables are organized into five subgroups, based on their nutrient content.Below are the groups as well as a few examples from each group.
Dark Green Orangebroccoli acorn squashdark green leafy lettuce carrotsspinach pumpkin
sweet potatoes
Dry beans and peas Starchy vegetablesblack beans corngarbanzo bean green peaslentils lima beans (green)
Other vegetablesasparagus cauliflowerbeets green beanscauliflower tomatoes
• The Fruit Group (Red). Fruits are natural simple carbohydrates and an impor-tant source of vitamins (A, B6, C, folic acid), minerals (potassium), and fiber and are freeof cholesterol and fat. Fruits and vegetables are in separate groups to emphasize theimportance of consuming foods from both groups.
Any fruit or 100 percent fruit juice counts as part of the fruit group. Fruit may befresh, canned, frozen or dried.

Childhood & Adolescent Nutrition 31
Some foods in this group are:Apples Apricots BananasBlueberries Cantaloupe CherriesDried Fruit Figs GrapefruitFruit juices (100% juice) Grapes* KiwiMelons Peaches PearsPlums Raisins* Strawberries
* Not recommended for very young children — may cause choking.
• The Milk Group (Blue). Dairy foods are an important source of protein, calcium,vitamins (A, B2) and minerals (zinc, phosphorus). Some foods made from milk thatretain their calcium content (cheese, yogurt, frozen yogurt, ice cream) are part of thisgroup, while some foods made from milk have little or no calcium (cream cheese,cream, butter) are not. Under age 2, children should consume whole milk products —they need fat for energy and growth. By age 5 they should gradually be offered lowerfat products.
• The Meat and Beans Group (Purple). This group provides protein, minerals(iron, zinc), and vitamins (B6, B12). Cholesterol and fat are higher in this group comparedto the other food groups, so it is important to limit portions to the recommendedamounts and to select lean cuts of meats. Foods in this group include:
Beef Chicken Dried beans (kidney,Eggs Fish pinto, Navy, black)Lamb Peanut butter* Luncheon meat (turkey,Nuts and seeds Pork ham, roast beef)
* Not recommended for very young children — may cause choking.
• Oils (Yellow). Although oils are part of MyPyramid, they are not regarded as afood group. Oils are fats that are liquid at room temperature, like the vegetable oils usedin cooking. Oils come from many different plants and from fish. Most oils are high inmonounsaturated or polyunsaturated fats and low in saturated fats and contain nocholesterol. A few plant oils that are high in saturated fats and should be avoidedinclude coconut and palm kernal oils.
Some common oils are:Canola SafflowerCorn SoybeanCottonseed SunflowerSunflower
Foods that are mainly oil include mayonnaise, certain salad dressing and soft (tubor squeeze) with no trans fats.

Childhood & Adolescent Nutrition 32
PHYSICAL ACTIVITY
As the graphic indicates, physical activity is now a component of MyPyramid. Forhealth benefits, physical activity should be moderate or vigorous and add up to at least60 min. a day for children and 30 min. a day for adults.
Physical activity for children can be met through playing. Climbing on playgroundequipment, running and kicking a ball with friends, tumbling and skipping are just afew examples of physical activity for children. Both free play and structured activitiesshould be included as part of a child's physical activity.
Examples of moderate or vigorous activities include:walking briskly (about 3 1/2 miles/hour or faster)hiking dancing basketballbicycling swimming
DETERMINING THE AMOUNT OF FOOD TO EAT
The first step in determining how much to eat is to estimate the calorie needs of achild based on their age and activity level.
Sedentary - less than 30 min./day of moderate physical activity in addition to dailyactivities.
Active - 60 or more min./day of moderate physical activity in addition to dailyactivities.
The chart below provides a guideline to help estimate the calorie needs of children.
The following chart shows the amount of food recommended from each of the fivefood groups plus oil for three different calorie levels. Specific information about indi-vidual calorie levels based on age, gender and activity levels can be found at<www.MyPyramid.gov> under the MyPyramid Plan link.
Estimating Calorie Needs of Children
Calorie RangeAge Sedentary to Active
Children: 2 to 3 years 1000 up to 1400
Female: 4 to 8 years 1200 up to 18009 to 13 years 1600 up to 220014 to 18 years 1800 up to 2400
Males: 4 to 8 years 1400 up to 20009 to 13 years 1800 up to 260014 to 19 years 2200 up to 3200
Childhood & Adolescent Nutrition 33
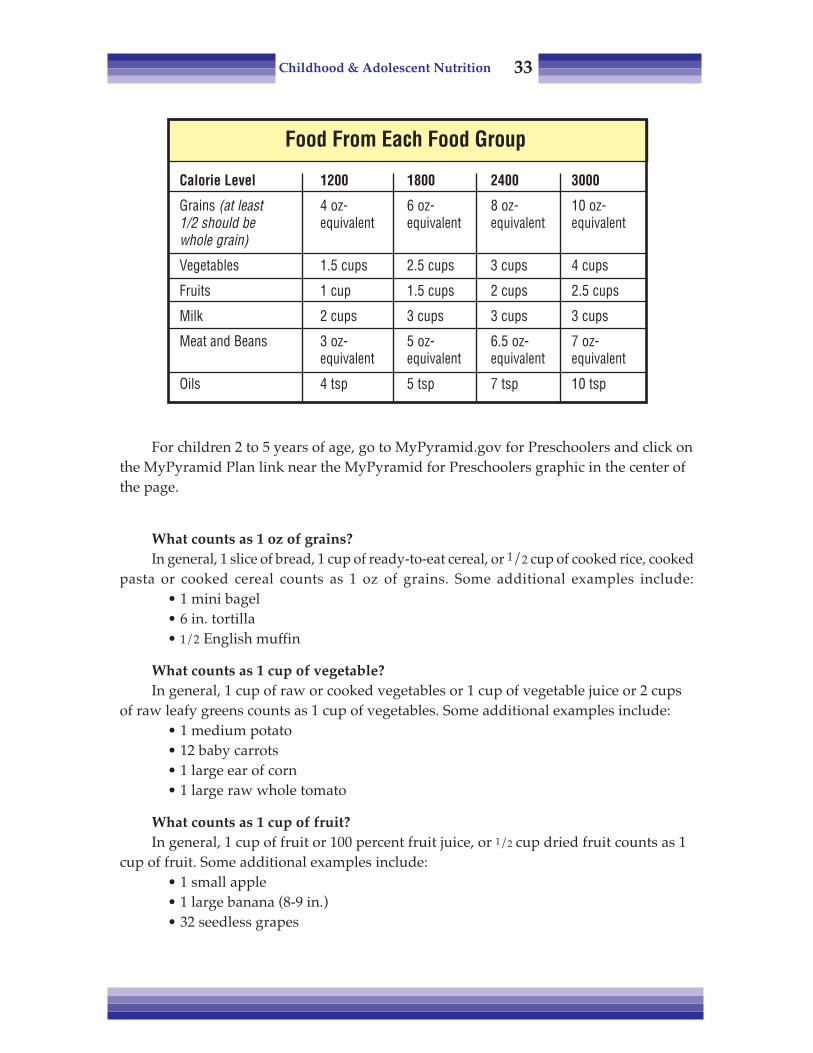
For children 2 to 5 years of age, go to MyPyramid.gov for Preschoolers and click onthe MyPyramid Plan link near the MyPyramid for Preschoolers graphic in the center ofthe page.
What counts as 1 oz of grains?In general, 1 slice of bread, 1 cup of ready-to-eat cereal, or 1/2 cup of cooked rice, cooked
pasta or cooked cereal counts as 1 oz of grains. Some additional examples include:• 1 mini bagel• 6 in. tortilla• 1/2 English muffin
What counts as 1 cup of vegetable?In general, 1 cup of raw or cooked vegetables or 1 cup of vegetable juice or 2 cups
of raw leafy greens counts as 1 cup of vegetables. Some additional examples include:• 1 medium potato• 12 baby carrots• 1 large ear of corn• 1 large raw whole tomato
What counts as 1 cup of fruit?In general, 1 cup of fruit or 100 percent fruit juice, or 1/2 cup dried fruit counts as 1
cup of fruit. Some additional examples include:• 1 small apple• 1 large banana (8-9 in.)• 32 seedless grapes
Food From Each Food Group
Calorie Level 1200 1800 2400 3000
Grains (at least 4 oz- 6 oz- 8 oz- 10 oz-1/2 should be equivalent equivalent equivalent equivalentwhole grain)
Vegetables 1.5 cups 2.5 cups 3 cups 4 cups
Fruits 1 cup 1.5 cups 2 cups 2.5 cups
Milk 2 cups 3 cups 3 cups 3 cups
Meat and Beans 3 oz- 5 oz- 6.5 oz- 7 oz-equivalent equivalent equivalent equivalent
Oils 4 tsp 5 tsp 7 tsp 10 tsp
Childhood & Adolescent Nutrition 34
What counts as 1 cup of milk?Besides 1 cup of milk, 1 cup of yogurt counts as 1 cup of milk. Some additional
examples include:• 1 1/2 ounces or 2 slices of hard cheese (cheddar, mozzarella, Swiss)• 2 oz or 3 slice of processed cheese• 1 1/2 cup of ice cream
What counts as an ounce of meat?In general, 1 ounce of meat, poultry or fish, 1/4 cup cooked dry beans, 1 egg, 1
tablespoon of peanut butter or 1/2 ounce of nuts or seeds counts as 1 ounce of meat.Some additional examples include:
• 1/4 cup tofu• 1/4 cup hummus, cooked black bean or chickpeas• 24 pistachios• 1/2 cup split pea soup
Portion sizes of foods commonly found in the marketplace are not in line with therecommendation of MyPyramid. Portions have actually increased in size during the past20 years (J Am Diet Assoc, 2003). Because portions have grown, consumers are havingdifficulty recognizing the amount they should eat for meals and snacks.
For example, typical 4 oz bagel represents 4 oz of bread equivalent, a 4 oz muffinrepresents 3 oz and an individual bag of tortilla chips (1 3/4 oz) represents 2 oz.
A typical restaurant prime rib of 13 oz is more meat than most people should eat inan entire day and a large potato (7 oz) represents the equivalent of 2 cups of vegetables— plus it is usually topped with generous amounts of butter and sour cream.
The increase in portion sizes has even been identified in old and new editions ofclassic cookbooks such as The Joy of Cooking. The same recipes that yielded six servingsin the past now yields only four servings in the new edition. America “supersizes”indeed!
Obviously, larger portions of food provide more calories than smaller portions andthis increase in portions sizes parallel with the rise in the incidence of obesity. Becauseof serving size distortion, it is important that parents are educated about the properamount of food a child should eat based on MyPyramid.
SNACKING
Snacks are particularly important for toddlers and preschool children since theyhave limited stomach capacity and cannot eat enough in three meals to meet theircaloric requirements. Generally, very young children need to eat every 3 to 4 hours. Atleast 1 1/2 to 2 hours should pass between meals and snacks. Approximately 82 percentof children aged 6 to 11 years consume snacks, accounting for 20 percent of total dailyenergy intake and 19 percent of total fat and saturated fat intake, according to a 2004position paper by the American Dietetic Association.

Childhood & Adolescent Nutrition 35
Snacks should be an integral part of the child’s diet and contribute to the servingrecommendations of MyPyramid. Snacks should also be regularly scheduled andincluded as part of a child's meal plan. Chips in front of the TV or a gooey doughnut atthe mall don't work. Some suggestions for nutritious snacks are shown below.
PLANNING HEALTHY MEALS
Variety is the key to planning menus using the Pyramid. The foods offered a childeach day should include choices from all five major food groups. Worksheets to helpplan healthy meals as well as sample menus can be found on MyPyramid website:<www.MyPyramid.com>
WHAT AMERICAN CHILDREN ARE EATING
Over the past quarter century, total energy intake of US children has increased (JAm Diet Assoc., 2004). The percentage of energy intake from total fat has decreased from38 percent to 33 percent (recommended level is 30 percent) and percentage of energyfrom saturated fat has decreased from 16 percent to 11 percent (recommended level is 10percent). While the percentage of energy from total and saturated fats decreased, actualfat intakes did not decrease because total energy intake increased. Approximately 68 to75 percent of US children exceed the current dietary recommendations for intake of totalor saturated fats. In contrast, the percentage of energy intake from protein and carbohy-drates has increased.
Frozen yogurt, lowfat or nonfatCheese, 2 percent fat (string or slices)Frozen fruit treats or fruit juice bars
(made with 100% fruit juice)Crackers (whole grain, graham or animal)Dry cereal (Cheerios, mini-wheats, party mix)Fruit, dry (apple, apricot, peaches, raisins*)Fresh fruit, slices (i.e. apple, banana, cantaloupe, pear)Canned fruit packed in juicePeanut butter*^ and crackers (not pre-packaged)Pizza muffins (English muffin with pizza sauce)Vegetables, raw* (i.e. baby carrots, broccoli florets,
jicama spears) w/low fat dip*May cause choking in 2- to 3-year-old child.
^ Avoid if potential or diagnosed nut allergies exist.
BagelsEgg, hard boiledPeanut butter* and celeryPopcorn*PretzelsRice CakesTrail mix*Yogurt, lowfat or nonfat
Nutritious Snacks

Childhood & Adolescent Nutrition 36
There was an overall decline in the total amount of milk, vegetables, soups, breads,grains, and eggs consumed, and an increase in the total amount of fruits and fruit juices,carbonated beverages, poultry, and cheese consumed (J Am Diet Assoc., 2004).
As stated earlier, between 1977 and 1994, milk consumption declined among bothboys and girls. The good news in that during this same period, there were changes inthe type of milk children consumed. The proportion of children drinking reduced-fat orfat-free milk has doubled since the 1970s; by 1994 reduced-fat milk was consumed morefrequently than whole milk. Other changes include decreased egg consumption, in-creased poultry, and substitution of margarine for butter.
The food choices of most US children do not meet the recommended intake of foodgroups outlined in the MyPyramid. The percentage of 2- to 19-year-olds who do notmeet recommendation ranges from approximately 70 percent for fruits, grains, meats,and dairy to approximately 64 percent for vegetables. The number of servings from thevegetable group and meat group increased in 2- to 19-year-olds, whereas those from thefruit group decreased. Only about 2 percent of children consume all recommendedservings.
VITAMIN/MINERAL SUPPLEMENTS
If children take a supplement, the supplement should be no more than 100 percentof the Daily Value for adults and children 4 years of age and older. The vast majority ofchildren who took a supplement took only one, usually a multivitamin or a multivita-min/mineral combination, while single vitamins or minerals were rarely reported,according to Radimer (2005).
When selecting a vitamin supplement, it is best to get one that not only containsvitamins but minerals. It would be very uncommon to find a multivitamin and mineralsupplement that contains 100 percent of the DV for iron as well as other minerals suchas iodine, zinc and copper. Since the daily recommendation of calcium is 800 to 1300mg, the pill would have to be very large to provide this amount.
Many factors should influence what multivitamin and mineral supplement topurchase. Price alone can not be a guideline for which supplement is best to select.
To ensure a high quality vitamin/mineral supplement, look for products that haveUSP (United States Pharmacopoeia) on the label. This means that the supplementcompany is legally responsible to the Food and Drug Administration for meeting USPdissolution standards — the standard of how well a supplement dissolves. USP alsomeans the supplement has gone through a battery of other tests as well — disintegra-tion, strength (potency), and purity. It also helps to look for nationally known food anddrug manufactures that make their products under the tight manufacturing controlsthat they already have in place.
The other important concern about vitamin and mineral supplements in children isthe risk of toxicity. The Centers for Disease Control cautions that one of the biggestpoisoning risks for children is vitamin and mineral supplements when they ingest alarge number of tablets. Kids can become very sick and there have even been deaths.

Childhood & Adolescent Nutrition 37
The worst and most common overdose cases usually involve fluoride or iron.There are cases of young children who died from ingesting their mother's iron tablets.It is not unusual for a young child to eat a bottle of children’s multi-vitamin/mineralsand become quite ill. Less-drastic overdoses happen often, but are not always reportedor documented.
One reason why children may ingest large quantities of vitamins is because of howattractive they have been made to look. They’re associated with having fun; they maybe in the form of cartoon characters and in bright colors. When we give kids vitamins,we don’t give them the normal warnings that we do with medications, and generallydon’t regard them with as much care as we do medicines.
Parents need to caution kids that “This is medicine, like any other kind of medi-cine,” and specify that they (the parents) will control dosage. Practitioners need tocaution their clients on supplement hazards.
It is important to keep in mind that vitamin and mineral supplements may helpensure adequate intake of nutrients, but it will not help correct poor dietary choices.Supplements will not help a diet that is too high in calories, total fat, saturated fat, orsimple sugars or to low in protein and fiber. In addition, many of the foods childrencommonly consume are already supplemented or fortified with vitamins and minerals.Many breakfast cereals are enriched with a variety of vitamins and minerals. Also breadis enriched with niacin, riboflavin, thiamine, folic acid and iron.
REFERENCES
Dietary Reference Intakes. Food and Nutrition Board, National Academy of Sciences - Institute of Medi-cine, 2000.
Mahan LK and Rees JM. Nutrition in Adolescence, Mosby, St Louis, 1984.National Cholesterol Education Program Highlights. NHLBI Information Center, Bethesda MD, April 1991.National Restaurant Association Crest Special Study, per NCEP Expert Panel Report, 1988.Pipes PL. Nutrition in Infancy and Childhood, (5th Ed.), Mosby, St Louis, 1993.Position of The American Dietetic Association: Dietary guidance for healthy children aged 2 to 11 years. J
Am Diet Assoc, 104:660-677, 2004.Radimer KL. Methological issues in assessing dietary supplement use in children. J Am Diet Assoc,
105:703-708, 2005.Recommended Dietary Allowances, (10th Ed.). National Research Council, National Academy of Sciences, 1989.Young LR and Nestle M. Expanding portion sizes in the US marketplace: implications for nutrition
counseling. J Am Diet Assoc, 103:231-234, 2003.

Childhood & Adolescent Nutrition 38
Notes

Childhood & Adolescent Nutrition 39
Chapter Five: Eating Behaviors
Nobody wins “food wars.”A mom complained about her 10-year-old daughter: “She only eats strawberries
and hot dogs. I’m sure she’s malnourished. What can I do?”Your 15-year-old calls you from school and says “Mom, after practice I’m going out
with the guys. Don’t wait dinner on me.” So you save 75 percent of dinner — becausethat was his share, right? — for the next night. You get home from work, and — it’sgone! “Sweetheart, I thought you ate out with the guys.” “Yeah, I did. I was hungrywhen I got home.” The bottomless pit.
In this chapter, the issues that are independent of nutrition but impact on nutritionand nutritional status will be reviewed.
The first rule is: lighten up! In many cases, parents are obsessed with food. Theymake minor tussles into wars. They think the way their kids eat and grow is a reflectionof the job they do as parents. Nobody wins food wars!
The chart on the next page shows how parental influence on food intake and habitsdeclines with the child’s age. Parents have 100 percent influence on what their kids eatin utero , but it goes downhill from there. Not even breast-feeding is controllable: putbaby on one breast for 15 min. and then over to the other one, and he goes to sleep.Literally from Day One, parents do not have 100 percent control.
There are many factors that influence kids’ eating habits. Even in 2- and 3-year-olds,outside influences are important. Sometimes the best way to get a kid to eat something isto put it in his best friend’s lunchbox. He’ll demand it! Peer pressure starts that young.

Childhood & Adolescent Nutrition 40
EATING BEHAVIORS IN PRESCHOOL CHILDREN
There are three things that parents should assume as their responsibility: First,provide nourishing food. Parents are the “gatekeepers.” When a mother says “My 3-year-old will only eat potato chips, cookies and candy,” one should ask “Does the childgo to the market and buy those herself? Why are they available?”
Second, provide a supportive environment for the child to progress and develophis own satisfying eating habits. Basically parents are the ones creating the space inwhich that occurs.
Finally, provide a role model for desired eating habits. Really look within and ask,“Do I want my kids to eat what I eat?” It would be very difficult to tell kids not to eat toomany sweets, with any credibility or authenticity, if we eat excessive amounts of them.
How does one set up an environment in the early years that will foster good eatinghabits for kids? There are physical factors and emotional factors. The physical settingwill be discussed first.
The chair and table should be firm, stable and comfortable. It should not be astrain for the kids to reach their food. That may seem obvious, but some parents reportthat picky eaters eat better when their feet are on some sort of solid platform. The tabletopand floor should be easily cleaned and undentable.
Some parents are concerned because their toddlers are incredibly messy when theyeat. Caregivers should provide young children with an eating environment that allows foran occasional spill of food or drink as they learn to become skilled eaters. Serving food toyoung children while sitting on finely upholstered chairs over white carpet, and expect-ing them to be clean after a meal, is an unrealistic expectation.
Parental Influence on Food Intake & Habits
100% ParentalInfluence
OtherInfluence
Age 0 2 5 8 12 16 Adults
Parents have 100% Parents can only make food availableinfluence in utero Peers/Media/Coaches are major factors
▼

Childhood & Adolescent Nutrition 41
• Dishes and utensils should be blunt and child-hand-sized. Particularly in veryyoung children, some food preferences have to do with their ability to handle and chew.Kids have not developed fine motor skills when they’re 3 or 4 years old, so make surethat food is served appropriately. Soft foods in small bite sized pieces are easy for thefingers or utensils to pick up. Utensils should be blunt, hand-sized— and nonbreakable,of course. Glasses and cups should have either two handles or no handles. With onehandle, there’s a lot of failure involved.
• Food should be simple. There are a few kids who like a dish with hollandaisesauce or lobster salad, but most kids like simple food, especially very young children.Picky eaters usually do better with milder flavors. If you want to begin introducingflavors that are a little stronger, give milder flavors along with the stronger ones.
• Textures. It is recommended that you give something soft, something crisp, andsomething chewy at every meal, if possible. That might include something like potato,carrots, and chicken. Think about texture and color, yet keep in mind foods that maycause choking in young children. Kids always comment about color. “Mommy, I’m noteating any of that green stuff” but we find that they do better if the plate is colorful.Meals don’t have to be picture-perfect, but think about color when planning the menu.
But don’t go overboard. It is a waste of time and energy to make up gorgeous platesfor a 3-year-old. It is easy for a child to become overwhelmed if the food is too compli-cated to eat. The same holds true if the portions are too large.
• Foods should be easy to manipulate. Think small, rough and easy to graspwhen feeding young children. As the family meal is served, cut the foods into bite-sizedpieces or sandwiches into easily-handled quarters. Think about the fact that they don’thave fine motor skills. Just imagine if an adult had to eat with a set of giant-sized uten-sils and gargantuan sandwiches.
PHYSIOLOGICAL & DEVELOPMENTAL FACTORS:• Growth rates change; needs, appetites vary• Hand coordination, chewing ability not fully developed• Fatigue: children may need rest before mealtimes
ENVIRONMENTAL FACTORS• Chair & table height • Dishes & utensils• Distractions
FOOD FACTORS• Flavor • Texture • Color • Simplicity• Variety • New foods • Easy to manipulate
Physiological & Physical Components

Childhood & Adolescent Nutrition 42
EMOTIONAL AND SOCIAL FACTORS
Emotional and social factors are important food behavior determinants.• Fatigue. Consider the example of shopping for a couple of hours with a 5-year-old
daughter, and then going to the tea room for lunch. Mom is hungry, but the 5-year-old iswhining and wailing — she’s tired and ready for naptime or at least a rest time.
• Hunger and restraints. How do babies communicate they’re hungry? By fussingor crying. That decreases with age, but kids are very rhythmic in their eating patternsand may fuss and fume if their routine is broken.
At home, we don’t call our children to the table and then begin preparing a meal,making them wait for a half hour for their food. But we do just that at restaurants. Theyhave to wait 20 or 30 min. before their meal is served — it is unrealistic to expect themto sit quietly and make polite conversation.
It’s normal and natural that your kids be a little unreasonable at mealtime. They’rehungry. So, feed them something. Carry some carrot sticks or ask the waitress for somecrackers, or something. Set the meal up for success.
Young kids are beginning to test things, to determine their ability to managethings, and they’re going test caregivers in the arena of food. That’s natural and normal.Trying to maintain a routine of healthy snacks and meals will allow the child to not getoverly hungry and help them adjust to the family schedule.
• Create a calm, relaxed atmosphere at mealtime. A colleague who works withmarkedly obese adult clients explained the importance of learning about the earlyfamily experiences relating to mealtime and food. One of the things the client often saysis that mom and dad would yell at each other at the table, or if something negative ortroublesome had to be discussed, it was discussed at the dinner table. How did the kidshandle it? They would be quiet and shovel in the food. Nervous eating was their way ofescaping, and dealing with the anxiety. Mealtime should be as pleasant as possible.
• Food is not a bribe or a reward. It is not uncommon to hear a parent say to theirchild, “You have been so good. Let's go get some ice cream.” A positive association withfood is developed and continued as an adult. Food is not to be used as a reward. Whatelse can be used? Hugs, reading, praise, strokes, play, toys, stickers — there are manyways to reward kids other than with food.
On the subject of sweets, examine the role that desserts have in the diet. Offerdessert options that are nutritious — such as fruit, frozen juice bars or low-fat frozenyogurt. Also, be cautious of statements such as “You have to eat this food before youcan have dessert.” It becomes a reward issue, and battles can begin.
Don’t be overzealous. Parents put a taboo on something, and create an alluringforbidden fruit (pardon the metaphor). And then, of course, we establish rules forspecial occasions: at Christmas, Halloween or Easter it’s “all you can eat.” Sweetssuddenly are linked with rewards and celebrations.
• Respect strong food dislikes. A child says “I don’t like that and I’m not going toeat it.” How is this handled? Don’t most of us have a food that we won’t eat — haven’tsince we were a kid and still won’t? President George H. W. Bush wouldn’t eat his
Childhood & Adolescent Nutrition 43
broccoli. It’s normal and natural that there are foods kids don't like. Is it going to com-promise their nutrition? Probably not. Let it be. It makes matters worse to pay too muchattention to dislikes. Some kids use food aversion to get attention or assert control.
Give and remove food without comment. Period. Don't reward or cajole: “Youcan’t have dessert till you finish your peas.” “Take one bite for mommy . . . ”
It is easy for caregivers to determine that a child does not like a food after it is re-fused one or two times. Parents should be encouraged to continue offering the dislikedfoods occasionally at meals or snacks. Many times, children will begin eating a dislikedfood after several exposures.
• Kids are the best judges of their own satiety. The data is clear. We’ve seenstudies on infants: give babies formula, and they drink a certain amount that willmaintain their growth. Dilute the formula so that it has fewer calories per ounce, andthey'll drink more. They determine their level of fullness, and are very good at it.
Serve portions smaller than the child needs. Give a child a plate that contains theamount of food everybody else gets — you’re saying “Eat it all! That’s what you shouldbe eating!” If the child can’t, he experiences failure.
Sometimes they won’t even start, because they know there’s no way they canfinish, especially if a “clean plate” rule exists. Remember how small their stomachvolume really is. Give just what you think they’ll eat, and they’ll ask for more; there’spositive reinforcement in that. Kids are good judges of their own satiety.
If a child does not eat all the food on his plate, what should be done? Plastic wrapworks wonders. Wrap it up, put it in the refrigerator — “It’ll be waiting for you whenyou’re hungry.” They really may not be hungry now and will be later. The meal mostoften skipped by young children is dinner. It may have to do with fatigue, oroverstimulation, or any of the physical or environmental issues we’ve mentioned, butthere’s another possibility: maybe they’ve already consumed most of their calories.They’ve had breakfast, snack, lunch, snack; they've probably filled their nutrition needs.
This approach is supported by a study reported in 1994 by Johnson and Birch.Research findings indicate that parents who provide healthful food choices but allowchildren to control how much they eat create an optimal environment for their child’sdevelopment of self-control of energy intake.
In this study, 77 children (aged 3 to 5 years) attending a university preschool wereasked to drink a high-energy or low-energy fruit-flavored drink shortly before lunch.Responsiveness to the energy density of the drinks was assessed by measuring adlibitum energy consumption during lunch.
The subjects’ parents completed two questionnaires: one to assess their own di-etary restraint, disinhibition, and perceived hunger and the other to assess their degreeof control of feeding their children.
The best predictor of a child’s ability to regulate energy intake was parental controlof feeding: mothers who were more controlling of their child’s food intake had childrenless able to self-regulate energy intake. Also, children with greater body fat stores wereless able to regulate energy intake accurately (Johnson, 1994).
Childhood & Adolescent Nutrition 44
• Don’t label kids. Consider the following. A parent labeled her 3-year-old daugh-ter a “junk food queen.” If she had her choice she would select cookies and candies,while her brother would rather have a raw carrot at snack time. So what does the littlegirl do? She gets Mom's attention, plus an identity — she likes the label of being a junkfood queen. (“I’m a queen, after all!”) Plus she feels the need to live up to her reputationand eat junk food. Be very careful not to label and typify. “He’s such a good eater,”“She’s so picky.” They live up to, or down to, those labels.
THE VEGETABLE/NEW FOOD WARS
• Vegetables are a big issue. Some kids are good vegetable eaters; some don’teat vegetables very well. It’s usually about 50-50. How can a parent handle thischallenge?
First, just keep introducing different vegetables. Often in the beginning, kids aren’tinterested; over time they may be.
Second, examine how the parents or food provider feel about vegetables, and whatkinds of messages are passed along. Kids are very astute; if they see that mommy anddaddy don’t really like rutabaga and never finish theirs, they’ll lose interest as well.
Third, give vegetables a chance. Adults may eat overcooked canned vegetables,but kids won’t. Kids often prefer raw or partially cooked vegetables. I heard of a momthat said her kids liked frozen vegetables. She zaps them a little bit in the microwave.They’re crunchy and partially frozen. Her kids eat them as snacks. Great idea!
People will spend hours on the roast or sauces, but plop some frozen spinach into apan and boil it till it’s tasteless, then maybe to bribe the kids to eat it they’ll sprinklesugar on it or load it with butter. Yuck!
If kids won’t eat vegetables, look for other ways to get the same nutrition into themwhile continuing to offer the disliked vegetables. Are those bad vegetable eaters prettygood fruit eaters? There are other ways to obtain the same nutrients.
• Trying new foods. It’s natural and normal for kids to be a bit skeptical aboutnew foods. They are learning about new smells, textures, colors and tastes of food. Keepintroducing new items; after a while they’re not new foods. Or, put them in the littleneighbor's lunch box. Your kid will come in demanding them.
Keep introducing is the main thing. And maybe make a game of it: New Food of theWeek. Look through magazines or suupermarket fliers together to choose a new fooddand “introduce” it to yourself as well as the kids, and “decide” what you like and don’tlike about it.
FOOD “JAGS”You’ve seen them: the 10-year-old who eats only hot dogs and strawberries or the
6-year-old who seems to live on peanut butter. First, it’s normal. It’s natural for kids togo through this when their growth phases are changing. They are testing their indepen-dence with you. Again, don’t make it an issue, particularly if they are getting adequatecalories and nutrients.

Childhood & Adolescent Nutrition 45
A vitamin and mineral supplement can be used to take away the anxiety aboutnutrient intake until the child gets over the food jag, which will happen more quickly iflittle attention is paid to the behavior.
If a food jag persists and they have a very limited nutrition intake for more thanthree or four weeks, then an evaluation may be recommended. Plot height and weightto ensure the child's growth is continuing along the expected curve. Remember, they’vereally had little experience with food. When they find something they like, they’ll keepeating it — just like adults.
ADOLESCENTS FOOD CHOICES
By the time kids go to school, peers, media, and others have an increasing amount ofinfluence over a child's food choices. Adolescents have even more influences over theirown food choices because of increased independence and ability to purchase their ownfoods and beverages.
Total nutrient needs are higher in adolescence because of rapid growth and devel-opment. Unfortunately, the adolescent lifestyle, which includes peer pressure and thelack of sense of urgency regarding future health, may make nutrition a low concern.Because of this, a study was done to assess adolescent perceptions about factors influ-encing their food choice and eating behaviors. The study population included 141adolescents in 7th and 10th grade from two urban schools in St. Paul, Minn, who par-ticipated in 21 focus groups (Neumark-Sztainer, 1999).
The factors adolescents talked about that most frequently influence food choicesinclude: hunger/food craving (eating because of hunger or craving for a specific food),appeal of food (taste/familiarity with food, appearance, smell), time (amount of timethey and their parents have (or want) to spend on food), and convenience (fast and easyto make or get).
Factors of secondary importance include: availability (food available in home orschool), parent influence (foods purchased, family meal patterns), perceived benefit(more energy, influence body shape/condition) and the situation (who they are with,what they are doing, where they are).
The findings suggest that if programs to improve adolescent nutrition are to beeffective, they need to address a broad range of factors with a particular emphasis onthe socio-environmental factors. Programs need to focus on health-related issues ofrelevance to adolescents, such as the association between eating behaviors and schoolachievement, sports success, and appearance and focus on making healthful choiceseasier and tastier through environment changes (attractive fruits in school cafeteria) andskill building (how to make a nutritious breakfast in 2 minutes or less).
FAMILY MEALS
More parents working and more children busy with school activities equals fewerfamily meals. This is one area parents may want to try to improve upon, for psychologi-cal and nutritional reasons. Although family meals are important for all family mem-
Childhood & Adolescent Nutrition 46
bers, a recent study (J Am Diet Assoc, 2003) found that the nutritional quality of adoles-cents’ diets improved when family meals were consumed. The study found that fre-quency of family meals was positively associated with intake of fruits, vegetables,grains, and calcium-rich foods and negatively associated with soft drink consumption.In addition, other studies have found that because families are spending more qualitytime together, it reduces the risk of adolescents’ engaging in high-risk behaviors likealcohol and drugs abuse.
Foods for family meals can be quick and easy to prepare, so that all family mem-bers can contribute to preparation, serving and clean up.
The information found in this chapter is best summarized by the following recom-mendations promoted by Ellyn Satter, a nutritionist who has several popular booksabout feeding children, including: How to Get Your Kid to Eat... But Not Too Much andChild of Mine: Feeding with Love and Good Sense, both published by Bull Publishing,Boulder CO.
Parents decide two things: Children also decide two things:• What food is served • How much to eat• When food is served • Whether or not to eat
REFERENCES
Johnson SL and Birch LS. Parents' and childrens' adiposity and eating style. Pediatrics, 94: 653-661, 1994.Mahan LK and Rees JM. Nutrition in Adolescence, Mosby, St Louis, 1984.Neumark-Sztainer D, et al. Factors influencing food choices of adolescents: Finding from focus-groups
discussion with adolescents. J Am Diet Assoc, 99: 929-934, 1999.Neumark-Sztainer D, et al. Family meal patterns: Association with sociodemographic characteristics and
improved dietary intake among adolescents. J Am Diet Assoc, 103:317-322, 2003.Pediatric Nutrition Handbook, 6th ed. American Academy of Pediatrics, Committee on Nutrition. Elk Grove,
IL, 2009.Pipes PL. Nutrition in Infancy and Childhood, (5th Ed.), Mosby, St Louis, 1993.Satter E. How to get your kid to eat... But not too much. Bull Publishing, Palo Alto, CA, 1987.

Childhood & Adolescent Nutrition 47
Chapter Six:Cholesterol and Children
Heart attacks and strokes are not diseases usually associated with children. Butwe should be concerned about what a child eats today because it can increase his risk ofhaving cardiovascular disease in the future.
Based on 2006 mortality data, cardiovascular disease caused more than 800,000deaths in the United States. Coronary heart disease (CHD), a type of cardiovasculardisease, killed 425,425 Americans in 2006, or 1 out of 6 deaths. This year as many as 1.2million Americans will have a heart attack. One third of them will die (AHA Heart &Stroke Statistical Update, 2010).
In 1991, the National Cholesterol Education Program’s (NCEP) Expert Panel onCholesterol Levels in Children and Adolescents stated that:
Compelling evidence exists that the atherosclerotic process begins in child-hood and progresses slowly into adulthood, at which time it leads frequentlyto coronary heart disease (CHD), the major cause of death in the US.
THE ATHEROSCLEROTIC PROCESS
Atherosclerosis is also called hardening of the arteries or plaque formation. Thepotential blocking of key arteries, such as coronary and cerebral arteries, along withbleeding into a plaque and/or blood clotting on the plaque surface, are the key factorsthought to cause heart attacks and strokes.
Atherosclerosis starts with cholesterol-rich fatty deposits called plaque that accumu-late in the artery walls. As these deposits grow, the supply of nutrients and oxygen tovarious organs is reduced. Plaque tissue is not healthy tissue; it cracks and bleeds, and if ablood clot forms, it can completely block an occluded artery which can result in a heartattack or stroke.

Childhood & Adolescent Nutrition 48
Even though it’s the muscle that pumps blood, the heart is fed by arteries. If any ofthese coronary arteries gets a major blockage in it, everything downstream dies fromlack of oxygen and nutrients. For instance, if the left main coronary artery is blocked,the entire left ventricle of the heart dies.
This is known as a massive heart attack, which can kill the victim instantly. Thereare new clot-dissolving drugs can unblock the artery to save tissue from dying.
When a smaller coronary artery — further downstream — is blocked, it causes aheart attack that is less likely to be fatal, since less of the vital heart muscle is affected.Nevertheless, even a small blockage can sometimes disrupt heart rhythm and prove fatal.
There usually are no symptoms of developing atherosclerosis. The first symptomfor 30 to 40 percent of people is a fatal heart attack. Of the remaining 60 to 70 percent,about half develop angina or chest pains before they have a heart attack, so they dohave a warning. The other half have a heart attack without warning, but survive it.
So, if you wait for symptoms of atherosclerosis to appear, the chances are no betterthan one in three that you will survive those first symptoms. It’s much safer and far lesscostly to prevent the blockage in the first place rather than rely on heroic medical inter-vention after a heart attack or stroke. That is why as health care professionals we shouldencourage children and their families to avoid consuming a diet high in fat especiallysaturated fat, trans fats and cholesterol.
LESIONS OF THE ARTERIES
In arteries of people who have minimal or no atherosclerosis, there are few of thecholesterol-rich deposits that characterize the initial stages of the disease. Once fatbegins to accumulate in the arteries, it forms fatty streaks, the initial lesion of atheroscle-rosis. As the disease progresses, these streaks get deeper and a lot more of them form.
LDL cholesterol PlateletMonocyte
Endothelial layer
PlaqueFoamcells
Smoothmuscle cellsMacrophage
Injury site
3. The accumulated cholesterol,foam cells and debris form aplaque, which obstructs theopening of the artery.
1. At the point of injury, LDLcholesterol, platelets and mono-cytes penetrate the endotheliallayer lining the artery. Mono-cytes become activated as mac-rophages.
2. Macrophages ingest LDLcholesterol particles and be-come foam cells. Excess cho-lesterol lodges among the foamcells. Smooth muscle cells pro-liferate.
Arterial Plaque Formation

Childhood & Adolescent Nutrition 49
The insides of the arteries of people who die from atherosclerosis have huge fattydeposits and open ulcers. The swelling from the ulcers and fatty deposits can actuallyblock the artery to the point where very little blood is flowing through. At this pointeither a spasm in the artery or a small blood clot can halt the flow of blood.
The process of cholesterol deposition in major arteries begins in childhood. Youngchildren can develop fatty streaks in the walls of the main blood vessels. Studies onsoldiers during the Korean War showed that over 70 percent of the soldiers killed inbattle (average age of 22) were found to have the beginning of atherosclerosis.
The American Academy of Pediatrics position paper (2008) on Lipid Screening andCardiovascular Health in Children reported that several published studies demonstrate thepresence of cardiovascular risk factors in children that correlate with cardiovascular riskfactors later in life.
MEASURING CHOLESTEROL
Cholesterol levels in the blood are one risk factor associated with heart attacks andstrokes in adults and the atherosclerotic process. The following lab tests determine risk:
• Total cholesterol (TC): It measures all of the cholesterol present in the blood. Ifthis value is elevated, a fasting lipoprotein analysis is done to measure the kindsof cholesterol. Cholesterol levels are commonly reported as mg/dl of blood.Whenever this chapter refers to cholesterol levels, it will use this unit of mea-surement. For instance, a “200 cholesterol” means 200 mg/dl. Sometimes choles-terol is measured in mmoles. To convert mg/dl to mmoles, simply divide by38.7. A serum cholesterol of 200 mg/dl is equal to 5.17 mmole.
• High-Density Lipoprotein (HDL-cholesterol or just HDL): The “good” choles-terol. It carries the cholesterol back to the liver to be broken down. The higherthe amount of HDL, usually the lower the risk of CVD.
• Low-Density Lipoprotein (LDL-cholesterol or just LDL): This is often called the“bad” cholesterol. It is most strongly associated with heart attacks and strokes inadults, and is the main cholesterol thought to be involved in plaque formation.LDL is not measured directly but calculated.
The formula for calculating LDL-cholesterol is:LDL = TC – ( HDL + TG )
5
• Triglycerides (TG): Triglycerides are the body’s main transport form for fats. Therelationship of triglycerides to heart attacks and strokes is not as clear ascholesterol’s. At high levels (150 to 200 borderline high and 200 to 499 high) inadults, it is associated with CVD and other health problems. This lab test re-quires that the subject fast. It is used to calculate the LDL-cholesterol.
• Very Low-Density Lipoprotein (VLDL): This third type of cholesterol is mainlytriglyceride. VLDL is usually not measured directly and not routinely done aspart of the lipoprotein analysis.
Childhood & Adolescent Nutrition 50
• Apo A; Apo B (Apolipoprotein A; Apolipoprotein B): Protein fractions in theblood may prove to be a useful predictor of adult CVD in children and adoles-cents (Wynder). These are not a routine part of the lipoprotein analysis.
At birth, total cholesterol is about 70 mg/dl, of which half is HDL. This is followedby a rapid rise in the first few weeks of life to between 100 and 150 mg/dl, on average.By age 2, it has slowly increased to 160 mg/dl in males and 165 mg/dl in females (two-thirds LDL, one-third HDL). At puberty, total cholesterol declines slightly in both malesand females, but males’ HDL declines, while females’ LDL declines.
In many studies of different countries, higher mean cholesterol levels in childrenusually reflect higher CVD rates in adults. Countries with mean TCs of less than 140mg/dl have the lowest CVD rates. Most of the differences in the TC are usually re-flected in the LDL rather than the HDL (Wynder).
Elevated cholesterol in childhood and adolescence is thought to be one of thefactors associated with the atherosclerotic process and atherosclerosis in adults. It isimportant to emphasize that it is only one of the related factors. There are five other keyrisk factors that can and should be addressed in children and adolescents to decreasethe risk of future CVD.
Smoking should be avoided, high blood pressure and diabetes diagnosed andeffectively treated, obesity should be prevented, a diet following the 2005 DietaryGuidelines should be followed and a consistent aerobic exercise program promoted.
LOWERING CHOLESTEROL
The role of cholesterol in early life and its relationship to adult CHD has been hotlydebated. The controversy has ranged from how and when to test serum cholesterol, towhat is appropriate and safe treatment (Kashani, 1991; Lauer, 1991; Newman, et al.,1991; Struhldreher, et al., 1991).
There is growing consensus about action to be taken. The NCEP Expert Panel hasspent many months examining the research and concerns. They have defined a fairlybalanced approach and it is the basis for many of the recommendations reflected here.
The basics of the Expert Panel Program and the American Academy of Pediatrics(AAP) position paper (2008) are spelled out in a two-pronged approach:
• The Population Approach, targeted to lower cholesterol for the generalchildhood and adolescent population and thereby lower overall US CVD rates.
•The Individualized Approach, targeted to screen and appropriately treatcholesterol levels of individual children and adolescents who, according toresearch, are at the highest risk of elevated cholesterol and potential adult CVDresulting in heart attacks and strokes.

Childhood & Adolescent Nutrition 51
THE POPULATION APPROACH
Universal cholesterol screening of all children is not recommended. However, as acountry concerned about our public health and preventing our number one causes ofdeath, (heart attacks and strokes) a lowering of average cholesterol levels in our childrenand adolescents makes sense. Probably the most important key factors in lowering choles-terol levels are changes in nutrient intake. The NCEP Expert Panel and the AAP make thefollowing recommendations for all healthy children and adolescents above age 2:
• Eat a wide variety of foods for nutrition adequacy.• Consume energy (calories) adequate for growth and development and to
reach and maintain a desirable body weight.• Achieve the following pattern of nutrient intake:
-- Total fat — an average of not below 20 percent and not more than 30 percentof total calories;
-- Saturated fat — less than 10 percent of total calories; and-- Dietary cholesterol — less than 300 mg/day.
The recommendations for total fat and saturated fats are consistent with those fromthe Nation’s Health Objectives for the Year 2010. The recommendations are intended forpersons aged 2 years and older. They are not appropriate for infants up to age 2, whosefast growth requires a higher percentage of calories from fat. The AAP recently updatedthe recommendations for children between the ages of 12 and 24 months. Children inthis category with obesity in the family history or with a BMI at the 85th percentile orhigher may need to receive low-fat dairy products (AAP, 2009).
The American Academy of Pediatrics Committee on Nutrition recommends thatchildren older than 2 years gradually adopt a diet that by the age of 5 years reflects therecommendation listed above. The committee notes that total fat over several daysshould be no more than 30 percent of calories and no less than 20 percent of calories.
It may sound like good news that fat intake of children has decreased from 38percent to 33 percent of calories and saturated fat has decreased from 16 percent to 11percent of calories according to a position paper from the American Dietetic Associa-tion. The reality is that while the percentage of energy from total and saturated fatsdecreased, actual fat intakes did not decrease, because total energy intake increased.Approximately 65 to 75 percent of US children exceed the current dietary recommenda-tion for intake of total and saturated fat according to the position paper.
The foundation for a heart-healthy diet is the MyPyramid, described in ChapterFour. This guide was designed to help Americans meet the goal of 30 percent of caloriesas fat and 10 percent as saturated fat. To meet this goal, the emphasis should be to selectlower fat choices within each food group. For example, select non-fat or 1 percent milk,leaner cuts of meat and grain products that are low in fat (instead of high fat crackers orsnack foods). All fruits (except avocados) and vegetables are low in fat unless fat isadded during preparation (for example, French fries). Avocados are rich inmonounsaturated fats and can be included as part of a heart-healthy diet when the total

Childhood & Adolescent Nutrition 52
dietary fat in the diet is less than 30 percent. Eating foods rich in soluble fiber such asfruit, oats and legumes has been shown to reduce cholesterol.
In addition, unsaturated and monounsaturated fats should be substituted forsaturated fat to keep the total saturated fat intake at less than 10 percent of total calories.Saturated fat raises the blood level of LDL. It is found in animal products like meat,whole-milk dairy products and tropical oils (palm kernal, coconut, and palm oil) and inproducts containing hydrogenated oils. In addition, many bakery goods, candies,cookies and fast foods contain saturated fats. Check food labels for products that con-tain no saturated fat or no more than 4 gm of saturated fat per serving in entrees andside dishes, and 2 gm of saturated fat per serving for desserts and snack foods.
Unsaturated fats (when used to replace saturated fat in the diet) reduce LDL levels.There are two types of unsaturated fats, monounsaturated and polyunsaturated.
Researchers believe that monounsaturated fats may be more beneficial than poly-unsaturated fats. Food high in monounsaturated fats include: olive oil, peanut oil,canola oil, peanuts, peanut butter, pecans, almonds and avocados.
Foods high in polyunsaturated fats include: corn cottonseed, soybean, safflower,and sunflower oils. These oils should be used in cooking instead of lard and hydroge-nated shortening.
Recently there has been concern about trans fatty acids. Trans fats, like saturated fatand dietary cholesterol, raises the LDL cholesterol that increases the risk of CVD. Satu-rated fat, trans fat and dietary cholesterol all contribute to raising LDL. The AmericanHeart Association recommends limiting trans fats to less than 1 percent of total calories.
Trans fats are created through a process called hydrogenation, in which an oil thatis largely unsaturated, such as corn oil, has hydrogen added to it, causing the fat tobecome more solid at room temperature. Because solid fats are less likely to go rancid,hydrogenation extends the shelf life of products.
Nutrient Intake in Children & Adolescents
CURRENT vs. RECOMMENDED
Saturated Fatty Acids 12.1% kcal <10% kcalTotal Fat 32.8% ≤30% (average)
Polyunsaturated 5.8% ≤10%Monounsaturated 12.5% 10 –15%
Cholesterol 225 mg/day < 300 mg/day
Source: USDA Food and Nutrient Intakes by Children 1994-96 and 1998.Table set 17 from USDA Continuing Survey of Food Intakes by Individuals 1994-96, 1998. (Mean amounts per day for age 19 and under.

Childhood & Adolescent Nutrition 53
Margarine is hydrogenated to varying degrees, depending on the degree of hard-ness. During hydrogenation, unsaturated fat becomes more saturated. The more solidand hydrogenated the fat, the more trans fatty acids there are in the product. Therefore,soft margarine is preferred over stick margarine.
Trans fats are often found in processed foods like crackers, candies, cookies, snackfoods, fried foods and baked goods made with partially hydrogenated vegetable oilssuch as shortening and some margarines.
Since January 2006, it has become easier for consumers to identify trans fatty acidsbecause the Food and Drug Administration requires information about trans fats be on theNutrition Facts labels. It appears just below the saturated fat information on the label.This is the first change to the Nutrition Facts panel since it was developed. The food labelwill now contain information about saturated fats, trans fats and cholesterol.
The recommended cholesterol intake for children over 2 years of age is less than300 mg. Cholesterol is only found in foods of animal origin, never of vegetable origin.(Vegetable oil or peanut butter that is promoted as having no cholesterol is no big deal,since products of vegetable origin never do.) The most concentrated sources of dietarycholesterol include: egg yolks, butter, lard, whole milk dairy products, organ meat(liver), poultry, beef and fish.
Surprisingly, the cholesterol content per ounce of poultry, red meat and fish isabout the same. However, scientists emphasize that it is not the amount of cholesterolbut the amount of saturated fat in the diet that primarily influences blood cholesterollevels. It is important to select lean and extra lean cuts of meat to reduce saturated fatintake.
The NCEP Expert Panel makes some general recommendations on ways to accom-plish the goal of 30 percent fat for various age groups. For toddlers, aged 2 to 3, thetypical intake requires little change except leaner/lower-fat dairy and meat products todecrease the saturated and total fat levels.
For preschool children, ages 4 through 6, emphasize lower-fat snacks frequently inthe day, such as grains, fruit, vegetable and low-fat/skim dairy and protein sources.
In elementary school children, aged 7 to 10, and adolescents, 11 through 19, empha-sis should be placed on eating all meals and not skipping breakfast.
Breakfast ideas for lowering fat include:• Serve a variety of cereals, emphasizing whole grains.• Provide a variety of fruits and juices.• Substitute margarine for butter (use very little).• Serve lower-fat dairy products (skim, 1 percent).• Include whole-grain or enriched muffins, bagels, toast, pancakes, etc.• Make omelettes or scrambled eggs with more egg whites, fewer yolks.• Serve nonfat or low-fat yogurt.
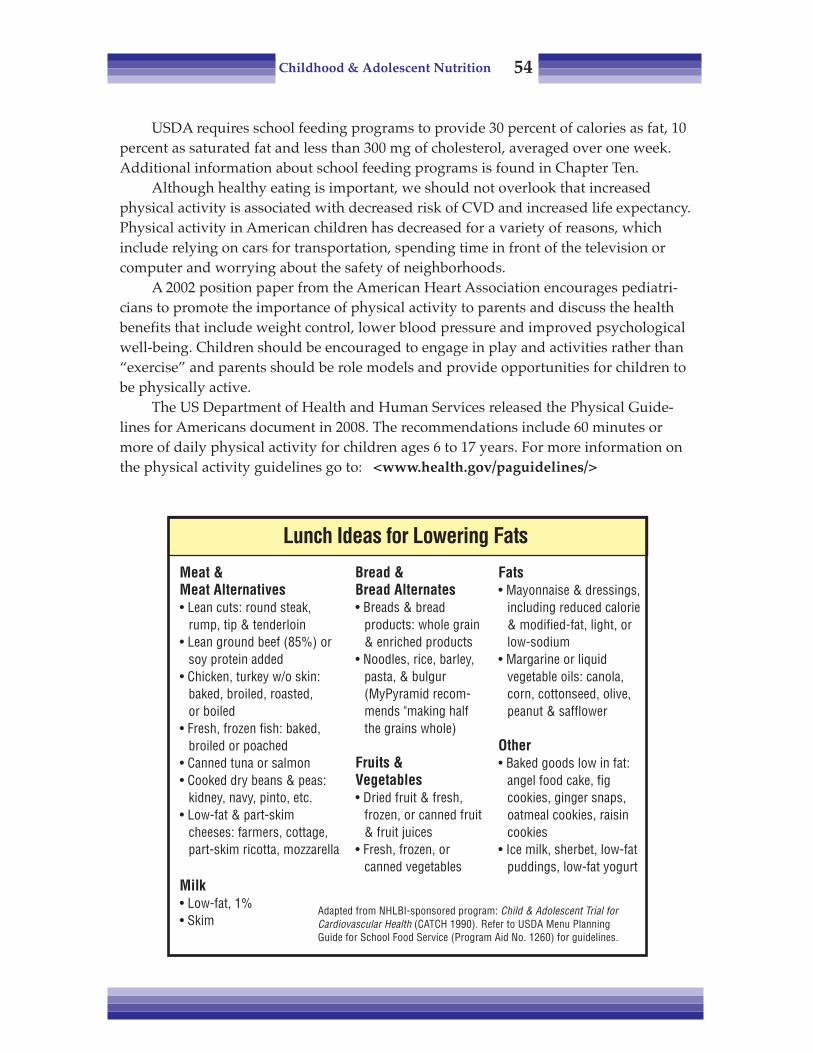
Childhood & Adolescent Nutrition 54
USDA requires school feeding programs to provide 30 percent of calories as fat, 10percent as saturated fat and less than 300 mg of cholesterol, averaged over one week.Additional information about school feeding programs is found in Chapter Ten.
Although healthy eating is important, we should not overlook that increasedphysical activity is associated with decreased risk of CVD and increased life expectancy.Physical activity in American children has decreased for a variety of reasons, whichinclude relying on cars for transportation, spending time in front of the television orcomputer and worrying about the safety of neighborhoods.
A 2002 position paper from the American Heart Association encourages pediatri-cians to promote the importance of physical activity to parents and discuss the healthbenefits that include weight control, lower blood pressure and improved psychologicalwell-being. Children should be encouraged to engage in play and activities rather than“exercise” and parents should be role models and provide opportunities for children tobe physically active.
The US Department of Health and Human Services released the Physical Guide-lines for Americans document in 2008. The recommendations include 60 minutes ormore of daily physical activity for children ages 6 to 17 years. For more information onthe physical activity guidelines go to: <www.health.gov/paguidelines/>
Lunch Ideas for Lowering Fats
Meat &Meat Alternatives• Lean cuts: round steak,
rump, tip & tenderloin• Lean ground beef (85%) or
soy protein added• Chicken, turkey w/o skin:
baked, broiled, roasted,or boiled
• Fresh, frozen fish: baked,broiled or poached
• Canned tuna or salmon• Cooked dry beans & peas:
kidney, navy, pinto, etc.• Low-fat & part-skim
cheeses: farmers, cottage,part-skim ricotta, mozzarella
Milk• Low-fat, 1%• Skim
Bread &Bread Alternates• Breads & bread
products: whole grain& enriched products
• Noodles, rice, barley,pasta, & bulgur(MyPyramid recom-mends "making halfthe grains whole)
Fruits &Vegetables• Dried fruit & fresh,
frozen, or canned fruit& fruit juices
• Fresh, frozen, orcanned vegetables
Fats• Mayonnaise & dressings,
including reduced calorie& modified-fat, light, orlow-sodium
• Margarine or liquidvegetable oils: canola,corn, cottonseed, olive,peanut & safflower
Other• Baked goods low in fat:
angel food cake, figcookies, ginger snaps,oatmeal cookies, raisincookies
• Ice milk, sherbet, low-fatpuddings, low-fat yogurt
Adapted from NHLBI-sponsored program: Child & Adolescent Trial forCardiovascular Health (CATCH 1990). Refer to USDA Menu PlanningGuide for School Food Service (Program Aid No. 1260) for guidelines.

Childhood & Adolescent Nutrition 55
THE INDIVIDUALIZED APPROACH
The population approach is important for CVD reduction and healthy eating forAmerican youth in general. However, there are individual children and adolescents forwhom elevated cholesterol levels are more likely to signify potential elevated choles-terol as adults and increased risk of CVD.
The Expert Panel state that research reinforces the view that childhood cholesterolplays a role in adult CVD with the following points:
• Children and adolescents with elevated serum cholesterol levels, particularlyLDL-cholesterol levels, often come from families with a high incidence of CVDamong adult members.
• High blood cholesterol has been documented to aggregate in families as a resultof both shared environment and genetic factors.
• Children and adolescents with high cholesterol levels are more likely than thegeneral population to have high levels as adults.
The Expert Panel’s two-pronged approach promotes individualized, not universal,cholesterol screening of children. The question was, “Do kids with elevated cholesterolbecome adults with elevated cholesterol and CVD?”
Data from the Bogalusa Heart Study, Lipid Research Trials, Muscatine, Iowa, andother studies indicate that significant percentages (25 to 70 percent) of children who arefound to have high cholesterol will continue to have high levels throughout life. How-ever, it must be emphasized that still leaves many children who test high in childhoodyet do not have elevated cholesterol levels as adults, according to NCEP adult standards.
Factors which may determine whether a child or adolescent will have high choles-terol levels as an adult are:
• Having at least two baseline cholesterol measurements in the “high” range;• Having a higher initial value. Most whose cholesterol values are in the 90th
percentile and above remain in higher percentiles;• Showing other persisting risk factors, such as smoking, overweight and lack of
physical activity; and• Having high TC and LDL.
One of the main arguments against universal cholesterol screening was the concernthat diagnosis of children with elevated cholesterol levels would cause them to belabeled “diseased.”
It is very important to reinforce that rarely do children with elevated cholesterollevels actually have active disease, and therefore they should certainly never be labeledas such. They do have risk factors which, if not addressed, could develop into diseaseand negative health consequences in later life.

Childhood & Adolescent Nutrition 56
GENETIC FACTORS
There are two types of defined genetic hypercholesterolemia: familial hypercholes-terolemia (FH) and familial combined hyperlipidemia (FCH). According to Wynder(1989) and others, FH is found in only about 4 percent of children with total cholesterolsabove the 95th percentile.
The two types of FH (heterozygous and homozygous) which have been identifiedand defined at this time are both thought to result from a genetic mutation whichproduces defective LDL breakdown and very elevated blood levels of LDL.
• The heterozygous type has an estimated prevalence of 1 in 500. These individu-als have about half of the LDL receptors found in normal individuals. The TCand LDL are usually two to three times normal levels, 300 ± 60 mg/dl. Theyusually have elevated cholesterols from birth. The risk of myocardial infarction(MI), commonly known as a heart attack, is only 5 percent for males and nearzero for females by the third decade of life, rising to 20 percent for males and 3percent for females by the fourth decade. It rises to 45 percent for males and 20percent for females by the fifth decade, and to 75 percent for males and 45percent for females by the sixth decade.
• The homozygous type has an estimated incidence of 1 in 1 million. These indi-viduals have no LDL receptors; TC and LDL levels are five to six times normal.The TC is markedly elevated from birth and remains so throughout life. TC isoften in the 600 to 1200 mg/dl range. It has severe clinical consequences, withangina pectoris and myocardial infarction common in the second decade; fewsurvive beyond the third decade.
Familial combined hyperlipidemia is more frequent and usually less severe. It isestimated that prevalence is about 10 to 12 percent of children with cholesterol levelsabove the 95th percentile. Further explanation (and discussion of some of the more raretypes of disorders) can be found in the Expert Panel Report (NCEP, 1991) and Franklin,et al. (1990).
CHOLESTEROL TESTING
When measuring cholesterol in children, methods based on the Centers for DiseaseControl’s standards and specifications should be used. Even then, differences due tonormal physiologic variation in an individual child can be expected.
Franklin (1990) estimated this variation to be somewhat greater in children than inadults — approximately 15 percent for TC and 21 percent for LDL in children, versus 12percent and 17 percent for adults. Therefore it is important to obtain and average mul-tiple measurements — at least two readings — before classifying (and certainly beforetreating) a child for elevated cholesterol.
The Expert Panel’s recommendations on cholesterol testing call for selective screen-ing only, not universal screening. They have defined four basic criteria for screening
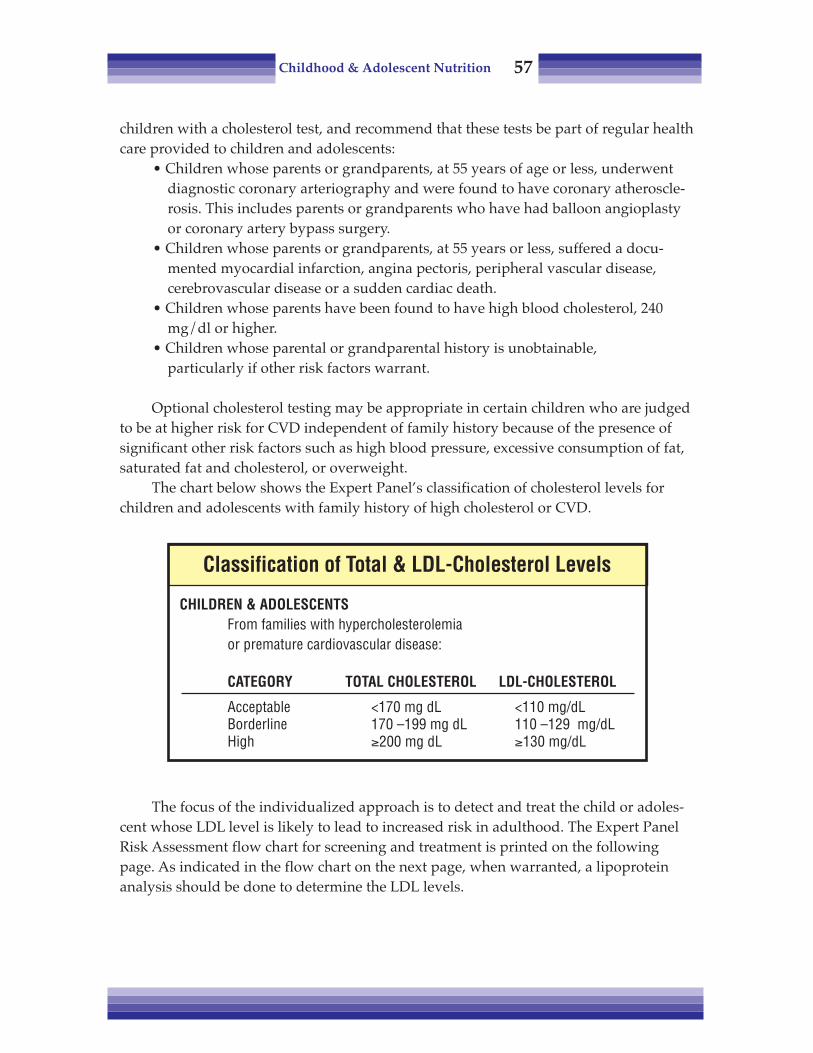
Childhood & Adolescent Nutrition 57
children with a cholesterol test, and recommend that these tests be part of regular healthcare provided to children and adolescents:
• Children whose parents or grandparents, at 55 years of age or less, underwentdiagnostic coronary arteriography and were found to have coronary atheroscle-rosis. This includes parents or grandparents who have had balloon angioplastyor coronary artery bypass surgery.
• Children whose parents or grandparents, at 55 years or less, suffered a docu-mented myocardial infarction, angina pectoris, peripheral vascular disease,cerebrovascular disease or a sudden cardiac death.
• Children whose parents have been found to have high blood cholesterol, 240mg/dl or higher.
• Children whose parental or grandparental history is unobtainable,particularly if other risk factors warrant.
Optional cholesterol testing may be appropriate in certain children who are judgedto be at higher risk for CVD independent of family history because of the presence ofsignificant other risk factors such as high blood pressure, excessive consumption of fat,saturated fat and cholesterol, or overweight.
The chart below shows the Expert Panel’s classification of cholesterol levels forchildren and adolescents with family history of high cholesterol or CVD.
The focus of the individualized approach is to detect and treat the child or adoles-cent whose LDL level is likely to lead to increased risk in adulthood. The Expert PanelRisk Assessment flow chart for screening and treatment is printed on the followingpage. As indicated in the flow chart on the next page, when warranted, a lipoproteinanalysis should be done to determine the LDL levels.
Classification of Total & LDL-Cholesterol Levels
CHILDREN & ADOLESCENTSFrom families with hypercholesterolemiaor premature cardiovascular disease:
CATEGORY TOTAL CHOLESTEROL LDL-CHOLESTEROL
Acceptable <170 mg dL <110 mg/dLBorderline 170 –199 mg dL 110 –129 mg/dLHigh ≥200 mg dL ≥130 mg/dL

Childhood & Adolescent Nutrition 58
HIGH CHOLESTEROL TREATMENT
The education and follow-up recommended by the NCEP Panel is based on thechild’s LDL levels.
• Acceptable LDL (110 mg/dL or less): Counsel on eating pattern and CVD riskfactor recommended for all children and adolescents (see Chapter Four). Repeatthe analysis in five years.
• Borderline LDL (110 to 129 mg/dL): Provide risk factor advice and intervention,initiate the Step One Diet (below). Reevaluate the patient’s status in one year.
• High LDL (≥130 mg/dL): Evaluate for secondary causes and familial disorders, screenfamily members, initiate the Step One Diet, followed if necessary by the Step TwoDiet, (on the following page). Provide risk factor advice and intervention.
Remember, an important goal for lowering cholesterol in obese children is toachieve and maintain desirable weights.
• The Step One diet as described in the table, is identical to the recommendationsdescribed in the population approach. The reason the diet is considered therapeutic isbecause it is implemented in a medical setting with specific counseling and support of amedical treatment team.
Nutrients for growth have been a major source of debate in the discussion ofcholesterol in kids. There have been some reports of children not growing adequatelywhen placed on “heart healthy” diets by their well-meaning parents. When these casesare examined closely, they prove to be due to overzealous parents who feed their chil-dren too few calories and other nutrients. This is an area for caution, but should not be a
�
�
�
�
�
�
�
�
�
�
�
�
�
�
Risk Assessment
NCEP Expert Panel on Blood Cholesterol in Children & Adolescents
RISK ASSESSMENT
Measure TotalBlood Cholesterol
Parental High BloodCholesterol ≥ mg/dl
PositiveFamily History*
Perform LipoproteinAnalysis
ACCEPTABLE
BORDERLINE
HIGH
Measure & averagewith previous
< 170 mg/dL
≥ 170 mg/dL
Repeat analysis in 5 yearsProvide education on risk factor reduction
Perform lipoproteinAnalysis
*Defined as a history of premature (before age 55 years) cardiovascular disease in a parent or grandparent.

Childhood & Adolescent Nutrition 59
problem if the recommendations are followed as written. A 2002 position paper fromthe American Heart Association states that there is an increasing body of research thatdocuments the safety and success of interventions to reduce risk factors in children.
• The Step Two diet is implemented if the Step One goals are not reached afterthree to six months. As described above, the Step Two Diet calls for further reduction inintake of saturated fat to less than 7 percent of total calories and cholesterol intake toless than 200 mg. The Step Two diet is more difficult to adhere to and requires carefulplanning by a Registered Dietitian. The RD can work with the family to assure they arebeing compliant with the diet and that meals are planned to meet the calcium, iron,protein and calorie needs of a growing child.
The child’s or teenager’s life-style needs to be considered to make these diets asacceptable and easy to follow as possible. Often in working with children — and espe-cially teenagers — an authoritarian approach is counterproductive.
When counseling on Step One or Step Two Diets:• Focus on all of the healthy, delicious foods that are available and make up the
bulk of the eating plan.• Speak to the motivation factors of children and adolescents. Emphasize the
benefits of a heart-healthy diet: athletic performance, feeling good, lookinggood, better skin and hair.
• Suggest making changes gradually and being realistic. Most kids (and parents) arerelieved to find out that the desired changes do not mean the diet must be overlyrestrictive.
• Involve the child in food shopping and preparation.
Step One & Step Two Diets
NUTRIENT RECOMMENDED INTAKE
Step One Diet Step Two Diet
Total Fat Average of < 30% total kcal ... SameSaturated fatty acids < 10% of total kcal ................. < 7% total kcal
Polyunsaturated fatty acids < 10% of total kcal ................. SameMonounsaturated fatty acids Remaining total fat kcal .......... Same
Cholesterol < 300 mg/day ......................... < 200 mg/dayCarbohydrates ≈ 55% of total kcal ................. Same
Protein ≈ 15-20% total kcal ................ SameCalories To promote normal growth .... Same
& development; reach ormaintain desirable body weight.

Childhood & Adolescent Nutrition 60
• Keep healthy snacks on hand.• Accept that there will be times when children make poor food choices.• Praise healthy food choices, especially in difficult situations.• Utilize tools such as fiber gram counting, fat gram counting or saturated
fat gram counting to educate about these substances in foods.
People feel more in control when they have goals and targets to meet each day.They feel that they can take specific, measurable, positive actions that usually result inlower cholesterol measurements in the follow-up tests. If they keep food records, it maylead them to look at food differently.
CHOLESTEROL-LOWERING MEDICATIONS
Medications are only considered for children age 10 years or older if their bloodcholesterol level is still elevated after trying dietary modification for 6 months to 1year. One type of medication the American Academy of Pediatrics approves for chil-dren includes bile acid sequestrants. These compounds, known as bile acid binders,attach to molecules of bile acids, which help digest fats. Bile acids are made fromcholesterol, and bile acids when bound to these drugs pass out in the stool.
CASE STUDY: CHOLESTEROL BASE CALCULATIONS
Let us move to more practical matters and consider how to calculate 30 percent fatand 10 percent saturated fat for a specific child. “Ryan” is a 9-year-old, healthy 4thgrader, 52 in. (132 cm) tall, weighing 62 lb (28 kg). Let's do some calculations that can beused for menu planning or counseling.
• Step 1: First calculate total calorie requirement. (Refer to Chapter Three).A 7- to 10-year-old boy needs 70 kcal/kg, according to the RDA table.
70 kcal X 28 kg = 1960 kcal• Step 2: Calculate 30 percent of calories to determine recommended total fat level
and 10 percent of calories to determine saturated fat:1960 kcal X 0.30 = 588 kcal1960 kcal X 0.10 = 196 kcal
• Step 3: Convert to grams of fat (all labels and nutrition information areprovided in grams). There are 9 kcal in every gram of fat.
588 kcal ÷ 9 = 65 gm of fat196 kcal ÷ 9 = 22 gm of fat
• Step 4: Using basic exchanges (below) and actual nutrition data, you can planmenus to meet Ryan’s total fat and saturated fat goals.
• Step 5: You might plan a day’s menu for Ryan like the one on the following pagefrom the NCEP.

Childhood & Adolescent Nutrition 61
As you can see, lowering cholesterol in our kids is a challenging but criticallyimportant public health goal. Improving nutrition intake and eating habits in thispopulation will pay big dividends for our nation’s future health and well-being forgenerations.
Although there has been a reduction in coronary heart disease mortality rate overthe past two decades, the condition still remains the number one cause of death in theUS. Preventing or slowing down the development of cardiovascular disease early in lifethrough dietary modification can extend the years of healthy living for our children.
Health professionals need to work more closely with families who have childrenthat are at risk for developing CVD due to genetic factors. According to one study,children who are at high risk for CVD based on family history are not eating a diet thatis heart-healthier than those at low risk for CVD (Kelley, 2004).
Basic Exchanges
FAT (grams): Breads 0Fruits 0
Vegetables 0Fish,Chicken, Meats 3,5,7+ (Depending on the cut)
Dairy 0 Nonfat2–3 1% or low-fat
5 2% or reduced fat10 Whole
Fats 5
SATURATED FAT (gm): The following are useful rules of thumbto estimate saturated fat from total fat.
Saturated Fat: (Approximate portion of fat that is saturated.)Dairy 1/2
Meat 1/3 to 1/2
Poultry, Baked Goods 1/3

Childhood & Adolescent Nutrition 62
REFERENCES
Aldrich CA and Aldrich MM. Feeding Our Old-fashioned Children, MacMillan, Inc., New York, 1946.__________ American Academy of Pediatrics-Statement on Cholesterol. Pediatrics, 101(1):141-147, 1998.American Academy of Pediatrics, Committee on Nutrition, Pediatric Nutrition Handbook, 6th Ed. Elk
Grove, IL, 2009.American Heart Association. Trans Fats. Retrieved from www.americanheart.org/
presenter.jhtml?identifier=3045792 Accessed 2/7/10.Daniels SR, Greer FR and the Committee on Nutrition. Lipid screening and cardiovascular health in
childhood. Pediatrics, 122(1): 1980208, 2008.Franklin FA, Brown RF and Franklin C. Screening, Diagnosis and Management of Dyslipoproteinemia in
children. Endo Met Clin N Am, 19:2, June 1990.__________ American Heart Association. Heart and Stroke Statistics 2010 Update. A Report from the
American Heart Association. Retrieved from the American Heart Associationwww.americanheart.org/presenter.jhtml?identifier=1200026
__________ American Heart Association. Cardiovascular health in childhood. Circulation, 106:143-160, 2002.__________ American Heart Association. Guidelines for primary prevention of atherosclerotic cardiovas-
cular disease beginning in childhood. Circulation, 107:1562-1566, 2003.Kelley C, et al. Dietary intake of children at high risk for cardiovascular disease. J Am Diet Assoc, 104:222-
225, 2004.
Breakfast at Home: Orange juice (1/2 cup)Oatmeal w/maple & brown sugar (1 pkt)1% milk (1 cup)
School Lunch: Oven fried chicken (2 oz)Mashed potatoes (1/2 cup), green beans (1/2 cup),Canned pears (1/2 cup), 1% milk
Snack at Home: Turkey sandwich:Bread (2 slices), turkey luncheon meat (11/2 oz)Low-fat cheese (1 oz), lettuce, tomato, pickle &mayonnaise (1 tsp)Cola drink (1 can)
Dinner at Home: Tuna macaroni casserole* (1 serving)Carrots & peas (1/2 cup), roll (small)Margarine (1 tsp), applesauce (1/2 cup)Water
*Stick margarine used for food preparation
Snack at Home: Oatmeal cookies, commercial (4 med), 1% milk (1 cup)
Calories .................. 2005Fat, % kcal ..................... 29
SFA, % kcal ..................... 11Cholesterol, mg .................... 188
Sample Menu
Childhood & Adolescent Nutrition 63
Lauer RM and Clarke WR. Use of cholesterol measurements in childhood for the prediction of adulthypercholesterolemia. JAMA, 264: 23, 3034-38, 1990.
Lauer RM and Clarke WR. (published letter). JAMA, 265: 24, 3248, 1991.National Cholesterol Education Program Highlights. NHLBI Information Center, Bethesda MD, April
1991.National Restaurant Association Crest Special Study, per NCEP Expert Panel Report, 1988.Newman TB, Browner WS, et al. (published letter). JAMA, 265: 24, 3249, 1991.__________ Position of the American Dietetic Association: Dietary Guidance for healthy children aged 2 to
11 years. J Am Diet Assoc, 104:660-677, 2004.Strong JP. Coronary arteriosclerosis in soldiers, a clue to the natural history of atherosclerosis in the
young. JAMA, 256, 2563-66, 1986.Struhldreher WL, Orchard TJ, et al. (published letter). JAMA, 265: 24, 3247, 1991.Summary of the Second Report of the National Cholesterol Education Program (NCEP) Expert Panel on
Detection, Evaluation, and Treatment of High Blood Cholesterol in Adults (Adult Treatment PanelII). JAMA, 269:23, 3015-3022, 1991.
Tamborlane W (editor). The Yale Guide to Children's Nutrition. Yale University Press. New Haven, CT, 1997.United States Department of Health and Human Services. 2008 Physical Activity Guidelines for Ameri-
cans. Be Active, Healthy and Happy! 2008.Weidman W, Kwiterovich P, et al. Diet in the healthy child. Circulation, 647: 411-414, 1983.Wynder EL, Ed. Coronary artery disease prevention: cholesterol, a pediatric perspective. Prev Med, 18(3):
323-409, 1989.

Childhood & Adolescent Nutrition 64
Notes
Childhood & Adolescent Nutrition 65
Chapter Seven:Obesity, Overweightand Eating Disorders
Childhood obesity is reaching epidemic proportions and action to control it mustbe taken now. Obesity is the most prevalent nutrition-related disease of children andadolescents in the US. By all indications, the current generation of children will growinto the most obese generation of adults in US history.
Several chronic diseases accompany obesity. Obese children have a greater risk forType II diabetes, hypertension and cardiovascular disease. Chronic diseases once onlyseen in adults are now being seen in children.
The CDC definition for overweight is a BMI between 85th and 95th percentile;obesity is defined as BMI greater than 95th percentile. Although the 95th percentile isconsidered as being obese, technically the term obesity refers to an excess in body fatrelative to lean muscle mass. BMI measures how heavy the body is and not the propor-tion of fat to muscle. BMI does correlate to body fat, but it is not perfect. The BMImeasurement should only be considered as a way to screen for obesity. It is possible thatan athletic child can be at the 95th percentile and not be obese because the child’s extraweight is lean body mass, not fat.
Skinfold thickness measurements at several sites may give a better indication of“overfat.” However, there is concern about the consistency of techniques in taking thismeasurement. Weight measurements are more consistent. When skinfold measurementsare used, body fat of 25 percent or more for boys and 30 percent or more for girls isdefined as obese.
The Centers for Disease Control and Prevention report a prevalence of childhoodoverweight of 33.3 percent and childhood obesity of 17 percent for children between 6and 11 years of age, based on the 2003-2006 National Health and Nutrition ExaminationSurvey (NHANES) data. It is alarming to see the change in the prevalence of obesity inchildren when comparing the 1971-1974 NHANES I data to the 2003-2006 NHANES

Childhood & Adolescent Nutrition 66
data. The prevalence of obesity for children between 6 and 11 years, in the 1971-1974NHANES I was only 4 percent! (CDC, 2009 and CDC, 2010).
Based on the 2003-2006 NHANES data, the prevalence of obesity for 2- to 5-year-oldsand 12- to 19-year-olds is 12.4 and 17.6 percent respectively. It is sad to note when theHealthy People 2010 was released the childhood obesity rate was 11 percent and the goalwas to reduce the rate to 5 percent. Instead the rate has climbed.
Data from the 2003-2006 NHANES study indicates that there are substantial racialand ethnic differences as shown in the chart below (CDC, 2010). Black females andMexican American males are at particularly high risk of being overweight.
During the past three decades society has changed dramatically which couldcontribute to the increase in the rate of childhood obesity. These changes include bothparents working outside the home and working longer hours, changes in the schoolfood environment, and more meals eaten outside the home. In addition, the use ofcomputers and video games, along with television viewing, often occupy a large per-cent of children’s free time and potentially influence the levels of physical activity forchildren (Institute of Medicine, 2005).
Prevalence of Obesity by Age and Ethnic Group, %
Children - All ages 2 to 19 Females MalesAll ethnic Groups 15.5 17.1Non-Hispanic White 13.6 15.6Non-Hispanic Black 24.1 17.4Mexican American 18.5 23.2
Children Aged 2 to 5Non-Hispanic White 10.2 11.1Non-Hispanic Black 16.6 13.3Mexican American 14.5 18.8
Children Aged 6 to 11Non-Hispanic White 14.4 15.5Non-Hispanic Black 24.0 18.6Mexican American 19.7 27.5
Children Aged 12 to 19Non-Hispanic White 14.5 17.3Non-Hispanic Black 27.7 18.5Mexican American 19.9 22.1

Childhood & Adolescent Nutrition 67
HEALTH RISK
The most widespread consequence of childhood obesity is psychosocial. Over-weight children and adolescents tend to have low self-esteem and poor body image.Many are laughed at, teased or shunned by peers. They may be stereotyped as beinglazy or lacking self-discipline.
Several studies have shown that children at a young age discriminate againstoverweight children. Preference tests have demonstrated that 10- to 11- year-old boysand girls prefer as friends other children with a wide variety of handicaps to childrenwho are overweight. Overweight children are ranked lowest as those with whom theywould like to be friends.
Overweight children tend to mature younger and often are taller than non-over-weight peers. Adults who do not know the age of overweight children often assume theyare older than their chronological age and treat them accordingly. A child usually cannotlive up to the adult’s expectations. This may cause frustration and a sense of failure.
In addition, well-intentioned adults pressure children to lose weight, which doesnot help the problem and can be counterproductive. This pressure can lead to the childdeveloping eating disorders or an obsession with weight. A cross-sectional study of 7- to13-year-old children found that almost half were concerned about their weight, morethan one third had tried to lose weight, and almost one in 10 manifested some type ofdisordered eating. Among older morbidly obese girls, binge eating disorder (BED)occurred in about 30 percent of the patients.
Obesity for adults is a significant health risk factor and this is also true for children.Approximately 300,000 US deaths a year currently are associated with obesity, com-pared with more than 400,000 deaths a year associated with cigarette smoking. The totaldirect and indirect cost attributed to overweight and obesity amounted to $117 billion inthe year 2000.
In the past it was thought that the primarily health risk of overweight in childrenwas the probability that obesity would continue into adulthood, which would putchildren at risk for a variety of chronic diseases. But that has changed. Pediatricians arenow treating children with “adult-type” health problems including impaired glucosetolerance, type 2 diabetes mellitus, elevated blood cholesterol and hypertension. Forchildren born in the United States in 2000, the lifelong risk of being diagnosed withdiabetes at some point in their lives is estimated at 30 percent for boys and 40 percentfor girls (Institute of Medicine, 2005).
One study examined the trend of obesity-associated diseases in children andrelated it to economic cost (Pediatrics, 2002). From examining hospital discharge recordsfrom 1979-1981 to 1997-1999, the researchers concluded that discharges of diabetes forchildren nearly doubled (from 1.43 percent to 2.36 percent), gallbladder diseases tripled(0.18 percent to 0.72 percent) and sleep apnea increased five-fold (0.14 percent to 0.75percent). The study concluded that obesity-associated annual hospital costs for childrenincreased three-fold, from $35 million in1979-1981 to $127 million during 1997-1999.

Childhood & Adolescent Nutrition 68
How fat is distributed on the body can indicate what health problems children areat risk for developing. If the fat is concentrated around the abdomen, the child mayhave a greater chance of developing cardiovascular disease and other problems at ayounger age.
Early puberty is another, largely unrecognized, risk of obesity. The age of pubertyfor American boys and girls has been dropping steadily during the last 100 years. Thereis evidence that high body fat and sedentary living are associated with this trend.
Instead of reaching menarche at age 15 or 16 and their adult height at 20 to 21years, as they did in 1900, American girls now reach menarche at an average of 12.8years and complete their growth by age 16 to 18 (Berg, 1997).
Early puberty means girls can get pregnant sooner and it also may be related tohigher rates of reproductive cancers later in life. Puberty onset is more closely related tosize, weight and percent of body fat than to age.
RISK FACTORS RELATED TO OBESITY
Several risk factors exist that correlate to obesity and other related conditions inadulthood. Childhood obesity itself is a risk factor for adult obesity. The following tablelists other potential predictors that exist.
BIRTH AND INFANCY
A correlation exists between birth weight and obesity. Low-birth weight (LBW)have greater risk for obesity. Low-birth weight is defined as less than 3000 gm. Con-versely, large for gestational age (LGA) infants also have an increased risk for obesity.One potential cause for developing obesity and related conditions could be intrauterineinsulin resistance for LBW and hyperinsulinemia for LGA infants.
• Bottle- vs. breast-feeding. Studies suggest infants breastfed for more than fourmonths have decreased risk of becoming obese. It is believed that because babiescan regulate their own intake when breastfed — instead of an adult encouragingthem to "finish the bottle" — that breastfeeding is better in preventing the devel-opment of obesity. Of course, besides obesity prevention, there are many impor-tant health reasons a baby should be breastfed.
Possible Predictors of Obesity
Birth weight Infancy weight Bottle vs. breast feeding Age of solid food introduction Infant feeding problems

Childhood & Adolescent Nutrition 69
Understanding cues of satiety is important for caregivers of both breastfed andbottlefed infants. Caregivers should be strongly encouraged to hold the bottlefedinfant with every feeding.
Recent studies have shown a correlation between the flavors of foods from themother’s diet during breastfeeding and the child’s acceptance of these foodflavors later (Savage, et al., 2007). This is an especially interesting area of researchas consumption of certain foods, such as vegetables, are encouraged as a preven-tive strategy to reduce obesity.
The American Academy of Pediatrics Policy Statement of Breastfeeding andthe Use of Human Milk states “breastfeeding should be continued for at least thefirst year of life and beyond for as long as mutually desired by mother and child(2005).”
• Age of solids introduction. It was believed that kids who got solids too earlywere perhaps overfed and not as able to regulate their own satiety. There is noproven correlation between the age for introduction of solids and adult over-weight. The American Academy of Pediatrics recommends four to six months asthe right age for introduction of solid foods (Ped Nut Handbook, 2009).
• Infant feeding problems. Data about obese teenagers shows that a very highpercentage of them had feeding problems during the first year of life. Many hadbeen hospitalized or did not grow the way they should.Feeding problems are often family problems. If we monitor infants with feedingproblems through the various stages of childhood, we may be able to impacttheir family food behaviors in such a way as to prevent adult obesity. To answerthe question simply, conditions in infancy are not predictors of adult overweightand obesity, but should be viewed as suspicious.
CHILDHOOD
Being obese in childhood begins to be more of a predictor of adult obesity. A 2-year-old with a BMI over the 95th percentile has an increased risk for being an obeseadult than a 2-year-old that is not obese (AAP, 2009).
The National Health and Nutrition Examination Survey (NHANES II) determinedthat from 25 to 75 percent of overweight kids become overweight adults. Most obese 6-to 11-year-olds were still overweight or obese 4 to 11 years later, and 50 percent stayedobese in adulthood.
ADOLESCENCE
How about teenagers? If you have an overweight teenager, is he likely to becomean overweight adult? The answer is, essentially, yes; 80 to 85 percent of kids who areoverweight as teenagers will be overweight adults.

Childhood & Adolescent Nutrition 70
As kids get older, overweight becomes more of a predictor of adult obesity, asshown in the chart above. Also, the degree of obesity seems to be a greater predictorfrom infancy onward. That is, the more overweight the infant, child, or teenager is, themore likely he will become an overweight adult (Pipes, 1993; Mahan and Reese, 1984).
OTHER FACTORS
• Genetics. If neither of the parents is obese, the likelihood of being obese is only10 to 15 percent. If one of the parents is obese, the child has a 40 percent chance of beingobese. If both parents are obese, the risk factor increases to 80 to 85 percent. This infor-mation alone does not prove genetics is a determining factor, because parents also haveinfluence and control over many aspects of their children's eating patterns.
However, some studies show that genetics does play a role, independent of envi-ronment. Adopted kids have been found to have fat distribution more like their biologi-cal parents, with whom they’d never lived, than their adoptive parents, who had influ-enced their eating habits.
In even more recent studies the general conclusion reached is that as much as 30 to40 percent of the variation in US body mass indices is explained by genetic factors (Pi-Sunyer, 2005). Stunkard’s (1990) work on twins comparing those reared together withthose reared apart confirms genetics is an important factor.
A number of identical twin and animal studies also confirm a relationship betweengenetic factors and obesity. Although genetics is proving to be a pretty strong compo-nent in obesity, it doesn’t mean we can’t do something about it. In fact, it can helpidentify the need for early intervention in those children at high risk for adult obesity.
It is clear that we do inherit a certain body type. For example, some teenage girlsare naturally slender and tall while some have more of an athletic build. Frequently theteenager matches the biological parent’s body type. It is important that teenagers under-stand the role of genetics and accept their natural body type.
Predictors of Adult Obesity
• Infancy Weight: 2–10 %• Childhood Weight: 25–75 %• Adolescent Weight: 80–85 %• Exercise / Activity• Genetics
# OBESE PARENTS RISK OF ADULT OBESITY0 .............................................10–15 %1 ............................................... 40 %2 ..............................................80–85%

Childhood & Adolescent Nutrition 71
For certain people, a size 14 may be their natural body size even with healthyeating and exercise. If we don’t coach young people on this concept, we are setting themup to develop eating disorders.
Also, society's standard of what is considered “thin” or “heavy” changes. Whatwas attractive in the 1950s is considered fat today: Marilyn Monroe, for example, was5'2" and weighed 140 lb. She would be considered pudgy by today’s standards.
• Physical Activity. Exercise and physical activity have a profound effect on howmuch energy the body burns. As activity increases, the body develops more muscle —metabolically active tissue — thereby increasing the amount of energy burned duringand after exercise. A child who is inactive may not be eating too many calories, butburning too few. This is an important distinction to make. Lowering calories in a physi-cally inactive child might cause nutritional inadequacies. A certain caloric level must bemaintained to ensure adequate nutrient intake.
Physical activity is believed to have declined during the past decade. The currentgeneration of children may be the most sedentary in our history. Neighborhoods areconsidered unsafe, so more children stay indoors, watching television, playing videogames and surfing the Internet. Starting in adolescence, physical activity declines 7.4percent per year for girls and 2.7 percent per year for boys. A Harris poll found thatabout 25 percent of children do not participate in any regular physical activity.
In addition, schools are cutting physical education programs. In 1995 only 25percent of school children attended daily physical education classes. In addition, ourmodern lifestyle has contributed to the decline in physical activity by providing moreopportunities to be sedentary and fewer demands to be even moderately active.
Watching television and other sedentary screentime activities are predictors ofobesity. The more time a child spends watching TV, the less time he or she spends doingsomething more active. Some television commercials promote eating and influencechildren’s snack preferences. Over one-fourth of children report watching four or morehours of television per day. Children should watch no more than two hours per day.
Preschool children should receive one hour per day of both structured and un-structured activities. Preschool children should be encouraged to “play” to reach theirphysical activity requirements. Kicking a ball outside, climbing on the playground andrunning are examples of active play. Visit MyPyramid for Preschoolers for more infor-mation on physical activity:
<www.mypyramid.gov/preschoolers/PhysicalActivity/index.html>
The US Dept. of Health and Human Services released Physical Activity Guidelinesin 2008. Children 6 to 17-years-old should be active 60 minutes per day, and mostshould be moderate or vigorous exercise. On a scale of 1 to 10, moderate is considered a5 to 6; vigorous activity is 7 to 8. The 60 minutes of physical activity per day shouldinclude aerobic, muscle-strengthening and bone-strengthening activities. Examples ofeach type of activity include running (aerobic), climbing (muscle-strengthening), andjumping rope (bone-strengthening).

Childhood & Adolescent Nutrition 72
• Psychosocial issues. There’s a higher incidence of psychosocial problems inchildren who are obese. Parent/child interactions are often problematic. An obese childtends to be an only child, or the youngest child, or an unwanted, unplanned child.
Psychological traumas also seem to be higher in populations of obese children.Hospitalization incidence is higher, particularly for very overweight kids. Also there area number of studies that suggest traumatic separation from mothers during early feedingis related to obesity in children (Pipes, 1993). Health care professionals should be con-scious of the psychosocial problems that have been found in this group.
• Environmental factors. The prevalence of obesity is higher in children who growup in urban settings. Children raised in families of low income also are at increased riskof obesity. Access to affordable physical activity opportunities and nutritious food areneeded to reduce risk of obesity in both children and adults. The Centers for DiseaseControl and Prevention released Recommended Community Strategies and Measurements toPrevent Obesity in the United States in 2009. The document lists several strategies a com-munity could implement to impact obesity rates. To view the full report visit:
<www.cdc.gov/mmwr/pdf/rr/rr5807.pdf>
An Expert Committee was convened in 2005 to revise the childhood obesity recom-mendations. The resulting report is entitled Expert Committee Recommendations Regardingthe Prevention, Assessment, and Treatment of Child and Adolescent Overweight and Obesity:Summary Report. Strategies are shown below.
Recommended Strategies to Prevent Childhood Obesity
Obesity Prevention Recommendations:1. Reduce sugar-sweetened beverage consumption2. Consume recommended amounts of fruits and vegetables (9 servings per day;
adjusting serving size for age)3. Limit screen time and television time to no more than 2 hours per day. Recom-
mendation also includes removing all televisions from a child’s sleeping quarters.4. Include breakfast in the daily meal plan.5. Limit eating at restaurants, especially those serving foods that are energy-dense.6. Eat meals together as a family.7. Reduce portion sizes.8. Eat a calcium-rich diet.9. Eat a high fiber diet.10. Balance the intake of protein, carbohydrate and fat to meet the Dietary Reference
Intake (DRI) for each.11. Encourage breastfeeding exclusively for 6 months and continuing to follow the
breastfeeding recommendations from the American Academy of Pediatrics.12. Promote 60 minutes of physical activity every day (moderate to vigorous)13. Reduce intake of energy-dense foods.
(Barlow, et al., 2007).

Childhood & Adolescent Nutrition 73
TREATING OVERWEIGHT CHILDREN
The best treatment is prevention. Establishing a positive food environment early isvital, particularly if family history indicates overweight may be a problem. The NumberOne Rule to teach parents is: Don’t create a home environment that encourages a child to overeat.
There is a growing focus in this country on the quality of parenting, and in treatingchildren as part of family systems. Probably, the optimal approach to overweight wouldbe a family-oriented program that provides healthy lifestyle training and addressesways of communicating, coping and meeting emotional needs.
Healthy families will foster positive, healthy food and exercise choices. Programsfocused on fostering healthy life-styles in families can make an exciting difference. Inaddition to decreasing obesity, healthy lifestyle programs decrease substance abuse andchild abuse, as well as lowering heart attack and stroke rates.
Appendix #7 contains general guidelines for obesity treatment programs.Unfortunately, most of what we do is damage control, working with children who
have been identified as having a problem. Here, too, practitioners need to look at thewhole family. Kids aged 12 and under don’t have as much control over their food astheir parents do, so the parent must become involved in the treatment. While parentalsupport is important for teenagers, they have to become involved in treatment for it tobe effective. Remember, the longer they remain obese, the more likely they are to beoverweight adults. Their food behaviors are pretty well ingrained by adolescence.
Obese teenagers often have physical problems that need the attention of a nurse orphysician. A physical examination and any indicated lab work should be done at theonset of treatment.
It’s best to have a psychologist working with children and teenagers. These kids areoften depressed. They’ve perhaps been mistreated by their peers. It’s impossible to dealwith food intake and activity until the psychological issues — depression and poor self-esteem — are dealt with. A psychological evaluation will assist in assessment.
Also, of course, you need a dietitian experienced in weight control. The dietitian isresponsible for a complete assessment: motivation, family situation, medical history,support systems, social situation, interactions with peers, mental abilities, school perfor-mance, activity level, clinical and anthropometric data.
There are several issues that should be addressed in childhood obesity programs and itis important that the entire family become involved especially for children under 12.
Childhood obesity programs are not “diets.” Diets have a 95 percent failure rate.Children should not be on diets; it just sets up a cycle of failure. If adults can’t diet, whyshould we expect children to? A colleague reported having seen a lot of morbidly obeseadults who had very early periods of restrictive dieting. They said that they were put onreducing diets when they were 6 or 8 years old; that as long as they can remember theyhave been “on a diet.”
A parent should not withhold food from a child in order to help him lose weight,according to a publication by the University of California Cooperative Extension.Restricting a child’s eating can hurt rather than help.

Childhood & Adolescent Nutrition 74
When a child is made to go hungry, he may become preoccupied with food —when food is available, he may overeat out of fear of going hungry again. Instead,children should be encouraged to learn to eat until just satisfied, and then stop. Chil-dren need to let their bodies’ hunger cues tell them when hunger has been satisfied, andwhen it’s time to stop eating. Parents should never tell children to “clean their plate.”
It is important that regular meals and planned snacks be part of the family’s rou-tine. Irregular meals and uncontrolled snacking can lead to weight problems by causingunintentional overeating. A routine pattern of eating seems to help children and adultsregulate their food intake so hunger is satisfied without overeating.
There is no reason to put an overweight child on a “special” diet containing differ-ent foods from the rest of the family. Children’s food preferences may be shaped byobserving what their parents and older siblings eat. For this reason, parents need toexamine their own eating habits. If adults skip meals and grab high-fat snacks whenhungry, a child will be inclined to mimic this behavior.
The most successful childhood obesity programs are designed to develop healthyeating habits that will last a lifetime. They teach children and their families to choosefoods wisely, to handle food in social situations, to explore the personal meanings offood, and to develop skills that make dieting unnecessary.
Another essential component for success is to increase the level of physical activityto the recommended level of 60 min. per day. Youth are more likely to achieve this goalif they experience movement as fun and noncompetitive. Select activities they can enjoydoing at their own pace, and that they can share with peers or family members. Encour-age them to become more active in their daily routine such as walking or biking to andfrom school or doing household chores. Replacing sedentary behaviors like watchingTV, playing video games, or using a computer, to increase energy expenditure. TheAmerican Academy of Pediatrics now recommends limiting television and video timeto a maximum of two hours per day (Kirk, et al., 2005).
Group support can be an effective approach with older children and teens becauseof the importance of peer pressure. Groups also have the positive benefit of assistingwith self-esteem issues; the child realizes he is not bad, wrong, shameful or alone withthe problem. Groups can be a very positive means of influencing and supporting long-term life-style changes.
SETTING GOALS
When working with an obese 6- or 8-year-old, the goals for treatment should not beweight loss. Children who have not gone through their prepubescent growth spurtshould not be put on a weight-reduction diet. There may be some special cases — medi-cal indications, etc. — but almost categorically we do not want children to lose weight.
Rather, during this time, we want them to maintain their current weight or slowtheir rate of weight gain. Their growth curves have been going straight up — their weightis increasing beyond proportion to their height. We want to slow down the rate of weightgain, or perhaps maintain their weight where it is, until their height can catch up.

Childhood & Adolescent Nutrition 75
Remember, when they go through their growth spurt, they will put on a pound amonth. That’s essentially normal growth for a child — some gain even more. Restrictingfood or calories can compromise the growth period. You can put them in a calorie deficitso severe they can’t even sustain maximal height growth. Children should have enoughcalories so they can “grow into their weight.”
Teenagers’ goals are different, depending on whether the teen has attained fullstature or not. Evaluate how much growing they have left to do. Where do they fall on theheight/weight charts? What growth has occurred in the past? How tall are the parents?
Check the growth history of the teen, looking for growth spurts as well as presentgrowth. Intervention goals should be based on the growth information. If there is amajor doubt about growth, bone studies can be done. In some cases, where most of thegrowth has been achieved, it may be appropriate for the teen to take off some pounds,especially girls who have already gone through their muscle growth spurt. If so, theweight loss should be slow and gradual.
Many teenagers make the decision to go on a diet without guidance from a healthcare professional. According to the 2003 Youth Risk Behavior Surveillance System of theCenters for Disease Control and Prevention, over 59 percent of females and 29 percent ofmales in grades 9 to 12 were trying to lose weight during the 30 days preceding thesurvey. Over 18 percent of girls and 8 percent of boys had gone without eating for 24hours or more to lose weight. In female adolescents, 11.3 percent had used diet pills and8.4 percent had vomited or taken laxatives to lose weight in the past 30 days. The goodnews is that the survey also showed some teens were using healthier methods to loseweight or keep from gaining weight — 56.2 percent of the teens ate less food, fewercalories, or foods low in fat, whereas 65.7 percent exercised. Unfortunately, dieting hasnot improved the prevalence of adolescent overweight. In fact, some research suggestsdieting may be a predictor or a risk factor for developing an eating disorder (Spear, 2006).
EXPERT COMMITTEE RECOMMENDATIONS
The Expert Committee report referred to earlier also includes recommendations fortreatment of childhood obesity (Barlow, et al., 2007). The recommendations are in astaged approach. Stage 1 lasts approximately 3 to 6 months and then advanced to stage2, if needed. Motivational interviewing techniques are recommended.
Stage 1: Stage 1 is basically the prevention recommendations listed above withmore specific recommendations. Families work with the provider to set specificprevention goals based on the family’s individual circumstances. For example, ifa child eats a fast food meal 5 times per week, the goal may be to reduce it totwice per week. Up to three goals may be set at the first session and added toover time. The family is monitored through follow-up visits. This stage is becompleted by a medical provider.
Stage 2: During this stage, planned meals and snacks are provided by a registereddietitian. Screen time is further reduced to 1 hour per day and the 60 minutephysical activity recommendation continues. Daily logs are kept by the child andreinforcements are encouraged for meeting behavior goals.

Childhood & Adolescent Nutrition 76
Stage 3: The structured diet continues during this stage. A healthcare team is usedfor this stage and includes a registered dietitian, behavior specialist and a physi-cian. Frequent monitoring occurs during stage 3.
Stage 4: Referral to a tertiary care center is completed for stage 4. This stage islimited to older children who have not had success with stages 1 through 3, andcontinue to have a BMI greater than 99th percentile.
The Nutrition Dimension course Preventing Childhood Obesity offers exercise pro-grams and guidelines.
EATING DISORDERS
With the rising rates of obesity and the media’s promotion of super-thin models, itis not surprising that the incidence of eating disorders has increased. There are threemajor types of eating disorders: anorexia nervosa, bulimia and binge eating disorder(BED). It is important to note that the symptoms in the same person may change fromone disorder to another.
The number of individuals affected by eating disorders is unknown, as the condi-tion may exist for a considerable time period before it is detected. Because of thesensitive and secretive behaviors associated with eating disorders, many cases gounreported. The greatest frequency of eating disorders is among young adult women,affecting 3.2 percent of women between 18 and 30 years of age. Although eatingdisorders are less common among men, they have similar effects. Gay men are poten-tially at greater risk than heterosexual men for eating disorders based on a studyexamining eating practices and body satisfaction.
The incidence of eating disorders among athletes, both male and female is esti-mated at 10 to 20 percent, with bulimia nervosa the most frequently reported disorder.In addition, people who seek treatment for weight control seem to suffer from bingeeating disorders at a higher rate than the general population, which may be as high as50 percent of those seeking treatment (J Am Diet Assoc., 2006).
While being overweight carries health risk, some eating disorders, like anorexianervosa, can be deadly and take but a few years to kill. An estimated 10 to 15 percent ofanorexia nervosa patients die of their illness. And for those who survive, the road torecovery is difficult. For many there are irreversible physical and mental changes due tomalnutrition and purging. About 44 percent have overall good recovery while 31 per-cent are intermediate and 25 percent have a poor outcome.
The key to successful treatment of eating disorders is early diagnosis and treatment.Since eating disorders take a great amount of time and concentration, this takes awayfrom time for other relationships and normal activities. In addition, psychiatric disor-ders are frequently seen in the eating disorder population and they include mood andanxiety disorders (e.g., depression, obsessive compulsive disorder), personality disor-ders, and alcohol or drug abuse. Suffers lose energy, irritate easily, find themselveslonely and driven to keep their disorder a secret.
Childhood & Adolescent Nutrition 77
Eating disorders usually consist of two sets of disturbances, as described in Afraidto Eat (Berg, 1997). First are those related to food and weight, and second, those con-cerning relationships with oneself and others. The problems are extremely complex,rising out of both emotional problems and eating disturbances, within a culture thatputs great emphasis on thinness and appearance.
Some problems may be rooted in families that are overly controlling or disen-gaged, or who are having problems they are unable to acknowledge or deal withopenly. Puberty is frequently a critical time. Often sexual abuse or trauma will be aninitiating event.
Detailed information on eating disorders diagnosis, causation and treatment canbe found in the Nutrition Dimension courses Weight Control & Eating Disorders andTreating Eating Disorders.
ANOREXIA NERVOSA
Anorexia nervosa is characterized by extreme weight loss, amenorrhea and an arrayof psychological problems including low self-esteem, confused identity, distorted bodyimage, and fear of becoming an independent individual. An extremely malnourishedperson may display symptoms of apathy, confusion, shallow affect (a psychological termthat can be defined as “having a flat or non-reacting personality”) and social isolation.
The Diagnostic and Statistical Manual of Mental Disorders, (DSM-IV-tr) (Am PsychAssoc, 2000), lists diagnostic criteria for anorexia nervosa as:
• Refusal to maintain body weight at or above a minimally normal weight for ageand height, e.g., weight loss leading to maintenance of body weight less than 85percent of that expected; or failure to make expected weight gain during periodof growth, leading to body weight less than 85 percent of that expected.
• Intense fear of gaining weight or becoming fat, even though underweight.• Disturbance in the way in which one’s body weight, size, or shape is experi-
enced, undue influence of body weight or shape on self-evaluation, or denial ofthe seriousness of the current low body weight.
• Amenorrhea. Absence of at least three consecutive menstrual cycles. A woman isconsidered to have amenorrhea if her menstrual periods occur only after admin-istration of hormones, such as estrogen.
Anorexia nervosa is divided into two specific types:• Restricting type: During the episode of anorexia, the person does not
regularly engage in binge eating or purging behavior (i.e., self-induced vomitingor the misuse of laxatives, diuretics, or enemas.)
• Binge eating/purging type: During the episode of anorexia nervosa, theperson regularly engages in binge eating or purging behavior.
The diagnostic criteria make anorexia fairly easy to recognize — once we suspectthe child has a problem. People with anorexia are the greatest dissemblers — they have

Childhood & Adolescent Nutrition 78
this secret that they keep well hidden until the signs are so unmistakable that even themost unaware person can see them.
The prevalence of anorexia nervosa has been reported to be 0.3 percent. Sub-threshold anorexia nervosa (missing one definitive criteria of the full-blown syndrome)seems to occur more frequently, ranging from 0.37 to 1.3 percent of the population. Thepeak age for onset is 15 to 19 years. A significant level of risk attributable to genetics (56percent) indicates the important role biology plays with this disorder.
The anorexic has an intense and unfounded fear of becoming fat. Generally, ananorexic is a young female, previously chubby, a model student from a high- to middle-income family. She has an interest in meal planning and cooking — perhaps does a lotof cooking but doesn’t eat what she cooks. She’s a very picky eater — often her mothersays “I’m sick of feeding her! I’m so tired of her complaining about my food all thetime.” She’s very nutrition-conscious and never satisfied with food.
The disorder usually starts with some kind of diet. Her whole life is arrangedaround her diet. We’ll see changes in her eating habits: first, potato chips, coke, andsweets; then a vegetable phase. When she begins to lose weight, there’s often an emo-tional withdrawal. She’ll pull away from friends; maybe she used to be social, but nolonger. She may show a marked decrease in school performance.
The most important sign is refusal to maintain body weight. A loss of more than 15percent of original body weight is a definite indication of anorexia. But don't wait untilthey lose this much weight — particularly teenagers or preteens in their growth years.
Anorexics show no known medical illness leading to weight loss. Any severereduction in body weight — particularly during the years when the child or teenagershould be gaining and growing — is cause for concern. First, rule out any physicalcauses. Have any child or teen evaluated for weight loss if it is dramatic with no physicalexplanation. With anorexia, the prognosis gets worse the longer the disease progresses.
Anorexics develop a distorted body image — they believe they are fat eventhough they are emaciated. This is really shocking if you’ve never seen it: emaciatedpeople drawing pictures of themselves with big stomachs — that’s how they seethemselves. This is a clue that there is a problem: if a normally-built young girlcontinually calls herself fat, that should be a danger signal.
Food behaviors, too, can tip you off. Some are:• Restricts fats and protein• Eats mostly vegetables and fruits• Has high fluid intake• Craves spices• Eats slowly• Cuts food into small pieces• Denies hunger• Throws food away
Of course, the most noticeable behavior is refusal or inability to eat sufficientcalories.

Childhood & Adolescent Nutrition 79
Usually the disease is triggered by some type of trauma — a breakup with a boy-friend, relocation, divorce or death in the family, perhaps incest or abuse. The issuesmanifest as intense control of their bodies. One way you can control your environmentis to control your body. No one can force a person to eat when they refuse to do so.
HEALTH CONSEQUENCES OF ANOREXIA
Some complications of anorexia are easily spotted. Most are due to starvation,which has been widely observed and documented in human history. The following chartoutlines how starvation is responsible for the health consequences of anorexia.
• Amenorrhea is a way we often detect anorexia in its early stages. As the percent-age of body fat decreases, hormonal production is altered until it interruptsmenstruation. Eventually menstruation ceases. Sometimes the amenorrheaoccurs even before the girl has lost a substantial amount of weight, becauseemotional stress keeps her from having her period.
• Lower heart rate, low blood pressure, digestive and kidney problems. Therecan be kidney damage and decreased filtration rate of the kidneys, as well asdecreased intestinal motility and resulting constipation.
• Hypothermia. Anorexics always feel cold. That’s one reason they wear bulkysweaters. Not only are they covering up, they’re keeping warm.
• Brain abnormalities. Starvation affects brain functions. Sleep disorders lead totiredness and fatigue.
�
Decreased glucosefor energy
�
Increased use of fatas energy source
�
Increased fat breakdown�
Decreased fat stores�
Decreased % body fat�
Hypothermia, amenorrhea,lack of padding for organs
�
Increased use ofprotein for energy
�
Decreased protein synthesisIncreased lean body mass
breakdown�
Increased destruction of cells�
Electrolyte imbalance�
Tissues used for nutrients�
Wasting of musclesHeart failure
Metabolic Effects of Starvation
LACK OF CALORIES AND NUTRIENTS
Childhood & Adolescent Nutrition 80
Despite dietary inadequacies, vitamin and mineral deficiencies are rarely seen. Thishas been attributed to a decreased metabolic need for micronutrients in a catabolic state.Additionally, many anorexics take vitamin and minerals supplements. Also, despite lowiron intake, iron deficiency anemia is rare. This may be due to decreased needs due toamenorrhea, decreased needs in a catabolic state and decrease in hydration.
Starvation causes a decrease in metabolism by as much as 39 percent. The body istrying to survive by conserving calories.
BULIMIA NERVOSA
Bulimia comes from a Greek term meaning “ox hunger.” Bulimia nervosa is adisorder characterized by recurrent episodes of binge eating, in which large amounts offood are consumed over a short period of time, followed by purging behaviors.
Vomiting, laxatives, diuretics, excessive exercise, and fasting (alone or in combina-tion) are used to rid the body of unwanted calories. The eating episodes are usuallyterminated by abdominal pain, self-induced vomiting, sleep or the appearance ofanother person on the scene. Similar to anorexia nervosa suffers, bulimics are intenselypreoccupied with food, weight and body shape.
Some people in our society occasionally purge after overeating, but not frequentlyenough to qualify for the diagnosis of bulimia nervosa. It is estimated that approxi-mately 10 percent of adolescents occasionally binge and purge. Bulimia nervosa, inwhich such behavior becomes repeated and habitual, occurs in about 2 to 5 percent ofthe general population. The disorder is more common that anorexia.
Although there are reported cases of middle-aged women becoming bulimic in adesperate attempt to lose weight, bulimia begins most often toward the end of highschool, when concerns about weight and sexuality are intense.
The diagnostic criteria for bulimia nervosa, according to the DMS IV TR, are:• Recurrent episodes of binge eating. An episode of binge eating is characterized
by both of the following: eating, in a discrete period of time (e.g., within any 2-hour period), an amount of food that is definitely larger than most people wouldeat during a similar period of time and under similar circumstances, and a senseof lack of control over eating during the episode (e.g., a feeling that one cannotstop eating or control what or how much one is eating).
• Recurrent inappropriate compensatory behavior in order to prevent weightgain, such as self-induced vomiting; misuse of laxatives, diuretics, enemas, orother medications; fasting; or excessive exercise.
• The binge eating and inappropriate compensatory behaviors both occur, onaverage, at least twice a week for three months.
• Self-evaluation is unduly influenced by body shape and weight.• The disturbance does not occur exclusively during episodes of anorexia nervosa.

Childhood & Adolescent Nutrition 81
There are two specific types of bulimia nervosa:• Purging type: the person regularly engages in self-induced vomiting or the
misuse of laxatives, diuretics, or enemas.• Nonpurging type: the person uses other inappropriate compensatory behaviors,
such as fasting or excessive exercise, but does not regularly engage in self-induced vomiting or the misuse of laxatives, diuretics, or enemas.
The most striking feature is the amount of food eaten at one time during the bingecycle. The following chart is an example of foods that might be consumed during atypical binge which can last one to two hours.
One of the early signs is that bulimics tend to be overly concerned about theirweight. They express guilt and shame about eating. Statements about food behaviorscan be a clue to suspect that bulimia is a problem.
Unfortunately, it is difficult to identify bulimics by appearance alone because theyare often at near normal weight. One trait that may identify them is that they frequentlydisappear after meals to secretly purge.
Dental practitioners can diagnose bulimia from characteristic tooth decay or wearpatterns on the teeth from the effects of regurgitating stomach acid. In fact, dentalprofessionals can be the first ones to spot a bulimic, by the erosion of the inner surfaceof the upper teeth, beginning with the molars and moving forward. The front teeth aremost severely damaged.
The teeth become very sensitive to hot and cold. Decay damages the biting surfaceand the person develops a faulty bite. The back of the teeth have been described asbeing as “smooth as glass” because of the erosion. Shortening of the teeth also occurs.
Other health consequences of bulimics who purge include:• The salivary glands enlarge, perhaps due to irritation from vomitus. When
bulimics stop vomiting, the glands return to normal size.• Aspiration is always a possible complication of vomiting. Death from aspiration
of food particles may occur.
Typical Eating Binge
2 lb cookies2 pints of ice cream2 quarts of milk4 waffles1 loaf white bread10 cream-filled cupcakes
1 lb Ritz crackers1 lb crumb cake2 ice cream sandwiches1/2 lb potato salad2 yogurts

Childhood & Adolescent Nutrition 82
• Electrolyte imbalance can easily occur in bulimics. They seldom digest foodcompletely, and often will dehydrate, upsetting delicate balances that are neces-sary to regulate, among other things, brain and nervous system functioning. Aswe noted earlier, disturbances of thought and bizarre behavior are common ineating disorders. Whether the electrolyte disturbances or psychological factorsare to blame is uncertain. In vomiting, you lose a good deal of potassium, whichcan disturb heart activity.
• Lacerations and inflammations of the oral cavity and esophagus can develop. Ifthey make themselves vomit by shoving their hands down their throats, we maysee sores on their knuckles.
LAXATIVES AND DIURETICS
About 27 percent of bulimics use laxatives at least once a day. Laxatives don’tlessen absorption of calories — weight loss is due to fluid loss.
Constipation is a problem because the bulimic becomes dependent on laxativesand experience constipated when they are not used. A severe complication of laxativeabuse is a cathartic colon. Depending on how severe the condition becomes, the prob-lem may not be reversed even if laxatives are stopped.
Diuretics are used, but they have absolutely nothing to do with fat loss. All they dois dehydrate the body. Some of the effects of overuse are fatigue, tachycardia, poor skinturgor, electrolyte balance disturbance and hypokalemia (low potassium levels).
Calcium is lost also through use of diuretics. Diuretic abuse can damage the kid-neys to the point that the patients become very dependent on diuretics.
The often overlooked consequence of eating disorders for children and teenagers isthat nutrition is inadequate for growth. The body is either being starved or the wrongkinds of foods are being consumed.
If a child or teenager is suspected of having an eating disorder, he or she should beevaluated. The sooner the evaluation takes place, the better the chance for a full recovery.The longer the eating disorder exists, the harder it is to treat, and the poorer the prognosis.
TREATMENT PLAN
The nature of eating disorders, with psychological, behavioral, and physiologiccomponents, requires a collaborative approach by an interdisciplinary team of psycho-logical, nutritional, and medical specialists. Psychiatric management, the foundation ofeating disorder treatment, is instituted for patients in combination with other treatmentmodalities. A thorough medical examination performed by a physician familiar witheating disorders helps to address medical issues. A dental examination may also berecommended. Medication management and medical monitoring are the responsibilityof the physician. Psychotherapy is the responsibility of the clinician credential (such as apsychologist, social worker or licensed counselor) to provide psychotherapy.
The Registered Dietitian is responsible for the nutrition assessment and recom-mends and implements therapeutic nutrition interventions (J Am Diet Assoc, 2006).

Childhood & Adolescent Nutrition 83
BINGE EATING DISORDER
It was not until the early 1990s that binge eating disorder (BED) was defined asan eating disorder. Similar to bulimia nervosa, BED is characterized by recurrentepisodes of binge eating but, unlike bulimia, the episode is not followed by some typeof purging behavior. Since individuals do not compensate for their binge eating, theyare usually overweight or obese. Initial studies of this disorder found that it may beginin early childhood.
In many cases individuals who suffer from this disorder eat relatively largeamounts of food even when not binge eating. In contrast to adolescents with anorexianervosa or bulimia nervosa, individuals with BED may only need help to learn to eatless. Parents can help their children to learn to eat appropriate amounts by permittingchildren to choose from a variety of healthful foods and by limiting high-fat and high-sugar snack foods in the house. Parents should model healthy eating behaviors andestablish regular mealtimes.
The diagnostic criteria for BED in the DSM-IV-tr are:• Recurrent episodes of binge eating characterized by both of the following:
– Eating in a discrete period (within any two-hour span) of time, an amount offood that is definitely larger than most people would eat in a similar period oftime under similar circumstances: and– A sense of feeling that one cannot stop eating or control what or how much oneis eating.
• The binge eating episodes are associated with at least three of the following:– Eating much more rapidly than normal;– Eating until feeling uncomfortably full;– Eating large amounts of food when not feeling physically hungry;– Eating alone because of being embarrassed by how much one is eating:– Feeling disgusted with oneself, depressed, or very guilty after overeating.
• Marked distress regarding binge eating• The binge eating occurs, on average, at least two days a week for six months.• The binge eating is not associated with the regular use of inappropriate compen-
satory behaviors (e.g., purging, fasting, excessive exercise) and does not occurexclusively during the course of anorexia nervosa or bulimia nervosa.
“ORTHOREXIA”While it is not identified DSM-IV, “orthorexia nervosa” shoould sound familiar to
anyone working with adolescents. “Ortho” means straight, true or correct; “orexia” meanseating or appetite; “and of course nervosa” means obsession or fixation (Bratman, 2000).
So, orthorexia is an obsession with correct eating. In anorexia, bulimia and BED,the quantity of food is often the target of manipulation, distortion or obsession. Inorthorexia nervosa, it is the quality of food that is manipulated to a pathologic extent(Brownell and Foreyt, 1986).

Childhood & Adolescent Nutrition 84
Obsession about the quality of food may be related to a number of overtly soundfood theories and dietary systems that have surfaced over the years (Messina andMessina, 1986). With orthorexia, however, these systems have become distorted — “toomuch of a good thing.”
Theories become ironclad rules, and elaborate preparation rituals — precise cuttingof vegetables in macrobiotics for instance — can dominate the orthorexic’s thinking andemotions about food. Purity through ever-narrowing dietary choices often becomes theelusive goal. The planning, preparation, and eating of “special” foods becomes an endin itself. The orthorexic’s inner thoughts become dominated by efforts to resist tempta-tion; his or her emotional well-being is determined by the ability to eat food within aself-imposed eating plan. The orthorexic engages in self-praise and feelings of superior-ity for adhering to the plan, and suffers self-condemnation for relapses.
In contrast to people with anorexia or bulimia, orthorexics often become evangelis-tic, attempting to convert others to their “healthier” lifestyle; they actively seek outkindred dieters, and may shun skeptics and non-believers.
Because the types of food eaten are often not generally accessible, or easily pre-pared in restaurants, the seeker becomes more socially isolated. They may spend lesstime doing non-food related activities.
Because their food choices are often based on principles with a spiritual slant, theperson may feel exaltation — a euphoria derived from a supposed moral and ethicalsuperiority to those not following the same food ideals. Since the self-imposed foodrules are related to feelings of self-worth, straying from the rules is often followed byguilt, self-punishment, and even stricter rules. The individual may fast or take colonicsto “cleanse” themselves of the unhealthy foods they have eaten.
Taken to extremes, these behaviors can cause health problems instead of improve-ments. Seeking balance and purity, they create imbalance and illness.
Adolescents are always reaching out for independence, and at the same time,pulling back to safe havens. Rebellion against authority comes naturally, and a “supe-rior” diet regime satisfies that need while providing a comfortable safety net — specificcriteria to follow. It is a way of taking control over their lives, even if the world aroundthem seems overwhelming. It may give them an identity (“I am a fruitarian”), fill aspiritual void, or give them cover for isolation due to agoraphobia or anxiety disorders.
RECOGNIZING AND INTERVENING
Certain behaviors should alert practitioners. Because of the potential for obsession,food theories that have lead to orthorexia include the various raw foods and hygienediets, macrobiotic eating, restrictions related to possible food allergies, blood type orhypoglycemia diets, diets that manipulate macronutrient composition, candida diets,and diets that promote large quantities of supplements or “magical foods”. Many ofthese actually improve health; all have the potential to be taken to unhealthy extremes.
Just because an individual is following a strict dietary protocol does not mean theyare orthorexic. The key is a fixation about food exhibited by obsession and constantpreoccupation with food. It is also involves negative feelings such as fear, guilt, dread,

Childhood & Adolescent Nutrition 85
and/or self-chastisement. Orthorexics may come to a dietitian hoping for suggestionsfor even stricter diets, or seeking a food allergy diagnosis.
Fads and fantasies come and go, and extremes of eating behavior and diet oftenmanifest in stressful periods of adolescence. It is important not to overreact to whatmay be “just a phase.” If the eating habits are creating malnutrition or an unhealthyweight, it is important for us to intervene to prevent future harm.
Intervening may not be appropriate when food obsession has replaced anothermore serious or dangerous obsession. It may also be inappropriate to try to changebehaviors if food is the scapegoat for deeper psychological issues that cannot be ad-dressed otherwise. The severe orthorexic child or teen may need a qualified psycho-therapist. Food worship should not be casually taken away if it is filling a spiritual need
Confronting an orthorectic teen head-on may bring about denial, defensiveness,and rebellion — it’s another way to “individuate” from parents, especially if there arebenefits from orthorexia that the client does not want to give up (low body weight,attention from others, social solidarity, feelings of superiority, spiritual satisfaction).
Detailed eating disorder treatment is beyond the scope of this course. The reader isreferred to Weight Control & Eating Disorders, and Treating Eating Disorders.
REFERENCES
American Academy of Pediatrics. Policy Statement: Breastfeeding and the use of human milk. Pediatrics,115(2): 496-506.
Barlow SE and the Expert Committee. Expert Committee Recommendations regarding the prevention,assessment and treatment of child and adolescent overweight and obesity: Summary Report.Pediatrics, 120(4): S164-S192.
Berg F. Afraid to Eat. Healthy Weight Journal. Hettinger, ND, 1997.Bratman, S. Health Food Junkies. Broadway Books, NY, 2000.Brownell K and Foreyt J. Handbook of Eating Disorders. pp 274-275. Basic Books, Inc./Harper-Collins
Publishers, USA, 1986Burns TL, Mull PD and Lauer RM. The Muscatine Iowa ponderosity family study. American J of Human
Genetics, 49(6):1243-1255, Dec 1991.Centers for Disease Control and Prevention. Health Data Interactive. NHANES 1988-2006. 2010. Retrieved
from http://205.207.175.93/HDI/TableViewer/tableView.aspx?ReportId=543Centers for Disease Control and Prevention. NHANES Surveys (1976-1980 and 2003-2006). 2009. Re-
trieved from http://www.cdc.gov/obesity/childhood/prevalence.htmlDiagnostic and Statistical Manual of Mental Disorders, (4th Ed., text revision). American Psychiatric Associa-
tion, Washington DC, 2000.Dietz W. Health Consequences of Obesity in Youth. Childhood Predictors of Adult Disease. Pediatrics,
101(3) 518, 1998.Gertmaker SL, Dietz WH, et al. Increasing pediatric obesity in the United States. Am H Dis Ch, 141(5):535-
540, 1987.Hassink SG. Pediatric Obesity. Prevention, Intervention, and Treatment Strategies for Primary Care.
American Academy of Pediatrics, Elk Grove, Village, IL, 2007.Gertmaker SL, Dietz, WH, et al. Inactivity, diet and the fattening of America. JADA, 90:1247-1252, 1990.Hill J and Trowbridge F. Childhood Obesity: Future Direction and Research Priorities. Pediatrics, 101(3)
570, 1998.______________ If My Child Is too Fat, What Should I Do about it? Cooperative Extension, University of
California, Division of Agriculture and Natural Resources, Publication 21455.

Childhood & Adolescent Nutrition 86
Institute of Medicine. Preventing Childhood Obesity: Health in the Balance. The National Academies Press,Washington, DC, 2005.
Kirk, Shettey, et al. Pediatric obesity epidemic: treatment options. J Am Diet Assoc, 105:S44-S51, 2005.Mahan LK and Rees JM. Nutrition in Adolescence. Mosby, St Louis, 1984.Mellin L. Shapedown Program, Center for Child and Adolescent Obesity. School of Medicine, Univ. of Calif.
at San Francisco, Dept. of Family and Community Medicine, San Francisco, 1994.Messina M and Messina V. The Dietitian’s Guide to Vegetarian Diets. pp 8-14. Aspen Publishers, MD, 1996.Ogden CL, et al. Prevalence and trends in overweight among US children and adolescents, 1999-2000.
JAMA, 295:1549-1555, 2006.Pediatric Nutrition Handbook, (3rd Ed.), American Academy of Pediatrics, Committee on Nutrition, Elk
Grove, IL. 1993.Pediatric Nutrition Handbook, (6thEd.), American Academy of Pediatrics, Committee on Nutrition, Elk
Grove, IL. 2009.Pipes PL. Nutrition in Infancy and Childhood, (5th Ed.). Mosby, St Louis, 1993.Pi-Sunyer, Xavier and Kris-Etherton PM. Improving health outcomes future directions in the field. J Am
Diet Assoc, 105:S14-S16, 2005._____________ Position of the American Dietetic Association: Individual-, family-, school-, and commu-
nity-based interventions for pediatric overweight. J Am Diet Assoc, 106:925-945, 2006._____________ Position of the American Dietetic Association: Nutrition intervention in the treatment of
anorexia nervosa, bulimia nervosa, and other eating disorders not otherwise specified (EDNOS). JAm Diet Assoc, 106: 2073-2082, 2006.
Savage, Fisher and Birch. Parental influence on eating behavior: conception to adolescence. J Law MedEthics, 35(1): 22-34, 2007. Retrieved from http://www.ncbi.nlm.nih.gov/pmc/articles/PMC2531152/
Spear B. Does dieting increase the risk for obesity and eating disorders? J Am Diet Assoc, 106:523-525, 2006.Stunkard A, Harris JR, et al. The body mass index of twins who have been reared apart. New Eng J Med,
322, p 1433-1487, 1990.Stunkard A, MacDonald A. Body mass indexes of British separated twins. New Eng J Med, 322, p 1530,
1990.Tamborlane W. The Yale Guide to Children’s Nutrition. Yale University Press, New Haven, 1994.Troiano R and Flegal K. Overweight children and adolescents: Description, epidemiology and demo-
graphics. Pediatrics, 101(3) 497-503, 1998.______________United States Department of Health and Human Services. 2008 Physical Activity Guidelines
for Americans. Be Active, Healthy and Happy! 2008.______________United States Department of Health and Human Services, Centers for Disease Control
and Prevention. Recommended Community Strategies and Measurements to Prevent Obesity in theUnited States. CDC Morbidity and Mortality Weekly Report, 58(RR-7): July 24, 2009.
Wang G, Dietz W. Economic burden of obesity in youths aged 6 to 17 years: 1979-1999. Pediatrics,109(14):1-6, 2002.
Childhood & Adolescent Nutrition 87
Chapter Eight:Food Allergies
and Sensitivities
Food allergy is a growing public health concern and in the past decade scientistsare reporting an increase in the numbers. Approximately 12 million Americans, bothadults and children, suffer from food allergies while the number for school age childrenwith allergies is approximately 2.2 million. In addition, during this same time period,the incidence of peanut allergies in children has increased twofold according to theFood Allergy & Anaphylaxis Network.
Many people are confused about the difference between food allergy and foodintolerance. In both situations a person is sensitive to a food but a food allergy is animmune system response to a food that the body mistakenly believes is harmful. A foodintolerance is an adverse food-induced reaction that does not involve the immunesystem. Additional information about the differences are explained in this chapter.
Experts agree that much of the confusion and controversy around food sensitivitycould be significantly reduced if clinically agreed-upon methods were adhered to indiagnosis and reporting (Metcalfe, et al., 1991; Klurfield, 1993). Meanwhile, some generali-zations seem to be accepted and useful:
Food sensitivity appears to be more prevalent in young children. Often thesymptoms subside between the ages of 5 and 7. This is probably explained by thematuration of the child’s gastrointestinal tract and immune system.
There appears to be a genetic factor in all allergies. If neither parent has allergies,a child has about a 13 percent chance of developing them. If one parent has allergies, achild has about a 29 percent chance; with two parents, about a 58 percent chance ofhaving allergies (Metcalfe, et al., 1991). So, there often is a genetic predisposition, even ifthe allergy itself skips a generation.
It is essential to work with a board-certified allergist who is a member of theAmerican Academy of Asthma, Allergy and Immunology (AAAAI) or the American
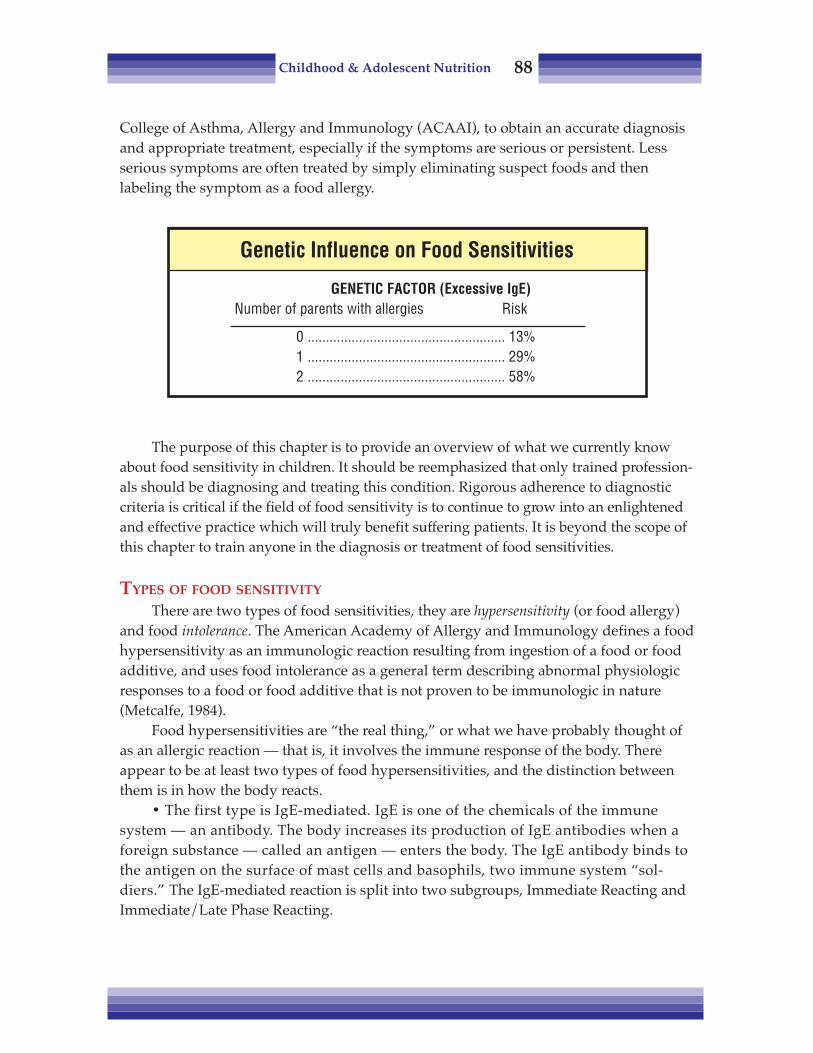
Childhood & Adolescent Nutrition 88
College of Asthma, Allergy and Immunology (ACAAI), to obtain an accurate diagnosisand appropriate treatment, especially if the symptoms are serious or persistent. Lessserious symptoms are often treated by simply eliminating suspect foods and thenlabeling the symptom as a food allergy.
The purpose of this chapter is to provide an overview of what we currently knowabout food sensitivity in children. It should be reemphasized that only trained profession-als should be diagnosing and treating this condition. Rigorous adherence to diagnosticcriteria is critical if the field of food sensitivity is to continue to grow into an enlightenedand effective practice which will truly benefit suffering patients. It is beyond the scope ofthis chapter to train anyone in the diagnosis or treatment of food sensitivities.
TYPES OF FOOD SENSITIVITY
There are two types of food sensitivities, they are hypersensitivity (or food allergy)and food intolerance. The American Academy of Allergy and Immunology defines a foodhypersensitivity as an immunologic reaction resulting from ingestion of a food or foodadditive, and uses food intolerance as a general term describing abnormal physiologicresponses to a food or food additive that is not proven to be immunologic in nature(Metcalfe, 1984).
Food hypersensitivities are “the real thing,” or what we have probably thought ofas an allergic reaction — that is, it involves the immune response of the body. Thereappear to be at least two types of food hypersensitivities, and the distinction betweenthem is in how the body reacts.
• The first type is IgE-mediated. IgE is one of the chemicals of the immunesystem — an antibody. The body increases its production of IgE antibodies when aforeign substance — called an antigen — enters the body. The IgE antibody binds tothe antigen on the surface of mast cells and basophils, two immune system “sol-diers.” The IgE-mediated reaction is split into two subgroups, Immediate Reacting andImmediate/Late Phase Reacting.
Genetic Influence on Food Sensitivities
GENETIC FACTOR (Excessive IgE)Number of parents with allergies Risk
0 ...................................................... 13%1 ...................................................... 29%2 ...................................................... 58%
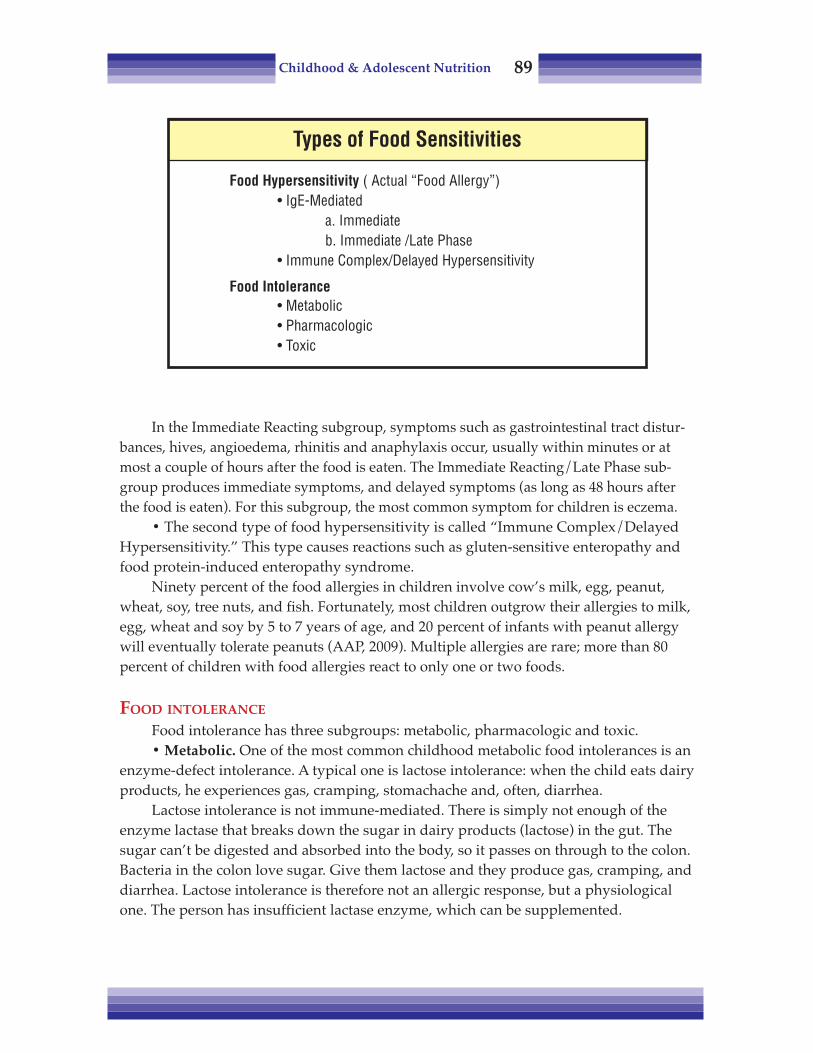
Childhood & Adolescent Nutrition 89
In the Immediate Reacting subgroup, symptoms such as gastrointestinal tract distur-bances, hives, angioedema, rhinitis and anaphylaxis occur, usually within minutes or atmost a couple of hours after the food is eaten. The Immediate Reacting/Late Phase sub-group produces immediate symptoms, and delayed symptoms (as long as 48 hours afterthe food is eaten). For this subgroup, the most common symptom for children is eczema.
• The second type of food hypersensitivity is called “Immune Complex/DelayedHypersensitivity.” This type causes reactions such as gluten-sensitive enteropathy andfood protein-induced enteropathy syndrome.
Ninety percent of the food allergies in children involve cow’s milk, egg, peanut,wheat, soy, tree nuts, and fish. Fortunately, most children outgrow their allergies to milk,egg, wheat and soy by 5 to 7 years of age, and 20 percent of infants with peanut allergywill eventually tolerate peanuts (AAP, 2009). Multiple allergies are rare; more than 80percent of children with food allergies react to only one or two foods.
FOOD INTOLERANCE
Food intolerance has three subgroups: metabolic, pharmacologic and toxic.• Metabolic. One of the most common childhood metabolic food intolerances is an
enzyme-defect intolerance. A typical one is lactose intolerance: when the child eats dairyproducts, he experiences gas, cramping, stomachache and, often, diarrhea.
Lactose intolerance is not immune-mediated. There is simply not enough of theenzyme lactase that breaks down the sugar in dairy products (lactose) in the gut. Thesugar can’t be digested and absorbed into the body, so it passes on through to the colon.Bacteria in the colon love sugar. Give them lactose and they produce gas, cramping, anddiarrhea. Lactose intolerance is therefore not an allergic response, but a physiologicalone. The person has insufficient lactase enzyme, which can be supplemented.
Types of Food Sensitivities
Food Hypersensitivity ( Actual “Food Allergy”)• IgE-Mediated
a. Immediateb. Immediate /Late Phase
• Immune Complex/Delayed Hypersensitivity
Food Intolerance• Metabolic• Pharmacologic• Toxic

Childhood & Adolescent Nutrition 90
• Pharmacological intolerance. This category includes things we can’t quiteexplain, but feel are due to chemical reactions. They don’t look like allergic responses,and yet there appears to be some sort of chemical reaction within the body.
In this category are migraine headaches. Evidence indicates that migraine head-aches are possibly a chemical response at the blood-brain barrier which is linked tofoods or food components. While a great deal of work remains to be done, we do knowthat foods can affect the brain.
• Toxic. Toxicity reactions are protective reactions. The body expels, usuallythrough vomiting, a substance that may do it harm.
THE ALLERGIC REACTION
There is a great deal of work being done on immunopathogenesis to explain whatactually occurs to trigger food hypersensitivity reactions. As previously stated, anallergic reaction is immune-mediated. When a foreign substance enters the body, theimmune system mounts an attack against it. To do this, the antigen is bound to an IgEantibody on the surface of mast cells and basophils, which are part of the body’s im-mune defense system. Histamine and other chemical mediators and cells are thenreleased to assist in destroying the invader.
Unfortunately, these mediators cause irritation to any tissue that they come incontact with, resulting in inflammation, itching, hives, etc. The tissues most oftenaffected are the gastrointestinal tract, skin and/or respiratory system. Many symptomsof allergies, such as diarrhea, nausea, vomiting, skin rashes and difficult breathing, maybe caused by histamine and other chemicals released from the mast cells.
Why the body would react to a molecule that is not harmful and poses no threat toits survival is not known. Much work is being done on identifying and isolating specificantigen molecules in foods. These substances are usually proteins. Why the response tothese substances can come and go, vary in intensity and manifest as different symptomsis also a mystery.
DIAGNOSING FOOD ALLERGIES
If one suspects food hypersensitivity, the first step is to find a board-certifiedallergist to carry out the testing, diagnosis and treatment. The physician will often workwith a Registered Dietitian who has expertise in the field of food sensitivities.
The process of diagnosing suspected food hypersensitivities would depend on thesymptoms and relies upon diet and medical history and examination — one of the keydifficulties is the limited number of effective laboratory tests. These include the simpleSkin Scratch Test, the Skin Puncture Test (or Intradermal Skin Test), the Radio-allergosorbent Test (RAST) and the Enzyme-linked Immunosorbent Assay Test (ELISA).
• In the two skin-test methods, a liquid allergen is placed on the arm or the backand pricked into the skin with a special needle-like instrument, allowing a tiny amountto enter the skin. If antibodies are produced by the immune system, swelling appears atthe test spot in about 20 minutes. If the body does not respond, there is no change in the

Childhood & Adolescent Nutrition 91
skin, this indicates that the child is not allergic to that food. While positive skin testresults indicate that the child is sensitive to that food, only about one-third of thosechildren actually have allergic symptoms.
• Radio-allergosorbent test (RAST) is a blood test that measures specific allergicIgE antibodies. In this test, small samples of blood are mixed with food extracts. If theperson is allergic to the food, measurable levels of IgE antibodies can be detected inthe blood.
Like the skin tests, RAST testing shows that only the higher degree of hypersensi-tivity is correlated with clinical symptoms of food challenges. RAST is used when theskin is unsuitable for skin tests, as in generalized dermatitis.
• The ELISA test is a more recently developed and proven test. It is used in similarsituations as the RAST to identify antigen-specific IgE.
The problem with all of these tests is that they are only useful in diagnosing IgE-mediated types of hypersensitivities. These are often immediate allergic reactions, inwhich symptoms occur soon after the food is eaten, and make it is easier to determinethe offending foods with food histories. If an allergy is caused by something other thanan immune response, it cannot be detected by this test.
The next step in diagnosis, with or without a positive skin, RAST or ELISA test, isto confirm the diagnosis. In l963, Goldman developed standardized diagnostic criteriawhich still provide the basis for current diagnostic procedures. The criteria are:
• Symptoms/signs within 48 hours after intake of the food item.• Relief of symptoms when food is not eaten.• Recurrence of the same symptoms after renewed intake.• This sequence must be performed three times before a definite diagnosis is
made (Goldman, et al., 1963).
Some allergists feel that three repetitions may not be required. Instead they use theprotocol of: "eliminate, challenge, eliminate."
A more thorough description of these protocols is in flow chart format on the nextpage. This is adapted from Husby, et al. (Klurfield, 1993). Understanding Food Allergiesprovides many elimination and challenge diet protocols.

Childhood & Adolescent Nutrition 92
DBPCFC: Double-blind placebo-controlled food challenge
Food Sensitivity Diagnosis Flow Chart
Thorough Diet HistoryIf not life-threatening reaction
Follow normal diet (2-4 weeks)Tests (skin test and/or RAST/ELISA)
Symptoms No Symptoms
Elimination diet Stop and reconsider diagnosisfor 2-4 weeks consider specified elimination
diet- possible food intolerance?
Elimination dietTreatment
Positive response No responseNo symptoms
Reconsider diagnosisof food allergy
Infants and children:elimination diet
Positive response No responseNo symptoms
Equivocal response
New elimination diet?Normal diet as inpatientReconsider diagnosis?
Open food challenge
Older children/teens:DBPCFC,
Inpatient oroutpatient basis?
DBPCFC
Reconsider diagnosis
Positive responseno physical symptoms
No resolutionof symptoms
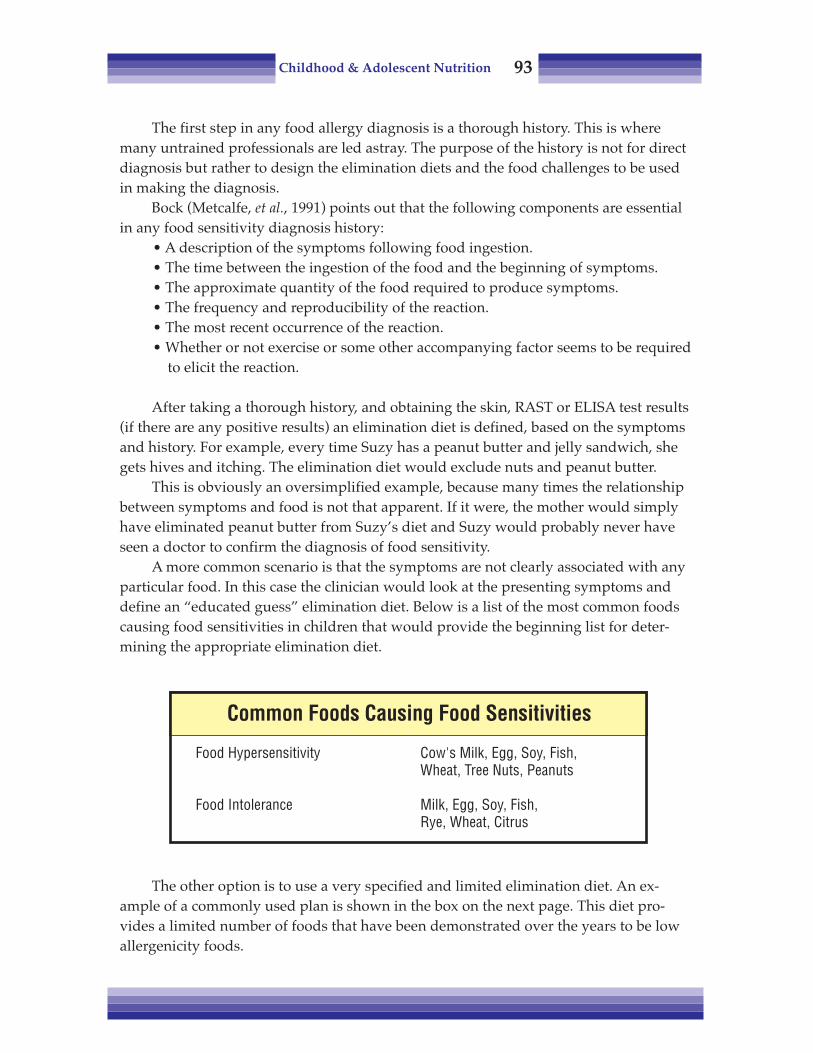
Childhood & Adolescent Nutrition 93
The first step in any food allergy diagnosis is a thorough history. This is wheremany untrained professionals are led astray. The purpose of the history is not for directdiagnosis but rather to design the elimination diets and the food challenges to be usedin making the diagnosis.
Bock (Metcalfe, et al., 1991) points out that the following components are essentialin any food sensitivity diagnosis history:
• A description of the symptoms following food ingestion.• The time between the ingestion of the food and the beginning of symptoms.• The approximate quantity of the food required to produce symptoms.• The frequency and reproducibility of the reaction.• The most recent occurrence of the reaction.• Whether or not exercise or some other accompanying factor seems to be required
to elicit the reaction.
After taking a thorough history, and obtaining the skin, RAST or ELISA test results(if there are any positive results) an elimination diet is defined, based on the symptomsand history. For example, every time Suzy has a peanut butter and jelly sandwich, shegets hives and itching. The elimination diet would exclude nuts and peanut butter.
This is obviously an oversimplified example, because many times the relationshipbetween symptoms and food is not that apparent. If it were, the mother would simplyhave eliminated peanut butter from Suzy’s diet and Suzy would probably never haveseen a doctor to confirm the diagnosis of food sensitivity.
A more common scenario is that the symptoms are not clearly associated with anyparticular food. In this case the clinician would look at the presenting symptoms anddefine an “educated guess” elimination diet. Below is a list of the most common foodscausing food sensitivities in children that would provide the beginning list for deter-mining the appropriate elimination diet.
The other option is to use a very specified and limited elimination diet. An ex-ample of a commonly used plan is shown in the box on the next page. This diet pro-vides a limited number of foods that have been demonstrated over the years to be lowallergenicity foods.
Common Foods Causing Food Sensitivities
Food Hypersensitivity Cow's Milk, Egg, Soy, Fish,Wheat, Tree Nuts, Peanuts
Food Intolerance Milk, Egg, Soy, Fish,Rye, Wheat, Citrus

Childhood & Adolescent Nutrition 94
This is a particularly desirable approach with generalized symptoms when a foodintolerance is suspected. Specifically, symptoms such as long-standing eczema andmigraine have been studied with this type of protocol (Metcalfe, et al., 1991).
This diet is particularly useful when a number of food substances are suspect; thefood can then be added back one by one if no symptoms occur after a food is intro-duced. Such a limited intake should only be done under clinical supervision, withgrowth and nutrient intake being evaluated in children, especially if it were to be fol-lowed for the 4-week time frame.
In general, the elimination diet is followed for approximately 2 to 4 weeks or untilsymptoms have clearly subsided. After the symptoms have disappeared, the next step isthe open food challenge. Listed below are the different forms of food challenges.
Elimination Diet
1. Meat – Chicken or lamb2. Carbohydrate – Rice3. Olive oil4. White vinegar5. Honey6. Sugar – cane or beet
7. Salt8. Vegetable – Carrots, asparagus,
beets, lettuce, sweet potato9. Fruit – Pineapple, apple, apricots,
cranberries, peaches, pears
Forms of Food Challenges
Method Description Advantages Disadvantages
Easy; Negativeresult is impor-tant
Easy; Negativeresult is impor-tant
Quality of theallergen
Easy to do,standardize
False positives
False positives
Demandingtime, resourcesNo standard
No measure oforal allergicresponseNo standard
Fresh food inmixture
Fresh food indesired amount
Fresh food indesired amountgiven via duodenaltube or hidden inmixture
Freeze dried,titratable commer-cially available
Open challengew/meal
Open challengew/single fooditem
Double-blindPlacebo-con-trolled foodchallenge(DBPCFC)
DBPCFC w/capsules ortablets

Childhood & Adolescent Nutrition 95
With an open challenge, both the patient and clinician know the substance is beingadded to the diet. It can either be with food in a mixture as part of a meal or as a specificfresh food in a “dose” amount eaten separately. The advantages are that this is easy todo and if negative results occur —no symptoms appear when the food is added — thenfood sensitivity is likely not the diagnosis. Other possible causes need to be considered.However there are often false positives, so that the diagnosis still needs to be confirmed.Also, there can be equivocal results, partial symptoms or a minor reactions.
DOUBLE-BLIND PLACEBO-CONTROLLED FOOD CHALLENGE (DBCFC)The final phase of the protocol is then done. This is the double-blind placebo-
controlled food challenge (DBPCFC). This step is not appropriate in infants and youngchildren; it may, however, be appropriate in older children and teens. If not appropriate,the clinician will repeat the elimination diet and challenge again to confirm and thenmove on to treatment with the elimination diet avoiding the offending substance.
The DBPCFC is considered the true confirmation of food sensitivity. This is becauseso many factors, including possible placebo effect, can influence symptoms when thechallenge is not double-blind. These double-blind challenges can be done in severalforms from hidden mixtures to commercially available allergen capsules or tablets. (Forindividuals interested in further training in this methodology, an excellent review ofsteps, food challenges, products, etc. is available in Metcalfe et al. (1991)).
This is a very challenging part of the protocol and should be carried out by trainedprofessionals, if the diagnosis is to be valid. It is important to remember that if life-threatening symptoms such as anaphylaxis are involved, usually only the history andskin or RAST tests are used for diagnosis. Food challenges could possibly be dangerous.
The final step is training the individual and family to follow the appropriateelimination diet. Treatment will be discussed in more detail later.
UNPROVEN DIAGNOSTIC PROCEDURES
In the past, the food allergy/sensitivity field has been full of scientifically un-proven methods purported to diagnose food allergies. The previous section on diagnos-ing food sensitivities defines the only scientifically proven and agreed-upon methodsfor diagnosing food sensitivities. There are seemingly sophisticated but unproven testsavailable. One, cytotoxic testing, has been around for a number of years.
Many Registered Dietitians have clients who have been told to avoid a wide vari-ety of foods — tomatoes, beef, chicken, turkey, etc., — and now ask “What can I eat?”
They may have received a “diagnosis” through cytotoxic testing — they sent ablood sample to a laboratory, which separates out white blood cells and mixes themwith dried food extract. The cells are looked at under a microscope and, if they changeshape or size in response to a specific food extract, the person is said to be allergic.
It would be great if it were that easy. According to the American Academy of Aller-gists, the tests are not accurate, not reproducible and not based on any scientific allergydiagnosis techniques. There is no evidence that white blood cells change in size or shape

Childhood & Adolescent Nutrition 96
when there is food sensitivity. In fact, there is evidence that cytotoxic testing does notpick up allergies when other tests show that they exist. Finally, the tests are inconsistentand may not produce the same results on different days using the same blood sample.
FOOD HYPERSENSITIVITY SYMPTOMS
The following discussion lists the symptoms that have been documented to berelated to food allergies, and the foods most commonly involved in those responses.
• Urticaria. Probably the most common symptom of food allergy is urticaria orhives — raised, itchy bumps or welts. This is an immediate-reacting kind of hypersensi-tivity, and is more common during the weaning years when new foods are being intro-duced.
Eggs, cow’s milk, soy, wheat, fish, nuts, and peanuts have been documented as themost common causes. Often the symptoms go away as children get older. This is espe-cially true if the sensitivity is to eggs, milk, soy or wheat. It is less likely if the sensitivityis due to nuts, peanuts or fish (Bock, 1985). If one eliminates these substances withoutresult, then allergy to dog and cat hair should be considered.
There are also what appear to be urticaria reactions which may not be immune-mediated per se, but rather food intolerances. These may be metabolic, toxic or pharma-cologic in nature. Food dyes, additives and other ingredients such as tartrazine (yellowdye #5), other azo and nonazo dyes, natural salicylates, benzoic acid derivatives andmetabisulfites have been reported to provoke urticaria via mechanisms not completelyunderstood (Lockey, 1971; Juhlin, 1972, 1981; Ros, 1976).
Certain foods, such as egg whites, strawberries and shellfish, have been shown totrigger the release of histamine through non-immunologic mechanisms and producesymptoms (Anderson, 1984). This type of reaction represents a response that might notshow up in a skin or RAST test because it is not IgE-mediated. If the history indicates arelationship between foods consumed and the urticaria reaction, then the physicianwould use a diagnostic protocol similar to the diagnostic flow chart previously dis-cussed to test the food intolerance diagnosis.
• Angioedema is similar to urticaria, but more serious, as it may affect the larynxand tracheal areas, and thus is life-threatening. When working with a child who is veryresponsive to certain foods, warn the mother to be cautious about serving any kind ofnew foods. This is an immediate-reacting food allergy — it can happen within 15 min-utes to an hour from ingestion. Fortunately, it’s rare.
• Eczema. About 12 percent of the preschool population suffers from eczema.Eczema manifests as itchy lesions and rough skin, usually where the skin rubs together(armpits, groin, elbow). This is not necessarily serious, but can be very uncomfortable,especially if the child picks at it. It’s very damaging to the skin.
Eczema is a late-phase food hypersensitivity, and may not even be an allergic,immune-mediated response. In some cases it is not even food-related. We often seeit during the first year of life; by preschool it’s less common. Eggs and cow’s milk
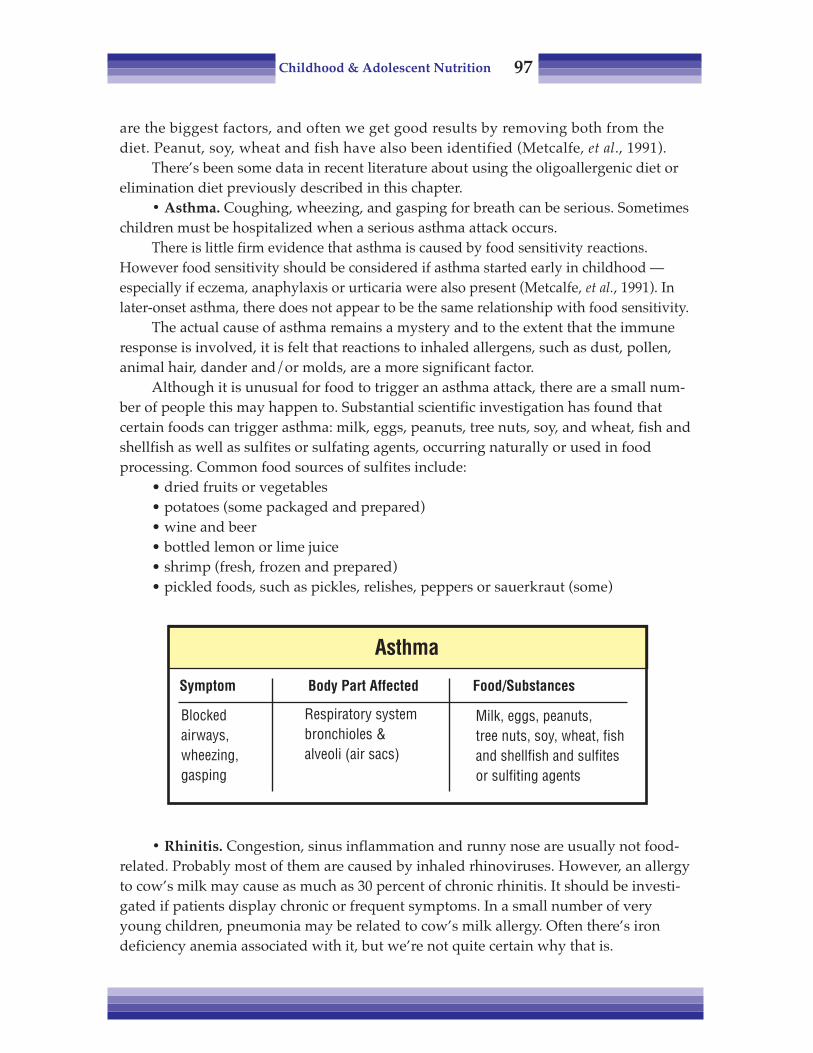
Childhood & Adolescent Nutrition 97
are the biggest factors, and often we get good results by removing both from thediet. Peanut, soy, wheat and fish have also been identified (Metcalfe, et al., 1991).
There’s been some data in recent literature about using the oligoallergenic diet orelimination diet previously described in this chapter.
• Asthma. Coughing, wheezing, and gasping for breath can be serious. Sometimeschildren must be hospitalized when a serious asthma attack occurs.
There is little firm evidence that asthma is caused by food sensitivity reactions.However food sensitivity should be considered if asthma started early in childhood —especially if eczema, anaphylaxis or urticaria were also present (Metcalfe, et al., 1991). Inlater-onset asthma, there does not appear to be the same relationship with food sensitivity.
The actual cause of asthma remains a mystery and to the extent that the immuneresponse is involved, it is felt that reactions to inhaled allergens, such as dust, pollen,animal hair, dander and/or molds, are a more significant factor.
Although it is unusual for food to trigger an asthma attack, there are a small num-ber of people this may happen to. Substantial scientific investigation has found thatcertain foods can trigger asthma: milk, eggs, peanuts, tree nuts, soy, and wheat, fish andshellfish as well as sulfites or sulfating agents, occurring naturally or used in foodprocessing. Common food sources of sulfites include:
• dried fruits or vegetables• potatoes (some packaged and prepared)• wine and beer• bottled lemon or lime juice• shrimp (fresh, frozen and prepared)• pickled foods, such as pickles, relishes, peppers or sauerkraut (some)
• Rhinitis. Congestion, sinus inflammation and runny nose are usually not food-related. Probably most of them are caused by inhaled rhinoviruses. However, an allergyto cow’s milk may cause as much as 30 percent of chronic rhinitis. It should be investi-gated if patients display chronic or frequent symptoms. In a small number of veryyoung children, pneumonia may be related to cow’s milk allergy. Often there’s irondeficiency anemia associated with it, but we’re not quite certain why that is.
Respiratory systembronchioles &alveoli (air sacs)
Blockedairways,wheezing,gasping
Asthma
Symptom Body Part Affected Food/Substances
Milk, eggs, peanuts,tree nuts, soy, wheat, fishand shellfish and sulfitesor sulfiting agents

Childhood & Adolescent Nutrition 98
• Anaphylaxis. It is a rare but a potentially fatal condition in which several differ-ent parts of the body experience an allergic reaction. Symptoms usually appear rapidly,sometime within minutes after eating the allergen. Sometimes there are early symp-toms, often overlooked, such as edema and itching of the lips, mouth and larynx. This isoccasionally followed by nausea, vomiting, abdominal pain and diarrhea.
These reactions become more generalized as the food is absorbed from the gut.Respiratory, gastrointestinal, and cardiovascular signs then may become evident. Thesymptoms, can vary in levels of severity.
Diagnosis can be relatively easy, because the symptoms are abrupt and dramatic.The diagnosis is confirmed with a skin test using extracts or natural food. If testing isdone within one to two weeks of an anaphylactic event, then false negatives can occur.It is best to wait to confirm the diagnosis.
AnaphylaxisSymptom
Range from mild tosevereContraction ofsmooth muscles;dilation of capillar-ies; swelling;difficulty breathing;closure of airway
Body Part Affected
Multiple target organs
Food/Substances
Cow’s milk, eggs, fruit,legumes, vegetables, nuts,seeds, cereals, grains, etc.Deaths have beenassociated with peanuts,milk, peas, pecans, crab,codfish, sulfites and papain
Rhinitis & Recurrent Pneumonia
Symptom Body Part Affected Food/Substances
Rhinitis (hay fever):Itching & runny nose andeyes, stuffiness
Recurrent pneumonia:Wheezing, vomiting
Serous otitis mediaRespiratory system
Including eyes &nose
Respiratory system
Ear inflammation
Cow’s milk (30%)
Cow’s milk
Much debateFood sensitivitymay be involved

Childhood & Adolescent Nutrition 99
Great caution must be taken to avoid ingestion of the food by a hypersensitizedchild. If the food is accidentally eaten, then the child should be treated with repeatinjections of epinephrine until he or she is fully recovered.
• Cow’s milk enteropathy. Cow’s milk enteropathy is a milk-protein-induced injuryto the gut. Losses of blood and protein are associated with high intakes of cow's milk ininfancy and young childhood. Iron deficiency anemia results from the loss of blood.
Eggs and cow’s milk keep showing up on the list of suspect foods, perhaps becauseyoung children have an immature gut that is not very effective at screening out largemolecules Plus they have an immature immune response.
Cow’s milk is the protein food consumed most often at this age. Milk containsmany proteins which are macromolecules, that may be able to cross into the blood-stream. The body, never having seen this particular molecule before, thinks it’s aninvading foreign substance and begins an immune response.
Nearly 80 percent of children outgrow a cow’s milk allergy by around 4 years old.For this reason, periodic trials of small amounts of milk are recommended, since thefood is an important source of nutrients.
Mucus and “mucus-forming” foods are often discussed in lay literature. There islittle solid research to support the contention that dairy products, for instance, cause anexcess of mucus in the body. If dairy foods are eliminated, make sure there is adequateintake of non-dairy calcium foods (Appendix #5) or supplementation. When you takechildren off dairy foods, remember that about 25 percent can’t handle soy milk either.
• Celiac disease is a permanent condition of gluten intolerance. It is a t-lympho-cyte mediated immune response (AAP, 2009). The response, from wheat, barley, rye andoat proteins, damages the lining of the small intestine. Oats have been excluded fromthe gluten-free diet in the past, but there is evidence some individuals with celiacdisease may tolerate uncontaminated oats in small amounts.
Children with celiac disease have diarrhea, they don’t absorb nutrients well andthey can have a number of problems with growth. The prevalence of celiac diseasecould be as high as 1:100 (AAP, 2009). It requires expert clinical counseling by a Regis-tered Dietitian to avoid the offending substances without compromising nutrition.
Cow’s Milk Enteropathy
Symptom Body Part Affected Food/Substances
Blood lossIron deficiencyanemia
Cow’s milkSoya milk - 25% also allergicRice, fish, egg, gluten, chickencan provoke similar symptoms
Gastrointestinaltract

Childhood & Adolescent Nutrition 100
For information on gluten-free diets, the Celiac Sprue Association has a very usefulwebsite: www.csaceliacs.org. The site also has a section for children.
The Nutrition Dimension course Gluten Intolerance & GI Disordeers is also recom-mended.
• Inflammatory bowel disease. There’s some question about how diet affects thisdisease. Again, cow’s milk is usually cited as the allergen. Often, we can use an elemen-tal diet — a formula that contains amino acids, simple sugars and fatty acids — to treatthis problem
• Migraine. Five to ten percent of children experience migraine headaches duringtheir school age years. At best, we might be able to describe this as a late-reacting kindof allergic response, but there is not much evidence in the literature to support this.
Most reports lean toward genetic factors rather than food allergies. There’s apredisposition for the blood vessels to constrict or dilate, which may not be environ-mentally influenced.
There are some non-immune-system based theories about migraines. For somepeople, if pressor amines are removed from the diet the situation improves. Theseamines are found in foods such as red wine, cheese and chocolate.
It is possible we will find that migraines, in addition to heredity, are caused by apharmacological intolerance. More work needs to be done in this area.
TREATMENT
Once food hypersensitivity has been unequivocally diagnosed, treatment is verystraightforward: follow a diet meticulously eliminating all forms of the offending foodallergen. A Registered Dietitian specializing in food hypersensitivity can work withthe patient and family to learn to educate them about all hidden sources of the offend-ing substances.
It is recommended that children diagnosed with food allergies receive an annualnutritional assessment to identify growth problems or inadequate intake of nutrients.Children with milk allergies or multiple food allergies are at greater risk. In one researchstudy, children with two or more allergies were shorter, based on height-for-age percen-tiles, than those with one food allergy (Christie, et al., 2002).
Even the most careful patient may inadvertently ingest a clinically significantamount of the food to which he is sensitive. Experts in the field warn “All patients with
Migraine
Symptom Body Part Affected Food/Studies
Non-immune theoryPressor amines — redwine, cheese, chocolate
Central nervoussystem
Severeheadaches

Childhood & Adolescent Nutrition 101
IgE-mediated food hypersensitivity should be warned about the possibility of develop-ing severe anaphylactic reactions and be educated in the appropriate measures”(Metcalfe, et al., 1991).
To mitigate an immediate food hypersensitivity reaction, a physician will normallyprescribe epinephrine and antihistamines. Individuals with severe anaphylactic laryn-geal or pulmonary symptoms should immediately receive epinephrine and/or bron-chodilator therapy. People with a history of life-threatening anaphylaxis (often topeanuts, nuts, shellfish or fish) should carry or have access to injectable epinephrine.They should be trained to self-administer and then seek medical attention immediately.Medical alert bracelets should be worn and child care or schools should be notified ofhistories and provided emergency medical numbers.
PREVENTION OF FOOD ALLERGY
Many studies done over the past 30 years have documented a marked decrease infood allergy in children of allergic families who were put on a prevention regimen.Children from high-risk families who were treated with the prevention regimen had upto a 50 percent decrease in the chance of developing allergic diseases.
Since most infant formulas are based on cow’s milk and soy milk, which are highlyallergenic, they should be excluded from the infant’s diet. Mothers are encouraged toexclusively breast-feed their infants for at least 4 to 6 months because breast milk hasonly human protein and contains large quantities of secretory IgA, which helps theinfant’s intestines exclude allergens from entering the blood.
If the mother chooses to bottle-feed, “nonallergic” hydrolyzed formula (examples:Nutramigen® and Alimentum®) is recommended. Baby foods are introduced after 4 to 6months of age, with the exception of highly allergic foods such as eggs, citrus fruits,tomato, tree nuts, peanuts, and fish, which should not be introduced until 18 to 24months.
Because the intestine matures and its permeability to allergens decreases to nearadult levels after 12 months of age, cow’s milk and soy should not be given until then.These guidelines should not be implemented without the guidance of a physician andRegistered Dietitian.
In addition, pets, dust mites, and cigarette smoke should be excluded from theinfant’s environment to help prevent respiratory symptoms in allergy-prone children.
Food Allergy and Anaphylaxis Network (FAAN)(a nonprofit organization dedi-cated to assist patients and families with education and coping with food allergies) canprovide referrals, information and support. Their website is: <www.foodallergy.org>and it has a section called FANKIDs and FANTEENs geared for young children andteenagers.

Childhood & Adolescent Nutrition 102
REFERENCES
Anderson JA and Sogn DD, Eds. Adverse food reactions that involve or are suspected of involvingimmune mechanisms; an anatomical categorization. In: American Academy of Allergy and Immu-nology Committee on Adverse Reactions to Foods. Washington DC, National Institute of Allergyand Infectious Disease; 43-102, 1984.
Bock SA. Natural History of severe reactions to foods in young children. J Pediatrics, 107:676-80, 1985.Burks AW and Sampson H. Double-blind placebo-controlled trial of oral cromolyn sodium in children
with documented food hypersensitivity. J Allergy Clin Immun, 81:417-23, 1988.Christie L, et al. Food allergies in children affect nutrient intake and growth. J Am Diet Assoc, 102:1648-
1651, 2001.Goldman AS, Anderson, DW, et al. Oral challenge with milk and isolated milk proteins in allergic chil-
dren. Ped, 32:425-443, 1963.Juhlin L, Michaelsson G, et al. Urticaria and asthma induced by food and drug additives in patients with
aspirin sensitivity. J Allergy Clin Immun, 50:92-98, l972.Juhlin L. Recurrent urticaria: Clinical investigation of 330 patients. Brit J of Dermatology, 104:369-81, 1981.Klurfield D, Ed. Nutrition and Immunology. Plenum Press, New York and London, 1993.Lockey SD. Reactions to hidden agents in foods, beverages and drugs. Ann of Allergy, 29:461-66, 1971.Metcalfe D, Sampson H and Simon R, Eds. Food Allergy - Adverse Reactions to Foods and Food Additives,
Blackwell Scientific Publications, Boston, 1991.Metcalfe D, Food Hypersensitivity. J Allergy Clin Immun, 73:749-762, 1984.Pediatric Nutrition Handbook, 6th Ed. American Academy of Pediatrics, Committee on Nutrition. Elk
Grove, IL, 2009.Ros AM, Juhlin L, et al. A follow-up study of patients with recurrent urticaria and hypersensitivity to
aspirin, benzoates and azo dyes. British J Dermatology, 95:19-24, 1976.
Childhood & Adolescent Nutrition 103
Chapter Nine:Hyperactivity
Attention deficit hyperactivity disorder (ADHD) has the distinction of being boththe most extensively studied childhood mental disorder and the most controversial. Asmany as 15 to 20 percent of children may be affected (Tamborlane, 1997), although someestimate the number to be only 8 to 10 percent (AAP, 2000). The condition is usuallydiagnosed during the school age — 4 to 11 years old; three times as many boys as girlshave the disorder, which is largely unknown outside the US.
ADHD has a wide range of symptoms that pertain to both learning and behavior.Symptoms related to learning problems include difficulties paying attention and con-centrating, and a tendency to distractibility, particularly in group settings. Symptomsthat reflect behavior problems include hyperactivity, fidgetiness, and impulsivity. Thesechildren often act before they think.
The terms used to describe this and possible related disorders have changed overthe years. It is helpful to briefly review the history because it shows how health careprofessionals perception and understanding of the disorder has changed.
Initially, children who were referred to psychiatrists for “behavior problems,”which included hyperactivity and other learning disabilities, were assumed to havesome kind of brain damage. This damage was not actually detectable and so was called“minimal brain damage.” It later evolved to “minimal brain dysfunction.”
The theory of brain damage as the cause came under increasing criticism and, by1987, this term was discarded and “hyperkinetic reaction of childhood” was adopted.Research had dispelled the idea that “brain damage” secondary to perinatal complica-tions (such as anoxia, damage from forceps, breech delivery, etc.) was related to thedisorder.

Childhood & Adolescent Nutrition 104
In the third edition (1987) of the Diagnostic and Statistical Manual of Mental Disor-ders, the term was changed to “attention deficit disorder with or without hyperactivity.”This came from the growing comprehension that the basic issue was difficulty withattention and impulsiveness — that is, these children were not always more active thannormal. In many situations, such as recess, physical education class or television watch-ing, they were essentially normal. In situations that place demands on attention, such asreading or math class, however, they manifested restlessness and inability to concen-trate. Accordingly, it is felt that the increase in motor activity is actually a function ofdifficulty with attention. The 1987 DSM III-R was further changed so that there waslittle or no distinction between “with” and “without“ hyperactivity. The most current(2000) DSM-IV-TR diagnostic criteria are listed in Appendix #12.
In order to make the diagnosis of ADHD, the behaviors need to be present in morethan one setting (e.g. school and home), and must have been present for at least sixmonths, and must have started before the age of 7 years. Also, it is important that thebehaviors impair the child’s ability to function.
It is important to note that the diagnosis of ADHD is made on the basis of behaviorreported by parents or teachers on a rating scale, and is thus subjective. At the presenttime, there is no fully reliable or valid objective test to diagnose the disorder. The lack ofa single laboratory test to determine whether an individual has ADHD reflects the factthat ADHD is not a single disorder, but rather a somewhat diverse group of disorders.
Attention deficit hyperactivity disorder may occur as one of three subtypes.• Combined type. This subtype should be used if six (or more) symptoms of
inattention and six (or more) symptoms of hyperactivity-impulsivity havepersisted for at least six months. Most children and adolescents with ADHDhave the combined type. Refer to Appendix #12 for list of symptoms.
• Predominately inattentive types. This subtype should be used if six (or more)symptoms of inattention (but fewer than six symptoms of hyperactivity-impul-sivity) have persisted for at least 6 months. Some symptoms of hyperactivitymay be present.
• Predominantly hyperactive-impulsive types. This subtype should be used if six(or more) symptoms of hyperactivity-impulsivity (but fewer than six symptomsof inattention) have persisted for at least six months. Some symptom of inatten-tion may be present.
Having developed the ability to define it, at least as well as we can given thesubjective nature of the diagnostic technique, how can we determine what causes it?The bottom line is, we don’t know.

Childhood & Adolescent Nutrition 105
Some things that once were thought to be associated with ADHD include: condi-tions during the perinatal period, like anoxia, toxemia, infections in utero, prematurityand early insults or injuries; head injuries; seizures; exposures to toxic agents — lead forexample — and infections during the first years of life. With present diagnostic criteriathese causes do not appear strongly correlated.
ADHD has been found to be more common in first-degree biological relatives ofchildren with ADHD than in the general population. There is strong evidence that sup-ports the relationship of genetic factors on levels of hyperactivity, impulsivity, and inatten-tion. However, family, school and peer influence are also important determinates. Studiesalso suggest there is a higher prevalence of mood and anxiety disorders, learning disordersand antisocial disorders in family members of individuals with ADHD (DSM-IV-TR).
Although there appears to be a relationship between genetics and ADHD, the rela-tionship of the diet to this condition is not as clear.
THE FEINGOLD DIET
In 1975, a researcher named Dr. Benjamin Feingold hypothesized that certain foodadditives and colorings produced a syndrome of learning disability and hyperactivity insusceptible children, and devised an additive-free diet regimen.
The Feingold Diet calls for eliminating all foods that contain artificial colors,flavors, and three common preservatives: BHA, BHT, and TBHQ. Also eliminated are ,tea and coffee, aspirin and foods that contain natural salicylates: apples, apricots, ber-ries, cherries, cucumbers, currants, grapes, green peppers, tomatoes, nectarines, or-anges, peaches, plums, prunes, and tangerines. He later added sugar to the list.
The Feingold Diet was an immediate sensation. Thousands of parents who puttheir kids on a Feingold Diet swear that these kids have improved, that they becameeasier to handle, that they weren’t hyperactive, or as hyperactive.
Many researchers then attempted to duplicate Feingold’s work to determine whatwas going on, using double-blind methodology so that they could actually determine
Suspected Causes of ADHD
• Perinatal conditions• Early trauma• Genetics• Environmental• Biochemical• Allergy• Dietary: amines, salicylates, tartrazine, MSG
Childhood & Adolescent Nutrition 106
which factors caused hyperactivity. Unfortunately, these researchers could produce verylittle hard evidence that eliminating the suspected substances consistently produces theeffects that the parents reported. Only anecdotal reports and very few appropriatelydesigned studies have shown benefits to eliminating single classes of substances such asartificial colors or salicylates (Boris, et al., 1994).
There are probably multiple factors at play in ADHD. The multiple etiologiesinvolved in ADHD may be hypersensitivity reactions, either to food or other sub-stances, and may also include food intolerances. These may be metabolic or pharmaco-logic in nature. Allergic responses have been identified as significantly higher in someADHD populations studied (Pliska, 1991; Weiss and Hechtman, 1993).
In a l986 review of the single-challenge studies, it was concluded that most failedto demonstrate decreased hyperactivity (Wender, 1986). The three studies whichshowed a positive relationship indicated that improved behaviors occurred in a smallpercentage of younger children, with fairly large doses of food additives (Conners, et al.,1976; Williams, et al., 1978) , and in one case with additives and salicylates (Swansonand Kinsbourne, 1980).
Boris and Mandel, in a 1994 study, did an excellent job of differentiating studiesinto two categories; “Controlled Single-agent Elimination” and “Controlled Multiple-agent Elimination.” The Conners, Williams, and Swanson and Kinsbourne studiesmentioned above were all controlled, single-agent elimination studies. Some researchersbelieve that perhaps this is one of the reasons that more conclusive results between foodand ADHD behavior have not been documented.
Because of the possible multiple factors, it is proposed that the single-agent elimi-nation studies do not eliminate all of the offending agents; therefore improvement inADHD behavior has not been consistent. There have been three controlled studies ofmultiple-agent elimination diets and all three produced positive results (Boris andMandel, 1994; Egger, et al., 1985; Kaplan, et al., 1989). In all three of the studies, multiplesubstances were identified in most of the children to have effects in the DBPCFC(double-blind-placebo-controlled food challenge) phase of the studies.
Boris and Mandel first eliminated multiple substances in the 26 subjects’ diets fortwo weeks. The foods eliminated were: dairy products, wheat, corn, yeast, soy, citrus,eggs, chocolate, peanuts, artificial colors and preservatives. The 73 percent who showedimprovement in ADHD behaviors by standardized reporting methods were then givenan open challenge of the eliminated foods. All of the children reacted to three or moreitems. This research reinforces the fact that multiple substances and mechanisms may beinvolved with ADHD and that these deserve more thorough examination.
There is still a great deal of work to be done in this field. It is important to note that27 percent of the children in this study did not respond to the multiple-agent elimina-tion diet in the Boris study, with 21 percent and 42 percent not responding in the Eggerand Kaplan studies either. The research suggests that food substances may be a contrib-uting factor in some but not all cases.

Childhood & Adolescent Nutrition 107
The best recommendation for assistance with diagnosis and treatment is to find anallergy specialist who works with a therapist and Registered Dietitian. They are besttrained to carry out the studies that would be useful in identifying possible problemsubstances and considering the best possible treatment given the specific child’s issues.
BIOCHEMICAL AND ENVIRONMENTAL FACTORS
There are some environmental factors that have been correlated with ADHD andwhich have been suggested to be causal, especially fluorescent lighting, lead and otherheavy metals. Lead levels in kids with ADHD have been found to be substantiallyhigher than normal in a number of cases.
Also, it’s been found that an unstable home environment and poor emotionalrelationships within the family correlate highly with ADHD. But again we have the“chicken or egg” situation: if a child is hyperactive, he or she may not have a very goodrelationship with others, particularly family (Pliska, 1991).
TREATMENT
As previously mentioned, working with an allergy specialist to determine if foodsare factors in the behavior is one avenue to pursue. This should be done only with acredentialed expert’s assistance and at the present time is considered experimental.
The treatment of choice for very serious behavior problem ADHD children is drugsto assist the child to function in life. The main drugs used in treatment are the stimu-lants methylphenidate and dextroamhetamine (AAP, 2001). They are stimulants, yet inADHD they have the opposite effect and produces decreased motor activity and in-creased attention span.
A number of parents report that their children feel better about themselves and arehappier when they are taking medication than when they are not. Behavior therapy isanother common treatment and is used along with medication.
Treatment of ADHD (Proven & Unproven)
• Drugs: Stimulants(Including Ritalin, Methylin, Metadate, Concerta, Dextrostat,Dexedrine, Adderall)
• Behavior Management & Special Education (with drugs) • Dietary
FeingoldMegavitaminSugarAllergy/Pharmacological Intolerance
Childhood & Adolescent Nutrition 108
Two nutritional side effects are of concern with children on stimulants. The drugsuppresses appetite and may cause weight loss. So, to guarantee adequate nutrition,health care professionals suggest manipulating drug and food intake. It takes about sixhours for the effects of Ritalin to wear off, so parents can time meals and snack to occurabout every six hours. The child eats, and then takes the drug; after it wears off the childeats again.
Growth delays have been reported in children taking supplements, but it is notsupported by research (AAP, 2001). Because of the potential suppression of growth,some children may need to be taken off the drug before they go through their adoles-cent growth spurt, so they can catch up and reach full stature. Sometimes kids are takenoff of the medicine on weekends or during the summer when they are not in school.
Megavitamin therapy doesn’t appear to have any effect on ADHD. There has beenresearch on the benefits of B vitamins, but nothing positive has been reported. And, sinceno definite links have been established between foods and behavior, the American Acad-emy of Pediatrics does not recommend special diets for the treatment of hyperactivity.
SUGAR
Everybody “knows” sugar makes kids crazy, right? Well, there is not any docu-mented evidence that sugar in the diet is related to ADHD. There are very few studieson blood sugar and activity. Despite popular cultural beliefs, to date there is no soliddocumentation (Metcalfe, 1991; Kanarek, 1994). The so-called “Halloween Effect ” —out-of-control kids after a candy binge — has no foundation in research.
When kids are given higher than normal sugar intake they are actually calmer,after an hour or two, than kids who did not have the added sugar. Researchers thinkthat the calmness has to do with stimulation of serotonin production in the brain. Weknow that higher carbohydrate intake allows more tryptophan to the brain, and thatstimulates serotonin production.
But, if you’re working with children and a mother is convinced that when her childeats sugar, he becomes obnoxious, it is better not to make an issue of it. It’s really OK tocut down sugar consumption. There is documented evidence of the negative effects ofsugar in increasing dental caries.
SUMMARY
Even though there has been a great deal of psychological and neurochemicalresearch over the years, the diagnosis of ADHD is still based on parent/teacher/clini-cian history as the key factors. It is important to work with a psychologist, psychiatristor physician who has experience in making these diagnoses. These practitioners applystandardized rating scales to parent/teacher reports and know how to interpret theresults as well as assessing information obtained from interviewing the child.

Childhood & Adolescent Nutrition 109
Since no links have been established between foods and behavior, the AmericanAcademy of Pediatrics does not recommend special diets for the treatment of hyperac-tivity. If a child behaves poorly or has unusual symptoms after eating a particular food,it will do no harm to avoid it, provided the child's diet includes other foods that containnutrients similar to the food that is being eliminated.
Although there is no consensus that a specific diet will help with ADHD, it isespecially important that these children eat well-balanced meals and snacks that containprotein, complex carbohydrates, moderate amounts of fat and limited amounts of sugar.We know that children are especially vulnerable to drops in blood sugar when meals areskipped and a low blood sugar can make any child (or adult) feel irritable and unfo-cused. The importance of eating regular meals is supported by numerous studies thathave found that children who eat breakfast have better test scores and less behavioralproblems than those that skip breakfast.
REFERENCES
American Academy of Pediatrics. Committee on quality improvement: subcommittee on attention-deficit/hyperactivity disorder. Clinical practice guideline: diagnosis and evaluation of the child withattention-deficit/hyperactivity disorder. Pediatrics, 105(5): 1158, 2000.
American Academy of Pediatrics. Committee on quality improvement: subcommittee on attention-deficit/hyperactivity disorder. Clinical practice guideline: treatment of the school-aged child withattention-deficit/hyperactivity disorder. Pediatrics, 108(4): 1033, 2001.
Boris M and Mandel FS. Foods and additives are common causes of the attention deficit hyperactivedisorder in children. Ann of Allergy, 72(5):462-8, 1994.
Conners CK, Goyette CH. Southwick DA, et al. Food, additives and hyperkinesis: controlled double blindexperiment. Pediatrics, 58:154-66, 1976.
Diagnostic and Statistical Manual of Mental Disorders, (3rd Ed. Rev.). American Psychiatric Association,Washington DC, 1987.
Diagnostic and Statistical Manual of Mental Disorders, (4th Ed. Rev.-Text Revision). American PsychiatricAssociation, Washington, DC, 2000.
Egger J, Carter CM, Graham PJ, et al. Control trial of oligoantigenic treatment in the hyperkinetic syn-drome. Lancet, 1:540-5, 1985.
Elia J. Drug treatment for hyperactive children: therapeutic guidelines. Drugs, 46(5):863-71, 1993.Feingold BF. Why is Your Child Hyperactive? New York, Random House, 1975.Hechtman L. Genetic and neurobiological aspects of attention deficit hyperactive disorder: a review. J of
Psych and Neuroscience, (3):193-201, 1994.Kanarek B. Does sucrose or aspartame cause hyperactivity in children? Nutr Reviews, 52(5):173-5, 1994.Kaplan BJ, McNicol J, Conte RA, et al. Dietary replacement in the pre-school aged hyperactive boys.
Pediatrics, 83:7-17. 1989.Metcalfe D, Sampson H and Simon R, Eds. Food Allergy– Adverse Reactions to Food and Food Additives,
Blackwell Scientific Publications, Boston, 1991.Pliska SR. Attention Deficit Hyperactivity Disorder. A Clinical Review. American Family Physician, 43,4.
1267-1275, 1991.Swanson JM and Kinsbourne M. Food dyes impair performance of hyperactive children on a laboratory
learning test. Science, 207:1485-7, 1980.

Childhood & Adolescent Nutrition 110
Tamborlane W. (editor). The Yale Guide to Children’s Nutrition. Yale University Press, New Haven, 1997.Weiss G and Hechtman L. Hyperactive Children Grown Up (2nd Ed.) The Guilford Press, New York,
London, 1993.Wender EH. The food additive-free diet in the treatment of behavior disorders: a review. Exp Behav Pediatr,
7:35-42, 1986.Williams JI, Kram DM, Tausig FT, et al. Relative effects of drugs in diet on hyperactive behaviors: an
experimental study. Pediatrics, 61:811-7, 1978.

Childhood & Adolescent Nutrition 111
Chapter Ten:Comprehensive School
Nutrition Programs
Healthful diets help children grow, develop, and do well in school. Healthy, well-nourished children are more ready to learn and can take better advantage of educationalopportunities. The government can spend billions of dollars on education and it will bewasted if children are not capable of learning due to an inadequate diet.
When children are hungry or undernourished, they have difficulty resisting infec-tion and are more likely than other children to become sick, to miss school, and to fallbehind in class. In addition, they are irritable and have difficulty concentrating, whichcan interfere with learning. Numerous research studies have shown that skippingbreakfast can adversely affect children’s performance in problem-solving tasks andstandardized test scores. Iron deficiency anemia, the most common nutrition deficiencydisease among low-income children, causes fatigue, shortened attention span, decreasedwork capacity, reduced resistance to infection, and impaired intellectual performance.
Barriers for students to eating healthy diets can include economic reasons and suchnoneconomic issues as inadequate time to eat, fad diets or lack of parental supervision.
Schools and communities have a shared responsibility to provide all students withaccess to high-quality foods and nutrition services as an integral part of the total educa-tion program. A school environment that enables and instructs students to developlifelong healthful eating habits is crucial. Although national organizations and govern-ment support is an important first step, successful implementation requires a localpolicy developed through a school and community partnership. This partnership willempower schools to develop and implement a policy that places greater emphasis onschool nutrition programs and their relationship to health and academic performance.
The National Association of State Boards of Education (NASBE) was asked by theCenters for Disease Control and Prevention, Division of Adolescent and School Healthto write guidelines for developing various school health policies.

Childhood & Adolescent Nutrition 112
The result of their efforts was Fit, Healthy, and Ready to Learn, a school policy guidepublished in 2000, found at:
http://www.nasbe.org/index.php/shs/53-shs-resources/396-fit-healthy-and-ready-to-learn-a-school-health-policy-guide>
The guide encourages healthy eating and states that all students shall possess theknowledge and skills necessary to make nutritious and enjoyable food choices for alifetime.
In addition, staff are encouraged to model healthy eating as a valuable part of dailylife. School leaders should implement a comprehensive plan to encourage healthyeating that includes:
• a food service program that employs well-prepared staff who efficiently serveappealing choices of nutritious foods;
• pleasant eating areas for students and staff with adequate time for unhurriedeating;
• a sequential program of nutrition instruction that is– integrated within the comprehensive school health education curriculum and
coordinated with the food service program;– taught by well-prepared and well-supported staff; and– aimed at influencing students’ knowledge, attitudes, and eating habits;
• an overall environment that encourages students to make healthy food choices;• opportunities and encouragement for staff to model healthy eating habits;• services to ensure that students and staff with nutrition-related health problems
are referred to appropriate services for counseling or medical treatment; and• strategies to involve family members in program development and implementation.
The policy guide stresses that the school nutrition program should make effectiveuse of school and community resources and equitably serve the needs and interests ofall students and staff, taking into consideration differences in cultural norms.
The Centers for Disease Control and Prevention (CDC) has several resourcesavailable on making schools healthier:
• The School Health Index (SHI) allows schools to assess the health environment intheir school and create an action plan based on that assessment. A school healthcommittee is encouraged to complete the SHI as a team.
• Another resource from CDC is Make a Difference at Your School! a downloadabledocument which provides strategies that can be implemented to impact child-hood obesity.
• Making It Happen describes success stories of schools implementing healthystrategies.
For more information on these and other CDC resources, visit:http://www.cdc.gov/HealthyYouth/>

Childhood & Adolescent Nutrition 113
LOCAL WELLNESS POLICY
Although during the past decade schools have been encouraged to adapt a schoolnutrition policy, legislation passed in 2004 as a result of the increasing concern aboutchildhood obesity now requires it. The Federal Child Nutrition and WIC Reauthoriza-tion Act requires school districts participating in the National School Lunch Program orthe Child Nutrition Act of 1966, to establish a local school wellness policy by the begin-ning of the 2006-2007 school year.
The local wellness policy must incorporate a minimum of 5 objectives, listed below:1. Goals for nutrition education and physical activity that promote student
wellness in a manner that the school district determines is appropriate.2. Nutrition guidelines for all food sold on campus during the day, in efforts to
promote health and reduce childhood obesity.3. Assurance that nutrition guidelines for school meals will not be less restrictive
than federal policy.4. A plan for measuring the effectiveness of the wellness policy, including the
designation of at least one person to oversee the activities and ensure thatschools meet the local wellness policy.
5. Inclusion of parents, students, school food service professionals, school adminis-trators, and representatives of the school board and public in the development ofthe school wellness policy.
A great resource for information about implementing a local wellness policy can befound at the USDA Team Nutrition web site :
http://www.fns.usda.gov/tn/Healthy/wellnesspolicy.html
In addition, valuable information for implementing a local school wellness policycan be found on the School Nutrition Association web site:
http://www.schoolnutrition.org
SCHOOL FOOD SERVICE PROGRAMS
The National School Lunch Program and the School Breakfast Program are regu-lated by the US Department of Agriculture (USDA), Food and Nutrition Services. At thestate level, most programs are administered by the states' Department of Education.
The National School Lunch Program (NSLP) was authorized by the Child Nutri-tion Act in 1946 to “safeguard the health and well-being of the nation’s children.” It isan entitlement program (meaning federal funds are available to pay its costs), open toall public schools and all residential child care institutions.
Lunch is available to all children at participating schools. Meals must meet specificnutrition requirements in order to qualify for federal and state funds. Household in-come is used to determine whether a child will receive a free or reduced-price meal.
USDA research shows that children who participate in school lunch have superiornutritional intake compared to those who do not. When participating in the NSLP,

Childhood & Adolescent Nutrition 114
students were twice as likely to consume milk or other dairy products, almost twice aslikely to consume vegetables, and one and a half times as likely to consume fruit or fruitjuice as compared with students who brought lunch from home. Those who did notparticipate in the NSLP were almost three times as likely to consume sweetened bever-ages, candy and other sweets, crackers, and high-sodium snack foods than were stu-dents who participated in the program.
Studies also show that low-income children depend on the NSLP for one-third toone-half of their daily nutritional intake.
Congress, advised that hunger among school children in the morning impairs theirability to learn, in 1966 inaugurated the School Breakfast Program (SBP), which ismodeled after the NSLP. Researchers have found that students who participate in theSBP had higher intake of nutrients and higher test scores on standardized achievementtests than eligible nonparticipants. Also, children getting breakfasts had reduced ab-sence and tardiness rates. The need for school breakfast is re-enforced by a study ofmiddle school adolescents in grades 6 to 8 that found students reported skipping break-fast an average of 28 percent of the time and did not eat anything until lunch (J Am DietAssoc, 2006).
Although over 28 million children participate in the National School Lunch Pro-gram, only about 8.9 million receive breakfasts as part of the National School BreakfastProgram according to a national study (J Am Diet Assoc, 2006). School districts with thesupport of administrators need to promote the school breakfast program so morestudents will participate and be better prepared to learn in the classroom.
In 1995 the requirements for the NSLP and the SBP were further enhanced with theSchool Meals Initiative for Healthy Children that added nutrition standards consistentwith the Dietary Guidelines for Americans. Currently, school breakfasts and lunchesmust be planned to provide one-fourth and one-third of the RDA, respectively, forprotein, vitamins A and C, iron, calcium, and calories when analyzed over a week. Inaddition, total fat should be limited to no more than 30 percent of calories and saturatedfat to no more than 10 percent of calories when — again, averaged over a week’s time.
The School Nutrition Dietary Assessment-II study analyzed data to determine ifschools were meeting the School Meals Initiative nutrition standards in the 1998-1999school year. The study found that 82 percent of elementary schools and 91 percent ofsecondary schools met the goals for total fat and saturated fat (Kramer-Atwood, 2002).
School Lunch Program Recommendations
• Involve the Students• Prepare & Serve Attractive Foods• Provide Attractive Eating Environment• Adopt Options — Variety & Fast Foods• Provide Nutritious Foods in Vending Machines & Snack Shops

Childhood & Adolescent Nutrition 115
Although research supports the nutritional benefits of school feeding programs,many students, even those who qualify for a free or reduced-price meal, do not partici-pate in these programs, especially at the high school level.
Today, the needs of students are more complex than ever before. Students areconditioned at a early age to make choices, and are exposed to a variety of diningexperiences and opportunities, including fast foods, ethnic cuisine, and fine dining. As aresult, they choose foods based on taste, convenience, habit and visual appeal, andrarely to meet their nutritional needs.
School food service programs face the challenge of satisfying their customer’s habitsand desires, while meeting nutritional needs and maintaining a self-supporting program(since general school funds are usually not used to support foodservice programs).
A research article published in 1998 studied the variables that affect high schoolstudents’ acceptance of school food service. It found that the best predictor of students’satisfaction was the availability of a variety of foods. Other important factors include:flavor, appearance, staff friendliness and courteousness toward students, choices thatmeet cultural and ethnic preferences, and quality of ingredients.
To increase participation, researchers encouraged child nutrition professionals toinvite students to brainstorm ideas for improving the food service program and inplanning the menu and designing the dining area.
A number of studies have looked at the issue of how to improve school lunches.Here are some of the things the studies have found.
• Involve the kids in writing the menu. Let them tell the child nutrition staff whatthey want to eat and be involved with the choices.
• Prepare and serve attractive food. This seems obvious, but some of the lunchesare prepared in a central kitchen miles away and transported to various schoolsites, which may affect the quality of the food. When new schools are being built,consideration should be given to building a kitchen so meals can be cooked freshat the school site.
• Give students time to eat especially younger students. Because of increasingenrollment, schools sometime rush students through the cafeteria to make sureall students get feed. Students should have at least 10 minutes to eat breakfastand at least 20 minutes to each lunch, counting from the time they sit down.
Some schools give third and fourth graders only 10 to 15 minutes for lunch, be-cause the school is crowded. For prisoners, regulations require at least 15 min-utes; we should at least treat our kids as well as we treat prisoners! A few pre-liminary studies have shown that providing recess before lunch decreases platewaste and may increase nutrient intake (USDA, 2007). In addition, some reportsindicate the students are more calm upon returning to the lunchroom andclassroom.
• Offer options. Let them choose from a menu, and consider having healthy fastfood options (see Appendix #14).

Childhood & Adolescent Nutrition 116
The school food service program needs to be an integral part of the overall schoolexperience and should help to reinforce students’ adopting healthy eating habits. Theguide acknowledges that the food service program shall aim to be financially self-supporting. However, the food service program is an essential part of the education dayand generating profits should not take precedence over the nutritional needs of students.
In 2009, the Institute of Medicine (IOM) released the report, School Meals: BuildingBlocks for Healthy Children. The report provides nutrition recommendations for schoollunch menus. The recommendations include offering a larger variety of and more wholegrains, vegetables and fruits, further reducing the fat and sodium content, and setting aminimum and maximum caloric level for the school lunch.
OTHER FOODS ON CAMPUS
Students at all grade levels have multiple opportunities to acquire food whichcompete with the school meal programs. These include: vending machines, schoolstores, fund-raisers, parties, and a la carte sales.
Although the 1996 USDA-revised regulations require school meals to comply withthe Dietary Guidelines for Americans, these regulations do not apply to other foodsserved on campus. The only federal regulation guiding the sale of these foods is theCompetitive Food Service rule which prohibits the sale of “foods of minimal nutritionalvalue” in the food service area during mealtimes. Foods with minimal nutritional valueare defined as foods which provide less than 5 percent of the USRDA for eight specifiednutrients per serving. The four categories of foods of minimal nutritional value arecarbonated beverages, chewing gum, water ice, and most hard candies. Unfortunately,they can be sold outside the school food service area during meal time.
The current federal statute regarding competitive foods is inadequate to restrict thesale of foods of minimal nutritional value on school campuses. In 1972, legislation wasfirst passed which stipulated that no food sales could operate in competition with theNational School Lunch or Breakfast program. As a result of this rule, many schools andschool organizations lost revenue.
In response to pressure from school organizations, Congress exempted the sale offoods when proceeds went to school organization or schools. This resulted in a markedincrease in foods sold by groups other than the food service program.
In 1980 Congress passed legislation that restricted sale throughout the school offoods with minimal nutritional value (defined above) from the beginning of the schoolday until the end of the last lunch period. However, by the mid-1980s, judgmentsresulting from lawsuits from the National Soft Drink Association forced the USDA toreconsider its regulations on competitive foods and loosen the restrictions on the typesof foods that could be sold.
A Federal Appeals Court overturned the 1980 regulations, ruling that the Secretaryof Agriculture could not establish time-and-place restrictions on the sale of snack items.The final rule of 1985 remains in effect: foods of minimal nutritional value are prohib-ited only in food service areas during meal periods — but can be sold outside this area.

Childhood & Adolescent Nutrition 117
Many groups besides the school food service program sell food on campus. Theyinclude student clubs, athletic groups, and parent groups. The profits earned are used tosupport activities like field trips, athletics, and music programs. In addition, the schoolfood service program sells a la carte foods — separate from the USDA-reimbursablemeal. School food service programs have turned to this option for financial reasons —to help with increasing costs and stagnant federal reimbursement rates.
In 2000, a national study reported that 43 percent of elementary, 73.9 percent ofmiddle/junior high, and 98.2 percent of senior high school had a vending machine, aschool store, canteen, or snack bar where students could purchase food or beverage. Inmore recent Government Accountability Office surveys, they found almost all schoolssold competitive foods to students, and over the last five years, the availability has in-creased in both middle schools and a la carte lines. The surveys estimate that nearly nineout of 10 schools offered competitive foods in 2003-2004, but middle and high schoolswere more likely to sell these foods than elementary schools (J Am Diet Assoc, 2006).
The most common food items sold were juice drinks, carbonated beverages, candybars, cookies and snack chips. Only four vending machines sold fruit and three of thosewere controlled by food service. Almost one third of the schools had a school store; fruitwas not available in any of them. In addition, approximately one third of the schoolspermitted students to leave the school grounds during the lunch period.
Of the 55 schools that participated in the study, 53 had a la carte sales operated bythe school food service program. All of the schools sold fresh fruit, but only 5 offeredraw vegetables. The best-selling items, in order of revenue sales, include cookies, fruitjuices and drinks, pizza, snack cakes, chips, French fries, malts, and sandwiches.
The American Dietetic Association position paper on competitive foods in schoolslists three major problems with competitive foods sales:
• it may decrease participation and divert income essential to the financial well-being of the school meal program;
• it encourages the consumption of partial meals; and• it fosters the erroneous idea that school meals are only for needy children who
don’t have money to purchase other foods.
A USDA report to Congress concluded that competitive foods have lower nutri-tional quality than school meals and that these foods may contribute to over consump-tion of food energy, dietary fat, saturated fat, added sugars, and sodium and underconsumption of calcium, fiber, fruits and vegetables and whole grains (J Am Diet Assoc,2006). Since USDA has not successfully been able to introduce legislation to restrictcompetitive food sales outside of meals, and does not have authority to regulate foodssold outside the cafeteria or other than at mealtime, many state governments have takenon this challenge.
The Center for Science in the Public Interest (CSPI) evaluated the school nutritionpolicies of all 50 states and the District of Columbia regarding food and beverage soldoutside the school meals program. CSPI found that 22 states limit the sale of sugary soft
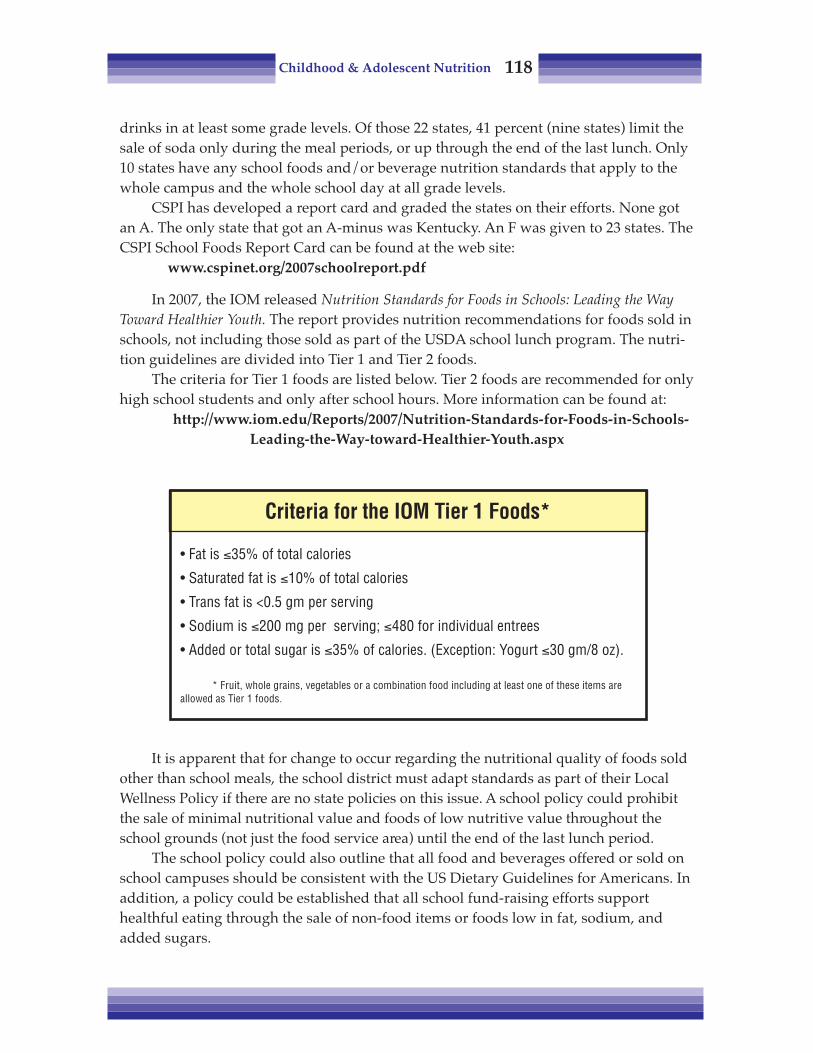
Childhood & Adolescent Nutrition 118
drinks in at least some grade levels. Of those 22 states, 41 percent (nine states) limit thesale of soda only during the meal periods, or up through the end of the last lunch. Only10 states have any school foods and/or beverage nutrition standards that apply to thewhole campus and the whole school day at all grade levels.
CSPI has developed a report card and graded the states on their efforts. None gotan A. The only state that got an A-minus was Kentucky. An F was given to 23 states. TheCSPI School Foods Report Card can be found at the web site:
www.cspinet.org/2007schoolreport.pdf
In 2007, the IOM released Nutrition Standards for Foods in Schools: Leading the WayToward Healthier Youth. The report provides nutrition recommendations for foods sold inschools, not including those sold as part of the USDA school lunch program. The nutri-tion guidelines are divided into Tier 1 and Tier 2 foods.
The criteria for Tier 1 foods are listed below. Tier 2 foods are recommended for onlyhigh school students and only after school hours. More information can be found at:
http://www.iom.edu/Reports/2007/Nutrition-Standards-for-Foods-in-Schools-Leading-the-Way-toward-Healthier-Youth.aspx
It is apparent that for change to occur regarding the nutritional quality of foods soldother than school meals, the school district must adapt standards as part of their LocalWellness Policy if there are no state policies on this issue. A school policy could prohibitthe sale of minimal nutritional value and foods of low nutritive value throughout theschool grounds (not just the food service area) until the end of the last lunch period.
The school policy could also outline that all food and beverages offered or sold onschool campuses should be consistent with the US Dietary Guidelines for Americans. Inaddition, a policy could be established that all school fund-raising efforts supporthealthful eating through the sale of non-food items or foods low in fat, sodium, andadded sugars.
Criteria for the IOM Tier 1 Foods*
• Fat is ≤35% of total calories
• Saturated fat is ≤10% of total calories
• Trans fat is <0.5 gm per serving
• Sodium is ≤200 mg per serving; ≤480 for individual entrees
• Added or total sugar is ≤35% of calories. (Exception: Yogurt ≤30 gm/8 oz).
* Fruit, whole grains, vegetables or a combination food including at least one of these items areallowed as Tier 1 foods.
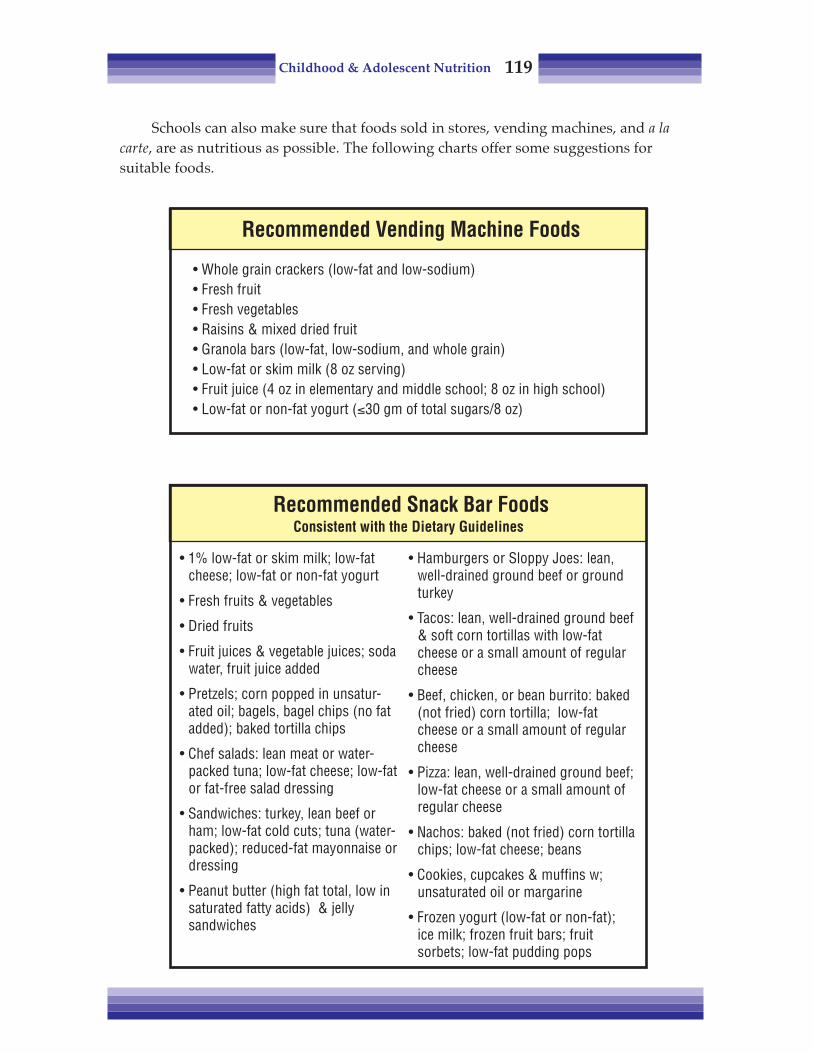
Childhood & Adolescent Nutrition 119
Schools can also make sure that foods sold in stores, vending machines, and a lacarte, are as nutritious as possible. The following charts offer some suggestions forsuitable foods.
Recommended Snack Bar FoodsConsistent with the Dietary Guidelines
• Hamburgers or Sloppy Joes: lean,well-drained ground beef or groundturkey
• Tacos: lean, well-drained ground beef& soft corn tortillas with low-fatcheese or a small amount of regularcheese
• Beef, chicken, or bean burrito: baked(not fried) corn tortilla; low-fatcheese or a small amount of regularcheese
• Pizza: lean, well-drained ground beef;low-fat cheese or a small amount ofregular cheese
• Nachos: baked (not fried) corn tortillachips; low-fat cheese; beans
• Cookies, cupcakes & muffins w;unsaturated oil or margarine
• Frozen yogurt (low-fat or non-fat);ice milk; frozen fruit bars; fruitsorbets; low-fat pudding pops
• 1% low-fat or skim milk; low-fatcheese; low-fat or non-fat yogurt
• Fresh fruits & vegetables
• Dried fruits
• Fruit juices & vegetable juices; sodawater, fruit juice added
• Pretzels; corn popped in unsatur-ated oil; bagels, bagel chips (no fatadded); baked tortilla chips
• Chef salads: lean meat or water-packed tuna; low-fat cheese; low-fator fat-free salad dressing
• Sandwiches: turkey, lean beef orham; low-fat cold cuts; tuna (water-packed); reduced-fat mayonnaise ordressing
• Peanut butter (high fat total, low insaturated fatty acids) & jellysandwiches
Recommended Vending Machine Foods
• Whole grain crackers (low-fat and low-sodium)• Fresh fruit• Fresh vegetables• Raisins & mixed dried fruit• Granola bars (low-fat, low-sodium, and whole grain)• Low-fat or skim milk (8 oz serving)• Fruit juice (4 oz in elementary and middle school; 8 oz in high school)• Low-fat or non-fat yogurt (≤30 gm of total sugars/8 oz)

Childhood & Adolescent Nutrition 120
For additional ideas, the Center for Science in the Public Interest has developedSchool Food Tool Kit: A Guide to Improving School Foods & Beverages, which can be down-loaded from their web site:
http://www.cspinet.org/schoolfoodkit/
SCHOOL-BASED NUTRITION EDUCATION
Young people need nutrition education to help them develop lifelong eatingpatterns consistent with the Dietary Guidelines and the MyPyramid. According to theCenters for Disease Control and Prevention report Guidelines for School Health Programsto Promote Lifelong Healthy Eating, schools are ideal settings for nutrition education forseveral reasons:
• Schools can reach almost all children and adolescents.• Schools provide opportunities to practice healthy eating. More than half of US
school children eat one of their three major meals in school, and one in 10 chil-dren and adolescents eats two meals in school.
• Schools can teach students how to resist social pressures. Eating is a sociallylearned behavior that is influenced by social pressures. School-based programscan directly address peer pressure that discourages healthy eating and harnessesthe power of peer pressure to reinforce healthy eating habits.
• Skilled personnel are available. After appropriate training, teachers can use theirinstructional skills and food service personnel can contribute their expertise tonutrition education programs.
• Evaluation studies suggest that school-based nutrition education can improvethe eating behavior of young people.
Fit, Healthy, and Ready to Learn notes that research has found that nutrition educationprograms which focus on influencing students’ eating behaviors are much more likely tohelp students adopt healthy eating habits than the traditional fact-based approach.Teachers need to go beyond lecturing about specific nutrients and should encouragestudents to explore the social, cultural, and personal influences of their own foodchoices. Lessons need to have personal meaning for students for them to be effective.
Teachers need adequate preparation to teach nutrition skills effectively — theyshould not be expected to simply open a textbook and begin shaping students’ behav-ior. Effective teaching of nutrition education requires a body of knowledge and instruc-tional skills that are uniquely different than the skills that are necessary to teach othersubject areas. This is because nutrition classes aim to influence students’ personalbehaviors and not just to build their cognitive skills.
Therefore, teachers need ongoing support and continuous professional develop-ment. Yet a national survey found that in 1992 through 1994 only 14 percent of teachersof health education in secondary schools had participated in in-service nutrition educa-tion training. As a result, only 40 percent were found to be teaching about the DietaryGuidelines for Americans, which is the foundation of a healthy diet.

Childhood & Adolescent Nutrition 121
Nutrition education lessons need to be reinforced and supported throughout theschool day, according to Fit, Healthy and Ready to Learn. Nutrition topics can be infusedinto other subjects such as math, science, art and social studies. For example, scienceexperiments can directly measure the caloric content of various foods. Nevertheless,infusion of nutrition topics into other subjects should not take place of a planned,sequential nutrition education program delivered as part of a comprehensive schoolhealth education curriculum.
Since role modeling is one of the most powerful influences of behavior, the schoolstaff has the potential to be very powerful role models for students. For that reasons,teachers should be encouraged to become interested in their own health. Research hasfound that staff participation in school health programs helps accomplish this goal.
School staff should not use food as a punishment (by withholding it) or a reward.Positive or negative emotions associated with the setting and type of food offered orrestricted may have long-lasting effects on students’ food preferences. Instead of usingcandy as a reward for good behavior, elementary school teachers can use stickers ortokens which the students can use to redeem for prizes.
School parties could be an opportunity to try different healthy foods or have afood-related activity. For instance, instead of candy for Halloween, have a taste test ofdifferent kinds of apples and have the students vote for their favorite.
A sample policy recommended by Fit, Healthy, and Ready to Learn is that nutritioneducation topics shall be integrated within the sequential, comprehensive health educa-tion program and taught at every grade level. The nutrition education program shouldfocus on students’ eating behaviors, be based on theories and methods proven effectiveby published research, and be consistent with the state’s and/or district’s health educa-tion standards.
Nutrition education shall be designed to help students learn:• Nutrition knowledge, including but not limited to the benefits of healthy eating,
essential nutrients, nutritional deficiencies, principles of healthy weight manage-ment, the use and misuse of dietary supplements, and safe food preparation,handling and storage;
• Nutrition-related skills, including but not limited to planning a healthy meal,understand and using food labels, and critically evaluating nutrition informa-tion, misinformation, and commercial food advertising; and
• Personal assessment tools — how to assess one’s personal eating habits, setgoals for improvement, and achieve those goals.
Nutrition education instructional activities shall stress the appealing aspects ofhealthy eating and be participatory, developmentally appropriate, and enjoyable. Theprogram shall engage families as partners in their children’s education.
In 2003, a position paper was written by the American Dietetic Association, theSociety for Nutrition Education, and the American School Food Service Association thatsupports the idea that comprehensive nutrition services must be provided to all of thenation’s preschool through grade 12 students. These nutrition services should be inte-

Childhood & Adolescent Nutrition 122
grated with a coordinated, comprehensive school health program and implementedthrough a school nutrition policy. The policy should link:
• comprehensive, sequential nutrition education• access to and promotion of child nutrition programs providing nutritious meals
and snacks in the school environment• and family, community and health services’ partnership supporting positive
health outcomes for all children.
CHALLENGE TO SCHOOLS
The USDA Food and Nutrition Service has developed criteria that challengeschools to become healthier. The USDA HealthierUS School Challenge sets goals for foods,physical education, physical activity and nutrition education. Levels of criteria areavailable for both secondary and elementary schools.
For more information on the HealthierUS School challenge, visit:http://www.fns.usda.gov/tn/healthierus/index.html
REFERENCES
ADA supports USDA School Meals Initiative for Healthy Children but recommends more improve-ments for child nutrition. J Am Diet Assoc, 94(8); 841-842, 1994.
Dietary Guidelines for Americans, (2nd Ed.), US Dept. of Agriculture, and US Dept. of Health andHuman Services, Home and Garden Bulletin No. 232. Washington DC, 1985.
__________ Fit, Healthy, and Ready to Learn: A School Health Policy Guide. National Association of StateBoards of Education. March, 2000. www.nasbe.org
__________Guidelines for School Health Programs to Promote Lifelong Healthy Eating. Centers for DiseaseControl and Prevention. Superintendent of Documents, US Government Printing Office.Washington, DC. June 1996.
Healthy People 2010: National Health Promotion and Disease Prevention, US Dept. of Health andHuman Services, Public Health Services. Washington DC, 2000.
Institute of Medicine. School Meals: Building Blocks for Healthy Children. www.iom.edu/Reports/2009/School-Meals-Building-Blocks-for-Healthy-Children.aspx Released October 20, 2009.
Institute of Medicine. Nutrition Standards for Foods in Schools: Leading the Way Toward HealthierYouth. www.iom.edu/Reports/2007/Nutrition-standards-for-Foods-in-Schools-Leading-the-Way-toward-Healthier-Youth.aspx Released April 23, 2007.
Kramer-Atwood J, et al. Fostering healthy food consumption in schools: Focusing on the challengesof competitive foods. J Am Diet Assoc, 102:1228-1233, 2002.
_________The Link Between Nutrition and Cognitive Development in Children. Center on Hunger,Poverty and Nutrition Policy. Brandeis University, Waltham, MA (781) 736-8885. 1998.
Mahan LK and Rees JM. Nutrition in Adolescence. Mosby, St Louis, 1984.Meyer MK and Conklin MT. Variables affecting high school students; perceptions of school
foodservice. JADA, 98: 1424-1428, 1998.Parker L. The relationship between nutrition and learning; A School Employee’s Guide to Information
and Action, National Education Association, Washington DC, 1989.Pipes PL. Nutrition in Infancy and Childhood, (5th Ed.). Mosby, St Louis, 1993.________ Position of The American Dietetic Association: Competitive foods in schools. JADA, 91:
1123-1125, 1991.

Childhood & Adolescent Nutrition 123
Position of the American Dietetic Association: Nutrition Standards for child care programs. JADA,94(3); 323-328, 1994.
________ Position of The American Dietetic Association: Child and adolescent food and nutritionprograms. J Am Diet Assoc, 103:887-893, 2003.
________ Position of The American Dietetic Association: Local Support for Nutrition Integrity inSchools. J Am Diet Assoc, 106:122-122, 2006.
________ Position of The American Dietetic Association, Society for Nutrition Education, andAmerican School Food Service Association -- Nutrition Services: An essential component ofcomprehensive school health programs. J Am Diet Assoc, 103:505-514, 2003.
Story M, Hayes M, et al. Availability of foods in high schools: Is there cause for concern? J Am DietAssoc,, 96: 123-126, 1996.
United States Department of Agriculture. Food and Nutrition Service. Nutrition Assistance ProgramReport Series: The Office of Research, Nutrition and Analysis. School nutrition dietary assess-ment study III: Volume I: school foodservice, school food environment, and meals offered andserved. Report Number CN-07-SNDA-III. November, 2007.

Childhood & Adolescent Nutrition 124
Notes

Childhood & Adolescent Nutrition 125
Chapter Eleven:Food Choices for Children
Once kids have the power of choice, they’re vulnerable to media advertising andmarketing. Often, what they eat is not what we’d want them to eat, from a nutritionstandpoint.
Of course, most children and teens are not concerned about heart disease, cancer orchronic debilitating diseases such as arthritis, osteoporosis or diabetes. They have asense of invulnerability, and middle age seems an eternity away.
Teaching what foods are most important to eat on a regular basis and being a rolemodel is one of the best things a parent can do, because a person’s health in middle andlater years will be dependent upon what he or she has been eating during childhood,adolescence and early adulthood.
Teaching children what are the healthiest foods to eat does not ensure that they willeat them. There are plenty of temptations out there — some as close as the living room!
TV AND FOOD CHOICES
Kids watch TV more than they do anything else, except sleep — 26 hours a weekfor preschool kids — almost 4 hours a day; 6- to 16-year-olds watch more than 3 hours aday. A recent report from the Kaiser Family Foundation revealed children aged 8 to 18watch nearly 4 1/2 hours of television per day (Kaiser Family Foundation, 2010). Thetime includes watching television on other mediums such as online and DVDs. Thispromotes sedentary, passive behavior, offers poor dietary models to imitate, promotesfoods high in sugar, fat and salt, and low in nutrients, and urges kids to influenceparent’s food choices
TV watching is physical inactivity, and there’s a direct correlation between thenumber of hours kids spend watching TV and obesity.

Childhood & Adolescent Nutrition 126
The other concern with TV is that it is not a good role model. TV people eat on therun, if at all, and they tend to eat fast food, snack food, junk food.
Two-thirds of the foods eaten or mentioned on television shows were high in fat,sugar, or salt, and fewer than 10 percent of the food references were to fruits and veg-etables, according to What are We Feeding Our Kids? (Jacobson, 1994). Nearly all of thecharacters on television who are consuming these calorie-dense foods are slim, espe-cially children and teenagers. So children are getting mixed messages — one messagesuggests eating in a way that promotes weight gain while the other message suggeststhat we should strive to be slim.
Not only are TV programs promoting unhealthy eating, food and beverage compa-nies are spending $30 billion per year on food advertising. Consumers Union, publishersof Consumer Reports magazine, estimates the average child sees between 30,000 to 40,000commercials annually — 350,000 to 400,000 television commercials by the time the childgraduates from high school! Food ads make up about 69 percent of the ads during theafternoon, when kids usually watch; 25 percent are for cereals. Children watching Satur-day morning cartoons see a food commercial every 5 minutes.
Almost without exception, TV-promoted foods are high in sugar, fat and salt, andusually offer little vitamin and mineral return for the calories consumed — they are“energy dense” (high in calories for the nutrients they provide), rather than “nutrientdense.” The chart below shows the difference between the nutrients provided by skimmilk (nutrient dense) and a soft drink (energy dense). Note that the calories are roughlycomparable, but the soft drink has no other nutrients.
Nutrient Comparison: Skim Milk vs. Soft Drink302826242220181614121086420
% R
DA
Calories Protein Vit. A Vit. C B1 B2 B3 Ca Fe
123412341234123412341234123412341234
Skim MilkSoft Drink
123123123123

Childhood & Adolescent Nutrition 127
The Center for Science in the Public Interest recently released a report on foodmarketing to children (CSPI, 2009), entitled Better-for-you?, reviewing company prom-ises on food marketing to children.
The CSPI report reveals changes that have occurred to children’s food marketingbetween 2005 and 2009. In 2009, the most advertised food category was fast food,second was cereal and third was yogurt. It is interesting to note that even though bever-age advertising is a relatively small portion of food advertising to children, the percent-age of food advertising from beverages increased from 1 to 3 percent from 2005 to 2009.
There has been some improvement in children’s food marketing since the Instituteof Medicine (IOM) released a report on the subject. As a result of the IOM recommenda-tion, a group of businesses representing food companies formed the Children’s Foodand Beverage Advertising Initiative (CFBAI) within the Council of Better BusinessBureau.
Limiting the amount of sugar and fat in children’s diet and replacing these energy-dense foods with nutrient-dense foods such as fruits, vegetables and whole grainproducts is a desirable goal considering the increase incidence of childhood obesity.Limiting salt intake is also a recommended change.
It is important to know that children view TV with less skepticism than adults andtherefore are particularly vulnerable to advertising. Children have difficulty distin-guishing between advertising and programming and before age 8 do not understandthat the intent of commercials is to sell a product.
One study of children aged 6 through 8 found that 70 percent believed that fastfoods were healthier than foods from home. That is why some organizations believethat children’s advertising is harmful and should not be permitted at all.
In a position statement, the American Academy of Pediatrics (AAP) declares that“Advertising directed toward children is inherently deceptive and exploits childrenunder age eight years of age” (Brownell, 2004).

Childhood & Adolescent Nutrition 128
DIETARY “BAD GUYS”• Sugar. On average, Americans eat more than twice as much refined sugar now
than they did a hundred years ago. In the first few years of life, children get slightlymore of their calories from naturally occurring sugars than from added sugars. That’sbecause young children still eat plenty of fruits and vegetables and drink milk.
However, by age 4, refined sugars take precedence. By the teen years, youngstersget on average 14 percent of their calories from added sugars, and 10 percent of teenag-ers get at least 20 percent of their total calories from added sugar.
Some authorities contend that, except for promoting dental cavities, sugar isbasically harmless. But the truth is that children who eat a lot of sugar can have troublegetting enough nutrients since they eat low-nutrient high sugar foods instead of lowsugar nutrient-dense foods like fruits, vegetables, grains and milk.
According to a 2004 American Dietetic Association Position Paper, dietary qualitysuffers when sugar intake is 25 percent or more of total calories. It is estimated that onein four children (ages 9 to 18) surpass this level.
Where’s the sugar? Some of it is hidden. The chart on the previous page provides alisting of the sugar content of foods. Sugar appears in many forms; some foods containseveral kinds. You may see corn syrup, dextrose, fructose, glucose, honey, lactose, mal-tose, and sucrose. Milk and fruit have naturally occurring sugar. Lactose is the sugar inmilk; fructose is the sugar in fruit. Nutrition labels list grams of sugar per serving — 4gm of sugar equals 1 tsp.
Soft drinks are probably the biggest source of added sugar in the average child’sdiet. As you can see, a 12 oz can of soda has 10 tsp of sugar. Unfortunately, a researchstudy analyzing consumption patterns for the years 1994 to 1998, compared to 1977-1978, found that soft drink consumption is increasing among children aged 6 to 17 years(J Am Diet Assoc, 2003).
Food Sugar, (tsp.)
Chocolate bar (2 oz) ................ 8Hard candy (2 oz) .................... 8Donut ....................................... 6Cupcake ................................... 6Hamburger bun ........................ 3Jam/jelly (1Tbsp) ...................... 31/2
Adapted From: Jacobson, The Fast Food Guide, 1986.
Sugar in Common Foods
Food Sugar, (tsp.)
Jell-O pudding (1/2 cup) ........ 4Ice cream ( 1 scoop) .............. 4Sherbet (1/2 cup) ................... 6Soft drink (12 oz) ................... 10+Kool-Aid (8 oz) ....................... 6Tang (8 oz) ............................. 4
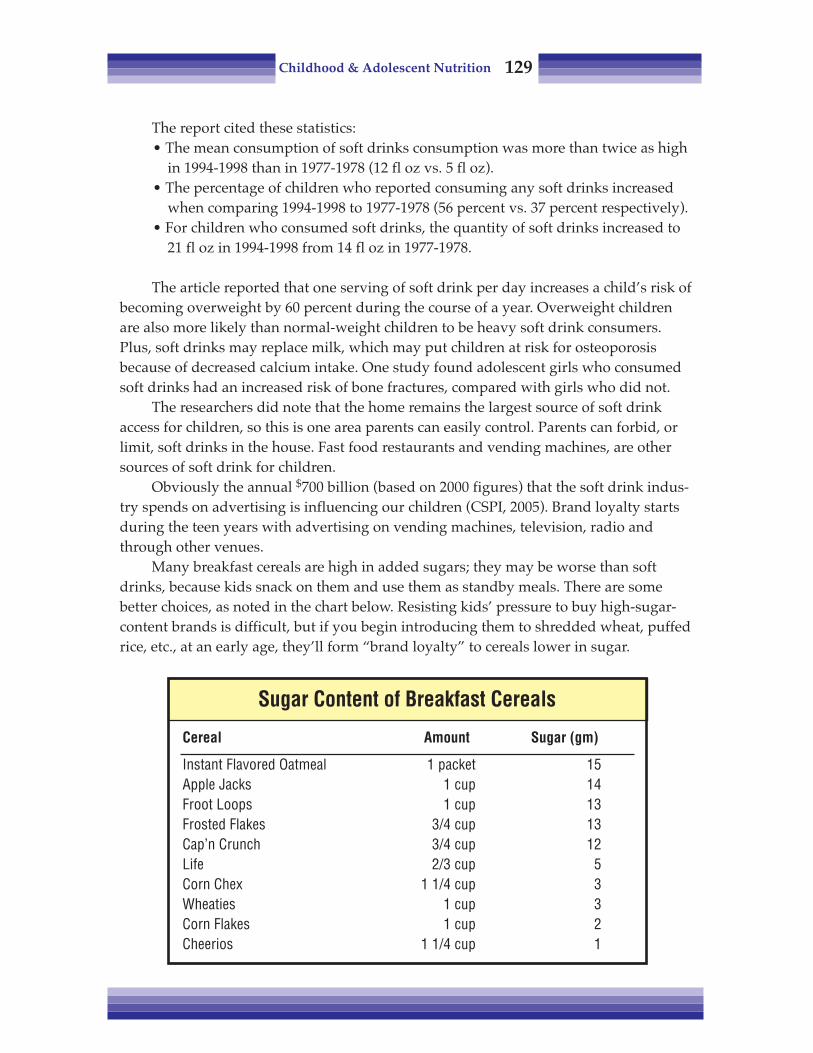
Childhood & Adolescent Nutrition 129
The report cited these statistics:• The mean consumption of soft drinks consumption was more than twice as high
in 1994-1998 than in 1977-1978 (12 fl oz vs. 5 fl oz).• The percentage of children who reported consuming any soft drinks increased
when comparing 1994-1998 to 1977-1978 (56 percent vs. 37 percent respectively).• For children who consumed soft drinks, the quantity of soft drinks increased to
21 fl oz in 1994-1998 from 14 fl oz in 1977-1978.
The article reported that one serving of soft drink per day increases a child’s risk ofbecoming overweight by 60 percent during the course of a year. Overweight childrenare also more likely than normal-weight children to be heavy soft drink consumers.Plus, soft drinks may replace milk, which may put children at risk for osteoporosisbecause of decreased calcium intake. One study found adolescent girls who consumedsoft drinks had an increased risk of bone fractures, compared with girls who did not.
The researchers did note that the home remains the largest source of soft drinkaccess for children, so this is one area parents can easily control. Parents can forbid, orlimit, soft drinks in the house. Fast food restaurants and vending machines, are othersources of soft drink for children.
Obviously the annual $700 billion (based on 2000 figures) that the soft drink indus-try spends on advertising is influencing our children (CSPI, 2005). Brand loyalty startsduring the teen years with advertising on vending machines, television, radio andthrough other venues.
Many breakfast cereals are high in added sugars; they may be worse than softdrinks, because kids snack on them and use them as standby meals. There are somebetter choices, as noted in the chart below. Resisting kids’ pressure to buy high-sugar-content brands is difficult, but if you begin introducing them to shredded wheat, puffedrice, etc., at an early age, they’ll form “brand loyalty” to cereals lower in sugar.
Sugar Content of Breakfast Cereals
Cereal Amount Sugar (gm)
Instant Flavored Oatmeal 1 packet 15Apple Jacks 1 cup 14Froot Loops 1 cup 13Frosted Flakes 3/4 cup 13Cap’n Crunch 3/4 cup 12Life 2/3 cup 5Corn Chex 1 1/4 cup 3Wheaties 1 cup 3Corn Flakes 1 cup 2Cheerios 1 1/4 cup 1

Childhood & Adolescent Nutrition 130
Fructose is replacing sucrose as the primary sugar to sweetened beverages andfoods. Although fructose is the natural sugar in fruit, the kind added to foods is pro-duced from corn syrup. It is less expensive, so companies can offer free soda refills andoffer “jumbo” sized portions for a few pennies more. Some individuals have expressedconcern about the amount of fructose children are consuming.
• Caffeine. Consumer Reports did a study of various “energy” drinks and foundthat some have enough caffeine to make children jittery and anxious. Because foods anddrinks are not required to list how much caffeine they contain, it can be hard to deter-mine how much children are getting. Although some beverages (e.g. colas) obviouslycontain caffeine, some are not as obvious. The caffeine content of 8 fl oz of certainbeverages is shown below.
FAST FOODS: FAT, CHOLESTEROL AND SUGAR TRAPS
Children and families eat out more now than in previous decades. The proportionof total food dollars spent on food away from home has increased from 26 percent in1970 to 39 percent in 1996. In 2008, over 48 percent of food dollars were spent awayfrom the home (USDA, 2009). With these statistics, it is not surprising that the percent-age of total calories obtained from foods eaten away from home has nearly doubled,increasing from 18 percent in 1977-1978 to 34 percent in 1995 (Harnack, 2003).
If the trend continues, Americans will soon spend more on meals away from homethan on food they prepare themselves. The more children eat away from home (exceptfor school lunches), the more the nutritional quality of their diet decreases.
We could probably pick any restaurant and find foods that are high in calories, fat,sugar, cholesterol and salt, but since we’re talking about kids, we need to look at fastfood places, especially the five leading fast-food restaurants: McDonald’s, Burger King,Kentucky Fried Chicken, Wendy’s, and Taco Bell.
Caffeine Content
Beverage Caffeine (mg)
AMP Energy Drink 77 mgRed Bull Energy Drink 70 mgRed Fusion 38 mgMountain Dew 37 mgPepsi 27 mgSobe Energy Citrus Flavored Beverage 25 mgCoca-Cola Classic 24 mgBarq’s Famous Olde Tyme Root Beer 15 mgSnapple Lemon Iced Tea 19 mgNestea Iced Tea Sweetened Lemon 10 mg

Childhood & Adolescent Nutrition 131
Fast-food use was reported by 37 percent of adults and 42 percent of the childrenaccording to a 2003 study (Paeratakul). Adults and children who reported eating fastfood had higher intake of energy, fat, saturated fat, sodium, carbonated soft drink andlower intake of vitamins A and C, milk, fruits and vegetables than those who did notreport eating fast food. Similar differences were observed among individuals betweenthe day when fast food was eaten and the day when fast food was not eaten.
For the 2004 movie Super Size Me, filmmaker Morgan Spurlock ate three meals aday at McDonald’s, always choosing the “supersize” option. He gained 24 lb, his choles-terol level rose, and his liver was adversely affected. Although this may be extreme, itdoes make you wonder about the many people who eat at least one fast food meal daily.
The chart below shows the sugar content of some popular fast food offerings. Eachteaspoon of sugar represents 4 gm of carbohydrates and 16 kcal. It is clear why weconsume approximately 125 lb of sugar a year without even being aware of our intake.
Company /Product Sugar (tsp.)
Dairy Queen Chocolate Malt ....................... large, 20 fl oz. ......... 40
Dairy Queen Chocolate Shake ..................... large, 20 fl. oz. ........ 29
Dairy Queen Mr. Misty Freeze .....................14 fl. oz ................... 20
Dairy Queen Peanut Buster Parfait .............................................. 20
Dairy Queen Float ........................................................................ 19
Dairy Queen Mr. Misty Float ........................................................ 17
Dairy Queen Mr. Misty, regular ...................11 fl. oz. .................. 16
Carl's Jr. Carbonated Beverages ................. regular ..................... 15
Carl's Jr. Shakes ......................................... regular ..................... 14
Dairy Queen Chocolate Sundae .................. large, 8.4 fl. oz. ....... 14
Dairy Queen Dipped Chocolate Cone .......... large ........................ 13
Arby's Jamocha Shake ................................................................ 12
Dairy Queen Hot Fudge Brownie Delight ...................................... 11
McDonald's Orange Drink ...........................12 fl. oz. .................. 11
Arby's Chocolate Shake ............................................................... 11
Dairy Queen Cone ....................................... large ........................ 11
Hardee's Milk Shake .................................................................... 11
Jack in the Box Pancake Breakfast with Syrup & Bacon .............. 11
McDonald's Chocolate Shake ...................................................... 11
Fast Foods Highest in Sugar
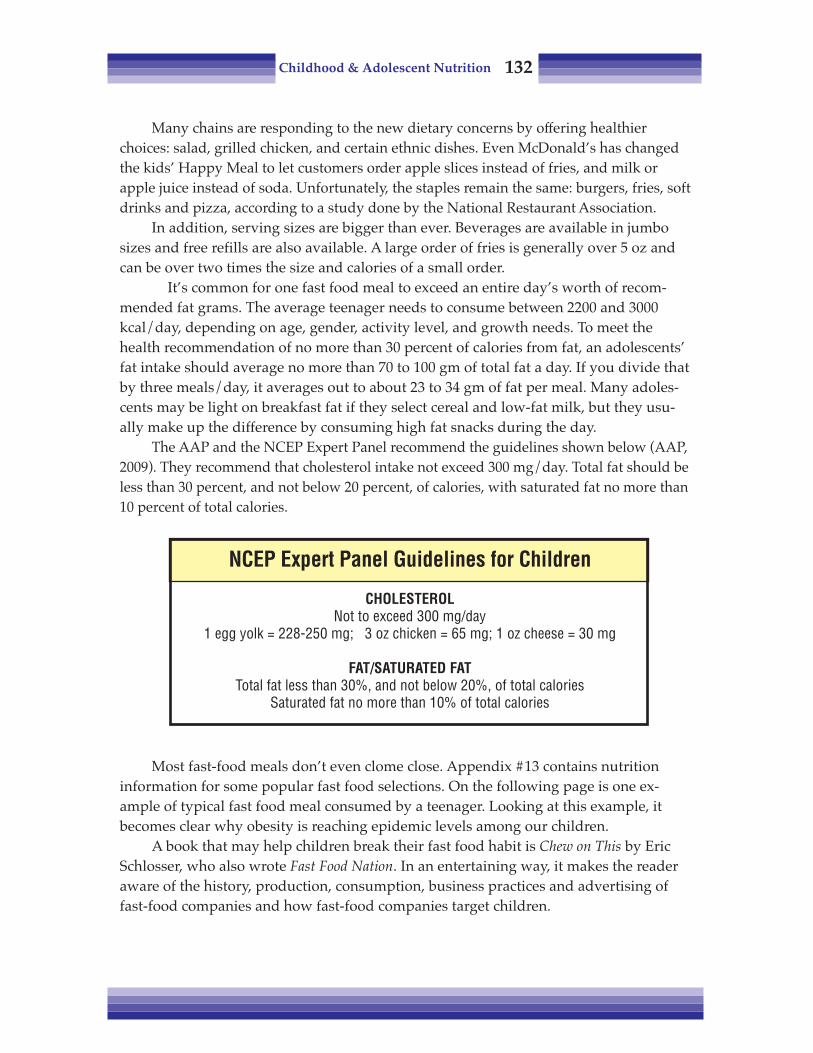
Childhood & Adolescent Nutrition 132
Many chains are responding to the new dietary concerns by offering healthierchoices: salad, grilled chicken, and certain ethnic dishes. Even McDonald’s has changedthe kids’ Happy Meal to let customers order apple slices instead of fries, and milk orapple juice instead of soda. Unfortunately, the staples remain the same: burgers, fries, softdrinks and pizza, according to a study done by the National Restaurant Association.
In addition, serving sizes are bigger than ever. Beverages are available in jumbosizes and free refills are also available. A large order of fries is generally over 5 oz andcan be over two times the size and calories of a small order.
It’s common for one fast food meal to exceed an entire day’s worth of recom-mended fat grams. The average teenager needs to consume between 2200 and 3000kcal/day, depending on age, gender, activity level, and growth needs. To meet thehealth recommendation of no more than 30 percent of calories from fat, an adolescents’fat intake should average no more than 70 to 100 gm of total fat a day. If you divide thatby three meals/day, it averages out to about 23 to 34 gm of fat per meal. Many adoles-cents may be light on breakfast fat if they select cereal and low-fat milk, but they usu-ally make up the difference by consuming high fat snacks during the day.
The AAP and the NCEP Expert Panel recommend the guidelines shown below (AAP,2009). They recommend that cholesterol intake not exceed 300 mg/day. Total fat should beless than 30 percent, and not below 20 percent, of calories, with saturated fat no more than10 percent of total calories.
Most fast-food meals don’t even clome close. Appendix #13 contains nutritioninformation for some popular fast food selections. On the following page is one ex-ample of typical fast food meal consumed by a teenager. Looking at this example, itbecomes clear why obesity is reaching epidemic levels among our children.
A book that may help children break their fast food habit is Chew on This by EricSchlosser, who also wrote Fast Food Nation. In an entertaining way, it makes the readeraware of the history, production, consumption, business practices and advertising offast-food companies and how fast-food companies target children.
NCEP Expert Panel Guidelines for Children
CHOLESTEROLNot to exceed 300 mg/day
1 egg yolk = 228-250 mg; 3 oz chicken = 65 mg; 1 oz cheese = 30 mg
FAT/SATURATED FATTotal fat less than 30%, and not below 20%, of total calories
Saturated fat no more than 10% of total calories

Childhood & Adolescent Nutrition 133
HEALTHIER FAST FOOD SELECTIONS
Appendix #14 has examples of healthier fast food selections which contain nomore than 35 percent of calories as fat. Although the daily recommended intake of fat is30 percent of calories, you can achieve this daily goal by balancing the meal with low fatfoods such as fruit or low fat milk.
Following are some tips for eating healthy in a fast food restaurant.• Order grilled food, rather than breaded or fried.• Hold the mayo! Each tablespoon contains about 105 kcal and 15 gm of fat. In-
stead ask for barbecue sauce, ketchup or mustard.• Go easy on salad dressing! Like mayonnaise, each tablespoon of dressing has
about 105 kcal and 15 gm of fat. Use less, or use reduced- or fat-free dressings.• Enjoy grilled chicken instead of fried. But watch the extras like mayonnaise.• Skin your chicken! You can cut fat in half by removing the skin and breading
from the chicken and not eating the fatty wing meat.• Order small fries instead of large. A small order of McDonald’s fries is 210 kcal,
while super sized fries are 610 kcal.• Choose a regular burger instead of a specialty burger. A Whopper™ has 670 kcal,
while a regular burger is 290 kcal.• Hold the cheese. A slice of cheese adds an extra 50 to 100 kcal to a burger.• Skip the meat topping and extra cheese on your pizza. One slice of Pizza Hut’s
Meat Lover’s is 370 kcal and 22 gm of fat while Veggie Lover’s is 210 kcal and 8gm of fat. As the chart above shows, pizza can be nutrient-rich, containingprotein, iron, calcium, B vitamins, vitamin C and other nutrients.
• Check out the ethnic choices. Bean burritos, soft chicken tacos and chicken pollobowls are usually healthy options.
• Balance your meals. When you eat a meal in a fast food restaurant, aim for lowerfat choices at your other meals during the day.
Food Calories Total CHO Saturated Sodium SugarFat (gm) (mg) Fat (mg) (mg) (gm)
Big Mac 540 29 75 10 1040 9Large French Fries 500 25 0 3.5 350 0Medum Soda (21 oz) 210 0 0 0 15 58TOTAL 1250 54 75 13.5 1405 67
Typical Fast Food Meal

Childhood & Adolescent Nutrition 134
We can be role models and set good examples for our children. You haven’t lost thebattle the minute the kids walk in the door of a fast food restaurants, especially in lightof some recent additions to their menus. Make a point of asking the restaurant fornutrition information for the various selections. Or go on-line since most fast foodrestaurants have a web site with nutrition information about their products. Anotherway to reduce calories and fat is to reduce the frequency of how often your family eatsin fast food places.
REFERENCES
Brownell K and Horgen K. Food Fight. McGraw-Hill, New York, 2004.CDC Choosing healthier foods when eating out http://www.cdc.gov/nccdphp/dnpa/nutrition/pdf/
r2p_away_from_home_food.pdfCenter for Science in the Public Interest. Liquid Candy: How soft drinks are harming Americans’ health.
June, 2005._________ Caffeinated kids. Consumer Reports, 28-29, July 2003._________ Fast food: adding health to the menu. Consumer Reports, 28-31, September 2004.French S, et al. National trends in soft drink consumption among children and adolescents age 6 to 17 years:
Prevalence, amounts, and sources, 1977/1978 to 1994/1998. J Am Diet Assoc, 103(10): 1326-1331, 2003.Harnack L and French S. Fattening up on fast food. J Am Diet Assoc, 103 (10): 1296-1297, 2003.Kaiser Family Foundation. Generation M2: Media in the lives of 8- to 18-year-olds. 2010. www.kff.org/
entmedia/upload/8010.pdfPaeratakul S, et al. Fast-food consumption among US adults and children: dietary and nutrient intake
profile. J Am Diet Assoc, 103:1332-1338, 2003.Pediatric Nutrition Handbook, 6th Ed. American Academy of Pediatrics, Committee on Nutrition, Elk
Grove, IL, 2009._________ Position Paper of the American Dietetic Association: Use of nutritive and nonnutritive sweeten-
ers. J Am Diet Assoc, 104:255-275, 2004.Schlosser E and Wilson C. Chew on This. Houghton Mifflin, Boston, 2006.United States Department of Agriculture (USDA), 2009. Food CPI and expenditures. www.ers.usda.gov/
Briefing/CPIFood AndExpenditures/Data/Expenditures_table10.htm

Childhood & Adolescent Nutrition 135
Chapter Twelve:Young Athletes & Nutrition
Nutrition for adolescent athletes has become a concern of many parents, coachesand dietitians — partly as a result of the recent fitness boom, and partly as a result ofthe increased pressure to perform that we’re imposing on youthful athletes. Child-rearing issues aside, there are several areas where health professionals should be con-cerned about nutrition for youngsters involved in rigorous sports training or competi-tion. This chapter will deal with protein needs, the perils of “making weight,” hydrationand glycogen loading.
For more extensive information, the Nutrition Dimension course Nutrition forYoung Athletes is recommended.
PROTEIN
Many young athletes think protein supplements will help them grow and gainmuscle faster. They usually get these ideas from magazine ads promoting amino acidsupplements. Unfortunately, some coaches push supplements as well.
Do children need extra protein if they’re working out hard? Let’s look at nitrogenneeds, since protein is the dietary source of nitrogen in the diet. Take an adolescent whois working out hard for 4 hours a day. Let’s look at how much nitrogen/protein hereally needs. To replace nitrogen lost in his urine, he would need 24.5 gm of protein aday. Add 30 percent — 7.5 gm of protein — as a safety factor, because different peoplehave different protein needs. He’s working out hard, so he’s going to have a substantialamount of nitrogen lost in his sweat, so we’ll add another 7.5 gm for replacement.
An adolescent this age is growing muscle, so he’s going to need another 7.5 gm ofprotein for that purpose. For normal teenage growth, he needs 10 gm. If he’s an extralarge male, another 10 gm.
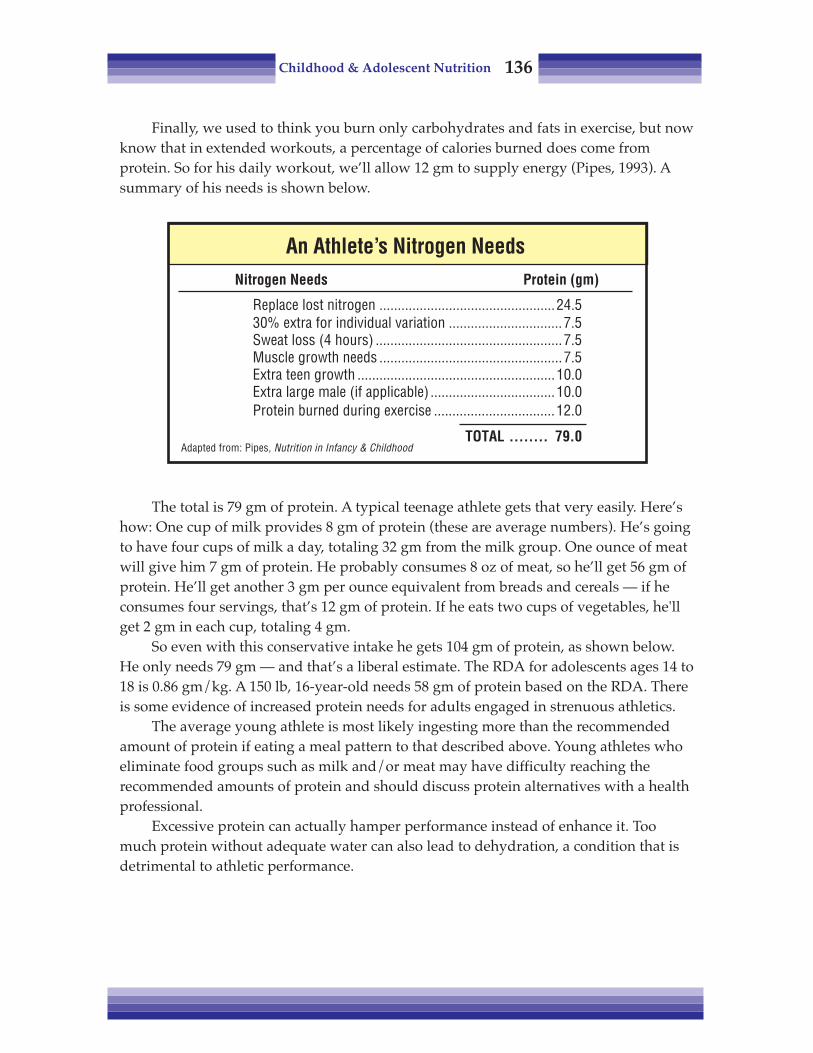
Childhood & Adolescent Nutrition 136
Finally, we used to think you burn only carbohydrates and fats in exercise, but nowknow that in extended workouts, a percentage of calories burned does come fromprotein. So for his daily workout, we’ll allow 12 gm to supply energy (Pipes, 1993). Asummary of his needs is shown below.
The total is 79 gm of protein. A typical teenage athlete gets that very easily. Here’show: One cup of milk provides 8 gm of protein (these are average numbers). He’s goingto have four cups of milk a day, totaling 32 gm from the milk group. One ounce of meatwill give him 7 gm of protein. He probably consumes 8 oz of meat, so he’ll get 56 gm ofprotein. He’ll get another 3 gm per ounce equivalent from breads and cereals — if heconsumes four servings, that’s 12 gm of protein. If he eats two cups of vegetables, he'llget 2 gm in each cup, totaling 4 gm.
So even with this conservative intake he gets 104 gm of protein, as shown below.He only needs 79 gm — and that’s a liberal estimate. The RDA for adolescents ages 14 to18 is 0.86 gm/kg. A 150 lb, 16-year-old needs 58 gm of protein based on the RDA. Thereis some evidence of increased protein needs for adults engaged in strenuous athletics.
The average young athlete is most likely ingesting more than the recommendedamount of protein if eating a meal pattern to that described above. Young athletes whoeliminate food groups such as milk and/or meat may have difficulty reaching therecommended amounts of protein and should discuss protein alternatives with a healthprofessional.
Excessive protein can actually hamper performance instead of enhance it. Toomuch protein without adequate water can also lead to dehydration, a condition that isdetrimental to athletic performance.
An Athlete’s Nitrogen NeedsNitrogen Needs Protein (gm)
Replace lost nitrogen ................................................24.530% extra for individual variation ...............................7.5Sweat loss (4 hours) ...................................................7.5Muscle growth needs ..................................................7.5Extra teen growth ......................................................10.0Extra large male (if applicable) ..................................10.0Protein burned during exercise .................................12.0
TOTAL ........ 79.0Adapted from: Pipes, Nutrition in Infancy & Childhood
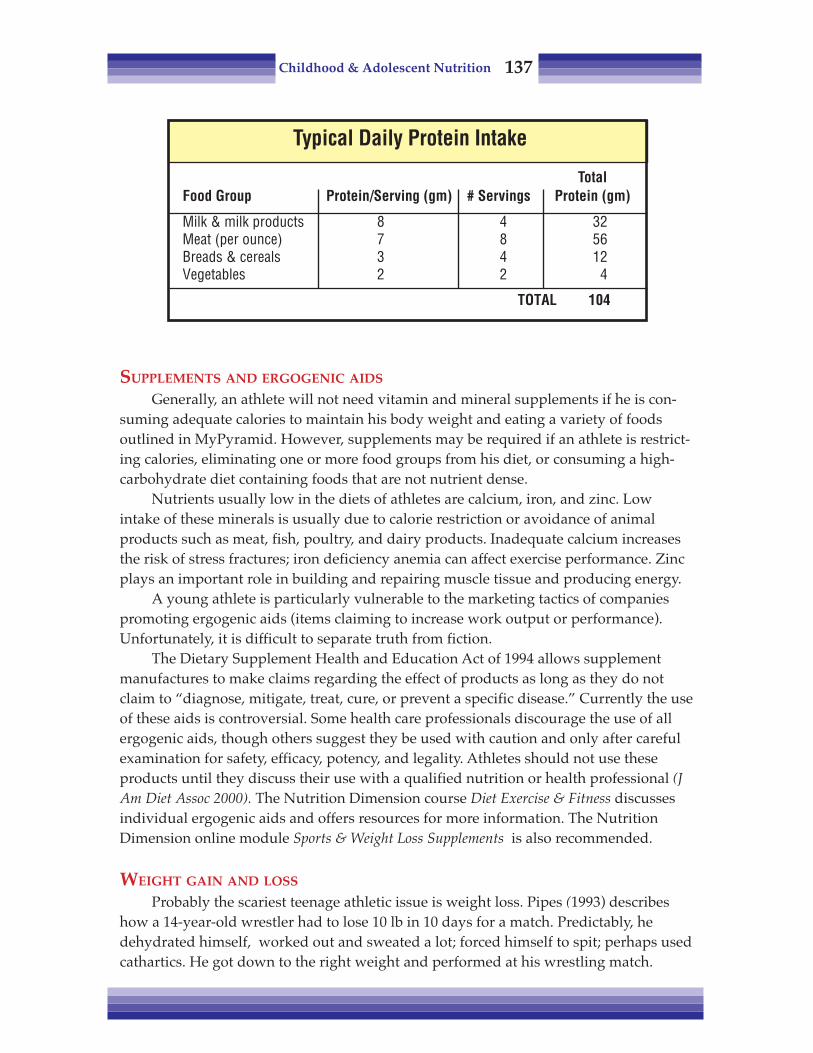
Childhood & Adolescent Nutrition 137
SUPPLEMENTS AND ERGOGENIC AIDS
Generally, an athlete will not need vitamin and mineral supplements if he is con-suming adequate calories to maintain his body weight and eating a variety of foodsoutlined in MyPyramid. However, supplements may be required if an athlete is restrict-ing calories, eliminating one or more food groups from his diet, or consuming a high-carbohydrate diet containing foods that are not nutrient dense.
Nutrients usually low in the diets of athletes are calcium, iron, and zinc. Lowintake of these minerals is usually due to calorie restriction or avoidance of animalproducts such as meat, fish, poultry, and dairy products. Inadequate calcium increasesthe risk of stress fractures; iron deficiency anemia can affect exercise performance. Zincplays an important role in building and repairing muscle tissue and producing energy.
A young athlete is particularly vulnerable to the marketing tactics of companiespromoting ergogenic aids (items claiming to increase work output or performance).Unfortunately, it is difficult to separate truth from fiction.
The Dietary Supplement Health and Education Act of 1994 allows supplementmanufactures to make claims regarding the effect of products as long as they do notclaim to “diagnose, mitigate, treat, cure, or prevent a specific disease.” Currently the useof these aids is controversial. Some health care professionals discourage the use of allergogenic aids, though others suggest they be used with caution and only after carefulexamination for safety, efficacy, potency, and legality. Athletes should not use theseproducts until they discuss their use with a qualified nutrition or health professional (JAm Diet Assoc 2000). The Nutrition Dimension course Diet Exercise & Fitness discussesindividual ergogenic aids and offers resources for more information. The NutritionDimension online module Sports & Weight Loss Supplements is also recommended.
WEIGHT GAIN AND LOSS
Probably the scariest teenage athletic issue is weight loss. Pipes (1993) describeshow a 14-year-old wrestler had to lose 10 lb in 10 days for a match. Predictably, hedehydrated himself, worked out and sweated a lot; forced himself to spit; perhaps usedcathartics. He got down to the right weight and performed at his wrestling match.
Typical Daily Protein Intake
TotalFood Group Protein/Serving (gm) # Servings Protein (gm)
Milk & milk products 8 4 32Meat (per ounce) 7 8 56Breads & cereals 3 4 12Vegetables 2 2 4
TOTAL 104

Childhood & Adolescent Nutrition 138
Did he win? No — and he didn’t feel great either. He then drank a small amount offluid, because he was feeling pretty lousy, and put on a couple of pounds. So he had togo through more dehydration to get back down for the next match three days later.
Did he win on the third day? No, and he felt ill enough to be checked into thehospital two days later, where they did a full coronary bypass — on a 14-year-old! Therewas so much material clogging his coronary artery from the dehydration and body’suse of fat for energy, that his life was in danger.
Kids want to perform, they want to be on the team, and it’s our job as parents andprofessionals to take a stand to protect them from unhealthy practices. Could this boyhave competed at the higher weight class? Sure, why not? Who said he had to get downto the absolute minimum, at risk of his life?
A prudent way to handle the weight issue is to set attainable standards. TheAmerican Medical Association (AMA) recommends a 6-week intensive training pro-gram before the season, with no concern for weight. Then, have him weigh in. Whateverhis weight is at that point is the minimum he should maintain for performance. If hedoesn’t maintain that weight — if he loses weight during the season — then he doesn’tplay. The chart below offers the AMA’s weight gain and loss guidelines.
The other recommendation is that a youngster’s body fat should not be allowed tofall below about 7 to 10 percent because of reserves needed for growth. The average for aboy is 12 to 15 percent. Some professional adult athletes are at 4, 5, or 6 percent.
The other extreme is football, where they want to pump up these youngsters toabsurd levels. A 200-pounder used to be a giant; now, high school linemen average 220 to230 lb — and the pros are well into the 320 lb realm! Conditioning and strength is onething, but just adding beef is something harmful.
Weight Gain / Loss Guidelines
GAIN: LOSS:0.5 to 1 lb/week 2.2 lb/week
(to gain 1 lb = 2500 extra kcal + training) (not to be exceeded)
Pre-Season Planning• Set a date to meet weight goals• Construct a sound eating plan — vitamins,
minerals, protein, calories• Supervise closely by non-coaching personnel
“Making Weight”• Avoid salty foods, decrease fiber foods• No vomiting, spitting, diuretics, cathartics
Childhood & Adolescent Nutrition 139
The maximum gain should be 0.5 to 1 lb per week, and that should be from exer-cise. To gain 1 lb of muscle requires 2500 kcal per week above basic calorie needs. Lossshould be no more than 2 lb per week, absolute maximum — in the case cited before,the youngster lost almost 5 lb in a week.
Weight planning should be done well in advance. If the athlete has a good solideating plan where he gets everything he needs — vitamins, minerals, protein — he cango through a weight gain or weight loss program, with supervision. That does not meanbeing supervised by the coach, because many times the coach doesn’t know anythingabout nutrition. He needs a professional who has expertise in nutrition.
To maintain weight safely, athletes can avoid salty foods and decrease their fiberintake. Salty and high fiber foods help the body retain fluid, which can add to anathlete’s weight. Absolutely no vomiting, no spitting, no diuretics, no cathartics!
PRE-EXERCISE MEAL
Eating before exercise, versus exercising in a fasting state, has been shown toimprove an athlete’s performance. The meal or snack consumed before the event shouldprepare an athlete for the event and not leave him hungry, nor leave undigested food inhis stomach. The meal or snack should be:
• sufficient in fluid to maintain hydration• low in fat and fiber to help gastric emptying and minimize gastric distress• high in carbohydrates to maintain blood glucose levels and maximize glucose stores• moderate in protein• composed of foods familiar to the athlete
Because most athletes do not like to compete on a full stomach, smaller mealsshould be consumed closer to the event. Larger meals can be consumed if more time isavailable before exercise or competition. The amount of carbohydrates found to enhanceperformance was in the range of 200 to 300 gm for meals consumed three to four hoursbefore exercise (J Am Diet Assoc 2000).
Although the above guidelines are sound, the needs of the individual athlete mustbe considered. For example, some can consume a substantial meal (e.g. pancakes, juice,and scrambled eggs) two to four hours before exercise while for others, this meal wouldcause severe gastric distress. Athletes should always test what works best for them byexperimenting with new foods and beverages during practice sessions.
FLUIDS
Fluid replacement is very important. Youth who are working out for an hour ortwo, or even who are out all day at some kind of a track meet or swim meet, need tostay hydrated.
The fluid replacement recommendations in the chart on the following page are forevents lasting longer than 90 min. People do best if they drink copious amounts ofwater the day before an event. Then 15 min. before the event, drink 1 to 2 cups of water.

Childhood & Adolescent Nutrition 140
During the event, especially if they’re working out hard, running, swimming, etc., drink4 to 8 oz every 15 to 20 min. After the event, they should drink 16 oz of water for everypound of weight lost. Cool water seems to be absorbed faster from the gut.
It is important for athletes to follow a “schedule” of drinking fluids. Thirst alone isan inadequate stimulus for children, and if left to drink on their own, they will replaceonly two-thirds of their fluid losses. After repeated days of exercise, these cumulativelosses may leave the child dangerously dehydrated.
Dehydration can adversely affect performance and health. The heart rate rises byapproximately eight beats per minute for every 2.2 lb of fluids lost. The increased heartrate reduces endurance and hinders strength and mental alertness. Blood flow through-out the body is diminished by fluid loss, and core body temperature will rise. A heat-related illness may be the result.
Heat-related illnesses can include muscle cramps, headaches, fainting, giddiness,poor coordination, pallor or flushed skin, nausea, vomiting chills, or exhaustion. Themore serious condition, heat stroke, is a true medical emergency that can result in death.
Carbohydrate-containing drink products are available for long-duration sportssuch as distance running, for instance. By using the carbohydrate in the drink for en-ergy, glycogen stores are depleted more slowly, and the athlete can run longer beforebecoming exhausted. There is some evidence that these drinks may also improve perfor-mance in intermittent and moderate- to high-intensity exercise, such as soccer and icehockey as well.
Cramping can occur from drinking beverages too high in carbohydrates. The con-centration of carbohydrates in the drink should be around 4 to 8 percent. Honey andsugar water and similar drinks actually pull fluids from the body into the gut, whichcauses cramping. There are certain glucose polymers that are quickly and easily ab-sorbed and do not cause cramping.
Fluid Replacement – Sports Events*
*Exceeding 90 minutes duration
Day before the event � Drink copious amounts of waterRight before the event � Drink 8 - 16 oz of waterDuring the event � 4 - 8 oz every 15-20 minutesAfter the event � Drink 16 oz for every pound lost

Childhood & Adolescent Nutrition 141
GLYCOGEN LOADING
Muscle glycogen is the preferred fuel for most types of exercise. Building up andmaintaining glycogen stores during training requires a carbohydrate-rich diet. Whenmuscle glycogen stores drop to low levels, high-intensity exercise cannot be maintained.
The chart below shows a typical training diet for young endurance athletes. Theshort-term use of the high-carbohydrate glycogen loading phase is described in the“Current Recommendations” table below. A male gymnast, track and field man orweight lifter, on average, needs about 4500 kcal/day. A female swimmer needs about3000 kcal/day.
High performance diets used to center around carbohydrate loading. First theathlete would deplete the body of glycogen stored in the liver and muscle by decreasingcarbohydrate intake to 10 percent of calories. Then he would “glycogen load” — eat lotsof carbohydrate the day before the event, so the body would produce and store themaximum amount of glycogen possible.
Glycogen Loading – Current Recommendations
DAY EXERCISE NUTRIENT INTAKE
1 ............. 90 minutes2 ............. 40 minutes3 ............. 40 minutes4 ............. 20 minutes5 ............. 20 minutes6 ....................... Rest
EVENT
�
�
50% Carbohydrate350 gm
70% Carbohydrate490 gm
Training Diet for Young Endurance AthletesCALORIE NEEDS & DISTRIBUTION
Male Gymnasts, Track & Field,Distribution Female Swimmers Weight Liftersof Calories 3000 kcal 4500 kcal
CHO = 70% 2100 kcal (525 gm) 3150 kcal (788 gm)PRO = 15% 450 kcal (113 gm) 675 kcal (169 gm)FAT = 15% 450 kcal (50 gm) 675 kcal (75 gm)

Childhood & Adolescent Nutrition 142
That kind of dieting was found to be dangerous. There was cramping and a num-ber of more severe problems — particularly heart arrhythmias. It is not recommendedfor children and should be used with caution in adolescents.
A high-carbohydrate diet, 55 percent of calories from carbohydrate, is recom-mended for all athletes without glycogen loading. If the adolescent is an enduranceathlete and if glycogen loading is appropriate, the chart below provides guidelines.
There is no advantage to having greater-than-usual glycogen stores for adoles-cent athletes involved in stop-and-start or short-duration exercise (football, wrestling,gymnastics, baseball, volleyball, etc.) To the contrary, the stiffness and heaviness oftenassociated with increased glycogen stores may harm performance. In addition, ad-equate protein intake may be compromised during the high-carbohydrate phase. Forathletes in endurance sports, glycogen stores are important.
Eating so-called “quick energy” foods — mainly simple sugar — is often counter-productive. If you gulp a glucose-loaded drink, you’ll probably get an immediate burstof energy as your blood sugar soars. The body will compensate by raising insulin levelsto get sugar into the cells, returning blood glucose to normal.
When this happens, the blood sugar may then decrease to a level lower than whenyou started. This may cause the body to begin using glycogen for energy sooner than itwould have, had the “quick energy food” not been eaten.
Also, intake of large amounts of refined carbohydrates will draw fluid into thegastrointestinal tract, causing nausea and cramps and contributing to dehydration, aproblem for endurance events.
Using the diet requirements for males (4500 kcal) and females (3000 kcal) and a 70percent carbohydrate, 15 percent protein, 15 percent fat ratio, a sample daily diet isshown below. It's difficult to plan a day’s meals with 24 ounces of bread servings and7.5 cups of fruit — most kids don’t need this kind of serious “training table” diet.
Daily Food Guide for Endurance Athletes
RECOMMENDED AMOUNT OF FOOD
Females MalesFOOD GROUP 3000 kcal 4500 kcal
Milk & milk products (cups) 4 4Protein (ounces) 8 8
Fruits (cups) 3.5 7.5Vegetables (cups) 4 6
Breads & cereals (ounces) 18 24Fats (tsp) 4 5

Childhood & Adolescent Nutrition 143
POST-EVENT MEALS
After exercising, it is important to drink plenty of fluids, and it is also a good timeto start thinking about fueling muscle for the next workout and replacing electrolytesthat have been lost. Since muscles are most efficient at storing glycogen two to threehours after exercising, a high-carbohydrate meal should follow about two hours afterthe event. Fruit juices are an excellent choice immediately after the event since they areeasy to digest. One cup (8 oz) of most juices contains about 30 gm of carbohydrates.
Diet is definitely an important component for athletic performance. The optimalsports diet for children should be built on the basics of proper nutrition outlined byMyPyramid (see Chapter Four).
In addition, following the nutritional guidelines on the previous page shouldensure a teenage athlete maximum performance without causing any health problemssuch as those often seen in teens without proper nutritional guidance.
REFERENCES
Coleman E. Diet, Exercise and Fitness, (6th Ed.), Nutrition Dimension, Ashland OR, 2005.Mahan LK and Rees JM. Nutrition in Adolescence. Mosby, St Louis, 1984.Pipes PL. Nutrition in Infancy and Childhood, (5th Ed.). Mosby, St Louis, 1993.___________ Position of the American Dietetic Association, Dietetian of Canada, and the American
College of Sports Medicine: Nutrition and athletic performance. J Am Diet Assoc, 100(12): 1543-1556, 2000.
Ryan M. Sports drinks: Research asks for reevaluation of current recommendations. J Am Diet Assoc,Supp. 2, 97(10): S197-S198, 1997.
Dietary Guidelines for Athletes
• Eat carbohydrates• Do not skip meals• Snack to increase caloric intake• Get sufficient fluids• Do not go on any fad diets• Do not try to lose weight while training• Avoid unnecessary nutritional supplements

Childhood & Adolescent Nutrition 144
Notes

Childhood & Adolescent Nutrition 145
Chapter Thirteen:Dental Health
Who can resist the beautiful smile of a youngster? Nothing improves the appear-ance of a child more than a smile, and it is the parent’s responsibility that the smile stayshealthy. Not only does is make a child feel more self-confident, good oral health isessential for general overall health and well being.
Although tooth decay is largely preventable, it remains the most common chronicdisease of children aged 5 to 17 years, and is five times more common than asthma andseven times more common than hayfever. Dental caries affect approximately 6 percentof children aged 1 year, 22 percent aged 2 years, 35 percent aged 3 years, 48 percentaged 4 years, over 50 percent of children aged 5 to 9 years, 77 percent of adolescentsaged 12 to 17 years, and 85 percent of adults aged 18 years or older in the United States(J Am Diet Assoc, 2005).
Healthy People 2010 hopes to improve the oral health of children with the followingobjectives:
• Reduce dental caries (cavities) so that the proportion of children with oneor more cavities is no more than 42 percent among children aged 6 to 8 and nomore than 51 percent among adolescents aged 15; and
• Increase to at least 75 percent the proportion of people served bycommunity water systems providing optimal levels of fluoride.
On the average, by the time an American has reached the age of 20, he has had 28to 30 carious tooth surfaces! This is why a healthy diet is so important. It can signifi-cantly influence dental health in three ways:
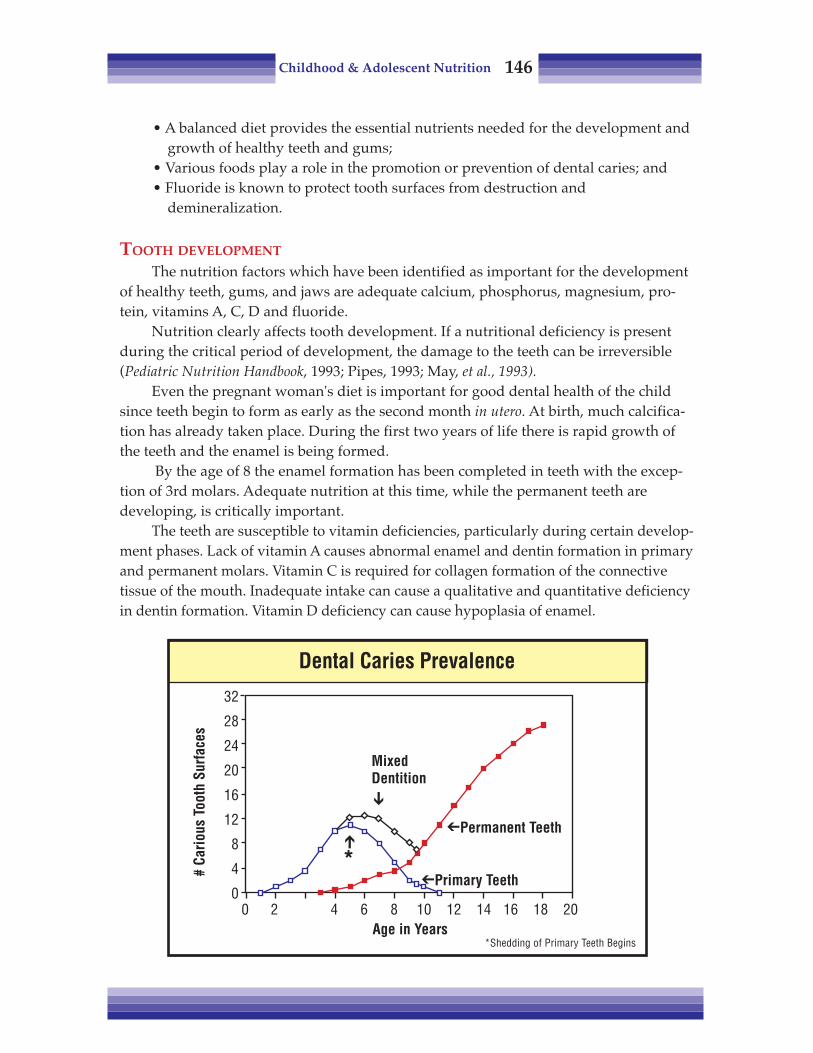
Childhood & Adolescent Nutrition 146
• A balanced diet provides the essential nutrients needed for the development andgrowth of healthy teeth and gums;
• Various foods play a role in the promotion or prevention of dental caries; and• Fluoride is known to protect tooth surfaces from destruction and
demineralization.
TOOTH DEVELOPMENT
The nutrition factors which have been identified as important for the developmentof healthy teeth, gums, and jaws are adequate calcium, phosphorus, magnesium, pro-tein, vitamins A, C, D and fluoride.
Nutrition clearly affects tooth development. If a nutritional deficiency is presentduring the critical period of development, the damage to the teeth can be irreversible(Pediatric Nutrition Handbook, 1993; Pipes, 1993; May, et al., 1993).
Even the pregnant woman's diet is important for good dental health of the childsince teeth begin to form as early as the second month in utero. At birth, much calcifica-tion has already taken place. During the first two years of life there is rapid growth ofthe teeth and the enamel is being formed.
By the age of 8 the enamel formation has been completed in teeth with the excep-tion of 3rd molars. Adequate nutrition at this time, while the permanent teeth aredeveloping, is critically important.
The teeth are susceptible to vitamin deficiencies, particularly during certain develop-ment phases. Lack of vitamin A causes abnormal enamel and dentin formation in primaryand permanent molars. Vitamin C is required for collagen formation of the connectivetissue of the mouth. Inadequate intake can cause a qualitative and quantitative deficiencyin dentin formation. Vitamin D deficiency can cause hypoplasia of enamel.
Dental Caries Prevalence
32
28
24
20
16
12
8
4
00 2 4 6 8 10 12 14 16 18 20
Age in Years
# Ca
rious
Too
th S
urfa
ces
*Shedding of Primary Teeth Begins
MixedDentition�
�Primary Teeth
�Permanent Teeth�
*

Childhood & Adolescent Nutrition 147
Phosphorus, magnesium and calcium are critical in the enamel matrix. During theperiod of enamel formation, these minerals are essential for normal enamel develop-ment (Pediatric Nutrition Handbook, 1993; Pipes, 1993; May, et al., 1993).
Dietary fluoride is also important to tooth development. The combination offluoride with the other minerals in forming the tooth matrix makes the tooth muchstronger and less susceptible to demineralization and cavity formation.
DENTAL CARIES PREVENTION
After forming healthy teeth, it is important to keep them healthy and cavity-free.Sucrose (table sugar), glucose and fructose have been shown to be most effective atcausing cavities. Starches are somewhat cariogenic; amylase in the mouth breaks downstarches into sugars which cause cavities.
How cariogenic is sugar? In countries that consume less than 33 lb of sugar percapita there are practically no dental caries. Even in countries with very little fluoride inthe water, caries virtually disappear when consumption is below 24 lb per capita.Americans consume on average 100 to 125 lb of sugar per capita.
Why does sugar cause cavities? The bacteria living in the mouth, when provideddietary carbohydrates, grow and increase in number and produce acid, which lowersthe pH of the mouth. When it is below a critical point, about pH 5.5, there’s a deminer-alization or erosion of the tooth surface. Over a period of time this exposure can causesufficient erosion to cause a cavity.
The amount of sugar kids consume or how often it is eaten and stays on the teethare important factors in the development of tooth decay. The more often the oral bacte-
Tooth development
��
Exposed enamel
�
Dental plaque formed
��
Produces acid/enzymesDemineralizes enamel
�
CAVITY
Calcium, Phosphorus, Magnesium,Protein, Vitamin A, C, D, Fluoride
Dietary CarbohydrateProtective Factors
Dental Caries: Nutrition Factors

Childhood & Adolescent Nutrition 148
ria have sugar available, and the longer it remains in the mouth, the more time thebacteria have to lower the pH. It is a matter of frequency of consumption and stickiness:how much sugar adheres to the teeth and how long it stays.
As seen in the chart below, the pH of the mouth in a control subject remained fairlyconstant, around 6.7 or 6.8. A rinse with a 10 percent sucrose solution rapidly loweredthe pH below 4.5 — which is the “ideal level for cavity formation — and stays below apH of 5.5 for 25 min. This effect is just from a rinse — imagine what sipping on a sodaall day can do!
Even sticky fruits, like raisins, can be harmful for kids’ teeth, if the residue is notbrushed away. Raisins may be preferable to other sources of sugar for many nutritionreasons, but dental health is not one of them (Klatel, et al., 1991).
Both minimizing sugar intake and limiting the time that the sugar is in contact withthe teeth make a difference. Brushing teeth after eating sweets can help raise the pH andremove sugars left in the crevices of the teeth. When brushing is impossible, childrenshould try to end a meal by drinking plain water or chewing on a firm, fibrous snacksuch as a carrot or celery stick to help remove food scraps and stimulate saliva flow.
Because prolonged exposure of the teeth to carbohydrate-containing liquids cancause tooth decay, children should never sleep or nap with a bottle. Baby bottle toothdecay (BBTD) is caused by exposure of the teeth to sucrose, fructose, or lactose, whichallows the bacteria in the mouth to produce acids and demineralize the teeth. Thesecarbohydrates are found in fruit juice, sweetened liquids, formula and cow’s or breastmilk. Saliva plays an important role in preventing BBTD, but during sleep the produc-tion of saliva is diminished.
Effect of Carbohydrate on Oral pH
7.5
7.0
6.5
6.0
5.5
5.0
4.5
4.0
3.5
pH
0 5 10 15 20 25 30 35Time, minutes
After10% Sucrose Rinse
Control
�
�
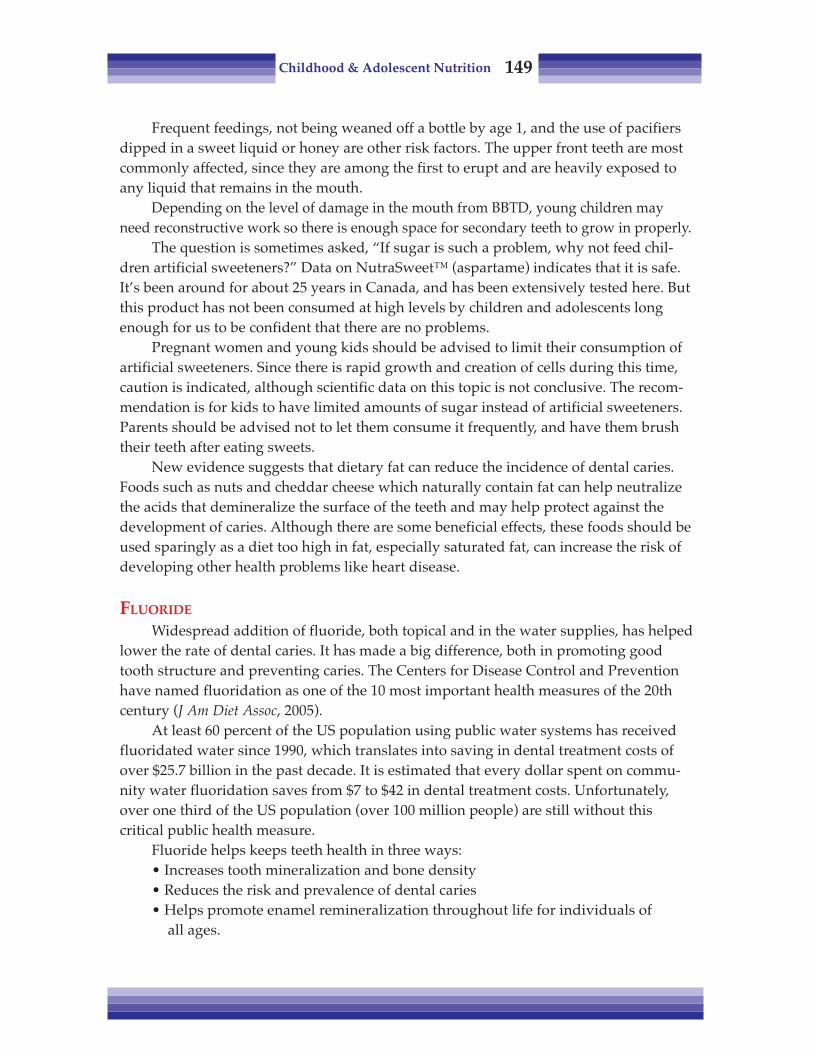
Childhood & Adolescent Nutrition 149
Frequent feedings, not being weaned off a bottle by age 1, and the use of pacifiersdipped in a sweet liquid or honey are other risk factors. The upper front teeth are mostcommonly affected, since they are among the first to erupt and are heavily exposed toany liquid that remains in the mouth.
Depending on the level of damage in the mouth from BBTD, young children mayneed reconstructive work so there is enough space for secondary teeth to grow in properly.
The question is sometimes asked, “If sugar is such a problem, why not feed chil-dren artificial sweeteners?” Data on NutraSweet™ (aspartame) indicates that it is safe.It’s been around for about 25 years in Canada, and has been extensively tested here. Butthis product has not been consumed at high levels by children and adolescents longenough for us to be confident that there are no problems.
Pregnant women and young kids should be advised to limit their consumption ofartificial sweeteners. Since there is rapid growth and creation of cells during this time,caution is indicated, although scientific data on this topic is not conclusive. The recom-mendation is for kids to have limited amounts of sugar instead of artificial sweeteners.Parents should be advised not to let them consume it frequently, and have them brushtheir teeth after eating sweets.
New evidence suggests that dietary fat can reduce the incidence of dental caries.Foods such as nuts and cheddar cheese which naturally contain fat can help neutralizethe acids that demineralize the surface of the teeth and may help protect against thedevelopment of caries. Although there are some beneficial effects, these foods should beused sparingly as a diet too high in fat, especially saturated fat, can increase the risk ofdeveloping other health problems like heart disease.
FLUORIDE
Widespread addition of fluoride, both topical and in the water supplies, has helpedlower the rate of dental caries. It has made a big difference, both in promoting goodtooth structure and preventing caries. The Centers for Disease Control and Preventionhave named fluoridation as one of the 10 most important health measures of the 20thcentury (J Am Diet Assoc, 2005).
At least 60 percent of the US population using public water systems has receivedfluoridated water since 1990, which translates into saving in dental treatment costs ofover $25.7 billion in the past decade. It is estimated that every dollar spent on commu-nity water fluoridation saves from $7 to $42 in dental treatment costs. Unfortunately,over one third of the US population (over 100 million people) are still without thiscritical public health measure.
Fluoride helps keeps teeth health in three ways:• Increases tooth mineralization and bone density• Reduces the risk and prevalence of dental caries• Helps promote enamel remineralization throughout life for individuals of
all ages.

Childhood & Adolescent Nutrition 150
The chart below comes from the American Academy of Pediatrics and addressesthe issue of fluoride levels in the drinking water supply. It provides recommendationson oral supplementation of fluoride, depending on the fluoride level of the watersupply. As noted in the chart, if there are significant amounts of fluoride in the water,supplementing is not necessary. Even when living in an area with a fluoridated watersupply, fluoride intake may not meet the recommended amount if drinking bottledwater or water that is filtered through a process called reverse osmosis. How does onefind out how much fluoride is in the water supply? Call your local water district, orcounty health department (Pediatric Nutrition Handbook, 1993).
Fluoride supplements are available only by prescription as a single supplement orin combination with other vitamins. It is important that parents be warned not to over-supplement a child with fluoride. In a very young child, ingesting excess amount offluoride over a prolonged period of time may cause fluorosis or white flecks to developon the permanent teeth. To avoid excess fluoride intake by children, the AmericanDental Association has recommended that no more than 264 mg sodium fluoride (120mg fluoride) be dispensed at one time).
Topical fluoride that is applied to the surface of the teeth through the use of fluori-dated toothpaste, mouthwash, or fluoride treatments, helps enhance the decay resis-tance of the outer enamel layers of the teeth. These products are designed for topical useand should not be swallowed. This is why pediatric dentists recommend that no morethan a tiny, pea-sized drop of fluoride toothpaste be used by young children, and thatthe use of fluoridated mouthwash be avoided by children under the age of 6.
Children who are given the benefit of good nutrition and early dental care candevelop healthy habits that continue into adulthood.
Fluoride Supplementation Recommendations
Based on age of child and concentration of fluoride in drinking water.
Fluoride Ion Level in Drinking Water (ppm)*Age <0.3 ppm 0.3 to 0.7 ppm >0.6 ppm
Birth - 6 months None None None6 months - 3 years 0.25 mg/day** None None3 - 6 years 0.50 mg/day** 0.25 mg/day** None6 - 16 years 1.0 mg/day** 0.50 mg/day** None
*1.0 part per million (ppm) = 1 milligram/liter (mg/L)**Supplements provided as sodium fluoride. One mg of fluoride is obtainedfrom 2.2 mg sodium fluotide.
Source: American Dental Association Council (J Am Diet Assoc, 2005).

Childhood & Adolescent Nutrition 151
REFERENCES
Alvarez JO, Caceda J, et al. A longitudinal study of dental caries in the primary teeth of children whosuffered from infant malnutrition. J of Dental Research, 72 (12), 1573-6, 1993.
Dietz W and Stern L (editors). Guide to Your Child’s Nutrition. Villard, New York, 1999.Healthy People 2010: National Health Promotion and Disease Prevention. US Dept. of Health and Human
Services, Public Health Services. Washington DC, 2000.Klatel J, Kaplan A and Williams G. The Mount Sinai Medical Center Family Guide to Dental Health.
MacMillan, NY, 1991.May RL, Goodman AH and Meindl RS. Response of bone and enamel formation to nutritional
supplementation and morbidity among malnourished Guatemalan children. Am J Phys Anthro-pology, 92(1):37-51, 1993.
Pediatric Nutrition Handbook, (3rd Ed.). American Academy of Pediatrics, Committee on Nutrition,Elk Grove IL, 1993.
Pediatric Nutrition Handbook, (6th Ed.). American Academy of Pediatrics, Committee on Nutrition, ElkGrove IL, 1999.
Pipes PL. Nutrition in Infancy and Childhood, (5th Ed.). Mosby, St. Louis, 1993.__________ Position of the American Dietetic Association: The impact of fluoride on health. J Am Diet
Assoc, 105:1620-1628, 2005.__________ Position of the American Dietetic Association: Oral health and nutrition. J Am Diet Assoc,
103: 615-625, 2003.Rugg-Gunn AJ. Nutrition, diet and dental public health. Community Dental Health, 10 Suppl. 2:47-56,
1993.

Childhood & Adolescent Nutrition 152
Notes
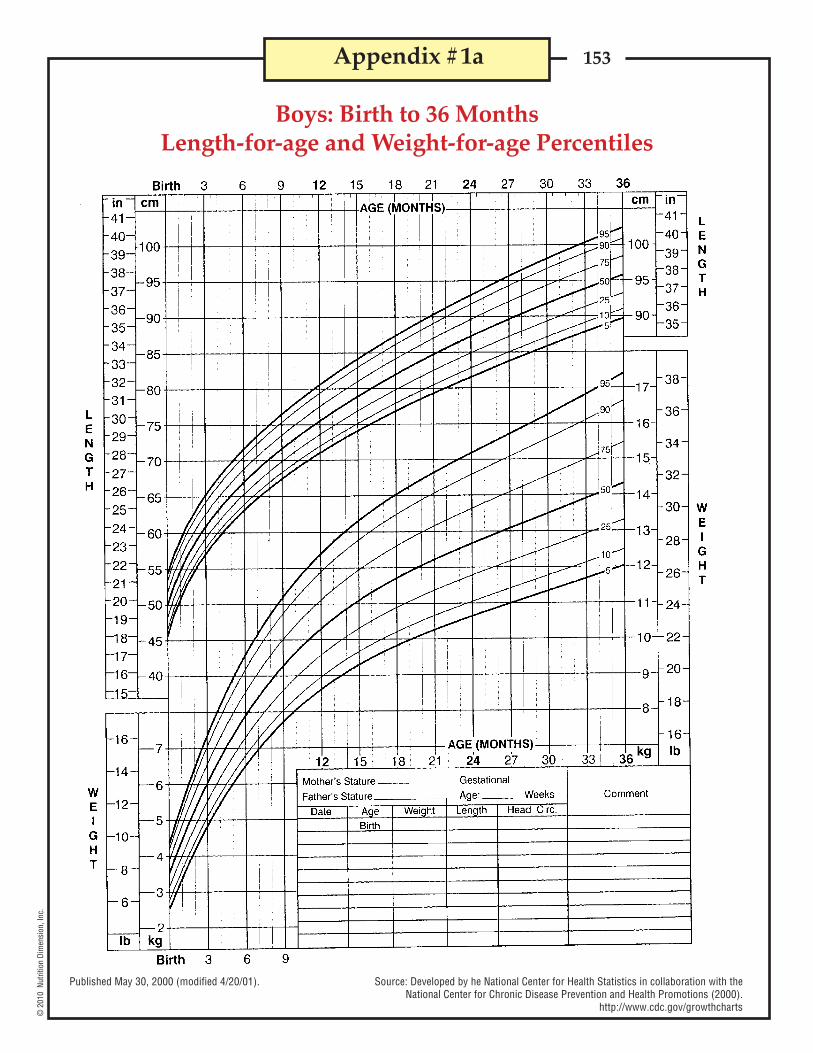
153©
201
0 N
utrit
ion
Dim
ensi
on, I
nc.
Appendix #1a
Boys: Birth to 36 MonthsLength-for-age and Weight-for-age Percentiles
Published May 30, 2000 (modified 4/20/01). Source: Developed by he National Center for Health Statistics in collaboration with theNational Center for Chronic Disease Prevention and Health Promotions (2000).
http://www.cdc.gov/growthcharts

154©
201
0 N
utrit
ion
Dim
ensi
on, I
nc.
Appendix #1b
Girls: Birth to 36 MonthsLength-for-age and Weight-for-age Percentiles
Published May 30, 2000 (modified 4/20/01). Source: Developed by he National Center for Health Statistics in collaboration with theNational Center for Chronic Disease Prevention and Health Promotions (2000).
http://www.cdc.gov/growthcharts

155©
201
0 N
utrit
ion
Dim
ensi
on, I
nc.
Appendix #2a
Boys: 2 to 20 YearsStature-for-age and Weight-for-age Percentiles
Published May 30, 2000 (modified 4/20/01). Source: Developed by he National Center for Health Statistics in collaboration with theNational Center for Chronic Disease Prevention and Health Promotions (2000).
http://www.cdc.gov/growthcharts

156©
201
0 N
utrit
ion
Dim
ensi
on, I
nc.
Appendix #2b
Girls: 2 to 20 YearsStature-for-age and Weight-for-age Percentiles
Published May 30, 2000 (modified 4/20/01). Source: Developed by he National Center for Health Statistics in collaboration with theNational Center for Chronic Disease Prevention and Health Promotions (2000).
http://www.cdc.gov/growthcharts

157©
201
0 N
utrit
ion
Dim
ensi
on, I
nc.
Appendix #3a
Boys: Birth to 36 MonthsHead Circumference-for-age and Weight-for-length Percentiles
Published May 30, 2000 (modified 4/20/01). Source: Developed by he National Center for Health Statistics in collaboration with theNational Center for Chronic Disease Prevention and Health Promotions (2000).
http://www.cdc.gov/growthcharts

158©
201
0 N
utrit
ion
Dim
ensi
on, I
nc.
Appendix #3b
Girls: Birth to 36 MonthsHead Circumference-for-age and Weight-for-length Percentiles
Published May 30, 2000 (modified 4/20/01). Source: Developed by he National Center for Health Statistics in collaboration with theNational Center for Chronic Disease Prevention and Health Promotions (2000).
http://www.cdc.gov/growthcharts
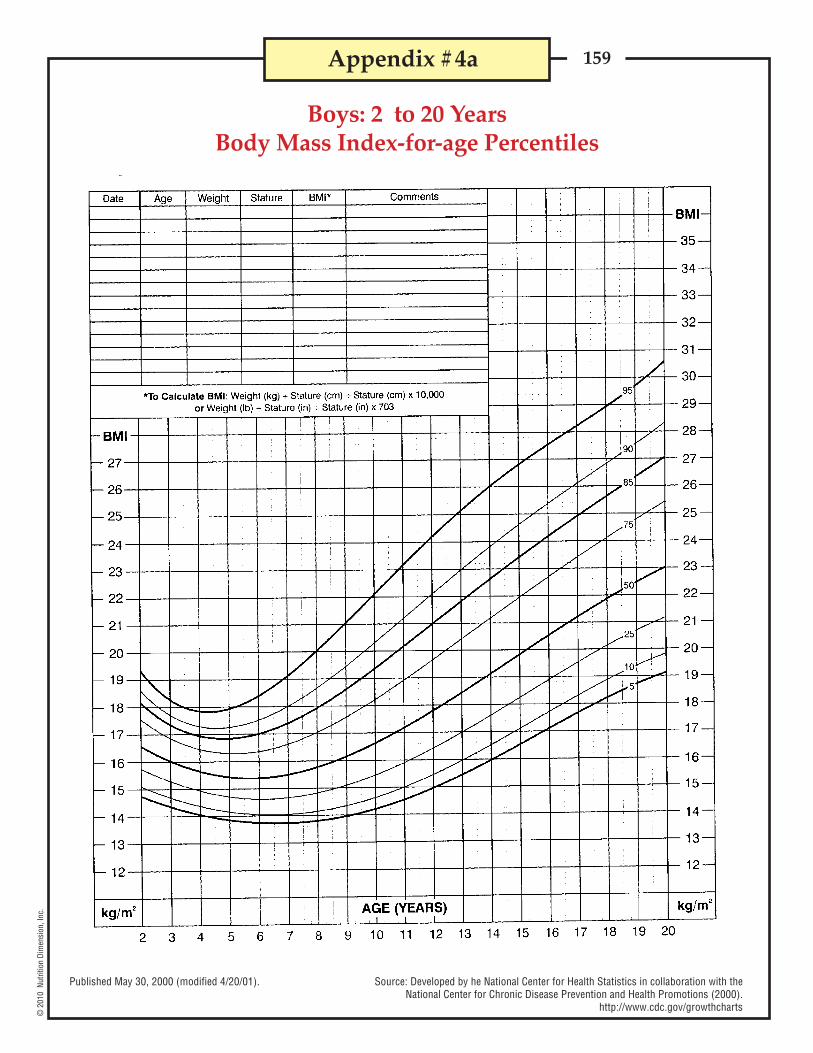
159©
201
0 N
utrit
ion
Dim
ensi
on, I
nc.
Appendix #4a
Boys: 2 to 20 YearsBody Mass Index-for-age Percentiles
Published May 30, 2000 (modified 4/20/01). Source: Developed by he National Center for Health Statistics in collaboration with theNational Center for Chronic Disease Prevention and Health Promotions (2000).
http://www.cdc.gov/growthcharts
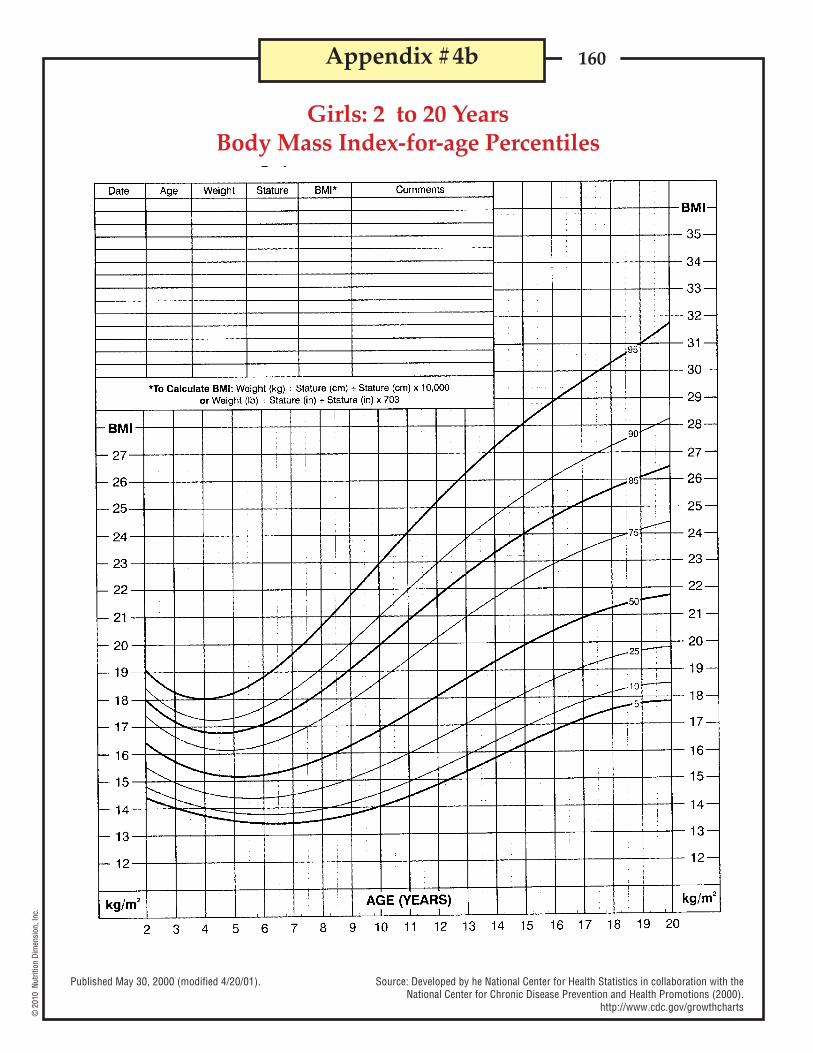
160©
201
0 N
utrit
ion
Dim
ensi
on, I
nc.
Appendix #4b
Girls: 2 to 20 YearsBody Mass Index-for-age Percentiles
Published May 30, 2000 (modified 4/20/01). Source: Developed by he National Center for Health Statistics in collaboration with theNational Center for Chronic Disease Prevention and Health Promotions (2000).
http://www.cdc.gov/growthcharts

161©
201
0 N
utrit
ion
Dim
ensi
on, I
nc.
Appendix #5
Calcium Content of Foods and Supplements
DairyMilk, whole
fat freereduced fat (2%)lowfat (1%)
Yogurt, plain, lowfat lowfat fruit frozen, vanilla soft serve
Ricotta cheese, part skim milkCottage cheese, 2%Cheddar cheesePudding, chocolate, dry instant, prepared w/2% milk
vanilla, dry instant, prepared w/2% milkSeafood
Sardines, canned (with bones, oil packed, drained)Salmon, canned (with bones, packed in juice)Shrimp, cookedPerch, Atlanic, cookedOysters, raw
Grains, nuts and beansAmaranth, cookedAlmondsCashewsTofu, softFarina, quick, cooked w/waterBeans, lima
kidney, cannedFruits and vegetables
Broccoli, cookedCabbage, cookedKale, cooked (frozen)Carrots, rawSpinach, cooked (fresh)Bok choyOkra, cooked (frozen)Turnip greens, cooked (fresh)OrangesPeaches, driedPrunes, cookedRhubarb, cooked, frozen with sugar
SugarsBlackstrap molassesSugar, brown
1 cup1 cup1 cup1 cup1 cup1 cup1 cup1/4 cup1 cup1 oz1 cup1 cup
3 oz3 oz3 oz3 oz6 medium
1 cup1 oz1 cup4 oz1 cup1 cup1 cup
1 cup1 cup1/2 cup1 cup1/2 cup1/2 cup1/2 cup1/2 cup1 medium1 halves1 cup1 cup
1 tbsp1 tsp
276299293305415345206167206204306302
32518112311638
2757512
1332325164
62729036
123798999521147
348
1403
Food Serving size Amount (mg)
Source: USDA, National Dairy Council
Calcium carbonateCalcium sulfateDibasic Ca phosphateTribasic Ca phosphateCalcium lactateCalcium gluconateCalcium ascorbateCalcium citrate
2.52.83.42.65.4
10.79.74.2
Supplements # of 1000 mg Tablets toCalcium Salt % Calcium equal 1000 mg Calcium
40.036.129.538.818.4
9.310.324.1

162©
201
0 N
utrit
ion
Dim
ensi
on, I
nc.
Appendix #6
Triceps Skinfold Percentiles*Males
1 - 1.92 - 2.93 - 3.94 - 4.95 - 5.96 - 6.97 - 7.98 - 8.99 - 9.9
10 - 10.911 - 11.912 - 12.913 - 13.914 - 14.915 - 15.916 - 16.917 - 17.918 - 18.9
1 - 1.92 - 2.93 - 3.94 - 4.95 - 5.96 - 6.97 - 7.98 - 8.99 - 9.9
10 - 10.911 - 11.912 - 12.913 - 13.914 - 14.915 - 15.916 - 16.917 - 17.918 - 18.9
*Percentiles for triceps skinfold (mm) for whites of the U.S.
Females
Source: Health & Nutrition Examination Survey I, 1971-1974
Age Group, years
Age Group, years
5666665556666544454
5667766668778898101010
25888887777888776666
258998889910101011121312151315
5010101099898101011111098889
101011101010111213121314151617181918
50
10777666666666555555
10
78887678888981010121212
121211111110121013141514141411121213
75
75121212121212131516171818212121222422
90141414121413151317182022222118161620
90141514141514161820232423262625263026
95161515141516171618212428262424221924
95161615161816182422272827302832313730
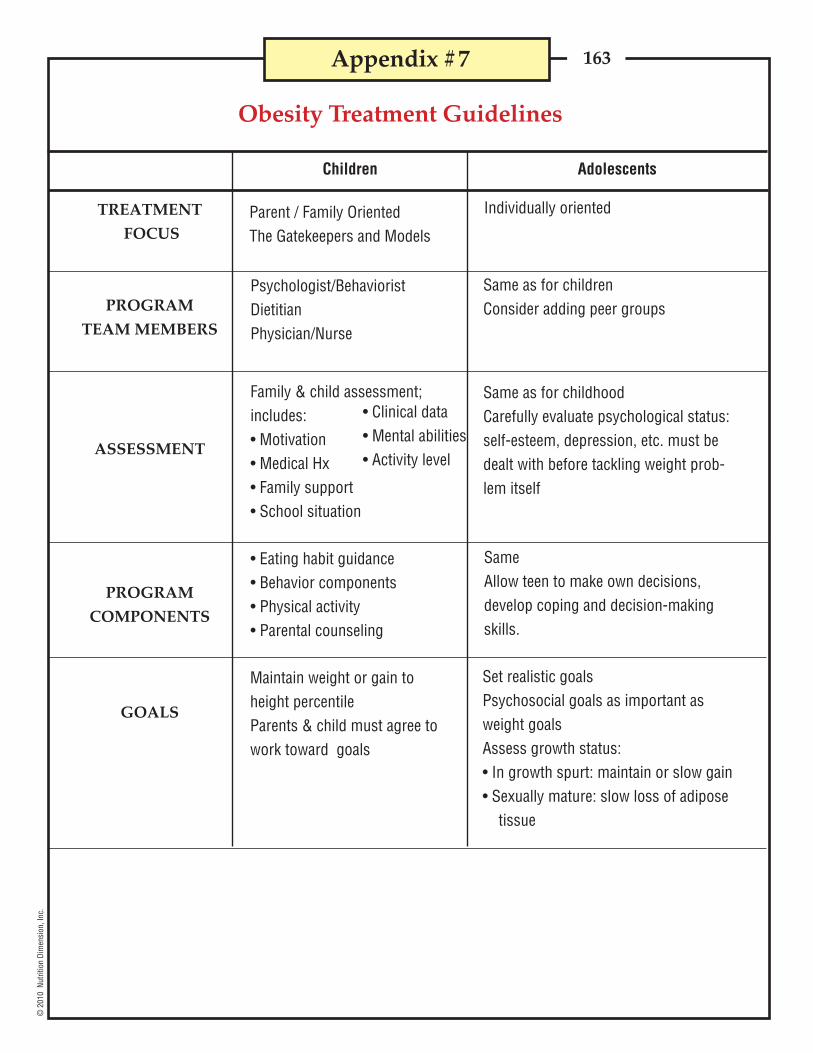
163©
201
0 N
utrit
ion
Dim
ensi
on, I
nc.
Appendix #7
TREATMENT
FOCUS
PROGRAM
TEAM MEMBERS
ASSESSMENT
PROGRAM
COMPONENTS
GOALS
Parent / Family OrientedThe Gatekeepers and Models
Individually oriented
Family & child assessment;includes:• Motivation• Medical Hx• Family support• School situation
• Clinical data• Mental abilities• Activity level
SameAllow teen to make own decisions,develop coping and decision-makingskills.
Set realistic goalsPsychosocial goals as important asweight goalsAssess growth status:• In growth spurt: maintain or slow gain• Sexually mature: slow loss of adipose
tissue
Children Adolescents
Obesity Treatment Guidelines
Maintain weight or gain toheight percentileParents & child must agree towork toward goals
• Eating habit guidance• Behavior components• Physical activity• Parental counseling
Same as for childhoodCarefully evaluate psychological status:self-esteem, depression, etc. must bedealt with before tackling weight prob-lem itself
Same as for childrenConsider adding peer groups
Psychologist/BehavioristDietitianPhysician/Nurse

164©
201
0 N
utrit
ion
Dim
ensi
on, I
nc.
Vita
min
D (μ
g/d)
a,b
Thia
min
(mg/
d)Ri
bofla
vin
(mg/
d)Ni
acin
(mg/
d)c
5*
5*
5*
5*
5*
5*
5*
5*
0.2*
0.3*
0.5
0.6
0.9
1.2
0.9
1.0
0.3*
0.4*
0.5
0.6
0.9
1.3
0.9
1.0
2*
4*
6
8
12
16
12
14
Vita
min
C (m
g/d)
Vita
min
E1
(mg/
d)f
40*
50*
15
25
45
75
45
65
4*
5*
6
7
11
15
11
15
Note: This table presents Recommended Dietary Allowances (RDA) in bold type and Adequate Intakes (AI) in ordinary type followed by an asterisk (*).RDAs and AIs may both be used as goals for individual intake. RDAs are set to meet the needs of almost all (97-98%) individuals in a group. For healthybreast-fed infants, the AI is the mean intake. The AI for other life-stage and gender groups is believed to cover needs of all individuals in the group, butlack of data or uncertainty in the data prevent being able to specify with confidence the percentage of individuals covered by this intake.
* RDAs and AIs may both be used as goals for individual intake. RDAs are set to meet the needs of almost all (97 to 98 percent) individuals in a group. Forhealthy breastfed infants, the AI is the man intake. The AI for other life stage and gender groups is believed to cover needs of all individuals in the group,but lack of data or uncertainty in that data prevent being able to specify with confidence the percentage of individuals covered by this intake.
© 2001 by the National Academy of Sciences. Reprinted courtesy of the National Academy Press, Washington, DC.Source: Copyrighted 2002 by the National Academy of Science. Reprinted courtesy of the National Academy Press, Washington, DC.
Appendix #8
CHILDREN
INFANTS
Dietary Reference IntakesRecommended Dietary Allowances & Adequate Intakes
for Children and Adolescents
ADOLESCENTS
Vita
min
A (μ
g/d)
Vita
min
K (μ
g/d)
Age
0-6mo.
7-12mo.
1-3yrs.
4-8yrs.
9-13yrs.
14-18yrs.
9-13yrs.
14-18yrs.
400
500
300
400
600
900
600
700
2.0
2.5
30
55
60
75
60
75
MALES
FEMALES
9.1*
11
13
19
34
52
34
46
Prot
ein
(gm
/day
)60*
95*
130
130
130
130
130
130
Carb
ohyd
rate
(gm
/day
)
ND
ND
19*
25*
31*
38*
26*
26*
Tota
l Fib
er(g
m/d
ay)

165©
201
0 N
utrit
ion
Dim
ensi
on, I
nc.
Fola
te (μ
g/d)
dVi
tam
in B 12
(mg/
d)Pa
ntot
heni
c Aci
d (m
g/d)
65*
80*
150
200
300
400
300
400
0.4*
0.5*
0.9
1.2
1.8
2.4
1.8
2.4
1.7*
1.8*
2*
3*
4*
5*
4*
5*
Biot
in (μ
g/d)
Chol
ine
(mg/
d)e
Sele
nium
(μg/
d)
5*
6*
8*
12*
20*
25*
20*
25*
125*
150*
200*
250*
375*
550*
375*
400*
15*
20*
20
30
40
55
40
55
Calc
ium
(mg/
d)
Phos
phor
us (m
g/d)
Mag
nesi
um (m
g/d)
210*1
270*
500*
800*
1300*
1300*
1300*
1300*
100*
275*
460
500
1250
1250
1250
1250
Iron
(mg/
d)
Zinc
(mg/
d)
Iodi
ne (μ
g/d)
30*
75*
80
130
240
410
240
360
a As cholecalciferol. 1μg cholecalciferol=40 IU vitamin D.b In the absence of adequate exposure to sunlight.c As niacin equivalents (NE). 1 mg of niacin=60 mg of tryptophan; 0-6 months=preformed niacin (not NE).d As dietary folate equivalents (DFE). 1 DFE 1μg food folate=0.6 μg of folic acid from fortified food or as a supplement consumed with food=0.5 μg of a
supplement taken on an empty stomach.e Although AIs have been set for choline, there are few data to assess whether a dietary supply of choline is needed at all stages of the life cycle, and it may
be that the choline requirement can be met by endogenous synthesis at some of these stages.f As a-tocopherol. a-tocopherol includes RRR-a-tocopherol, the only form of a-tocopherol that occurs naturally in foods, and the 2R-stereoisomeric forms
of a-tocopherol (RRR-, RSR-, and RSS-a-tocopherol) that occur in fortified foods and supplements. It does not include the 2S-stereoisomeric forms of a-tocopherol (SRR-, SSR-, SRS-, and SSS-a-tocopherol), also found in fortified foods and supplements.
0.27*
11
7
10
8
11
8
15
2*
3
3
5
8
11
8
9
110*
130*
90
90
120
150
120
150
Vita
min
B 6 (m
g/d)
0.1*
0.3*
0.5
0.6
1.0
1.3
1.0
1.2
Fluo
ride
(mg/
d)
0.01*
0.5*
0.7*
1*
2*
3*
2*
3*
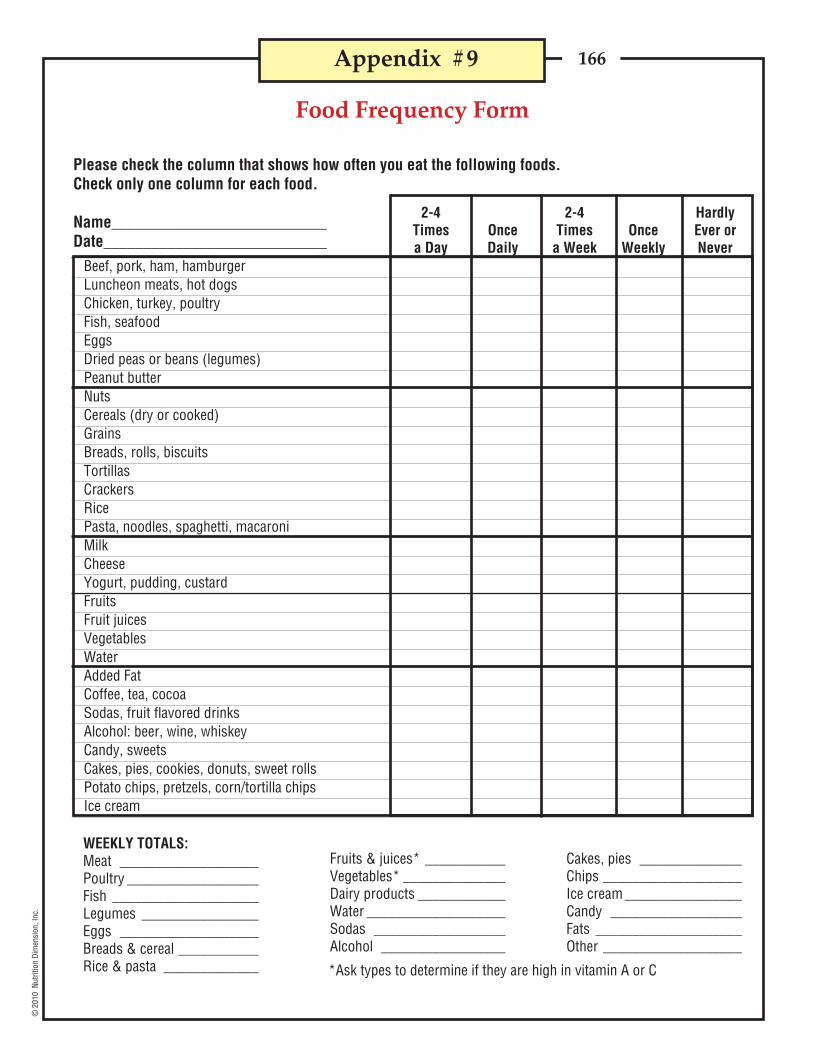
166©
201
0 N
utrit
ion
Dim
ensi
on, I
nc.
Appendix #9
Food Frequency Form
Please check the column that shows how often you eat the following foods.Check only one column for each food.
Name___________________________Date____________________________
2-4 2-4 HardlyTimes Once Times Once Ever ora Day Daily a Week Weekly Never
Beef, pork, ham, hamburgerLuncheon meats, hot dogsChicken, turkey, poultryFish, seafoodEggsDried peas or beans (legumes)Peanut butterNutsCereals (dry or cooked)GrainsBreads, rolls, biscuitsTortillasCrackersRicePasta, noodles, spaghetti, macaroniMilkCheeseYogurt, pudding, custardFruitsFruit juicesVegetablesWaterAdded FatCoffee, tea, cocoaSodas, fruit flavored drinksAlcohol: beer, wine, whiskeyCandy, sweetsCakes, pies, cookies, donuts, sweet rollsPotato chips, pretzels, corn/tortilla chipsIce cream
WEEKLY TOTALS:Meat ___________________Poultry __________________Fish ____________________Legumes ________________Eggs ___________________Breads & cereal ___________Rice & pasta _____________
Fruits & juices* ___________Vegetables* ______________Dairy products ____________Water ___________________Sodas __________________Alcohol _________________
Cakes, pies ______________Chips ___________________Ice cream ________________Candy __________________Fats ____________________Other ___________________
*Ask types to determine if they are high in vitamin A or C
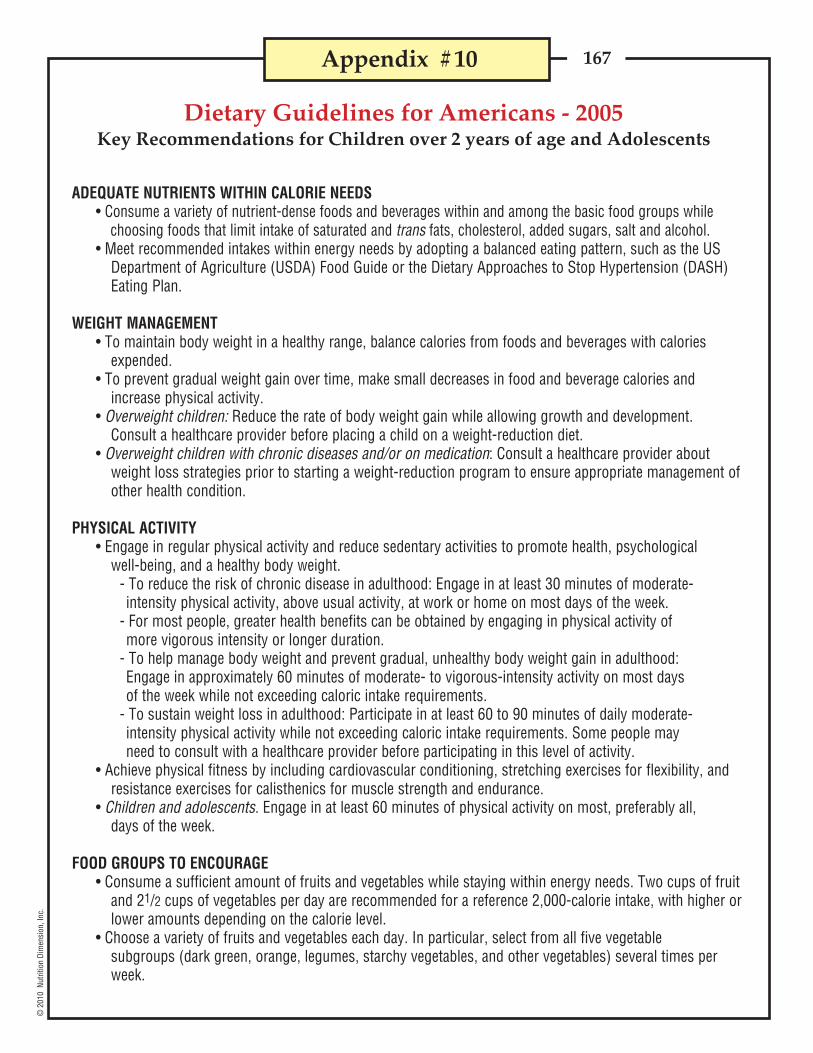
167©
201
0 N
utrit
ion
Dim
ensi
on, I
nc.
Dietary Guidelines for Americans - 2005Key Recommendations for Children over 2 years of age and Adolescents
Appendix #10
ADEQUATE NUTRIENTS WITHIN CALORIE NEEDS• Consume a variety of nutrient-dense foods and beverages within and among the basic food groups while
choosing foods that limit intake of saturated and trans fats, cholesterol, added sugars, salt and alcohol.• Meet recommended intakes within energy needs by adopting a balanced eating pattern, such as the US
Department of Agriculture (USDA) Food Guide or the Dietary Approaches to Stop Hypertension (DASH)Eating Plan.
WEIGHT MANAGEMENT• To maintain body weight in a healthy range, balance calories from foods and beverages with calories
expended.• To prevent gradual weight gain over time, make small decreases in food and beverage calories and
increase physical activity.• Overweight children: Reduce the rate of body weight gain while allowing growth and development.
Consult a healthcare provider before placing a child on a weight-reduction diet.• Overweight children with chronic diseases and/or on medication: Consult a healthcare provider about
weight loss strategies prior to starting a weight-reduction program to ensure appropriate management ofother health condition.
PHYSICAL ACTIVITY• Engage in regular physical activity and reduce sedentary activities to promote health, psychological
well-being, and a healthy body weight.- To reduce the risk of chronic disease in adulthood: Engage in at least 30 minutes of moderate-intensity physical activity, above usual activity, at work or home on most days of the week.
- For most people, greater health benefits can be obtained by engaging in physical activity ofmore vigorous intensity or longer duration.
- To help manage body weight and prevent gradual, unhealthy body weight gain in adulthood:Engage in approximately 60 minutes of moderate- to vigorous-intensity activity on most daysof the week while not exceeding caloric intake requirements.
- To sustain weight loss in adulthood: Participate in at least 60 to 90 minutes of daily moderate-intensity physical activity while not exceeding caloric intake requirements. Some people mayneed to consult with a healthcare provider before participating in this level of activity.
• Achieve physical fitness by including cardiovascular conditioning, stretching exercises for flexibility, andresistance exercises for calisthenics for muscle strength and endurance.
• Children and adolescents. Engage in at least 60 minutes of physical activity on most, preferably all,days of the week.
FOOD GROUPS TO ENCOURAGE• Consume a sufficient amount of fruits and vegetables while staying within energy needs. Two cups of fruit
and 21/2 cups of vegetables per day are recommended for a reference 2,000-calorie intake, with higher orlower amounts depending on the calorie level.
• Choose a variety of fruits and vegetables each day. In particular, select from all five vegetablesubgroups (dark green, orange, legumes, starchy vegetables, and other vegetables) several times perweek.

168©
201
0 N
utrit
ion
Dim
ensi
on, I
nc.
Dietary Guidelines for Americans - 2005, cont.
Appendix #10, cont.
FOOD GROUPS TO ENCOURAGE, continued• Consume 3 or more ounce-equivalents of whole-grain products per day, with the rest of the
recommended grains coming from enriched or whole-grain products. In general, at least half the grainsshould come from whole grains.
• Consume 3 cups per day of fat-free or low-fat milk or equivalent milk products.• Children and adolescents: Consume whole-grain products often; at least half the grains should be
whole grains. Children 2 to 8 years should consume 2 cups per day of fat-free or low-fat or equivalentmilk products. Children 9 years of age and older should consume 3 cups per day of fat-free or low-fatmilk or equivalent milk products.
FATS• Consume less than 10 percent of calories from saturated fatty acids and less than 300 mg/day of
cholesterol, and keep trans fatty acid consumption as low as possible.• Keep total fat intake between 20-35% of calories, with most fats coming from sources of poly-unsaturated
and mono-unsaturated fatty acids, such as fish, nuts and vegetable oils.• When selecting and preparing meat, poultry, dry beans, and milk or milk products, make choices that
are lean, low-fat, or fat-free.• Limit intake of fats and oils high in saturated and/or trans fatty acids, and choose products low in such
fats and oils.• Children and adolescents: Keep total fat intake between 30-35% of calories for ages 2-3 years and
between 25-35% of calories for ages 4-18, with most fats coming from sources of polyunsaturated andmono-unsaturated fatty acids, such as fish, nuts, and vegetable oils.
CARBOHYDRATES• Choose fiber-rich fruits, vegetables, and whole grains often.• Choose and prepare foods and beverages with little added sugars or caloric sweeteners, such as
amounts suggested by the USDA Food Guide and the DASH Eating Plan.• Reduce the incidence of dental caries by practicing good oral hygiene and consuming sugar- and starch-
containing foods and beverages less frequently.
SODIUM AND POTASSIUM• Consume less than 2,300 mg (approximately 1 teaspoon of salt) of sodium daily.• Choose and prepare foods with little salt. At the same time, consume potassium-rich foods, such as
fruits and vegetables.
FOOD SAFETY• To avoid microbian foodborne illness:
- Clean hands, food contact surfaces, and fruits and vegetables. Meat and poultry should not be washedor rinsed.
- Separate raw, cooked, and ready-to-eat foods while shopping, preparing, or storing foods.- Cook foods to a safe temperature to kill microorganisms.- Chill (refrigerate) perishable food promptly and defrost foods properly.- Avoid raw (unpasteurized) milk or any products made from unpasteurized milk, raw or partially
cooked eggs or foods containing raw eggs, raw or undercooked meat and poultry, unpasteurizedjuices, and raw sprouts.
Note: The Dietary Guidelines for Americans 2005 contains additional recommendations for specific populations besides children.The full document is available at <www.healthierus.gov/>

169©
201
0 N
utrit
ion
Dim
ensi
on, I
nc.
Appendix #11
Vitamin and Mineral Supplements% Daily Value (DV)
Doses: 1 Tablet for children over 4* For Adults and children 4 years of age and older.
$12.99 / 14¢
ADEC
Folic AcidB1
B2
Niacin
B6
B12
BiotinPantothenic Acid
PABAIron
CalciumPhosphorus
IodineMagnesiumManganese
Zinc
CopperMolybdenum
Chromium
Vitamin KSelenium
FlintstonesComplete
Centrum KidsCompleteNatural Factors
Long’sMultivitamins
5010050
100
70707060
5375--
----
----
---
--
$4.89 / 5¢
3510085
170
5027029050
200170 490
- 30
6 -
- 6
50 15
--
-
- -
100100 50100
100100100100
100100 15100
-100 11 5
100 10 50 100
100 27 17
13-
100100100100
100100100100
100100 13100
-100 10 10
100 5 -100
100 - -
- -
$7.29 / 12¢ $8.59 / 14¢Price/Priceper Tablet
Nutrient
Brand
�
�
�

170©
201
0 N
utrit
ion
Dim
ensi
on, I
nc.
Appendix #12
Diagnostic Criteria for ADHDA. Either 1 or 2:1. six (or more) of following inattention symptoms have persisted for at least 6 months to a degree that is
maladaptive & inconsistent w/developmental level:Inattention- often fails to give close attention to details, makes careless mistakes in schoolwork, work, other activities- often has difficulty sustaining attention in tasks, play activities- often does not seem to listen when spoken to directly- often does not follow through on instructions, fails to finish schoolwork, chores, duties in workplace
(not due to oppositional behavior or failure to understand instructions)- often has difficulty organizing tasks, activities- often avoids, dislikes, or is reluctant to engage in tasks that require sustained mental effort (such as
schoolwork or homework)- often loses things necessary for tasks or activities (e.g., toys, school assignments, pencils, books, tools)- is often easily distracted by extraneous stimuli- is often forgetful in daily activities
2. six (or more) of following hyperactivity-impulsivity symptoms have persisted for at least 6 months to a degree that is maladaptive & inconsistent w/developmental level:Hyperactivity- often fidgets with hands or feet or squirms in seat- often leaves seat in classroom or in situation in which remaining seated is expected- often runs about or climbs excessively in situations in which it is inappropriate (in adolescents or adults,
may be limited to subjective feelings of restlessness)- often has difficulty playing or engaging in leisure activities quietly- is often “on the go” or often acts as if “driven by a motor”- often talks excessively Impulsivity- often blurts out answers before questions have been completed- often has difficulty awaiting turn- often interrupts or intrudes on others (e.g., butts into conversations, games)
B. Some hyperactive-impulsive or inattentive symptoms that caused impairment were present before age 7C. Some impairment from symptoms is present in 2 (or more) settings (e.g., at school or work and at home)D. There must be clear evidence of clinically significant impairment in social, academic, or occupational
functioningE. The symptoms do not occur exclusively during course of a pervasive developmental disorder,
schizophrenia or other psychotic disorder and are not better accounted for by another mental disorder (e.g., mood disorder, anxiety disorder, dissociative disorder or personality disorder)
Subtypes:Attention-Deficit/Hyperactivity Disorder, Combined Type: if both Criteria A1 and A2 are met for past 6
monthsAttention-Deficit/Hyperactivity Disorder, Predominantly Inattentive Types: if Criterion A1 is met but Crite-
rion A2 is not met for past 6 monthsAttention-Deficit/Hyperactivity Disorder, Predominantly Hyperactive-Impulsive Type: if Criterion A2 is met
but Criterion A1 is not met for the past 6 monthsSource: Diagnostic and Statistical Manual of Mental Disorders IV-TR, 2000

171©
201
0 N
utrit
ion
Dim
ensi
on, I
nc.
Appendix #13
FAT Cholesterol SodiumRestaurant/Food KCAL (gm) (mg) (mg)
Burger KingWhopper 670 40 75 1020Tendercrisp Chicken sandwich 800 46 70 1640Double Whopper 920 58 140 1090Whopper Jr. 340 20 35 530Hamburger 260 11 30 520Cheeseburger 310 15 40 740Chicken Tenders (4)(crown shaped) 180 11 30 310Veggie Burger w/cheese 42 16 5 1100French Fries - Large, salted 440 22 0 670Onion Rings - Large 450 24 0 700
Carl's Jr.Famous Star Burger w/cheese 660 39 80 1300Super Star w/cheese 920 58 145 1640Western Bacon six dollar Burger 1020 53 130 2520Chicken Club Sandwich 560 27 90 1280French Fries - Large 500 24 0 1290Onion Rings 530 28 0 590Fried Zucchini 330 18 0 610
Del TacoTaco 130 7 20 180Soft Taco 150 6 20 330Chicken Soft Taco 220 12 45 490Big Fat Steak Taco 390 18 40 790Macho Beef Burrito 1010 44 190 2140Del Classic Chicken Burrito 510 33 75 990Del Beef Burrito 470 20 85 1180Regular Quesadilla 570 29 130 1180Deluxe Chile Cheese Fries 610 36 60 930
Domino's Pizza (information for one slice of 8 equal slices)12" Hand-tossed, Cheese 180 6 15 32512" Hand-tossed, Pepperoni 150 4 5 25512" Deep Dish, Pepperoni 190 9 15 380
Popular Selections at Fast Food Restaurants

172©
201
0 N
utrit
ion
Dim
ensi
on, I
nc.
FAT Cholesterol SodiumRestaurant/Food KCAL (gm) (mg) (mg)
Kentucky Fried ChickenOriginal Recipe - Breast 320 15 145 1150Original Recipe - Thigh 220 15 165 1060Chicken Sandwich w/sauce 490 24 80 1180
Original recipe filet
McDonald'sQuarter Pounder w/cheese 510 26 90 1190Big Mac 540 29 75 1040Hamburger 250 9 25 520Cheeseburger 300 12 40 750Filet-O-Fish 380 18 40 640Chicken McNuggets (6) 280 17 35 600French Fries - Large 500 25 0 350
Pizza Hut (information for 1 slice of 8 equal slices)Pan - 12" medium pan
Cheese 240 10 25 530Pepperoni 260 12 26 590Meat Lover's 330 18 40 840
Taco BellTostada 250 10 15 730Taco 170 10 30 330Soft Taco - Beef 210 9 30 620Soft Taco Supreme - Beef 240 11 35 650Mexican Pizza 540 30 45 1020Fiesta Taco Salad w/salsa (no shell) 300 12 40 1350Chicken Quesadilla 520 28 75 1420
Wendy'sClassic Single 470 21 80 940Big Bacon Classic 640 35 125 1620Crispy Chicken Sandwich 460 25 60 1120
Appendix #13, cont.
Popular Selections at Fast Food Restaurants
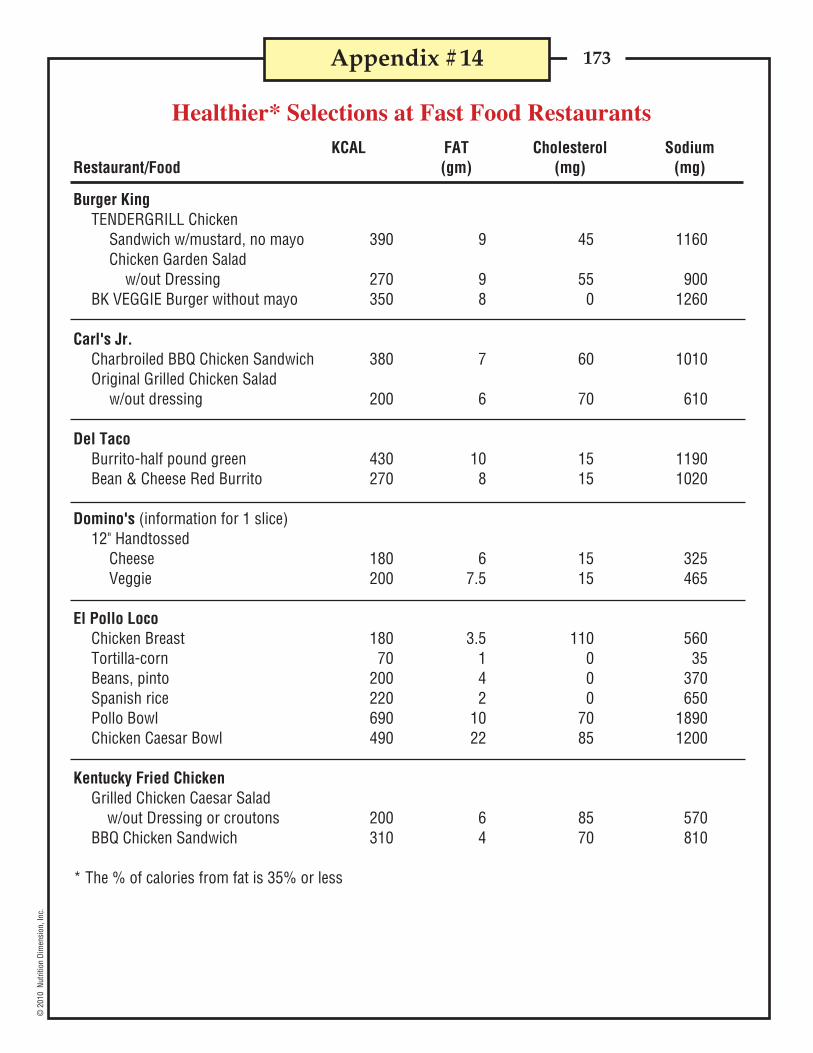
173©
201
0 N
utrit
ion
Dim
ensi
on, I
nc.
KCAL FAT Cholesterol SodiumRestaurant/Food (gm) (mg) (mg)
Burger KingTENDERGRILL Chicken
Sandwich w/mustard, no mayo 390 9 45 1160Chicken Garden Salad
w/out Dressing 270 9 55 900BK VEGGIE Burger without mayo 350 8 0 1260
Carl's Jr.Charbroiled BBQ Chicken Sandwich 380 7 60 1010Original Grilled Chicken Salad
w/out dressing 200 6 70 610
Del TacoBurrito-half pound green 430 10 15 1190Bean & Cheese Red Burrito 270 8 15 1020
Domino's (information for 1 slice)12" Handtossed
Cheese 180 6 15 325Veggie 200 7.5 15 465
El Pollo LocoChicken Breast 180 3.5 110 560Tortilla-corn 70 1 0 35Beans, pinto 200 4 0 370Spanish rice 220 2 0 650Pollo Bowl 690 10 70 1890Chicken Caesar Bowl 490 22 85 1200
Kentucky Fried ChickenGrilled Chicken Caesar Salad
w/out Dressing or croutons 200 6 85 570BBQ Chicken Sandwich 310 4 70 810
* The % of calories from fat is 35% or less
Appendix #14
Healthier* Selections at Fast Food Restaurants

174©
201
0 N
utrit
ion
Dim
ensi
on, I
nc.
KCAL FAT Cholesterol SodiumRestaurant/Food (gm) (mg) (mg)
McDonald'sGrilled Chicken Caesar Salad 220 6 75 890
w/out dressingPremium Grilled Chicken Classic Sandwich 420 10 70 1190Grilled Chicken Southwest Salad
w/out Dressing 320 9 70 860
Pizza Hut (information for 1 slice of 8 equal slices of 12" pizza)Hand-tossed style
Cheese only 220 8 25 560Ham and Pineapple 200 7 20 560Veggie Lover's 200 7 15 540
Subway6" Veggie Delite 230 2.5 0 4106" Turkey 280 3.5 20 9106" Ham 290 4.5 20 12006" Subway Club 320 5 35 11606" Roast Beef 310 4.5 25 840
Taco Bell"Fresco Style"
Chicken Soft Taco 170 4 25 740Bean Burrito 340 8 0 1290Fiesta Burrito - Chicken 340 8 25 1410
Zesty Chicken Bowlw/out Dressing 490 16 309 1570
Wendy'sMandarin Chicken Salad
w/out Dressing Almonds, Noodles 170 2 60 480Caesar Chicken Salad
w/out Dressing 240 7 75 810Chili - small 190 6 40 830Ultimate Chicken Grill Sandwich 350 7 70 1000
* The % of calories from fat is 35% or less
Appendix #14, cont.
Healthier* Selections at Fast Food Restaurants

175©
201
0 Nu
tritio
n Di
men
sion
/Gan
nett
Educ
atio
n, In
c.
Answer each question by checking the correct answer online or filling the circle corresponding to the cor-rect answer on the answer sheet. There is one best answer for each question. If you want a record of your answers, photocopy the answer sheet or record your choices on another piece of paper. Do not detach the examination from the book. This exam has 40 questions.
1. When do we first notice a difference in growth rates between males and females? a. preschool b. elementary school c. infancy d. high school
2. Changes in eating habits and nutrition needs are associated with phases of growth? a. true b. false
3. Children’s and teenagers’ growth patterns . . . a. should always match the height and weight charts b. are reflective of improvements in maternal health in the 20th century c. can vary from the height and weight charts d. are useful only as a screening tool for severe problems e. none of the above
4. Which of the following is NOT measured by growth charts. a. body mass index b. height/age c. weight/age d. head circumference/height e. all are measured by growth charts
5. The most important initial screening tool to assess the nutritional status in children and teens is: a. 24-hour dietary recall b. height and weight charts c. roentgenographic studies d. mid-arm circumference e. biochemical tests
6. Which of the following parameters is first affected by calorie deprivation? a. weight b. height c. head circumference d. hemoglobin e. skeletal density
CAN10Examination

176©
201
0 Nu
tritio
n Di
men
sion
/Gan
nett
Educ
atio
n, In
c.
7. What measurements need to be done to determine a child’s Body Mass Index? a. height and weight b. skin fold thinness c. age and weight d. age and height e. mid-arm circumference
8. A child is considered to be overweight when his Body Mass Index falls between what percentiles? a. 50-75 b. 85-95 c. 75-85 d. 60-75 e. over 95
9. A preschooler needs significantly more calories and protein per kilogram of body weight than an 11- to 14-year-old. a. true b. false
10. At what age does a person reach their peak bone mass? a. 10 years b. 12 years c. 15 years d. 17 years e. 20 years
11. The most prevalent nutrition deficiency disease among children in the United State is: a. osteoporosis b. iron deficiency anemia c. scurvy d. rickets e. delayed growth and development
12. Those at risk for vitamin B12 dietary deficiency anemia are: a. lacto-ovo vegetarians b. African-Americans c. small children d. children with lactose intolerance e. vegans
13. The recommendations for MyPyramid include all but one of the following: a. the need for variety b. half the grains should be whole c. fruits and vegetables should be consumed in equal amounts d. beans and nuts can be substituted for meats e. physical activity is a component
CAN10Exam, cont.

177©
201
0 Nu
tritio
n Di
men
sion
/Gan
nett
Educ
atio
n, In
c.
14. How many cups of milk are recommended for a child over age 8 according to MyPyramid? a. two b. four c. one d. five e. three
15. A good way to correct an adolescent’s poor dietary choices is . . . a. begin appetite stimulant drug therapy b. use food as a reward c. have him/her take a vitamin/mineral supplement. d. none of the above
16. The best way to handle food jags is: a. insist that the child eat b. don’t make an issue c. use dessert as a reward d. enforce strict discipline e. offer only food child will eat 17. The meal young children most often skip is dinner because: a. they rather play than eat b. they are often fatigued by dinner and want to rest c. they don’t want to share Mom’s time with other family members d. they don’t like the unfamiliar foods often served at dinner e. they like to get attention by causing trouble at the table
18. In feeding young children, parents are responsible for: a. how much food the child should eat b. what food is served and when it is served c. whether on not the child will eat d. none of the above e. all of the above
19. What approach is the most effective way to encourage teenagers to make healthy choices? a. emphasize the relationship of diet to chronic diseases b. discuss positive benefits like athletic performance, looking good, and having more energy. c. provide a list of what foods they should avoid d. have them count calories e. all of the above
20. Drugs and diet modification should be prescribed for all children with high cholesterol levels. a. true b. false
CAN10Exam, cont.
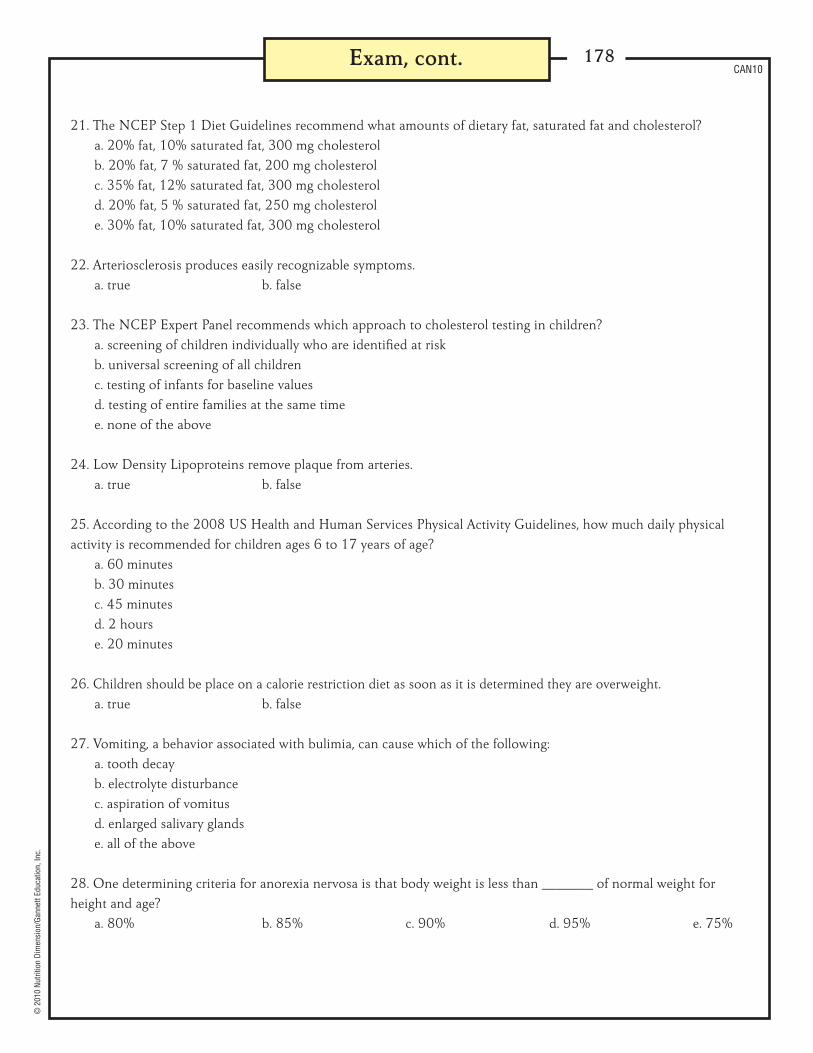
178©
201
0 Nu
tritio
n Di
men
sion
/Gan
nett
Educ
atio
n, In
c.
21. The NCEP Step 1 Diet Guidelines recommend what amounts of dietary fat, saturated fat and cholesterol? a. 20% fat, 10% saturated fat, 300 mg cholesterol b. 20% fat, 7 % saturated fat, 200 mg cholesterol c. 35% fat, 12% saturated fat, 300 mg cholesterol d. 20% fat, 5 % saturated fat, 250 mg cholesterol e. 30% fat, 10% saturated fat, 300 mg cholesterol
22. Arteriosclerosis produces easily recognizable symptoms. a. true b. false
23. The NCEP Expert Panel recommends which approach to cholesterol testing in children? a. screening of children individually who are identified at risk b. universal screening of all children c. testing of infants for baseline values d. testing of entire families at the same time e. none of the above
24. Low Density Lipoproteins remove plaque from arteries. a. true b. false
25. According to the 2008 US Health and Human Services Physical Activity Guidelines, how much daily physical activity is recommended for children ages 6 to 17 years of age? a. 60 minutes b. 30 minutes c. 45 minutes d. 2 hours e. 20 minutes
26. Children should be place on a calorie restriction diet as soon as it is determined they are overweight. a. true b. false
27. Vomiting, a behavior associated with bulimia, can cause which of the following: a. tooth decay b. electrolyte disturbance c. aspiration of vomitus d. enlarged salivary glands e. all of the above
28. One determining criteria for anorexia nervosa is that body weight is less than _______ of normal weight for height and age? a. 80% b. 85% c. 90% d. 95% e. 75%
CAN10Exam, cont.

179©
201
0 Nu
tritio
n Di
men
sion
/Gan
nett
Educ
atio
n, In
c.
29. Since the 1980s, the obesity rate of children had been fairly stable. a. true b. false
30. The most common symptom of food hypersensitivity in children is: a. hives (uticaria) b. hyperactivity c. asthma d. diarrhea e. cold sores
31. Cytotoxic testing for food allergies is . . . a. consistent and reliable b. approved by the American Academy of Allergists c. not scientifically valid because of inconsistancies d. a revolutionary breakthrough which promises to end childhood food allergies e. the quickest and surest way to reveal hidden allergies
32. Lactose intolerance is a food allergy response, which involves the immune system. a. true b. false
33. The diagnosis of Attention Deficit Disorder always includes hyperactivity. a. true b. false
34. Scientific research has confirmed that sugar, food coloring and chocolate have an impact on Attention Deficit Hyperactivity Disorder in children? a. true b. false
35. A comprehensive school nutrition program would NOT include: a. candy sales to raise funds for school activities b. sequential classroom nutrition education c. child nutrition programs serving nutritious meals and snacks d. parents supporting a healthy school environment.
36. Which statement best describes children’s consumption of soft drinks a. the number of children consuming soft drinks has increased b. children are drinking larger amounts of soft drinks c. each serving of soft drink increases a child’s risk of becoming overweight. d. drinking soft drinks replaces milk as a beverage e. all of the above.
CAN10Exam, cont.

180©
201
0 Nu
tritio
n Di
men
sion
/Gan
nett
Educ
atio
n, In
c.
37. United States Department of Agriculture regulations state that the school lunch program: a. do not have to provide free meals to needy students b. provide meals that contain at least 1/2 of the recommended levels of calories, vitamins and minerals for children. c. provide meals that contain at least 1/3 of the recommend level of calories, vitamins and minerals for children. d. there is no limit on fat content for school meals e. allow candy to count as a component of the school lunch
38. Teenage athletes should take a protein supplement because most cannot meet their protein needs through diet alone. a. true b. false
39. Which of the following statements are true about sugar’s effect on dental caries? a. countries where people consume fewer than 33 pounds of sugar per year have very few caries. b. frequency of consumption is as important than the amount consumed. c. if sugar residue is removed from the mouth promptly by brushing caries risk is reduced. d. all of the above e. none of the above
40. Since enamel formation is largely completed by age 8, nutrition has little effect on teeth after that age. a. true b. false
CAN10Exam, cont.