Embed Size (px)
DESCRIPTION
On the unity of black hole and neutron star kHz QPOs. Gabriel Török, Pavel Bakala, Zdeněk Stuchlík, Eva Šrámková, Jiří Horák *. - PowerPoint PPT Presentation
Citation preview
Gabriel Török, Pavel Bakala, Zdeněk Stuchlík,Eva Šrámková, Jiří Horák*
Institute of Physics, Faculty of Philosophy and Science, Silesian University in Opava, Bezručovo nám. 13, CZ-74601 Opava, Czech Republic
* Astronomical Institute, Academy of Sciences, Boční II 1401, CZ-14131, Praha 4, Czech Republic
Supported byMSM 4781305903 and LC~06014
Black Holes in Kraków,17th May 2007
On the unity of black hole and neutron star kHz QPOs
Supported byMSM 4781305903 and LC~06014
Black Holes in Kraków,17th May 2007
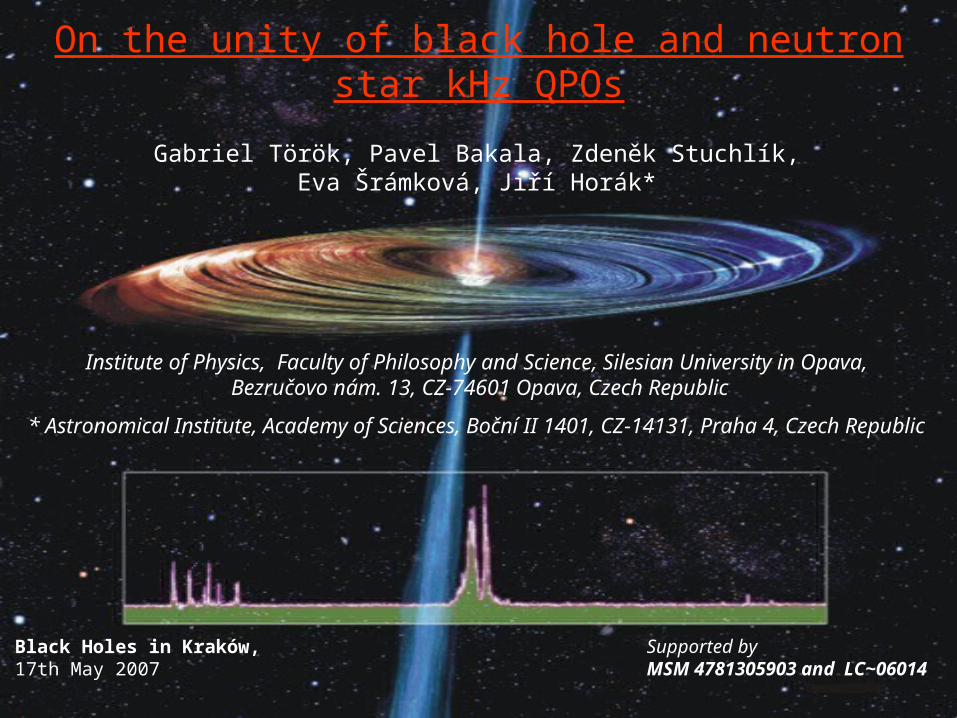
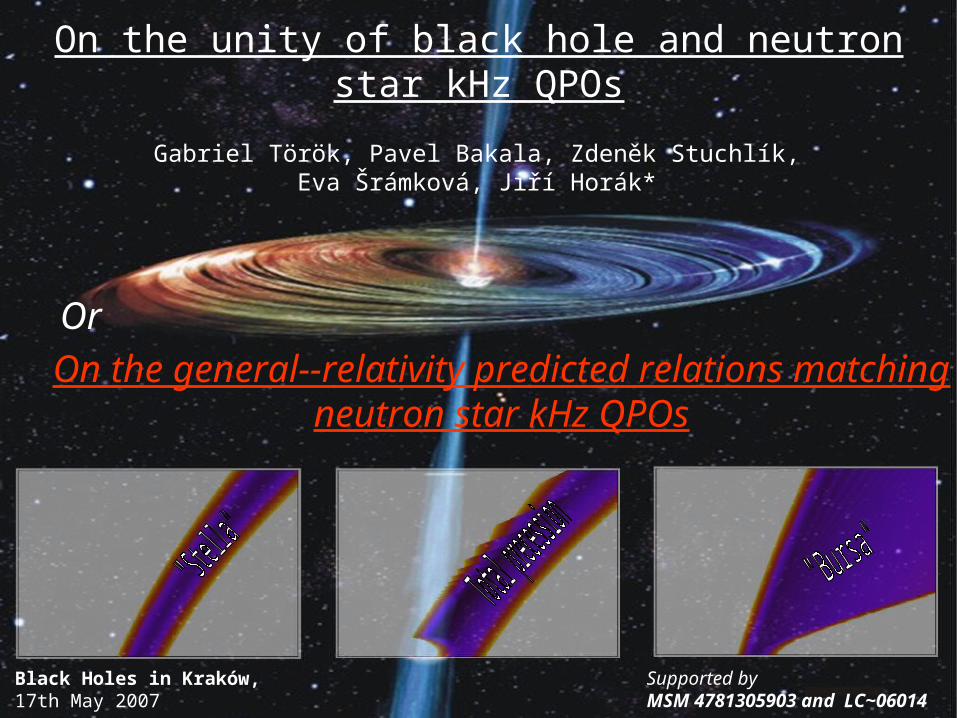
On the unity of black hole and neutron star kHz QPOs
On the general--relativity predicted relations matching neutron star kHz QPOs
Gabriel Török, Pavel Bakala, Zdeněk Stuchlík,Eva Šrámková, Jiří Horák*
Or
1. Introduction: Quasi-periodic oscillations (QPOs) in X-ray from the NS an BH systems - Black-hole and neutron star binaries, accretion disks and QPOs, BH and NS QPOs
2. Neutron star QPOs and some orbital models 2.1. Geodesic motion models (“blobs”) 2.2. Resonance models - 2.2.1. One eigenfrequency pair hypothesis - 2.2.2. More eigenfrequency pairs hypothesis
3. Testing frequency relations3.0. Epicyclic resonances3.1. Stella, Bursa, total precession and disc-oscillation relation3.2. Fitting the data in the Hartle-Thorne metric
4. Numbers: six atolls, Circinus X-1
5. Summary, blobs and disc-oscillations
6. Bonus (just to go back to the original title)
7. References
OutlinePresentation download: www.physics.cz/research in sect. news
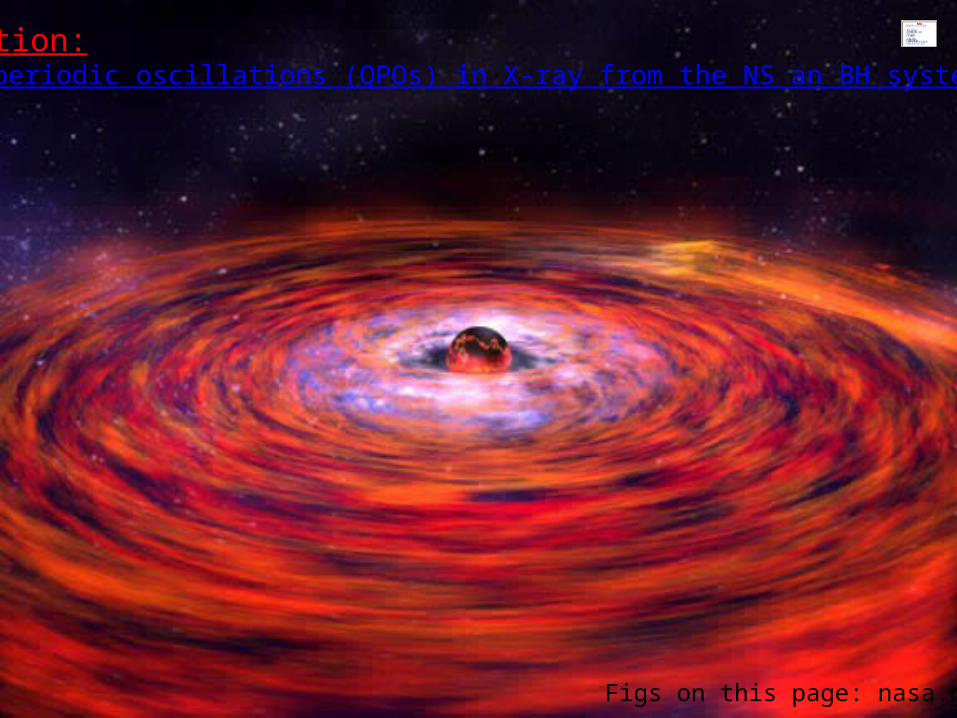
1. Introduction: Quasi-periodic oscillations (QPOs) in X-ray from the NS an BH systems
Figs on this page: nasa.gov
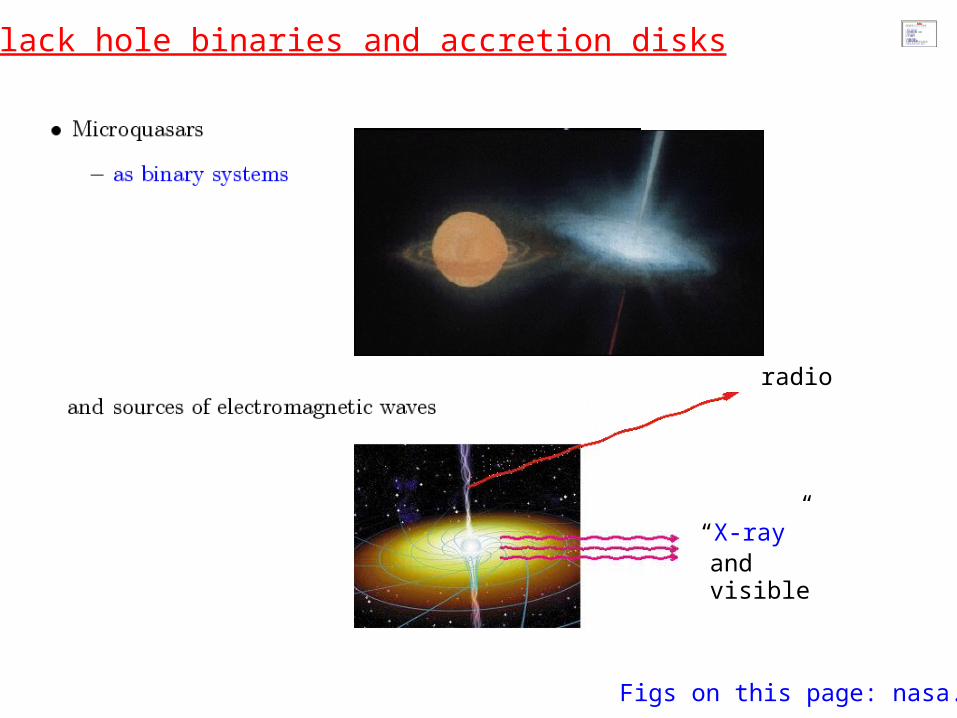
radio
“X-ray”and visible
1.1. Black hole binaries and accretion disks
Figs on this page: nasa.gov
t
I
Pow
erFrequency
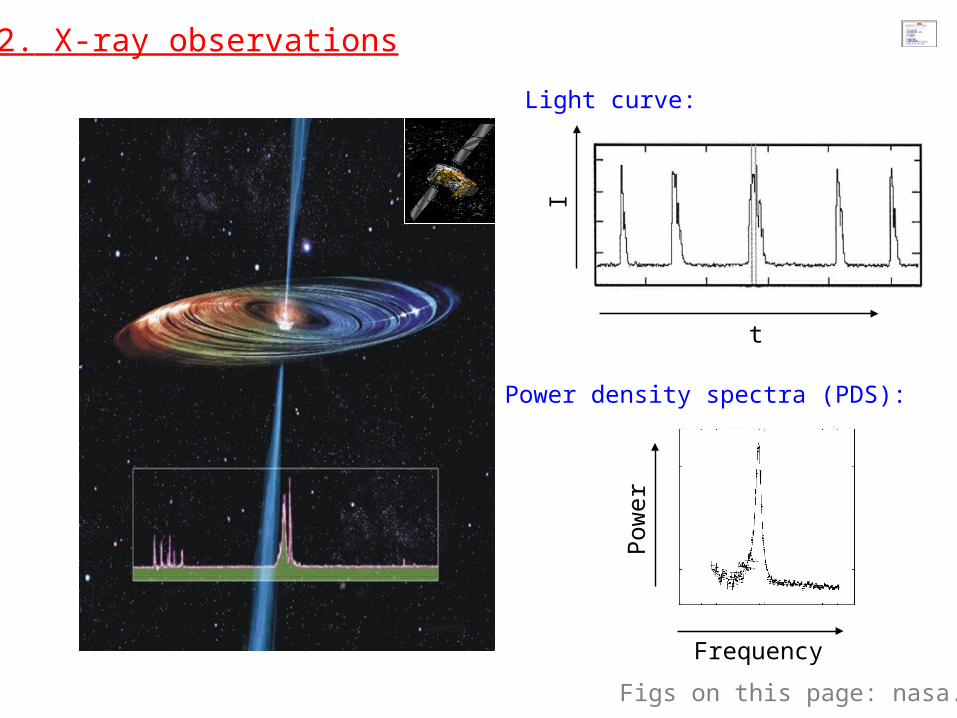
1.2. X-ray observations
Light curve:
Power density spectra (PDS):
Figs on this page: nasa.gov
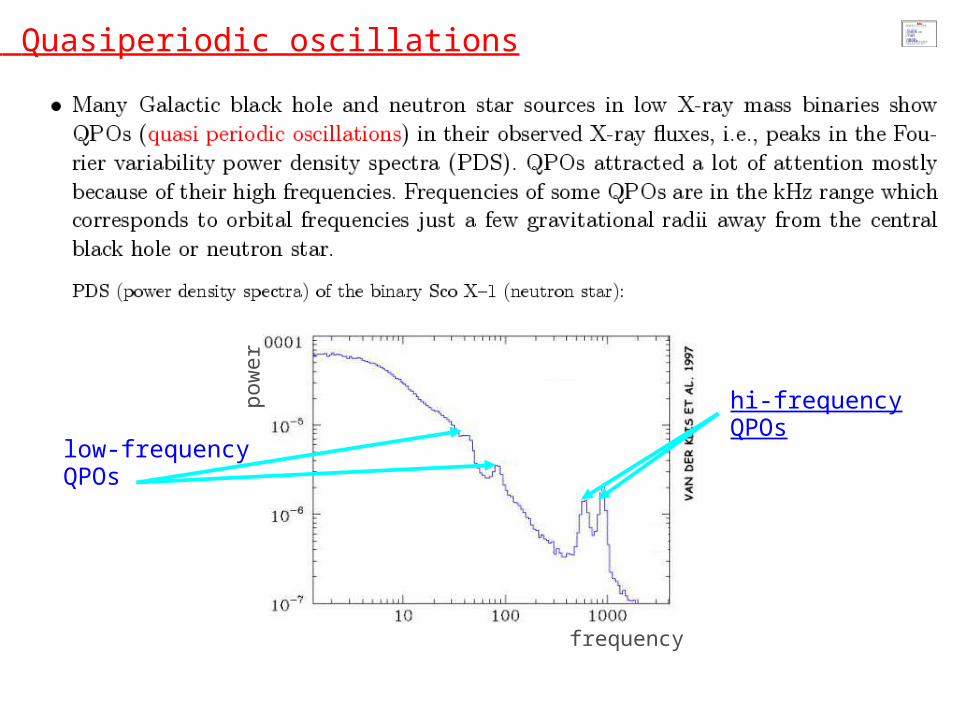
hi-frequencyQPOs
low-frequencyQPOs
frequency
pow
er
1.3. Quasiperiodic oscillations
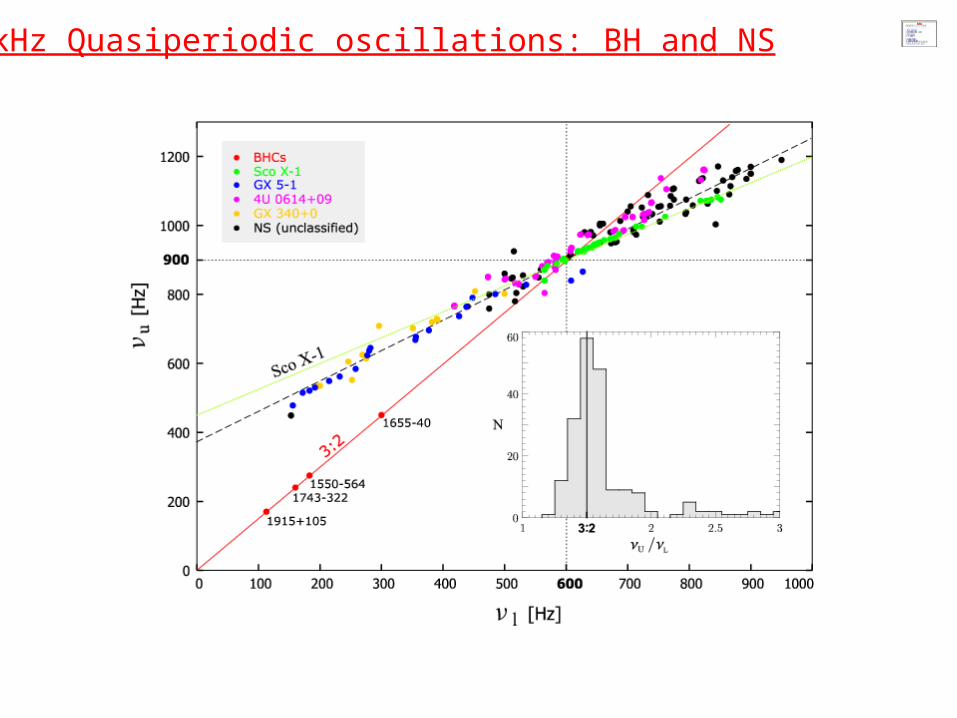
1.3. kHz Quasiperiodic oscillations: BH and NS
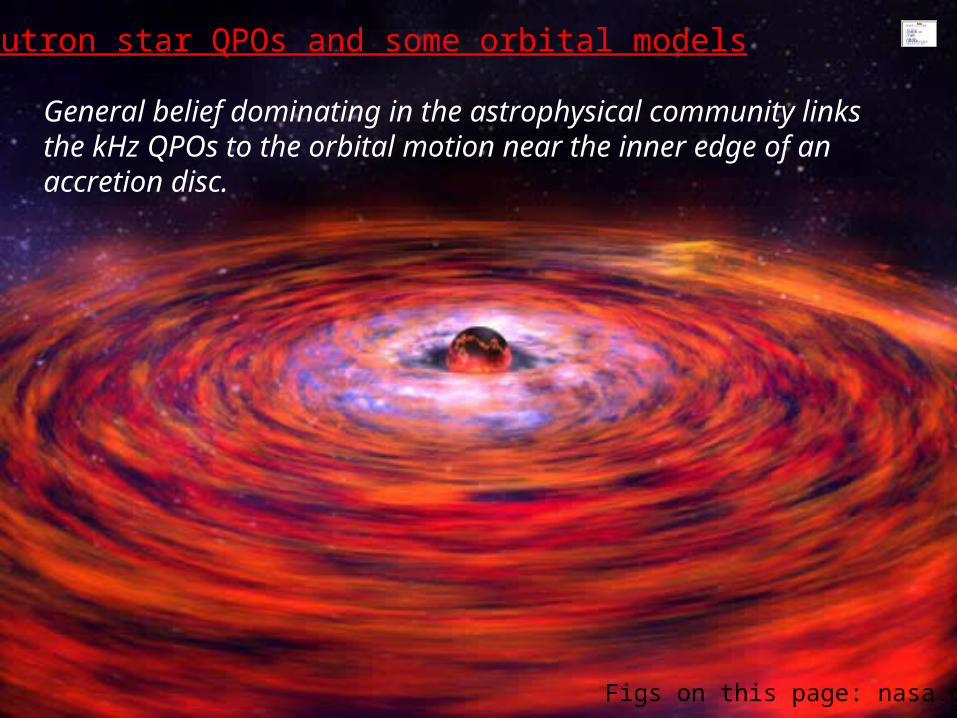
2. Neutron star QPOs and some orbital models
Figs on this page: nasa.gov
General belief dominating in the astrophysical community links the kHz QPOs to the orbital motion near the inner edge of an accretion disc.
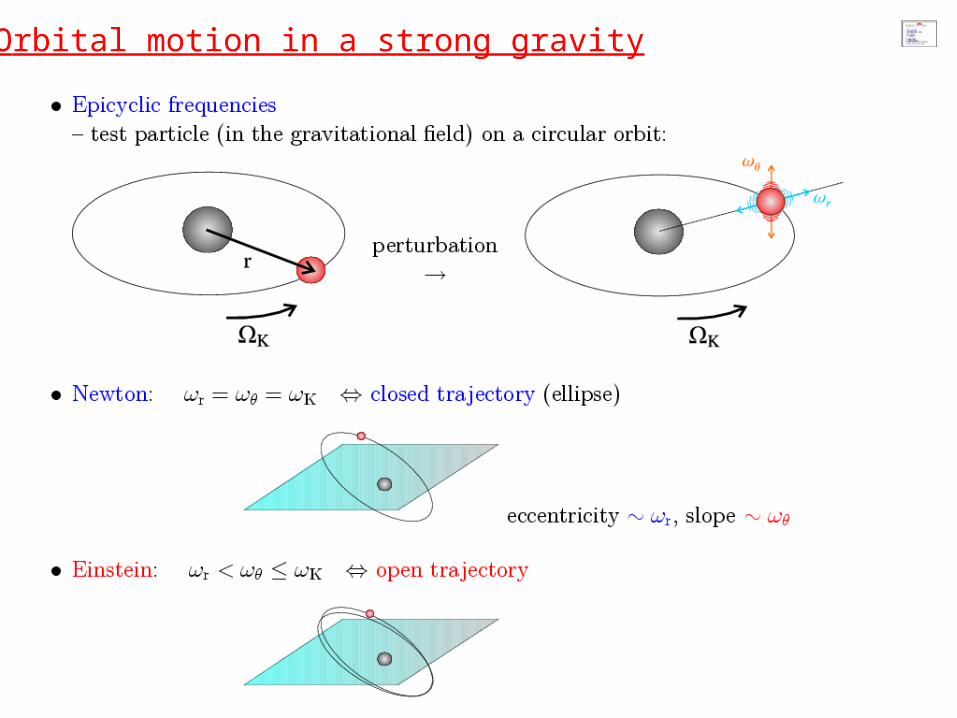
2.1. Orbital motion in a strong gravity
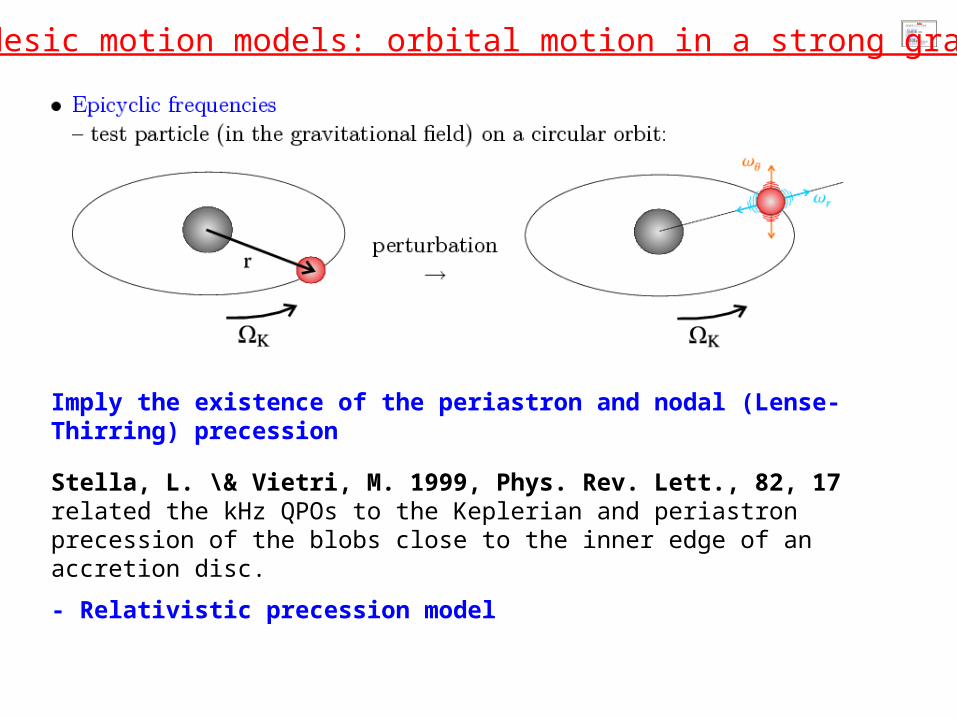
2.1. Geodesic motion models: orbital motion in a strong gravity
Imply the existence of the periastron and nodal (Lense-Thirring) precession
Stella, L. \& Vietri, M. 1999, Phys. Rev. Lett., 82, 17related the kHz QPOs to the Keplerian and periastron precession of the blobs close to the inner edge of an accretion disc.
- Relativistic precession model
Relativistic precession model(Stella, L. \& Vietri, M. 1999, Phys. Rev. Lett., 82, 17)related the kHz QPOs to the frequencies of geodesic motion(Keplerian and periastron precession of the blobs close to the inner edge of an accretion disc).
Resonance modelKluzniak, W., Abramowicz, M. A., 2000, Phys. Rev. Lett. (submitted); Klu\'zniak, W., \& Abramowicz, M. A., 2001, Acta Physica Polonica B 32, 3605 [http://th-www.if.uj.edu.pl/acta/vol32/t11.htm]
related the kHz QPOs to disc oscillation modes corresponding to the frequencies of geodesic motion.
2.2 Orbital resonance models
Phenomenologically, there are two possibilities in the resonance models for NS QPOs:
- one eigenfrequency pair hypothesis
- more eigenfrequency pairs hypothesis
2.2 Orbital resonance models
2.2.1. One eigenfrequency pair hypothesis
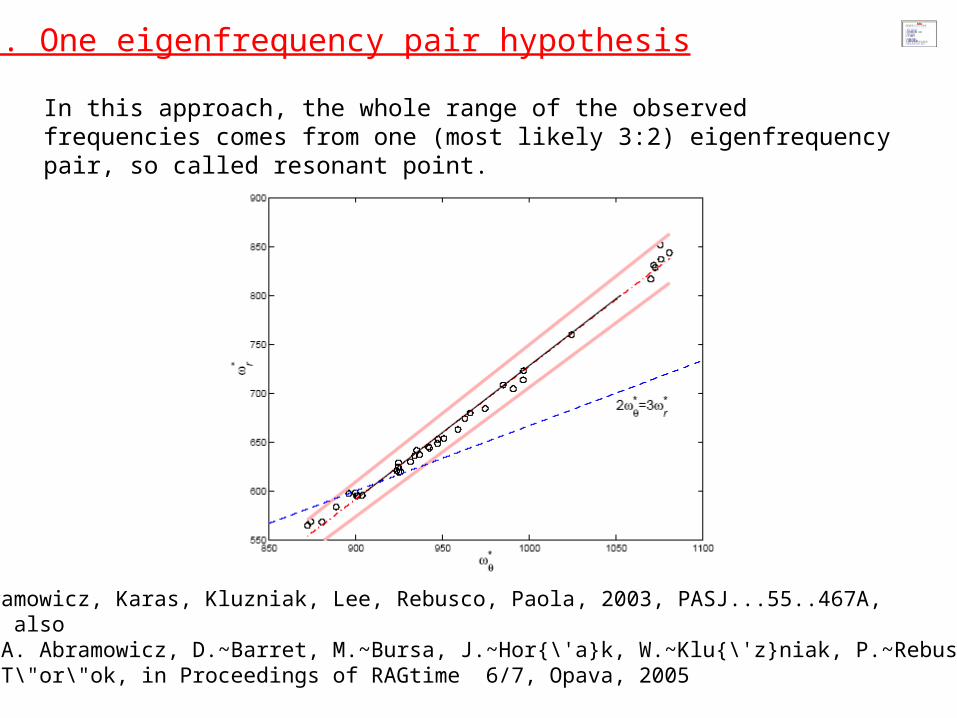
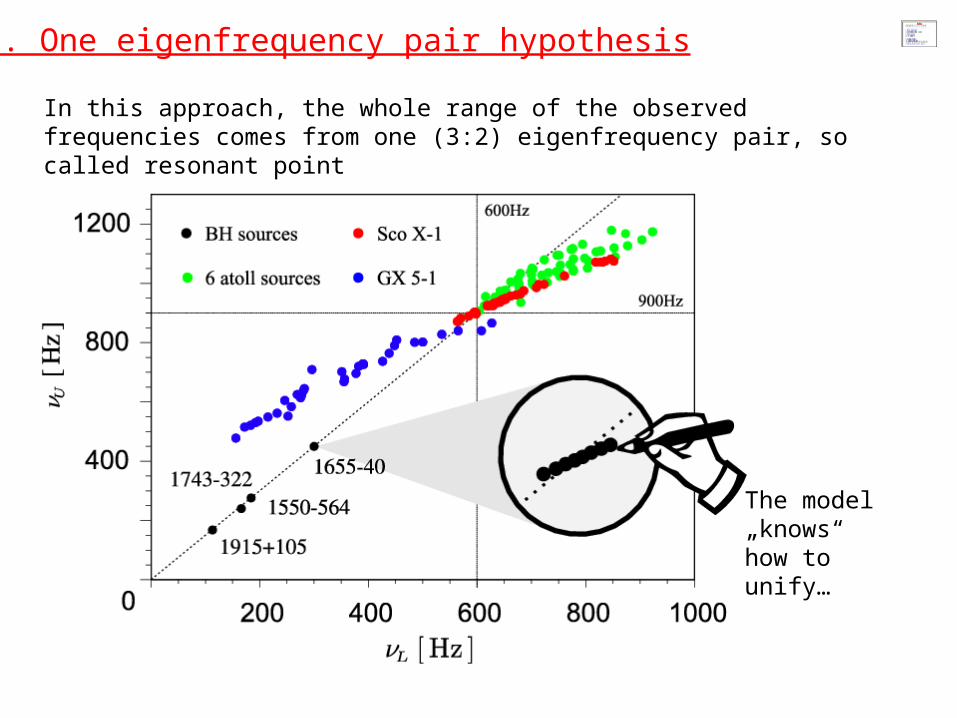
In this approach, the whole range of the observed frequencies comes from one (most likely 3:2) eigenfrequency pair, so called resonant point.
Abramowicz, Karas, Kluzniak, Lee, Rebusco, Paola, 2003, PASJ...55..467A,see alsoM.~A. Abramowicz, D.~Barret, M.~Bursa, J.~Hor{\'a}k, W.~Klu{\'z}niak, P.~Rebusco,G.~T\"or\"ok, in Proceedings of RAGtime 6/7, Opava, 2005
2.2.1. One eigenfrequency pair hypothesis
The model „knows“ how to unify…
In this approach, the whole range of the observed frequencies comes from one (3:2) eigenfrequency pair, so called resonant point
2.2.1. One eigenfrequency pair hypothesis
There are several good arguments supporting the approach (see, e.g., Török, Abramowicz, Kluzniak, Stuchlík 2006, proc. of Albert Einstein Conf. Paris 2005, astro-ph/0603847). Especially the existence of slope-shift anticorrelation.
On the other hand, this approach has some difficulties,especially extremely large extension from eigenfrequencies.
Therefore, it may be plausible to look for some other but close alternatives…
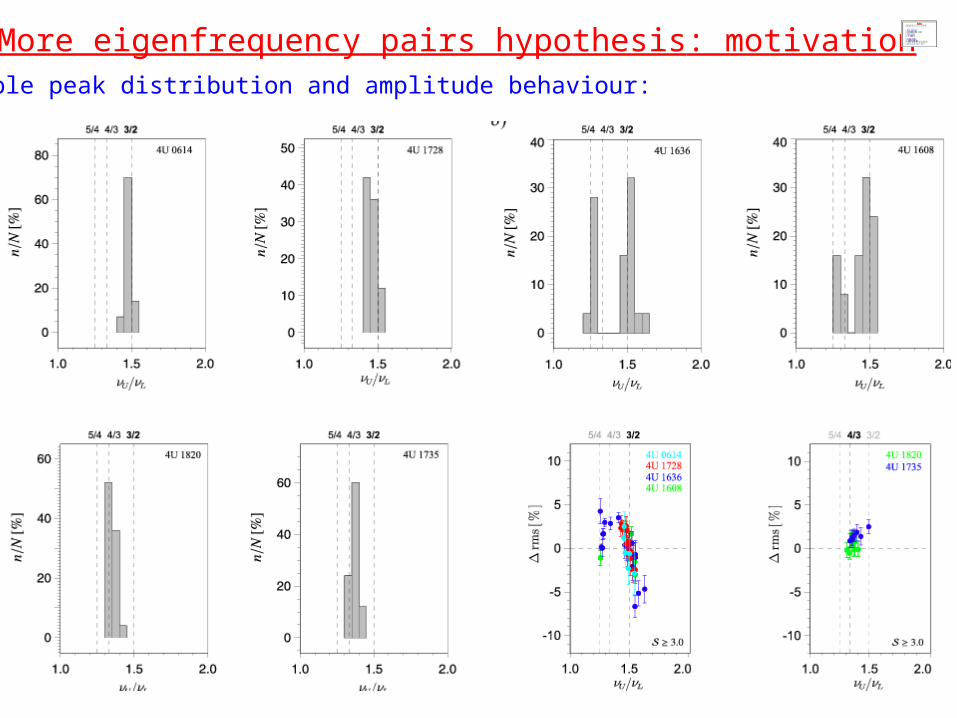
2.2.2. More eigenfrequency pairs hypothesis: motivationdouble peak distribution and amplitude behaviour:
2.2.2. More eigenfrequency pairs hypothesis: motivation
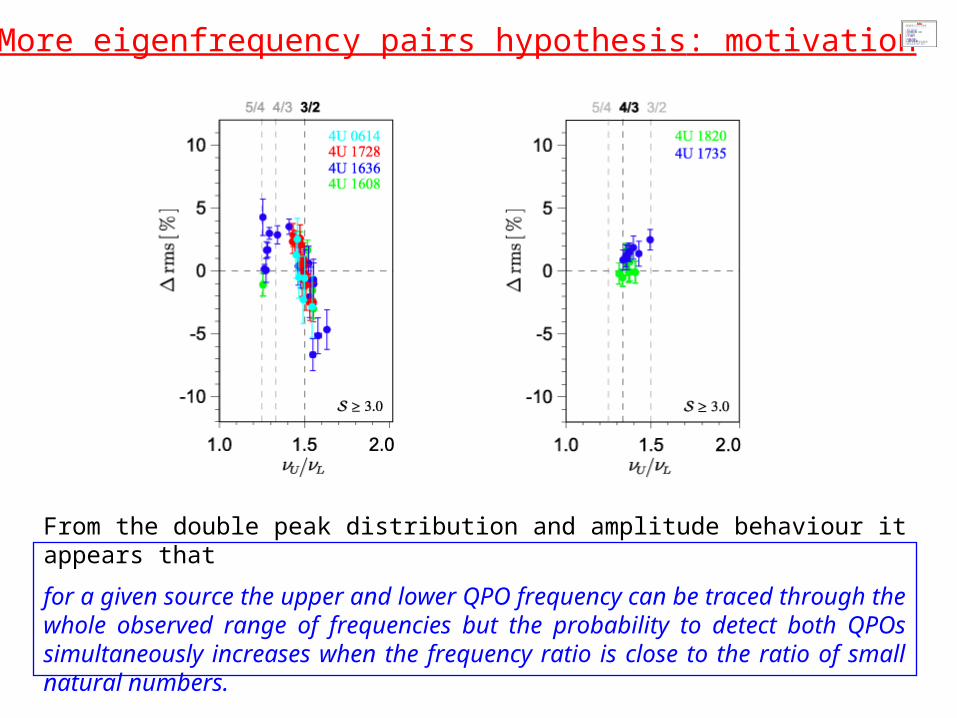
From the double peak distribution and amplitude behaviour it appears that
for a given source the upper and lower QPO frequency can be traced through the whole observed range of frequencies but the probability to detect both QPOs simultaneously increases when the frequency ratio is close to the ratio of small natural numbers.
2.2.2. More eigenfrequency pairs hypothesis
From the double peak distribution and amplitude behaviour it appears that
for a given source the upper and lower QPO frequency can be traced through the whole observed range of frequencies but the probability to detect both QPOs simultaneously increases when the frequency ratio is close to the ratio of small natural numbers.
Therefore, the whole effect may be connected to the resonance between two modes with „floating“ eigenfrequencies, i.e., in this approach, the range of the frequencies observed in the source comes from several individual eigen-frequency pairs correponding to the different frequeny ratios andthe observed frequencies do not much differ from the resonant eigenfrequencies.
We have investigated a bit the question
Which modes can be in the game ?
3. Testing frequency relations
Figs on this page: nasa.gov
3.0 Testing frequency relations:Epicyclic oscillations
There is no chance to fit the observed QPO relationships by direct identifiation with epicyclic frequencies.
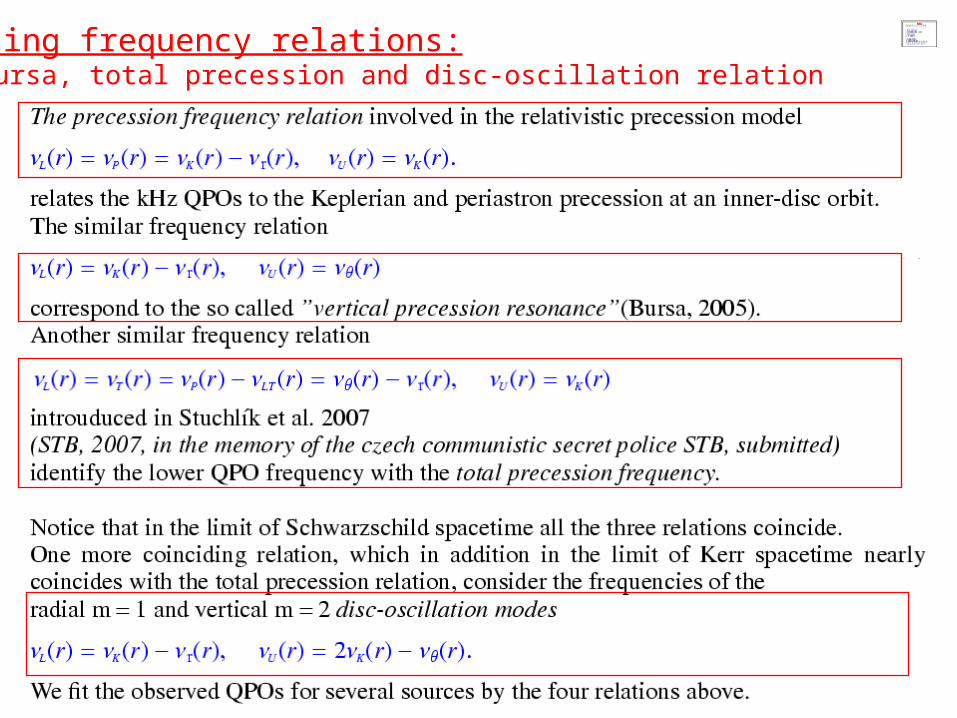
3.1 Testing frequency relations:Stella, Bursa, total precession and disc-oscillation relation
3.2 Fitting the data in the Hartle-Thorn
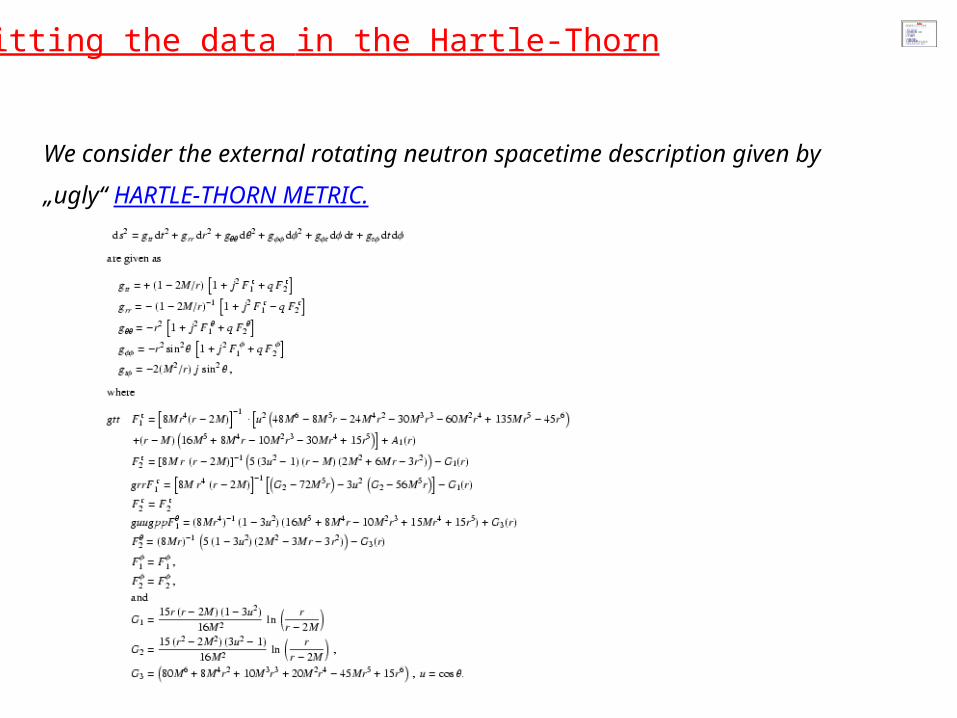
We consider the external rotating neutron spacetime description given by
„ugly“ HARTLE-THORN METRIC.
3.2 Fitting the data in the Hartle-Thorn
We consider the external rotating neutron spacetime description given by
„ugly“ HARTLE-THORN METRIC.
We use slightly modified relations for geodesic frequencies derived byAbramowicz, M.A., Almergren, G.J.E., Kluzniak, W., Thampan, A.V., 2003astro-ph/0312070.
4. Numbers
Figs on this page: nasa.gov
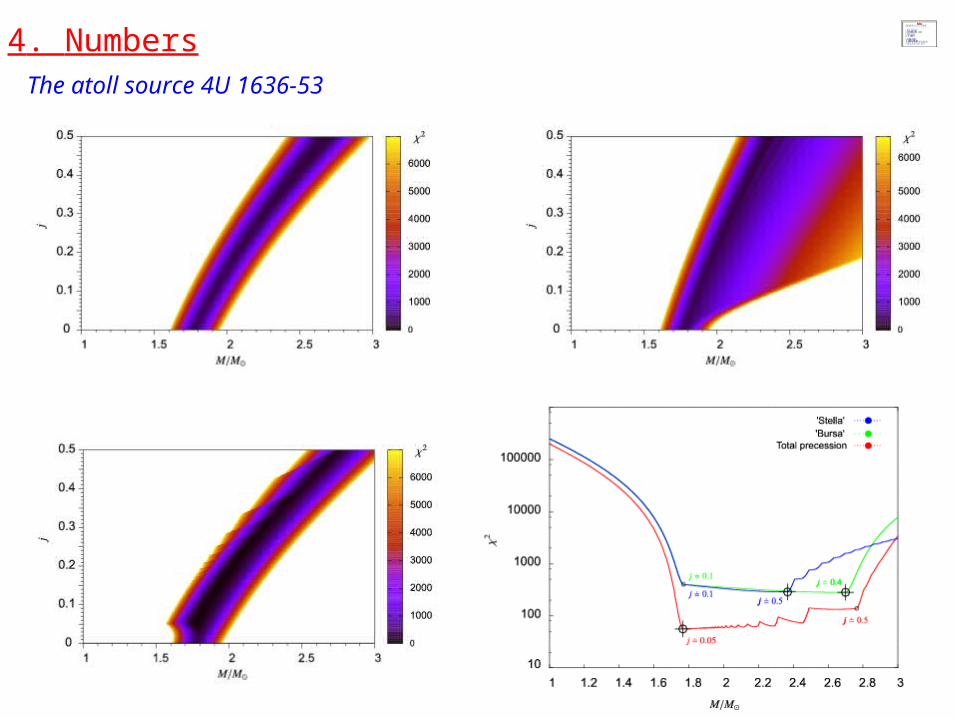
4. Numbers
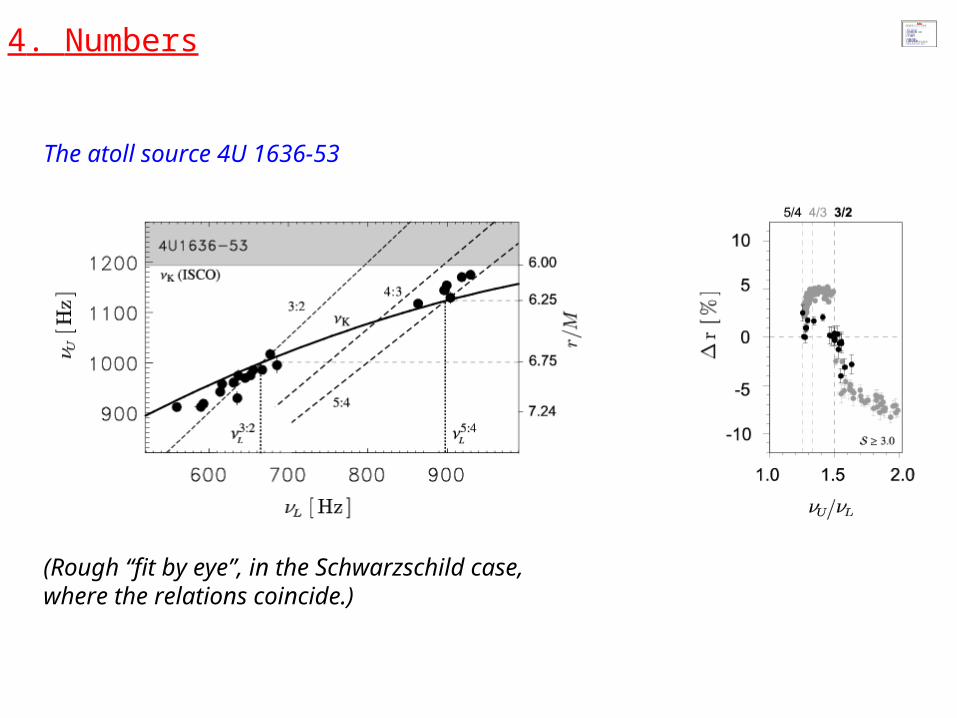
The atoll source 4U 1636-53
(Rough “fit by eye”, in the Schwarzschild case,where the relations coincide.)
4. Numbers The atoll source 4U 1636-53
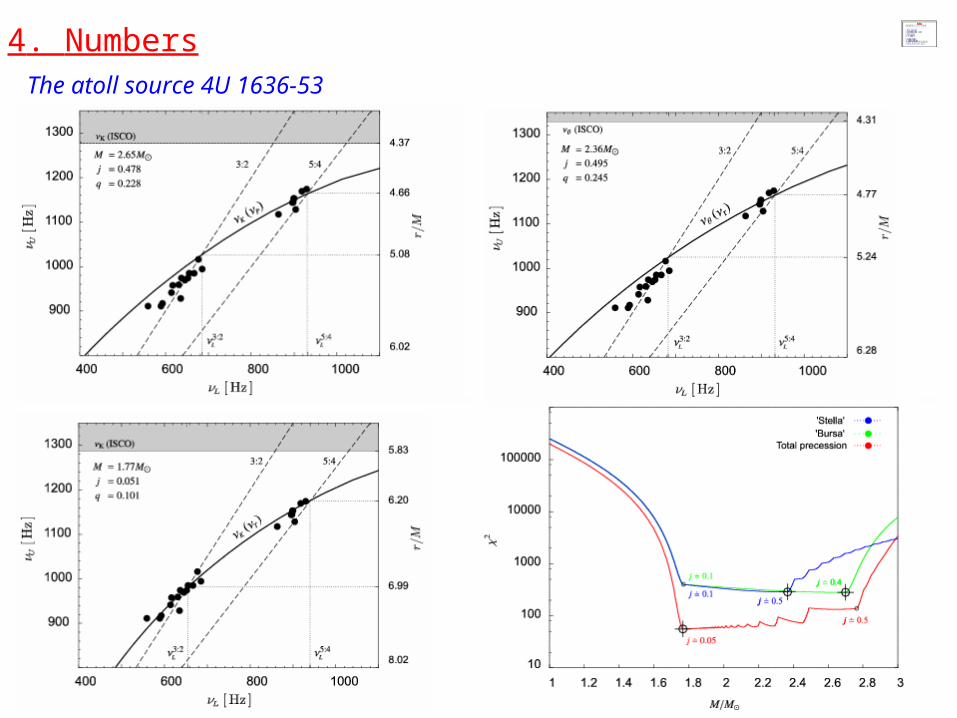
4. Numbers The atoll source 4U 1636-53
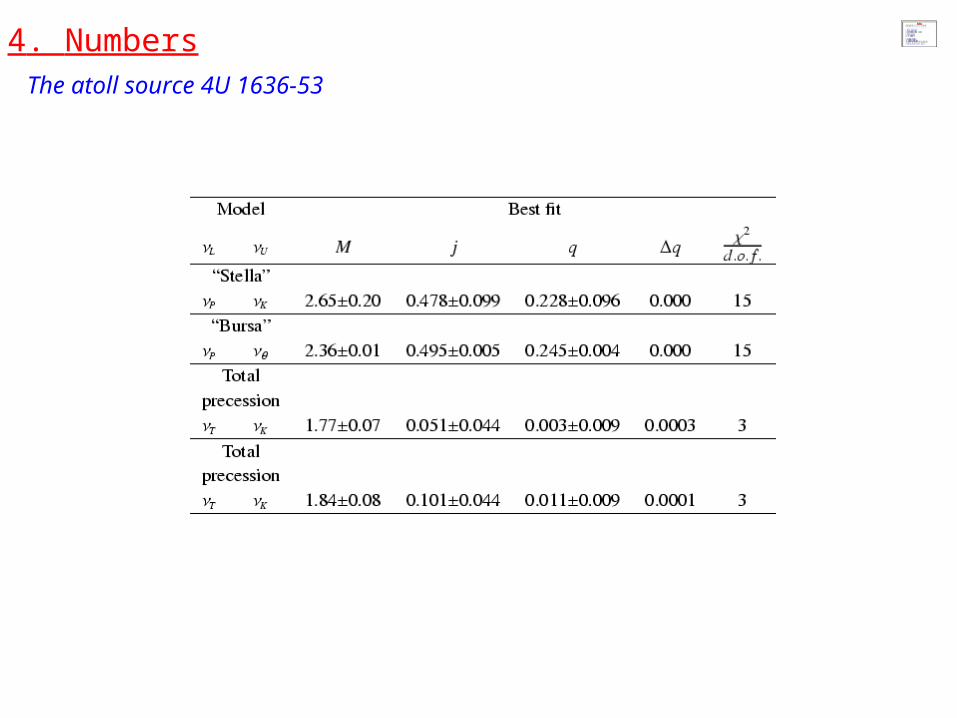
4. Numbers The atoll source 4U 1636-53
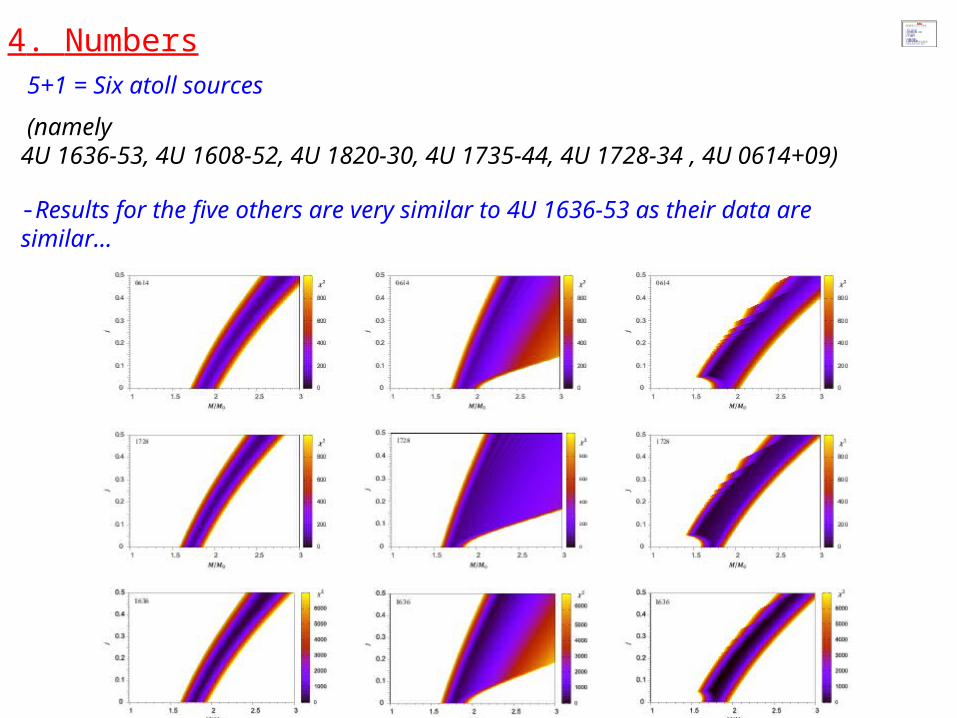
4. Numbers 5+1 = Six atoll sources
(namely4U 1636-53, 4U 1608-52, 4U 1820-30, 4U 1735-44, 4U 1728-34 , 4U 0614+09)
-Results for the five others are very similar to 4U 1636-53 as their data are similar…
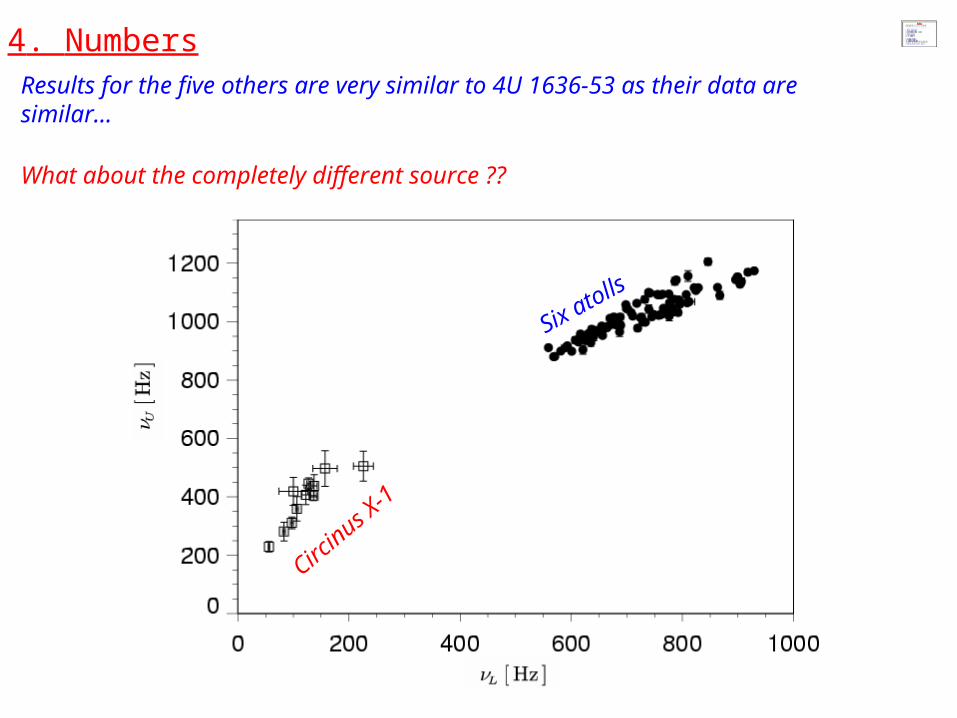
4. NumbersResults for the five others are very similar to 4U 1636-53 as their data are similar…
What about the completely different source ??
Six atolls
Circinus X
-1
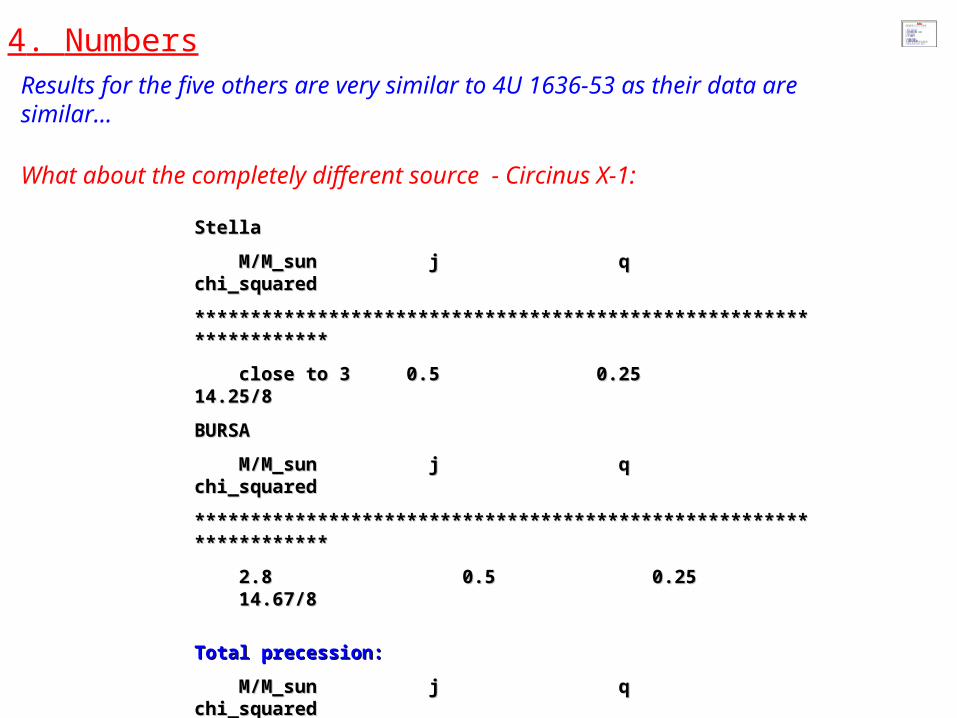
4. NumbersResults for the five others are very similar to 4U 1636-53 as their data are similar…
What about the completely different source - Circinus X-1:
StellaStella
M/M_sun j q chi_squared M/M_sun j q chi_squared
******************************************************************* *******************************************************************
close to 3 0.5 0.25 14.25/8close to 3 0.5 0.25 14.25/8
BURSABURSA
M/M_sun j q chi_squared M/M_sun j q chi_squared
**************************************************************************************************************************************
2.8 0.5 0.25 14.67/82.8 0.5 0.25 14.67/8
Total precession:Total precession:
M/M_sun j q chi_squaredM/M_sun j q chi_squared
**************************************************************************************************************************************
1.99 0.01 0.0001 12.38/81.99 0.01 0.0001 12.38/8
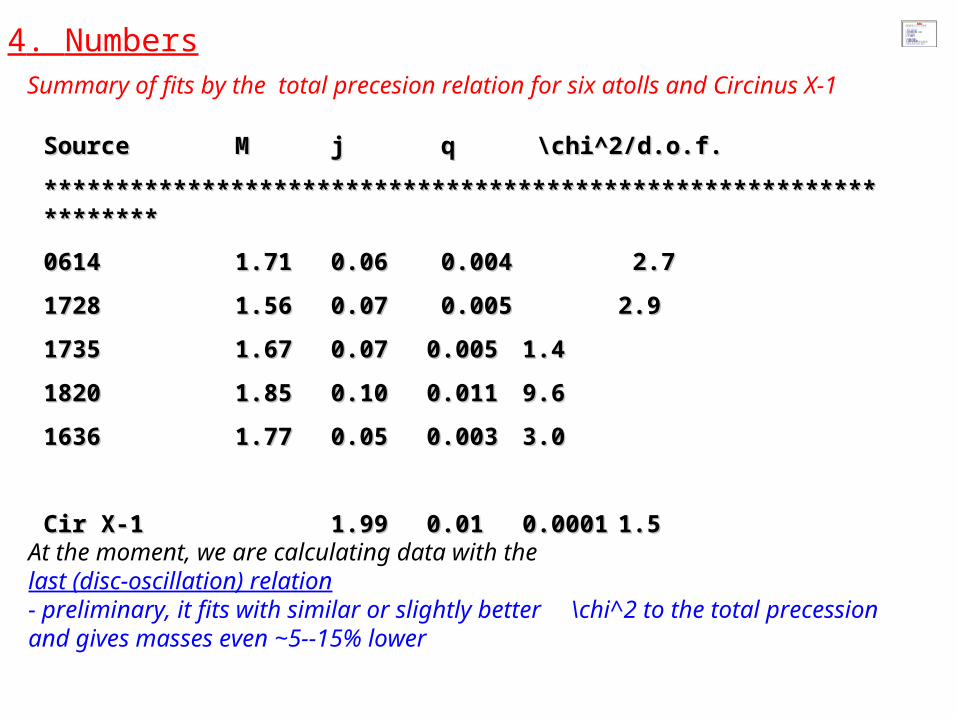
4. Numbers Summary of fits by the total precesion relation for six atolls and Circinus X-1
SourceSource M M jj q q \chi^2/d.o.f. \chi^2/d.o.f.
************************************************************************************************************************************
0614 0614 1.71 1.71 0.060.06 0.004 0.004 2.7 2.7
1728 1728 1.56 1.56 0.070.07 0.005 0.005 2.92.9
1735 1735 1.67 1.67 0.07 0.07 0.005 0.005 1.41.4
1820 1820 1.85 1.85 0.100.10 0.0110.011 9.69.6
1636 1636 1.77 1.77 0.05 0.05 0.003 0.003 3.03.0
Cir X-1Cir X-1 1.99 1.99 0.010.01 0.00010.0001 1.5 1.5
At the moment, we are calculating data with thelast (disc-oscillation) relation- preliminary, it fits with similar or slightly better \chi^2 to the total precession and gives masses even ~5--15% lower
5. Summary, blobs vs. disc-oscillations
Figs on this page: nasa.gov
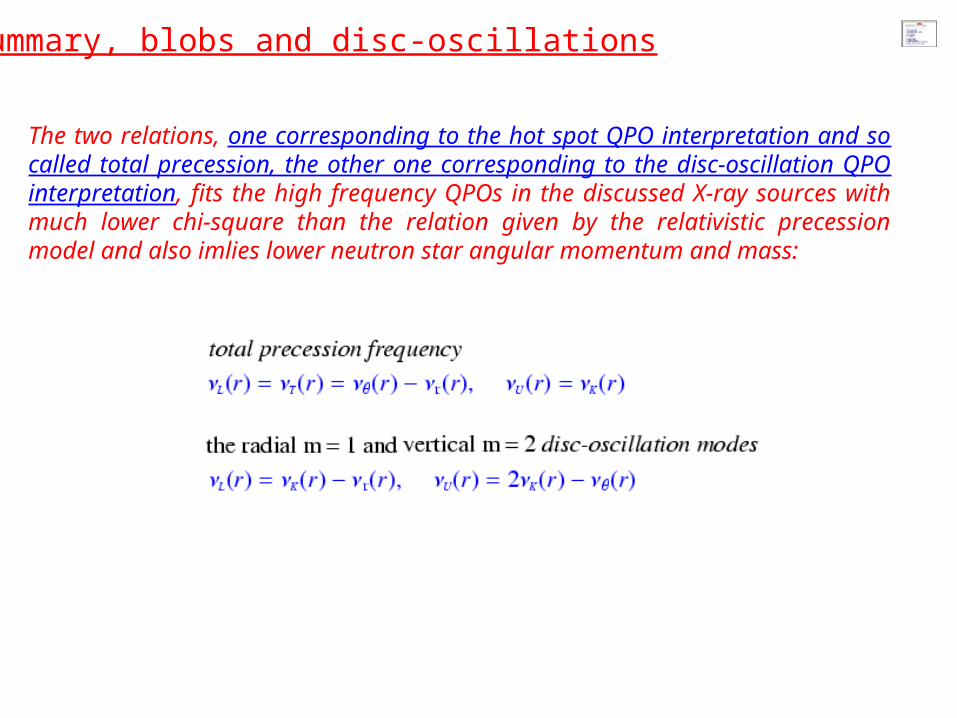
5. Summary, blobs and disc-oscillations
The two relations, one corresponding to the hot spot QPO interpretation and so called total precession, the other one corresponding to the disc-oscillation QPO interpretation, fits the high frequency QPOs in the discussed X-ray sources with much lower chi-square than the relation given by the relativistic precession model and also imlies lower neutron star angular momentum and mass:
6. Bonus (just to go back to the original title)
Figs on this page: nasa.gov
6. Bonus (just to go back to the original title)
The investigated total precession and disc-oscillation frequency relation gives the spin a ~ 0.4—0.7 when applied to the microquasar data and may in principle fit the spectral continuum spin estimates…
(but the numbers do not much fully)
7. References
Figs on this page: nasa.gov
7. References•Török, Abramowicz, Kluzniak, Stuchlík2005, A&A, 436, p. 1, www.physics.cz/research
• Török, Abramowicz, Stuchlík, Šrámková,2006, proc. of IAU meeting, astro-ph/0610497
• Török, Abramowicz, Kluzniak, Stuchlík2006, proc. of Albert Einstein Conf. Paris 2005, astro-ph/0603847
Horák, 2004, proc. of RAGtime 5, download: ADS
•Abramowicz, Barret, Bursa, Horák, Kluzniak, Olive, Rebusco, Török,2006, proc. Of RAGtime 2005, download: ADS or www.physics.cz/research
• Abramowicz, Barret, Bursa, Horák, Kluzniak, Olive, Rebusco, Török2006, submitted to MNRAS
• Lachowicz, Czerny & Abramowicz (2006), astro-ph/0607594
• Boutloukous et al., 2006, astro-ph/0608089, ApJ, submitted
•Stuchlík, Török, Slaný, Abramowicz, 2005, Physical Review D, 71
• Stuchlík, Slaný, Török, 2006, proc. of RAGtime, in ADS
Presentation download:www.physics.cz/researchin sect. news
SLIDE UNDER CONSTRUCTION
SLIDE UNDER CONSTRUCTION