Embed Size (px)
DESCRIPTION
Global Marine Ecological Status Report
Citation preview
Based on observations from the global ocean Continuous Plankton Recorder surveys
Global Alliance of Continuous Plankton Recorder Surveys (GACS)
no. 11Global Marine Ecological Status Report
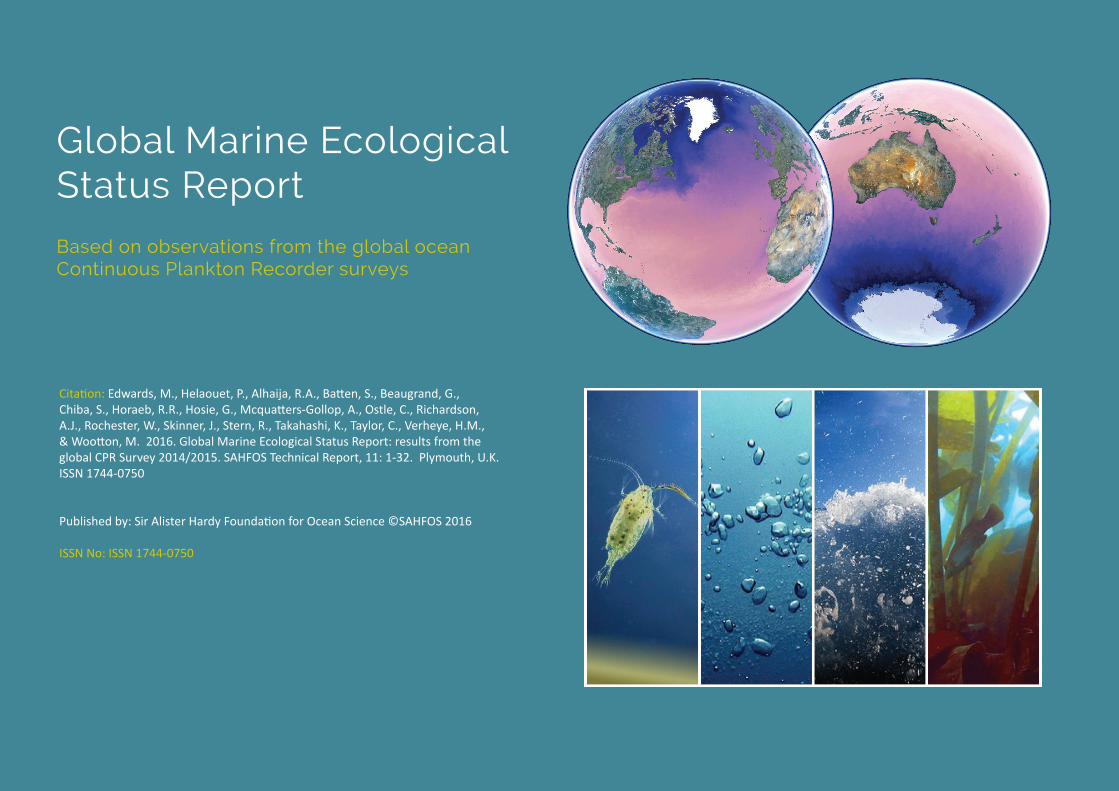
Citation: Edwards, M., Helaouet, P., Alhaija, R.A., Batten, S., Beaugrand, G., Chiba, S., Horaeb, R.R., Hosie, G., Mcquatters-Gollop, A., Ostle, C., Richardson, A.J., Rochester, W., Skinner, J., Stern, R., Takahashi, K., Taylor, C., Verheye, H.M., & Wootton, M. 2016. Global Marine Ecological Status Report: results from the global CPR Survey 2014/2015. SAHFOS Technical Report, 11: 1-32. Plymouth, U.K. ISSN 1744-0750
Published by: Sir Alister Hardy Foundation for Ocean Science ©SAHFOS 2016
ISSN No: ISSN 1744-0750
Global Marine Ecological Status Report
Based on observations from the global ocean Continuous Plankton Recorder surveys
Contents2....................................................................Introduction Summary for policy makers
8....................................................................Global CPR observations North Atlantic and Arctic Southern Ocean Northeast Pacific Northwest Pacific South Atlantic and the Benguela Current Eastern Mediterranean Sea Indian Ocean and Australian waters
20...................................................................Applied ecological indicators Climate change Biodiversity Ecosystem health Ocean acidification
30....................................................................Bibliography
Introduction
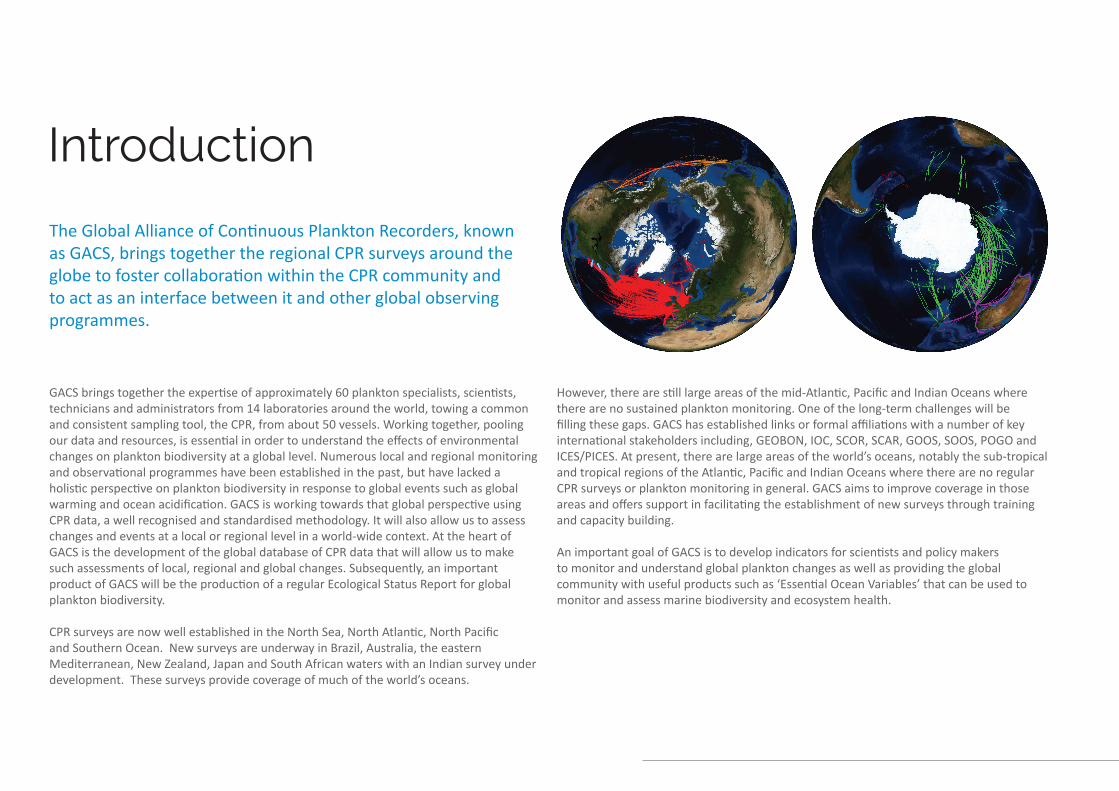
The Global Alliance of Continuous Plankton Recorders, known as GACS, brings together the regional CPR surveys around the globe to foster collaboration within the CPR community and to act as an interface between it and other global observing programmes.
GACS brings together the expertise of approximately 60 plankton specialists, scientists, technicians and administrators from 14 laboratories around the world, towing a common and consistent sampling tool, the CPR, from about 50 vessels. Working together, pooling our data and resources, is essential in order to understand the effects of environmental changes on plankton biodiversity at a global level. Numerous local and regional monitoring and observational programmes have been established in the past, but have lacked a holistic perspective on plankton biodiversity in response to global events such as global warming and ocean acidification. GACS is working towards that global perspective using CPR data, a well recognised and standardised methodology. It will also allow us to assess changes and events at a local or regional level in a world-wide context. At the heart of GACS is the development of the global database of CPR data that will allow us to make such assessments of local, regional and global changes. Subsequently, an important product of GACS will be the production of a regular Ecological Status Report for global plankton biodiversity.
CPR surveys are now well established in the North Sea, North Atlantic, North Pacific and Southern Ocean. New surveys are underway in Brazil, Australia, the eastern Mediterranean, New Zealand, Japan and South African waters with an Indian survey under development. These surveys provide coverage of much of the world’s oceans.
However, there are still large areas of the mid-Atlantic, Pacific and Indian Oceans where there are no sustained plankton monitoring. One of the long-term challenges will be filling these gaps. GACS has established links or formal affiliations with a number of key international stakeholders including, GEOBON, IOC, SCOR, SCAR, GOOS, SOOS, POGO and ICES/PICES. At present, there are large areas of the world’s oceans, notably the sub-tropical and tropical regions of the Atlantic, Pacific and Indian Oceans where there are no regular CPR surveys or plankton monitoring in general. GACS aims to improve coverage in those areas and offers support in facilitating the establishment of new surveys through training and capacity building.
An important goal of GACS is to develop indicators for scientists and policy makers to monitor and understand global plankton changes as well as providing the global community with useful products such as ‘Essential Ocean Variables’ that can be used to monitor and assess marine biodiversity and ecosystem health.
3G A C S / s t a t u s
Current GACS Partners
Survey Country Affiliation
North Atlantic and Arctic UK Sir Alister Hardy Foundation for Ocean Science (SAHFOS)
North East Pacific Canada Sir Alister Hardy Foundation for Ocean Science (SAHFOS)
Southern Ocean Antarctica, Australia Scientific Committee on Antarctic Research (SCAR), Australian Antarctic Division (AAD)
North West Pacific Japan Japan Agency for Marine-Earth Science and Technology (JAMSTEC)
Japanese Antarctic Programme Japan National Institute for Polar Research (NIPR)
New Zealand New Zealand National Institute of Water and Atmospheric Research (NIWA)
US East Coast USA National Oceanic and Atmospheric Administration (NOAA) Northeast Fisheries Science Center
Southern Ocean Antarctica, Brazil Federal University Rio Grande (FURG)
Integrated Marine Observing System Australia Commonwealth Scientific and Industrial Research Organization (CSIRO)
Benguela Current Large Marine Ecosystem
South Africa Department of Environmental Affairs (DEA), Benguela Current Commission (BCC)
China China Institute of Oceanology, Chinese Academy of Sciences (IO-CAS)
Marion Dufresne France Institut Paul Emile Victor (IPEV), Université Pierre et Marie Curie (UPMC)
Cyprus Cyprus The Cyprus Institute (CyI)
Indian India National Institute of Oceanography (NIO)
Further information can be found at www.globalcpr.org
Plankton are the foundation of marine food webs and support virtually all life in our oceans. The Global Marine Ecological Status Report is an assessment of the state of the global oceans based on observations from the global ocean Continuous Plankton Recorder surveys.
This report consists of two main parts: (1) the general plankton status around the world from the CPR global network using potential Essential Ocean Variables; and (2) an applied indicator approach to the NE Atlantic and European waters. The applied indicator approach focuses on providing information for important marine management and policy issues such as climate warming impacts, biodiversity, pollution and fisheries.
Global Marine Ecological Status Report
4g l o b a l / s t a t u s Sir Alister Hardy Foundation for Ocean Science
Plankton communities as ecological indicators
Generally, two definitions of ecological indicators exist. One is an indicator of an environmental (biotic or abiotic) property (e.g. a biological indicator of climate change and its impacts) that can be statistically measured e.g. indicative value of a variable. The other definition is similar to a performance indicator; in which management actions can be measured (e.g. a significant change in status is expected to trigger a management response).
Planktonic indicators are particularly useful in managing the marine environment as they can provide information on a whole multitude of management issues, ranging from climate change impacts; fisheries and marine wildlife; eutrophication/pollution; ocean acidification; marine biodiversity and invasive species.
In an applied ecological indicator sense, the following planktonic indicators are used to track changes that are particularly important to policy and management, for example changes in marine ecosystem health, climate change and acidification impacts. Ecological indicators may be bulk indicators, individual species or entire communities. Generally, the CPR survey uses high grade ecological information such as species and communities to monitor change as these tend to be more sensitive to change (as opposed to bulk indicators such as measures of chlorophyll (see table)).
Biological variable Example Notes Bulk Status Variables
(index)
Chlorophyll, biomass, total abundance, EOVs, community size.
Not particularly sensitive and a basic indicator, di�cult to interpret change and predict through models. Cheaper to monitor. Monitored using taxonomic methods, satellite observations and various optical technologies.
Sentinel Species
(univariate taxa)
Individual species of high indicative value and/or key structural species. Targeted indicators for policy and management requirements, e.g. climate change, acidi�cation, �sheries, etc.
Individual species chosen to be highly indicative and highly sensitive to ecosystem change and/or key structural species. Can be highly variable but �uctuations more easy to interpret. Models easier to predict if niche requirements known. Monitored using taxonomic and molecular methods. Molecular methods are not yet completely quantitative they can be designed to be quantitative for speci�c taxon groups or functional potential.
Community structure based on species information
(multivariate taxa)
Multivariate community structure measures. Univariate summaries e.g. diversity indices.
Community indicator �uctuations are statistically more robust and may indicate system wide changes (e.g. regime shifts). More intensive monitoring required to measure. Monitored using taxonomic and genetic methods.
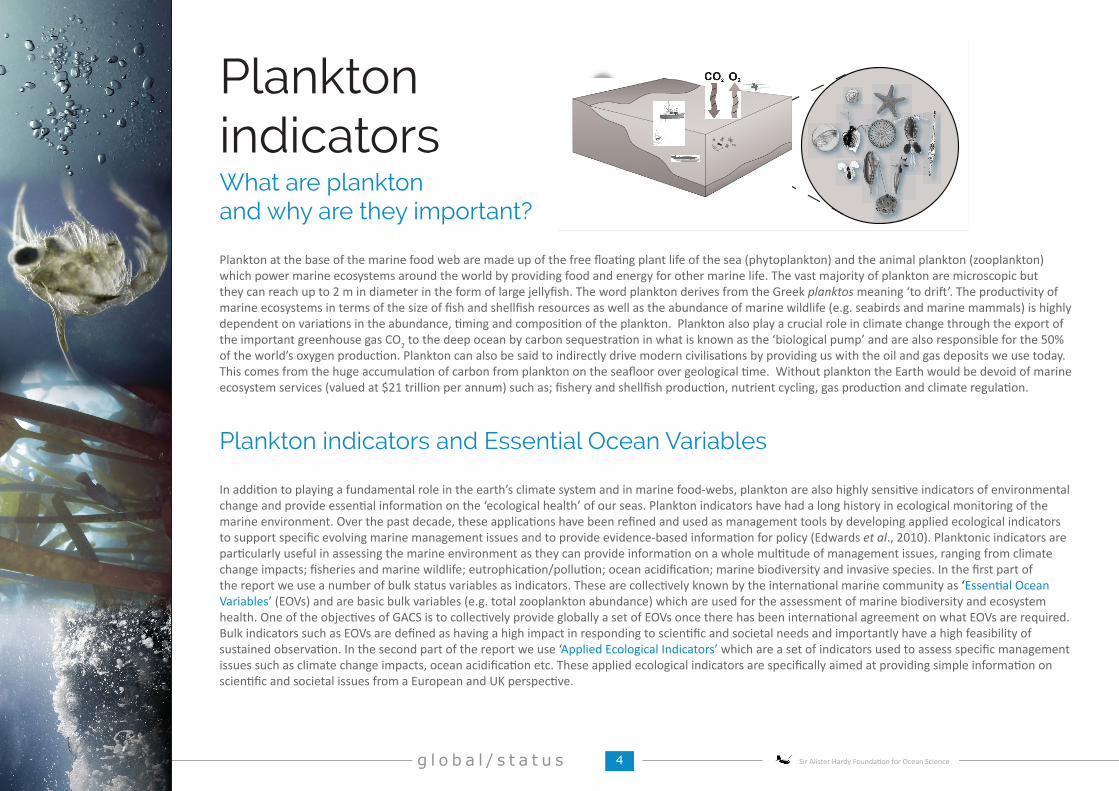
What are plankton and why are they important?
Plankton at the base of the marine food web are made up of the free floating plant life of the sea (phytoplankton) and the animal plankton (zooplankton) which power marine ecosystems around the world by providing food and energy for other marine life. The vast majority of plankton are microscopic but they can reach up to 2 m in diameter in the form of large jellyfish. The word plankton derives from the Greek planktos meaning ‘to drift’. The productivity of marine ecosystems in terms of the size of fish and shellfish resources as well as the abundance of marine wildlife (e.g. seabirds and marine mammals) is highly dependent on variations in the abundance, timing and composition of the plankton. Plankton also play a crucial role in climate change through the export of the important greenhouse gas CO2 to the deep ocean by carbon sequestration in what is known as the ‘biological pump’ and are also responsible for the 50% of the world’s oxygen production. Plankton can also be said to indirectly drive modern civilisations by providing us with the oil and gas deposits we use today. This comes from the huge accumulation of carbon from plankton on the seafloor over geological time. Without plankton the Earth would be devoid of marine ecosystem services (valued at $21 trillion per annum) such as; fishery and shellfish production, nutrient cycling, gas production and climate regulation.
Plankton indicators and Essential Ocean Variables
In addition to playing a fundamental role in the earth’s climate system and in marine food-webs, plankton are also highly sensitive indicators of environmental change and provide essential information on the ‘ecological health’ of our seas. Plankton indicators have had a long history in ecological monitoring of the marine environment. Over the past decade, these applications have been refined and used as management tools by developing applied ecological indicators to support specific evolving marine management issues and to provide evidence-based information for policy (Edwards et al., 2010). Planktonic indicators are particularly useful in assessing the marine environment as they can provide information on a whole multitude of management issues, ranging from climate change impacts; fisheries and marine wildlife; eutrophication/pollution; ocean acidification; marine biodiversity and invasive species. In the first part of the report we use a number of bulk status variables as indicators. These are collectively known by the international marine community as ‘Essential Ocean Variables’ (EOVs) and are basic bulk variables (e.g. total zooplankton abundance) which are used for the assessment of marine biodiversity and ecosystem health. One of the objectives of GACS is to collectively provide globally a set of EOVs once there has been international agreement on what EOVs are required. Bulk indicators such as EOVs are defined as having a high impact in responding to scientific and societal needs and importantly have a high feasibility of sustained observation. In the second part of the report we use ‘Applied Ecological Indicators’ which are a set of indicators used to assess specific management issues such as climate change impacts, ocean acidification etc. These applied ecological indicators are specifically aimed at providing simple information on scientific and societal issues from a European and UK perspective.
Planktonindicators
5G A C S / s t a t u s
Summary for policy makers
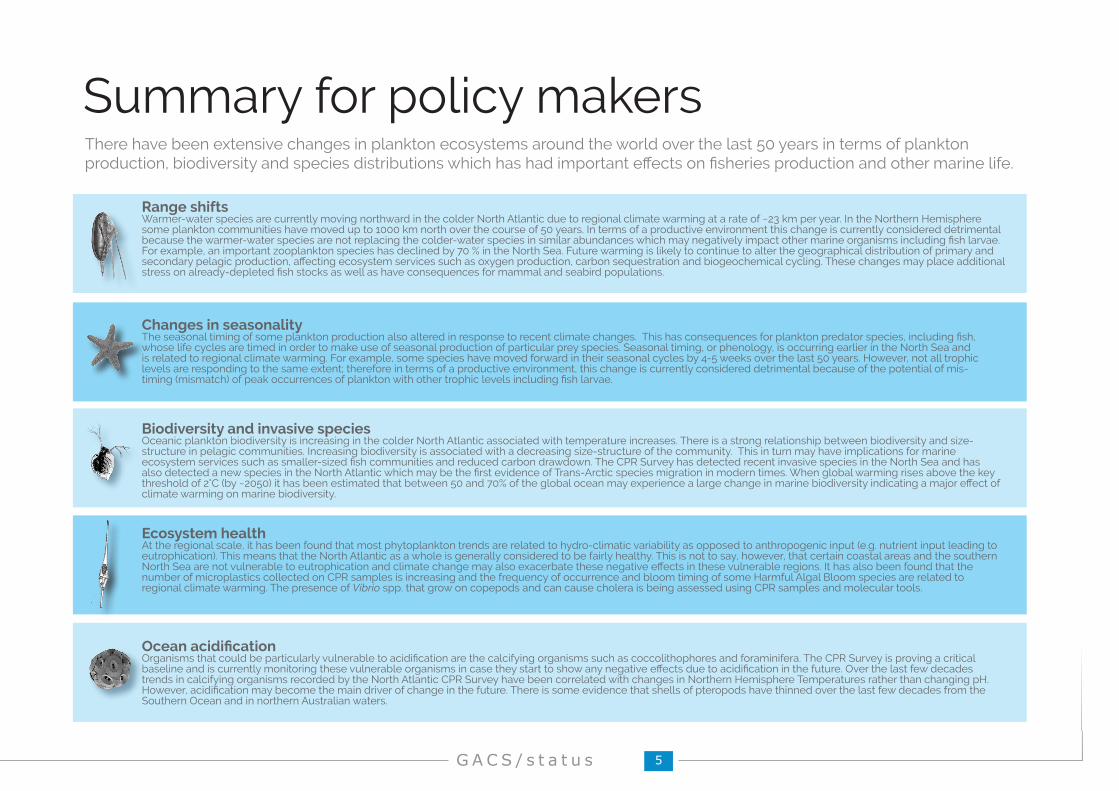
Changes in seasonalityThe seasonal timing of some plankton production also altered in response to recent climate changes. This has consequences for plankton predator species, including fish, whose life cycles are timed in order to make use of seasonal production of particular prey species. Seasonal timing, or phenology, is occurring earlier in the North Sea and is related to regional climate warming. For example, some species have moved forward in their seasonal cycles by 4-5 weeks over the last 50 years. However, not all trophic levels are responding to the same extent; therefore in terms of a productive environment, this change is currently considered detrimental because of the potential of mis-timing (mismatch) of peak occurrences of plankton with other trophic levels including fish larvae.
Biodiversity and invasive speciesOceanic plankton biodiversity is increasing in the colder North Atlantic associated with temperature increases. There is a strong relationship between biodiversity and size-structure in pelagic communities. Increasing biodiversity is associated with a decreasing size-structure of the community. This in turn may have implications for marine ecosystem services such as smaller-sized fish communities and reduced carbon drawdown. The CPR Survey has detected recent invasive species in the North Sea and has also detected a new species in the North Atlantic which may be the first evidence of Trans-Arctic species migration in modern times. When global warming rises above the key threshold of 2°C (by ~2050) it has been estimated that between 50 and 70% of the global ocean may experience a large change in marine biodiversity indicating a major effect of climate warming on marine biodiversity.
Range shiftsWarmer-water species are currently moving northward in the colder North Atlantic due to regional climate warming at a rate of ~23 km per year. In the Northern Hemisphere some plankton communities have moved up to 1000 km north over the course of 50 years. In terms of a productive environment this change is currently considered detrimental because the warmer-water species are not replacing the colder-water species in similar abundances which may negatively impact other marine organisms including fish larvae. For example, an important zooplankton species has declined by 70 % in the North Sea. Future warming is likely to continue to alter the geographical distribution of primary and secondary pelagic production, affecting ecosystem services such as oxygen production, carbon sequestration and biogeochemical cycling. These changes may place additional stress on already-depleted fish stocks as well as have consequences for mammal and seabird populations.
Ocean acidificationOrganisms that could be particularly vulnerable to acidification are the calcifying organisms such as coccolithophores and foraminifera. The CPR Survey is proving a critical baseline and is currently monitoring these vulnerable organisms in case they start to show any negative effects due to acidification in the future. Over the last few decades trends in calcifying organisms recorded by the North Atlantic CPR Survey have been correlated with changes in Northern Hemisphere Temperatures rather than changing pH. However, acidification may become the main driver of change in the future. There is some evidence that shells of pteropods have thinned over the last few decades from the Southern Ocean and in northern Australian waters.
Ecosystem healthAt the regional scale, it has been found that most phytoplankton trends are related to hydro-climatic variability as opposed to anthropogenic input (e.g. nutrient input leading to eutrophication). This means that the North Atlantic as a whole is generally considered to be fairly healthy. This is not to say, however, that certain coastal areas and the southern North Sea are not vulnerable to eutrophication and climate change may also exacerbate these negative effects in these vulnerable regions. It has also been found that the number of microplastics collected on CPR samples is increasing and the frequency of occurrence and bloom timing of some Harmful Algal Bloom species are related to regional climate warming. The presence of Vibrio spp. that grow on copepods and can cause cholera is being assessed using CPR samples and molecular tools.
There have been extensive changes in plankton ecosystems around the world over the last 50 years in terms of plankton production, biodiversity and species distributions which has had important effects on fisheries production and other marine life.
6g l o b a l / s t a t u s Sir Alister Hardy Foundation for Ocean Science
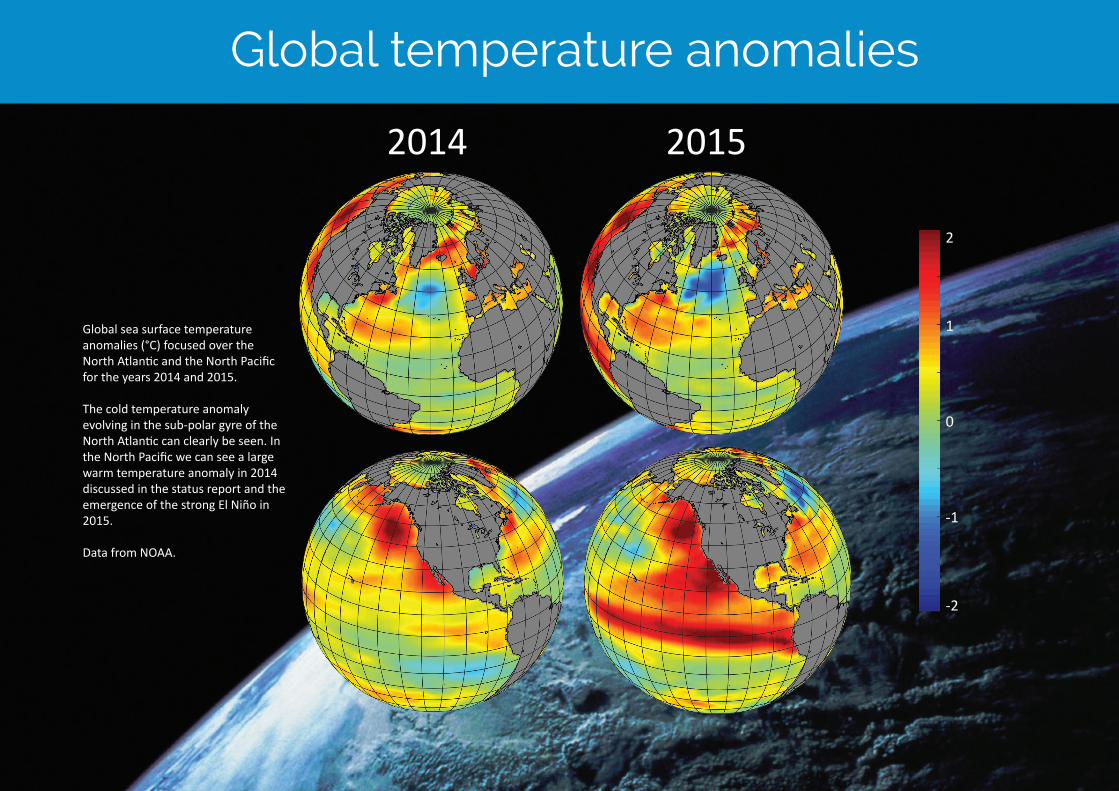
Global temperature anomalies
20152014
Global sea surface temperature anomalies (°C) focused over the North Atlantic and the North Pacific for the years 2014 and 2015.
The cold temperature anomaly evolving in the sub-polar gyre of the North Atlantic can clearly be seen. In the North Pacific we can see a large warm temperature anomaly in 2014 discussed in the status report and the emergence of the strong El Niño in 2015.
Data from NOAA.
2
-2
-1
0
1
7G A C S / s t a t u s
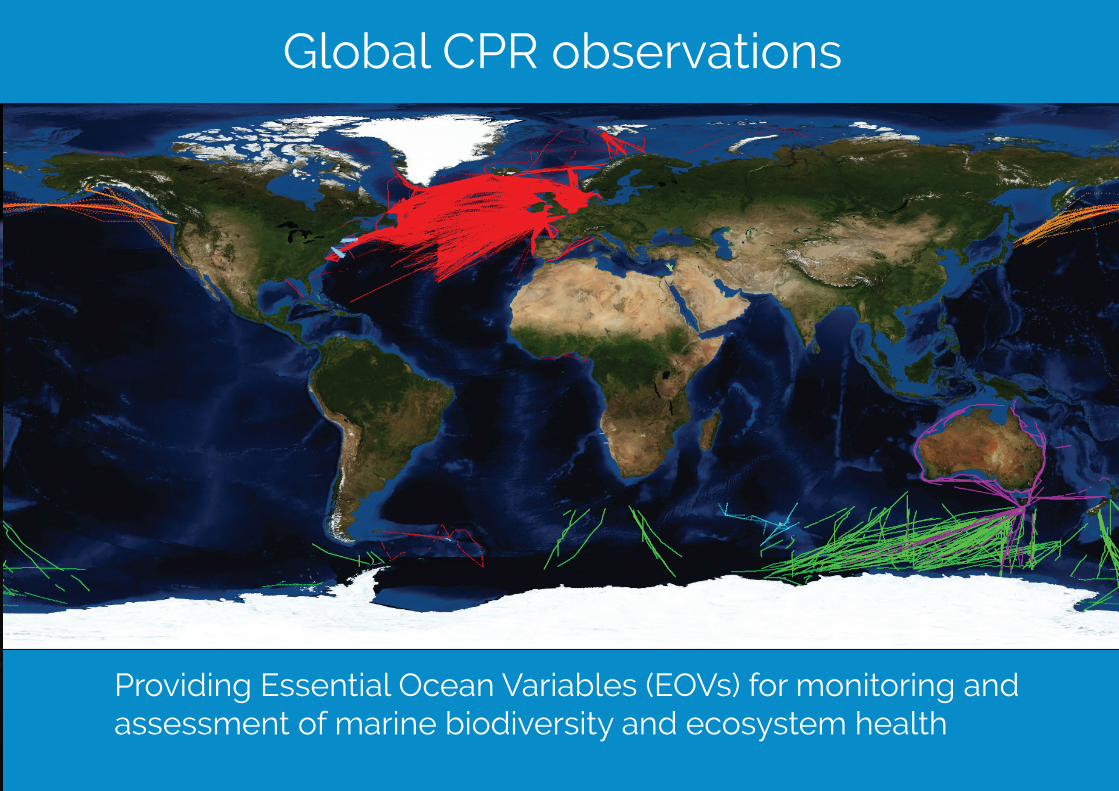
Global CPR observations
Providing Essential Ocean Variables (EOVs) for monitoring and assessment of marine biodiversity and ecosystem health
8g l o b a l / s t a t u s Sir Alister Hardy Foundation for Ocean Science
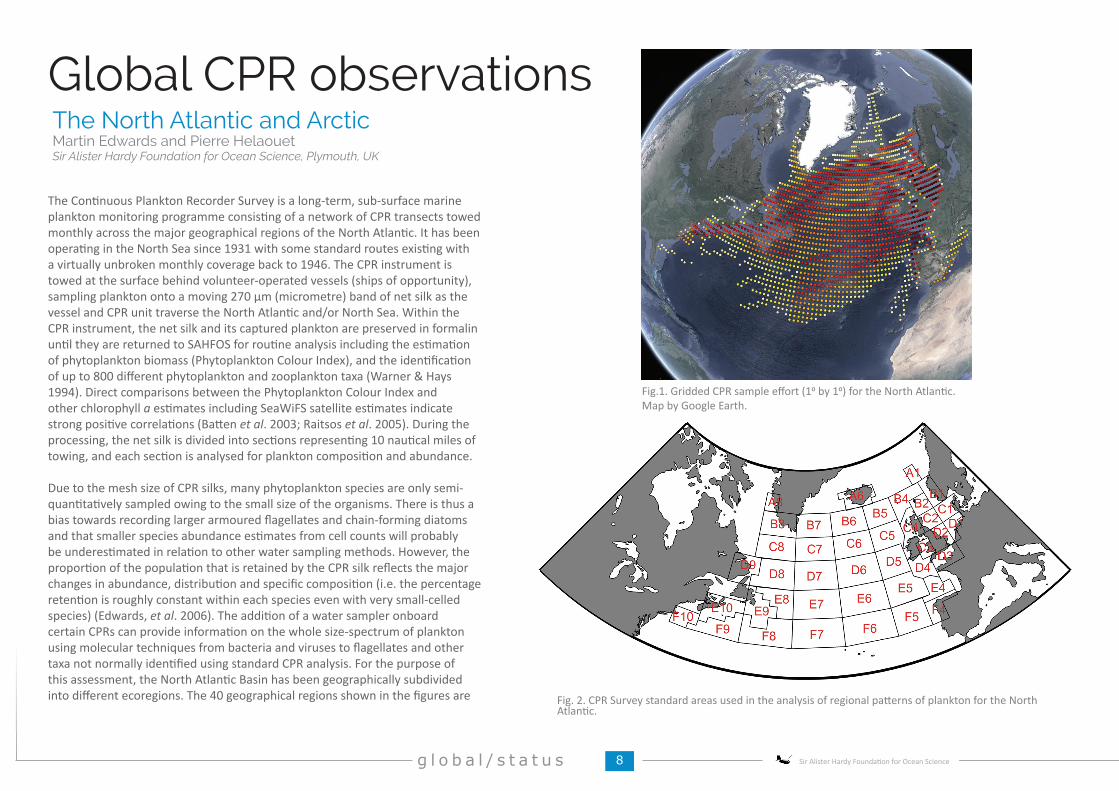
Global CPR observationsThe North Atlantic and ArcticMartin Edwards and Pierre HelaouetSir Alister Hardy Foundation for Ocean Science, Plymouth, UK
Fig.1. Gridded CPR sample effort (10 by 10) for the North Atlantic. Map by Google Earth.
Fig. 2. CPR Survey standard areas used in the analysis of regional patterns of plankton for the North Atlantic.
The Continuous Plankton Recorder Survey is a long-term, sub-surface marine plankton monitoring programme consisting of a network of CPR transects towed monthly across the major geographical regions of the North Atlantic. It has been operating in the North Sea since 1931 with some standard routes existing with a virtually unbroken monthly coverage back to 1946. The CPR instrument is towed at the surface behind volunteer-operated vessels (ships of opportunity), sampling plankton onto a moving 270 µm (micrometre) band of net silk as the vessel and CPR unit traverse the North Atlantic and/or North Sea. Within the CPR instrument, the net silk and its captured plankton are preserved in formalin until they are returned to SAHFOS for routine analysis including the estimation of phytoplankton biomass (Phytoplankton Colour Index), and the identification of up to 800 different phytoplankton and zooplankton taxa (Warner & Hays 1994). Direct comparisons between the Phytoplankton Colour Index and other chlorophyll a estimates including SeaWiFS satellite estimates indicate strong positive correlations (Batten et al. 2003; Raitsos et al. 2005). During the processing, the net silk is divided into sections representing 10 nautical miles of towing, and each section is analysed for plankton composition and abundance. Due to the mesh size of CPR silks, many phytoplankton species are only semi-quantitatively sampled owing to the small size of the organisms. There is thus a bias towards recording larger armoured flagellates and chain-forming diatoms and that smaller species abundance estimates from cell counts will probably be underestimated in relation to other water sampling methods. However, the proportion of the population that is retained by the CPR silk reflects the major changes in abundance, distribution and specific composition (i.e. the percentage retention is roughly constant within each species even with very small-celled species) (Edwards, et al. 2006). The addition of a water sampler onboard certain CPRs can provide information on the whole size-spectrum of plankton using molecular techniques from bacteria and viruses to flagellates and other taxa not normally identified using standard CPR analysis. For the purpose of this assessment, the North Atlantic Basin has been geographically subdivided into different ecoregions. The 40 geographical regions shown in the figures are
9G A C S / s t a t u s
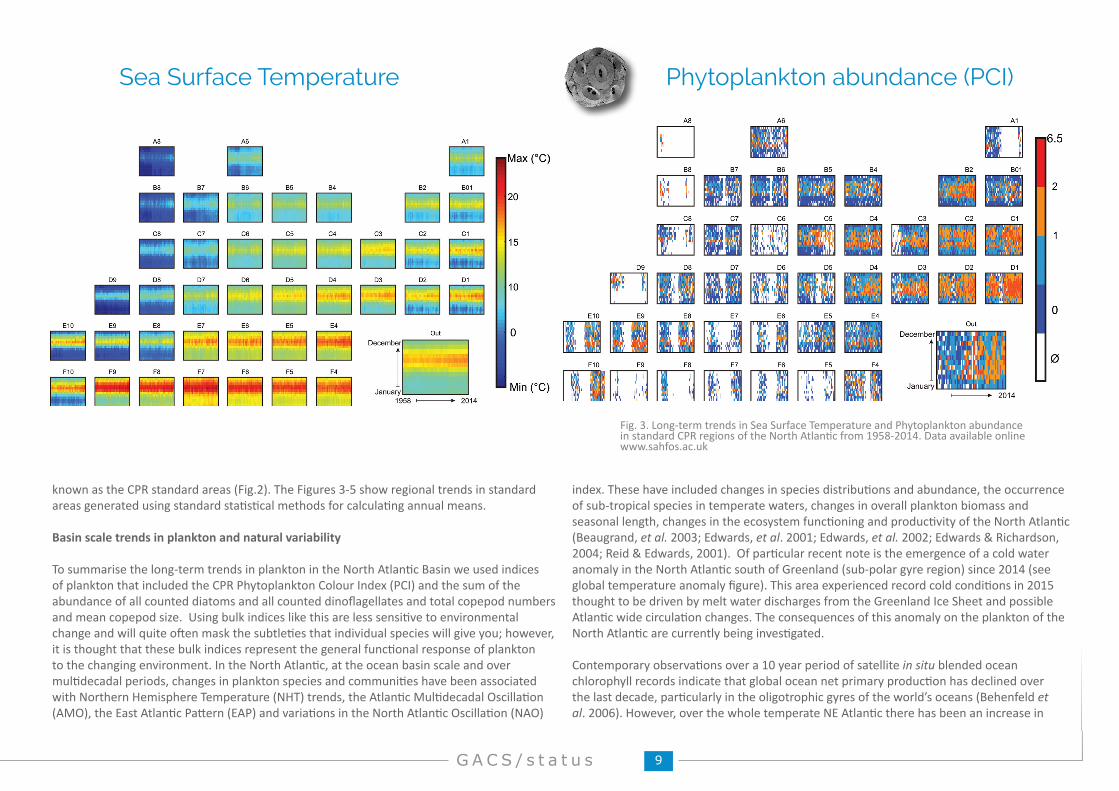
Fig. 3. Long-term trends in Sea Surface Temperature and Phytoplankton abundance in standard CPR regions of the North Atlantic from 1958-2014. Data available online www.sahfos.ac.uk
Phytoplankton abundance (PCI)Sea Surface Temperature
known as the CPR standard areas (Fig.2). The Figures 3-5 show regional trends in standard areas generated using standard statistical methods for calculating annual means.
Basin scale trends in plankton and natural variability
To summarise the long-term trends in plankton in the North Atlantic Basin we used indices of plankton that included the CPR Phytoplankton Colour Index (PCI) and the sum of the abundance of all counted diatoms and all counted dinoflagellates and total copepod numbers and mean copepod size. Using bulk indices like this are less sensitive to environmental change and will quite often mask the subtleties that individual species will give you; however, it is thought that these bulk indices represent the general functional response of plankton to the changing environment. In the North Atlantic, at the ocean basin scale and over multidecadal periods, changes in plankton species and communities have been associated with Northern Hemisphere Temperature (NHT) trends, the Atlantic Multidecadal Oscillation (AMO), the East Atlantic Pattern (EAP) and variations in the North Atlantic Oscillation (NAO)
index. These have included changes in species distributions and abundance, the occurrence of sub-tropical species in temperate waters, changes in overall plankton biomass and seasonal length, changes in the ecosystem functioning and productivity of the North Atlantic (Beaugrand, et al. 2003; Edwards, et al. 2001; Edwards, et al. 2002; Edwards & Richardson, 2004; Reid & Edwards, 2001). Of particular recent note is the emergence of a cold water anomaly in the North Atlantic south of Greenland (sub-polar gyre region) since 2014 (see global temperature anomaly figure). This area experienced record cold conditions in 2015 thought to be driven by melt water discharges from the Greenland Ice Sheet and possible Atlantic wide circulation changes. The consequences of this anomaly on the plankton of the North Atlantic are currently being investigated.
Contemporary observations over a 10 year period of satellite in situ blended ocean chlorophyll records indicate that global ocean net primary production has declined over the last decade, particularly in the oligotrophic gyres of the world’s oceans (Behenfeld et al. 2006). However, over the whole temperate NE Atlantic there has been an increase in
10g l o b a l / s t a t u s Sir Alister Hardy Foundation for Ocean Science
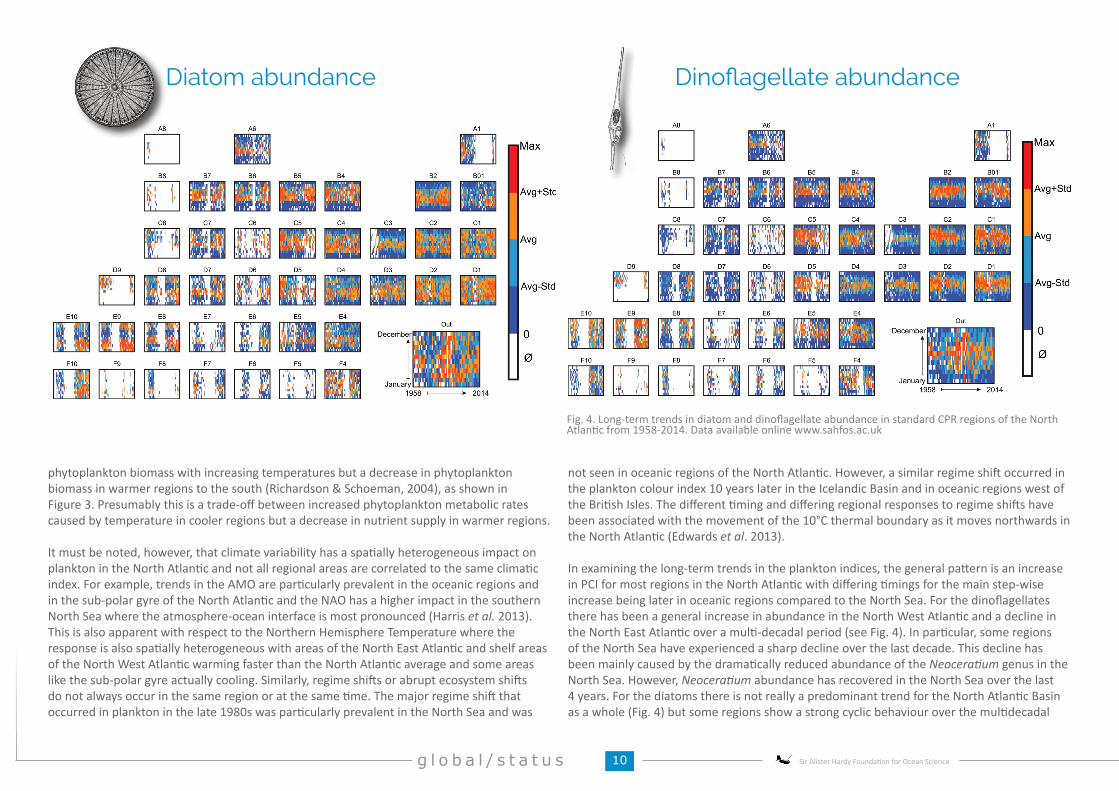
Fig. 4. Long-term trends in diatom and dinoflagellate abundance in standard CPR regions of the North Atlantic from 1958-2014. Data available online www.sahfos.ac.uk
Diatom abundance Dinoflagellate abundance
phytoplankton biomass with increasing temperatures but a decrease in phytoplankton biomass in warmer regions to the south (Richardson & Schoeman, 2004), as shown in Figure 3. Presumably this is a trade-off between increased phytoplankton metabolic rates caused by temperature in cooler regions but a decrease in nutrient supply in warmer regions.
It must be noted, however, that climate variability has a spatially heterogeneous impact on plankton in the North Atlantic and not all regional areas are correlated to the same climatic index. For example, trends in the AMO are particularly prevalent in the oceanic regions and in the sub-polar gyre of the North Atlantic and the NAO has a higher impact in the southern North Sea where the atmosphere-ocean interface is most pronounced (Harris et al. 2013). This is also apparent with respect to the Northern Hemisphere Temperature where the response is also spatially heterogeneous with areas of the North East Atlantic and shelf areas of the North West Atlantic warming faster than the North Atlantic average and some areas like the sub-polar gyre actually cooling. Similarly, regime shifts or abrupt ecosystem shifts do not always occur in the same region or at the same time. The major regime shift that occurred in plankton in the late 1980s was particularly prevalent in the North Sea and was
not seen in oceanic regions of the North Atlantic. However, a similar regime shift occurred in the plankton colour index 10 years later in the Icelandic Basin and in oceanic regions west of the British Isles. The different timing and differing regional responses to regime shifts have been associated with the movement of the 10°C thermal boundary as it moves northwards in the North Atlantic (Edwards et al. 2013).
In examining the long-term trends in the plankton indices, the general pattern is an increase in PCI for most regions in the North Atlantic with differing timings for the main step-wise increase being later in oceanic regions compared to the North Sea. For the dinoflagellates there has been a general increase in abundance in the North West Atlantic and a decline in the North East Atlantic over a multi-decadal period (see Fig. 4). In particular, some regions of the North Sea have experienced a sharp decline over the last decade. This decline has been mainly caused by the dramatically reduced abundance of the Neoceratium genus in the North Sea. However, Neoceratium abundance has recovered in the North Sea over the last 4 years. For the diatoms there is not really a predominant trend for the North Atlantic Basin as a whole (Fig. 4) but some regions show a strong cyclic behaviour over the multidecadal
11G A C S / s t a t u s
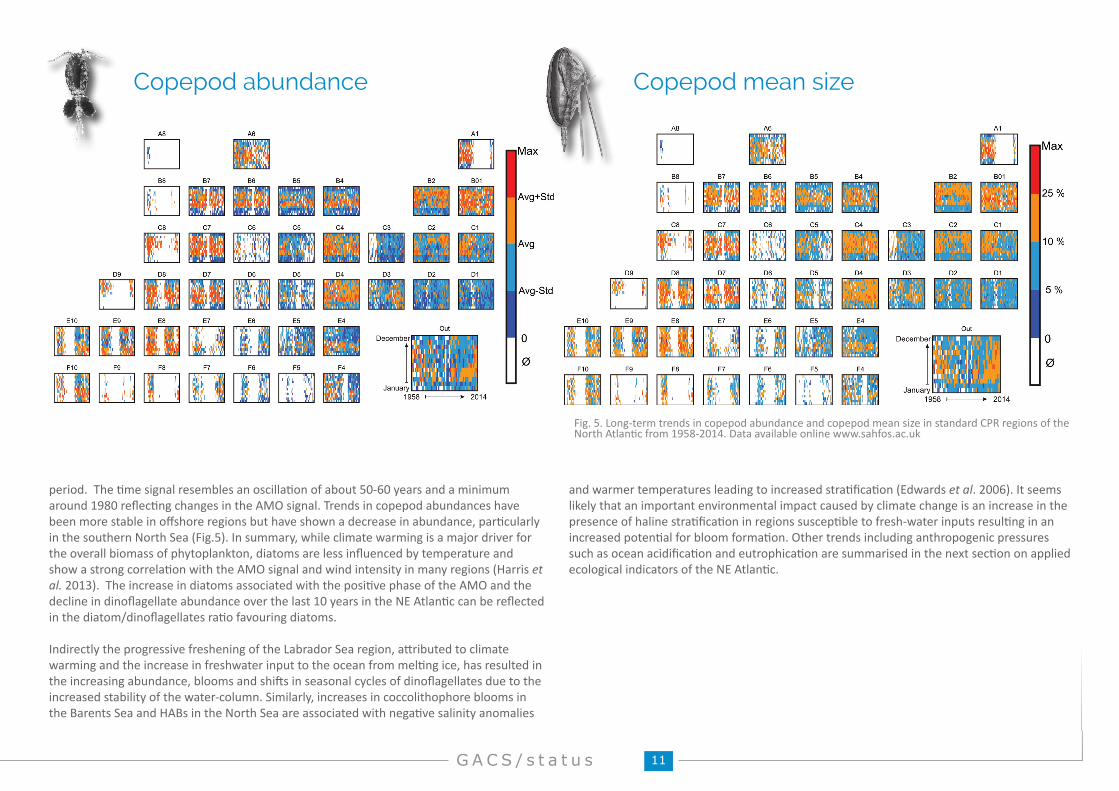
Copepod abundance Copepod mean size
Fig. 5. Long-term trends in copepod abundance and copepod mean size in standard CPR regions of the North Atlantic from 1958-2014. Data available online www.sahfos.ac.uk
period. The time signal resembles an oscillation of about 50-60 years and a minimum around 1980 reflecting changes in the AMO signal. Trends in copepod abundances have been more stable in offshore regions but have shown a decrease in abundance, particularly in the southern North Sea (Fig.5). In summary, while climate warming is a major driver for the overall biomass of phytoplankton, diatoms are less influenced by temperature and show a strong correlation with the AMO signal and wind intensity in many regions (Harris et al. 2013). The increase in diatoms associated with the positive phase of the AMO and the decline in dinoflagellate abundance over the last 10 years in the NE Atlantic can be reflected in the diatom/dinoflagellates ratio favouring diatoms.
Indirectly the progressive freshening of the Labrador Sea region, attributed to climate warming and the increase in freshwater input to the ocean from melting ice, has resulted in the increasing abundance, blooms and shifts in seasonal cycles of dinoflagellates due to the increased stability of the water-column. Similarly, increases in coccolithophore blooms in the Barents Sea and HABs in the North Sea are associated with negative salinity anomalies
and warmer temperatures leading to increased stratification (Edwards et al. 2006). It seems likely that an important environmental impact caused by climate change is an increase in the presence of haline stratification in regions susceptible to fresh-water inputs resulting in an increased potential for bloom formation. Other trends including anthropogenic pressures such as ocean acidification and eutrophication are summarised in the next section on applied ecological indicators of the NE Atlantic.
12g l o b a l / s t a t u s Sir Alister Hardy Foundation for Ocean Science
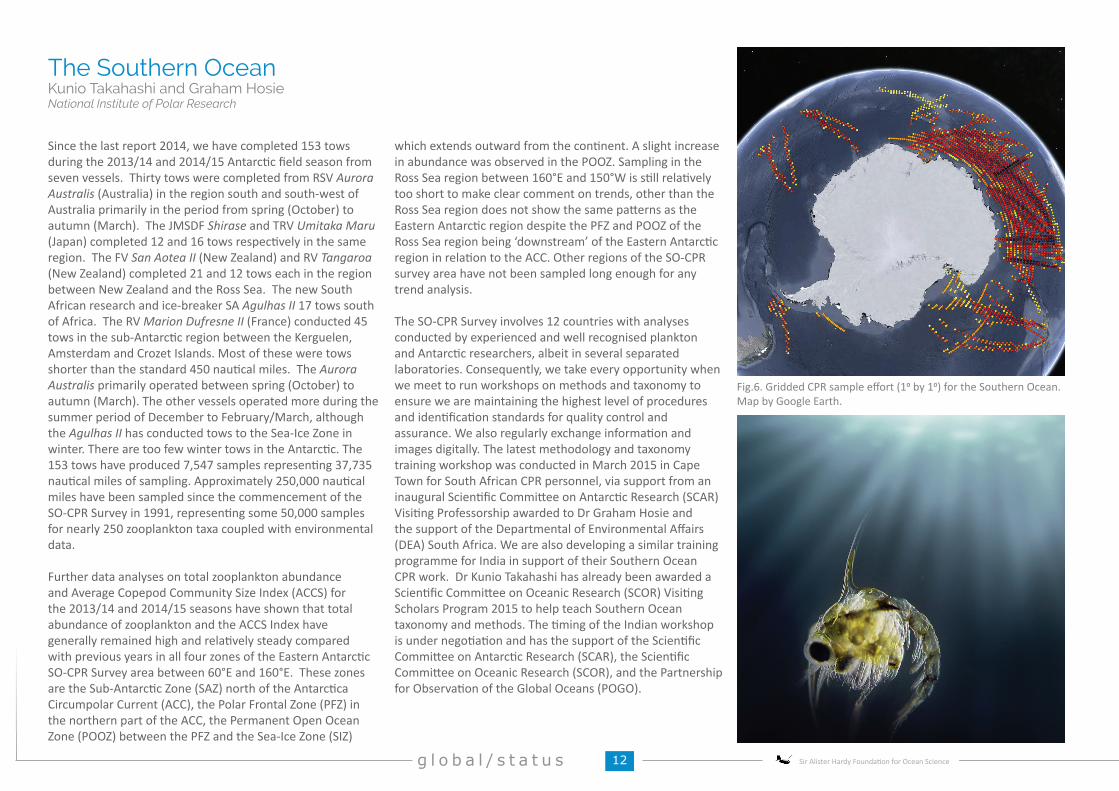
The Southern OceanKunio Takahashi and Graham HosieNational Institute of Polar Research
Fig.6. Gridded CPR sample effort (10 by 10) for the Southern Ocean. Map by Google Earth.
Since the last report 2014, we have completed 153 tows during the 2013/14 and 2014/15 Antarctic field season from seven vessels. Thirty tows were completed from RSV Aurora Australis (Australia) in the region south and south-west of Australia primarily in the period from spring (October) to autumn (March). The JMSDF Shirase and TRV Umitaka Maru (Japan) completed 12 and 16 tows respectively in the same region. The FV San Aotea II (New Zealand) and RV Tangaroa (New Zealand) completed 21 and 12 tows each in the region between New Zealand and the Ross Sea. The new South African research and ice-breaker SA Agulhas II 17 tows south of Africa. The RV Marion Dufresne II (France) conducted 45 tows in the sub-Antarctic region between the Kerguelen, Amsterdam and Crozet Islands. Most of these were tows shorter than the standard 450 nautical miles. The Aurora Australis primarily operated between spring (October) to autumn (March). The other vessels operated more during the summer period of December to February/March, although the Agulhas II has conducted tows to the Sea-Ice Zone in winter. There are too few winter tows in the Antarctic. The 153 tows have produced 7,547 samples representing 37,735 nautical miles of sampling. Approximately 250,000 nautical miles have been sampled since the commencement of the SO-CPR Survey in 1991, representing some 50,000 samples for nearly 250 zooplankton taxa coupled with environmental data.
Further data analyses on total zooplankton abundance and Average Copepod Community Size Index (ACCS) for the 2013/14 and 2014/15 seasons have shown that total abundance of zooplankton and the ACCS Index have generally remained high and relatively steady compared with previous years in all four zones of the Eastern Antarctic SO-CPR Survey area between 60°E and 160°E. These zones are the Sub-Antarctic Zone (SAZ) north of the Antarctica Circumpolar Current (ACC), the Polar Frontal Zone (PFZ) in the northern part of the ACC, the Permanent Open Ocean Zone (POOZ) between the PFZ and the Sea-Ice Zone (SIZ)
which extends outward from the continent. A slight increase in abundance was observed in the POOZ. Sampling in the Ross Sea region between 160°E and 150°W is still relatively too short to make clear comment on trends, other than the Ross Sea region does not show the same patterns as the Eastern Antarctic region despite the PFZ and POOZ of the Ross Sea region being ‘downstream’ of the Eastern Antarctic region in relation to the ACC. Other regions of the SO-CPR survey area have not been sampled long enough for any trend analysis.
The SO-CPR Survey involves 12 countries with analyses conducted by experienced and well recognised plankton and Antarctic researchers, albeit in several separated laboratories. Consequently, we take every opportunity when we meet to run workshops on methods and taxonomy to ensure we are maintaining the highest level of procedures and identification standards for quality control and assurance. We also regularly exchange information and images digitally. The latest methodology and taxonomy training workshop was conducted in March 2015 in Cape Town for South African CPR personnel, via support from an inaugural Scientific Committee on Antarctic Research (SCAR) Visiting Professorship awarded to Dr Graham Hosie and the support of the Departmental of Environmental Affairs (DEA) South Africa. We are also developing a similar training programme for India in support of their Southern Ocean CPR work. Dr Kunio Takahashi has already been awarded a Scientific Committee on Oceanic Research (SCOR) Visiting Scholars Program 2015 to help teach Southern Ocean taxonomy and methods. The timing of the Indian workshop is under negotiation and has the support of the Scientific Committee on Antarctic Research (SCAR), the Scientific Committee on Oceanic Research (SCOR), and the Partnership for Observation of the Global Oceans (POGO).
13G A C S / s t a t u s
0
50000
100000
150000
2000
2001
2002
2003
2004
2005
2006
2007
2008
2009
2010
2011
2012
2013
2014
2015
Annu
al M
ean
Sam
ple
Abun
danc
e
Diatoms
0
50000
100000
150000
2004
2005
2006
2007
2008
2009
2010
2011
2012
2013
2014
2015
Annu
al M
ean
Sam
ple
Abun
danc
e
Diatoms
0
200
400
600
800
2000
2001
2002
2003
2004
2005
2006
2007
2008
2009
2010
2011
2012
2013
2014
2015
Annu
al M
ean
Sam
ple
Abun
danc
e
Zooplankton
0
500
1000
1500
2004
2005
2006
2007
2008
2009
2010
2011
2012
2013
2014
2015
Annu
al M
ean
Sam
ple
Abun
danc
e
Zooplankton
2
2.5
3
3.5
4
4.5
2000
2001
2002
2003
2004
2005
2006
2007
2008
2009
2010
2011
2012
2013
2014
2015
Annu
al M
ean
Cope
pod
leng
th (m
m)
Average Copepod Community Size
1.5
2
2.5
3
3.5
2004
2005
2006
2007
2008
2009
2010
2011
2012
2013
2014
2015
Annu
al M
ean
Cope
pod
leng
th (m
m)
Average Copepod Community Size
The Northeast PacificSonia BattenNorth Pacific CPR Coordinator, British Columbia, Canada
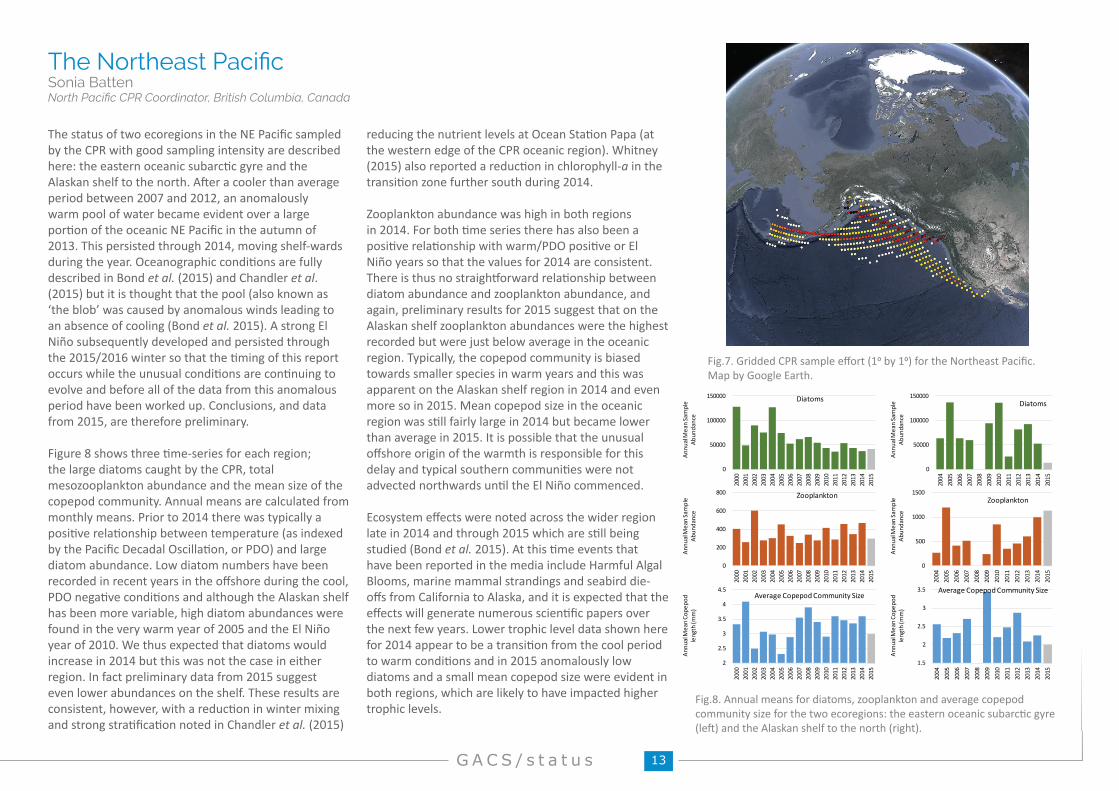
Fig.7. Gridded CPR sample effort (10 by 10) for the Northeast Pacific. Map by Google Earth.
Fig.8. Annual means for diatoms, zooplankton and average copepod community size for the two ecoregions: the eastern oceanic subarctic gyre (left) and the Alaskan shelf to the north (right).
The status of two ecoregions in the NE Pacific sampled by the CPR with good sampling intensity are described here: the eastern oceanic subarctic gyre and the Alaskan shelf to the north. After a cooler than average period between 2007 and 2012, an anomalously warm pool of water became evident over a large portion of the oceanic NE Pacific in the autumn of 2013. This persisted through 2014, moving shelf-wards during the year. Oceanographic conditions are fully described in Bond et al. (2015) and Chandler et al. (2015) but it is thought that the pool (also known as ‘the blob’ was caused by anomalous winds leading to an absence of cooling (Bond et al. 2015). A strong El Niño subsequently developed and persisted through the 2015/2016 winter so that the timing of this report occurs while the unusual conditions are continuing to evolve and before all of the data from this anomalous period have been worked up. Conclusions, and data from 2015, are therefore preliminary.
Figure 8 shows three time-series for each region; the large diatoms caught by the CPR, total mesozooplankton abundance and the mean size of the copepod community. Annual means are calculated from monthly means. Prior to 2014 there was typically a positive relationship between temperature (as indexed by the Pacific Decadal Oscillation, or PDO) and large diatom abundance. Low diatom numbers have been recorded in recent years in the offshore during the cool, PDO negative conditions and although the Alaskan shelf has been more variable, high diatom abundances were found in the very warm year of 2005 and the El Niño year of 2010. We thus expected that diatoms would increase in 2014 but this was not the case in either region. In fact preliminary data from 2015 suggest even lower abundances on the shelf. These results are consistent, however, with a reduction in winter mixing and strong stratification noted in Chandler et al. (2015)
reducing the nutrient levels at Ocean Station Papa (at the western edge of the CPR oceanic region). Whitney (2015) also reported a reduction in chlorophyll-a in the transition zone further south during 2014.
Zooplankton abundance was high in both regions in 2014. For both time series there has also been a positive relationship with warm/PDO positive or El Niño years so that the values for 2014 are consistent. There is thus no straightforward relationship between diatom abundance and zooplankton abundance, and again, preliminary results for 2015 suggest that on the Alaskan shelf zooplankton abundances were the highest recorded but were just below average in the oceanic region. Typically, the copepod community is biased towards smaller species in warm years and this was apparent on the Alaskan shelf region in 2014 and even more so in 2015. Mean copepod size in the oceanic region was still fairly large in 2014 but became lower than average in 2015. It is possible that the unusual offshore origin of the warmth is responsible for this delay and typical southern communities were not advected northwards until the El Niño commenced.
Ecosystem effects were noted across the wider region late in 2014 and through 2015 which are still being studied (Bond et al. 2015). At this time events that have been reported in the media include Harmful Algal Blooms, marine mammal strandings and seabird die-offs from California to Alaska, and it is expected that the effects will generate numerous scientific papers over the next few years. Lower trophic level data shown here for 2014 appear to be a transition from the cool period to warm conditions and in 2015 anomalously low diatoms and a small mean copepod size were evident in both regions, which are likely to have impacted higher trophic levels.
14g l o b a l / s t a t u s Sir Alister Hardy Foundation for Ocean Science
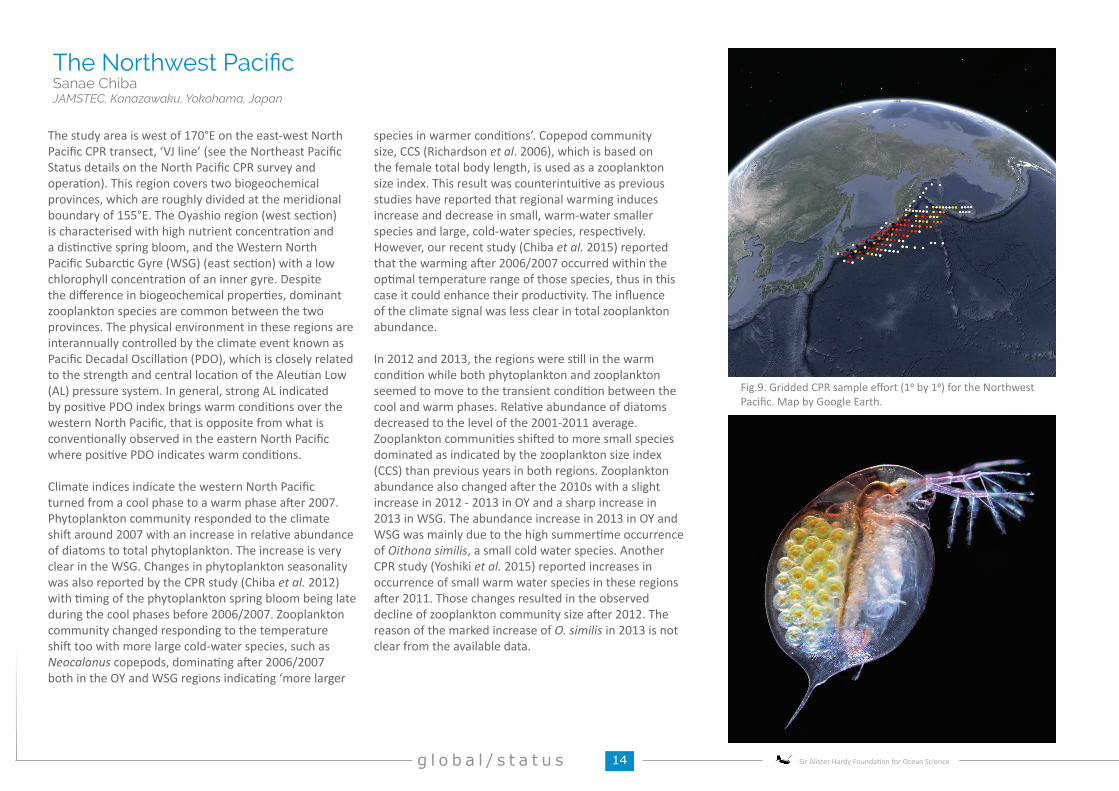
The Northwest PacificSanae ChibaJAMSTEC, Kanazawaku, Yokohama, Japan
Fig.9. Gridded CPR sample effort (10 by 10) for the Northwest Pacific. Map by Google Earth.
The study area is west of 170°E on the east-west North Pacific CPR transect, ‘VJ line’ (see the Northeast Pacific Status details on the North Pacific CPR survey and operation). This region covers two biogeochemical provinces, which are roughly divided at the meridional boundary of 155°E. The Oyashio region (west section) is characterised with high nutrient concentration and a distinctive spring bloom, and the Western North Pacific Subarctic Gyre (WSG) (east section) with a low chlorophyll concentration of an inner gyre. Despite the difference in biogeochemical properties, dominant zooplankton species are common between the two provinces. The physical environment in these regions are interannually controlled by the climate event known as Pacific Decadal Oscillation (PDO), which is closely related to the strength and central location of the Aleutian Low (AL) pressure system. In general, strong AL indicated by positive PDO index brings warm conditions over the western North Pacific, that is opposite from what is conventionally observed in the eastern North Pacific where positive PDO indicates warm conditions.
Climate indices indicate the western North Pacific turned from a cool phase to a warm phase after 2007. Phytoplankton community responded to the climate shift around 2007 with an increase in relative abundance of diatoms to total phytoplankton. The increase is very clear in the WSG. Changes in phytoplankton seasonality was also reported by the CPR study (Chiba et al. 2012) with timing of the phytoplankton spring bloom being late during the cool phases before 2006/2007. Zooplankton community changed responding to the temperature shift too with more large cold-water species, such as Neocalanus copepods, dominating after 2006/2007 both in the OY and WSG regions indicating ‘more larger
species in warmer conditions’. Copepod community size, CCS (Richardson et al. 2006), which is based on the female total body length, is used as a zooplankton size index. This result was counterintuitive as previous studies have reported that regional warming induces increase and decrease in small, warm-water smaller species and large, cold-water species, respectively. However, our recent study (Chiba et al. 2015) reported that the warming after 2006/2007 occurred within the optimal temperature range of those species, thus in this case it could enhance their productivity. The influence of the climate signal was less clear in total zooplankton abundance.
In 2012 and 2013, the regions were still in the warm condition while both phytoplankton and zooplankton seemed to move to the transient condition between the cool and warm phases. Relative abundance of diatoms decreased to the level of the 2001-2011 average. Zooplankton communities shifted to more small species dominated as indicated by the zooplankton size index (CCS) than previous years in both regions. Zooplankton abundance also changed after the 2010s with a slight increase in 2012 - 2013 in OY and a sharp increase in 2013 in WSG. The abundance increase in 2013 in OY and WSG was mainly due to the high summertime occurrence of Oithona similis, a small cold water species. Another CPR study (Yoshiki et al. 2015) reported increases in occurrence of small warm water species in these regions after 2011. Those changes resulted in the observed decline of zooplankton community size after 2012. The reason of the marked increase of O. similis in 2013 is not clear from the available data.
15G A C S / s t a t u s
The Benguela Current upwelling ecosystemHans M. Verheye and Richard R. HoraebOceans & Coastal Research, DEA, South Africa and the National Marine Information & Research Centre, MFMR, Namibia
2
3
4
5
6
7
8
1950 1960 1970 1980 1990 2000 2010
COPE
POD
ABUN
DANC
E [L
og10
(No.-2
+ 1)
]
Sample values (autumn)
Annual Means
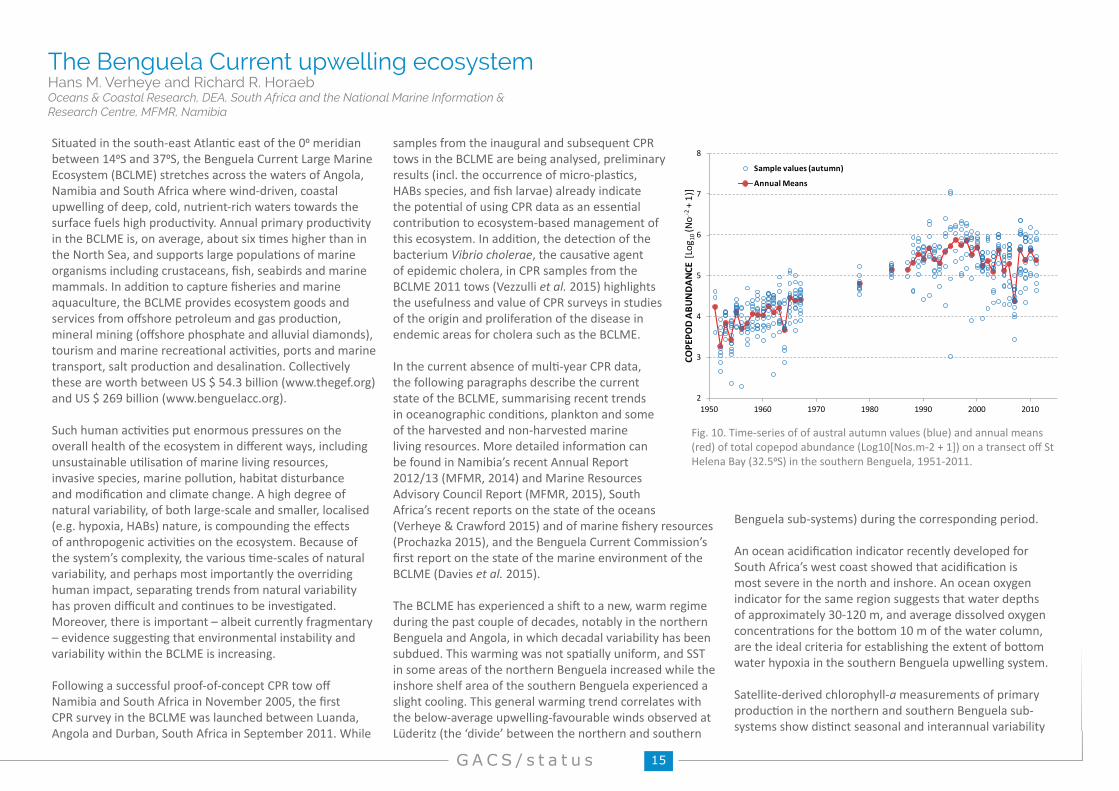
Fig. 10. Time-series of of austral autumn values (blue) and annual means (red) of total copepod abundance (Log10[Nos.m-2 + 1]) on a transect off St Helena Bay (32.50S) in the southern Benguela, 1951-2011.
Situated in the south-east Atlantic east of the 00 meridian between 140S and 370S, the Benguela Current Large Marine Ecosystem (BCLME) stretches across the waters of Angola, Namibia and South Africa where wind-driven, coastal upwelling of deep, cold, nutrient-rich waters towards the surface fuels high productivity. Annual primary productivity in the BCLME is, on average, about six times higher than in the North Sea, and supports large populations of marine organisms including crustaceans, fish, seabirds and marine mammals. In addition to capture fisheries and marine aquaculture, the BCLME provides ecosystem goods and services from offshore petroleum and gas production, mineral mining (offshore phosphate and alluvial diamonds), tourism and marine recreational activities, ports and marine transport, salt production and desalination. Collectively these are worth between US $ 54.3 billion (www.thegef.org) and US $ 269 billion (www.benguelacc.org).
Such human activities put enormous pressures on the overall health of the ecosystem in different ways, including unsustainable utilisation of marine living resources, invasive species, marine pollution, habitat disturbance and modification and climate change. A high degree of natural variability, of both large-scale and smaller, localised (e.g. hypoxia, HABs) nature, is compounding the effects of anthropogenic activities on the ecosystem. Because of the system’s complexity, the various time-scales of natural variability, and perhaps most importantly the overriding human impact, separating trends from natural variability has proven difficult and continues to be investigated. Moreover, there is important – albeit currently fragmentary – evidence suggesting that environmental instability and variability within the BCLME is increasing.
Following a successful proof-of-concept CPR tow off Namibia and South Africa in November 2005, the first CPR survey in the BCLME was launched between Luanda, Angola and Durban, South Africa in September 2011. While
samples from the inaugural and subsequent CPR tows in the BCLME are being analysed, preliminary results (incl. the occurrence of micro-plastics, HABs species, and fish larvae) already indicate the potential of using CPR data as an essential contribution to ecosystem-based management of this ecosystem. In addition, the detection of the bacterium Vibrio cholerae, the causative agent of epidemic cholera, in CPR samples from the BCLME 2011 tows (Vezzulli et al. 2015) highlights the usefulness and value of CPR surveys in studies of the origin and proliferation of the disease in endemic areas for cholera such as the BCLME.
In the current absence of multi-year CPR data, the following paragraphs describe the current state of the BCLME, summarising recent trends in oceanographic conditions, plankton and some of the harvested and non-harvested marine living resources. More detailed information can be found in Namibia’s recent Annual Report 2012/13 (MFMR, 2014) and Marine Resources Advisory Council Report (MFMR, 2015), South Africa’s recent reports on the state of the oceans (Verheye & Crawford 2015) and of marine fishery resources (Prochazka 2015), and the Benguela Current Commission’s first report on the state of the marine environment of the BCLME (Davies et al. 2015).
The BCLME has experienced a shift to a new, warm regime during the past couple of decades, notably in the northern Benguela and Angola, in which decadal variability has been subdued. This warming was not spatially uniform, and SST in some areas of the northern Benguela increased while the inshore shelf area of the southern Benguela experienced a slight cooling. This general warming trend correlates with the below-average upwelling-favourable winds observed at Lüderitz (the ‘divide’ between the northern and southern
Benguela sub-systems) during the corresponding period.
An ocean acidification indicator recently developed for South Africa’s west coast showed that acidification is most severe in the north and inshore. An ocean oxygen indicator for the same region suggests that water depths of approximately 30-120 m, and average dissolved oxygen concentrations for the bottom 10 m of the water column, are the ideal criteria for establishing the extent of bottom water hypoxia in the southern Benguela upwelling system.
Satellite-derived chlorophyll-a measurements of primary production in the northern and southern Benguela sub-systems show distinct seasonal and interannual variability
16g l o b a l / s t a t u s Sir Alister Hardy Foundation for Ocean Science
but no long-term trend or the expected ecosystem-wide increase/decrease in production in response to projected increases/decreases in upwelling (Verheye et al. 2015). There have, however, been long-term increases in biomass of zooplankton, specifically copepods as well as shifts in their community structure in both the northern and southern Benguela. This may be due to changes in predation pressure particularly with the collapse of the small pelagic fish stocks in the northern Benguela and recent stock increases in the south or large-scale environmental effects, or both (Verheye et al. 2015).
Circumstantial evidence of an increase in the abundance of jellyfish in the northern Benguela may be the result of a collapse of the small pelagic fish stocks, which has favoured horse mackerel, pelagic gobies and jellyfish. As the latter feed on eggs and larvae of pelagic fish species, this may further decrease the likelihood of recovery of species such as sardine, however, the long-term increasing abundance of copepods, also a major food source for jellyfish, suggests that these processes may be more complex.
A number of ecological regime shifts have had severe consequences to the species composition of the system. The northern Benguela was dominated by sardine during the 1950s-1970s but shifted to a horse-mackerel/pelagic gobies/jellyfish-dominated system, likely as a result of several decades of intense fishing pressure as well as the 1984 and 1995 Benguela Niño events (the Atlantic equivalent of the Pacific El Niño). Two regime shifts have taken place in the southern Benguela. The first followed the sardine collapse during the early/mid 1960s, (induced by fishing) while the second, during the mid-1990s to early 2000s, was likely induced by environmental changes but exacerbated by fishing.
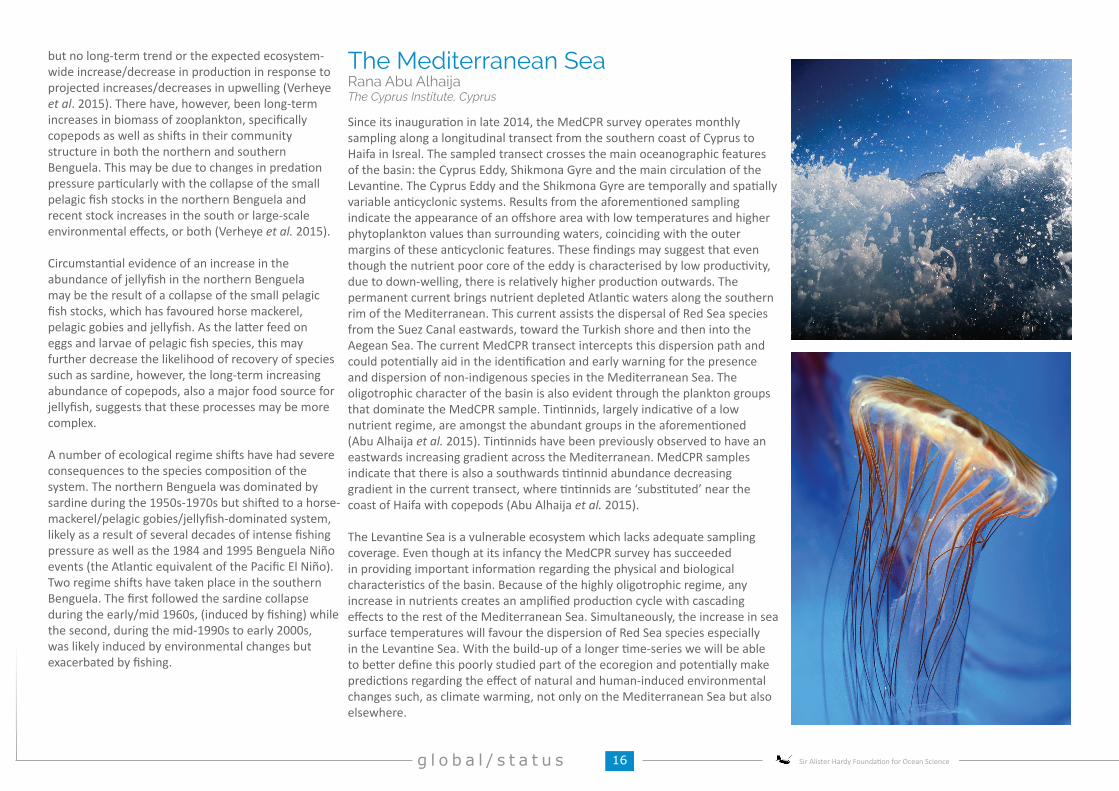
The Mediterranean Sea Rana Abu AlhaijaThe Cyprus Institute, Cyprus
Since its inauguration in late 2014, the MedCPR survey operates monthly sampling along a longitudinal transect from the southern coast of Cyprus to Haifa in Isreal. The sampled transect crosses the main oceanographic features of the basin: the Cyprus Eddy, Shikmona Gyre and the main circulation of the Levantine. The Cyprus Eddy and the Shikmona Gyre are temporally and spatially variable anticyclonic systems. Results from the aforementioned sampling indicate the appearance of an offshore area with low temperatures and higher phytoplankton values than surrounding waters, coinciding with the outer margins of these anticyclonic features. These findings may suggest that even though the nutrient poor core of the eddy is characterised by low productivity, due to down-welling, there is relatively higher production outwards. The permanent current brings nutrient depleted Atlantic waters along the southern rim of the Mediterranean. This current assists the dispersal of Red Sea species from the Suez Canal eastwards, toward the Turkish shore and then into the Aegean Sea. The current MedCPR transect intercepts this dispersion path and could potentially aid in the identification and early warning for the presence and dispersion of non-indigenous species in the Mediterranean Sea. The oligotrophic character of the basin is also evident through the plankton groups that dominate the MedCPR sample. Tintinnids, largely indicative of a low nutrient regime, are amongst the abundant groups in the aforementioned (Abu Alhaija et al. 2015). Tintinnids have been previously observed to have an eastwards increasing gradient across the Mediterranean. MedCPR samples indicate that there is also a southwards tintinnid abundance decreasing gradient in the current transect, where tintinnids are ‘substituted’ near the coast of Haifa with copepods (Abu Alhaija et al. 2015).
The Levantine Sea is a vulnerable ecosystem which lacks adequate sampling coverage. Even though at its infancy the MedCPR survey has succeeded in providing important information regarding the physical and biological characteristics of the basin. Because of the highly oligotrophic regime, any increase in nutrients creates an amplified production cycle with cascading effects to the rest of the Mediterranean Sea. Simultaneously, the increase in sea surface temperatures will favour the dispersion of Red Sea species especially in the Levantine Sea. With the build-up of a longer time-series we will be able to better define this poorly studied part of the ecoregion and potentially make predictions regarding the effect of natural and human-induced environmental changes such, as climate warming, not only on the Mediterranean Sea but also elsewhere.
17G A C S / s t a t u s
The Australian Continuous Plankton Recorder Survey (AusCPR) Anthony J. Richardson and Wayne RochesterUniversity of Queensland and CSIRO Oceans and Atmosphere
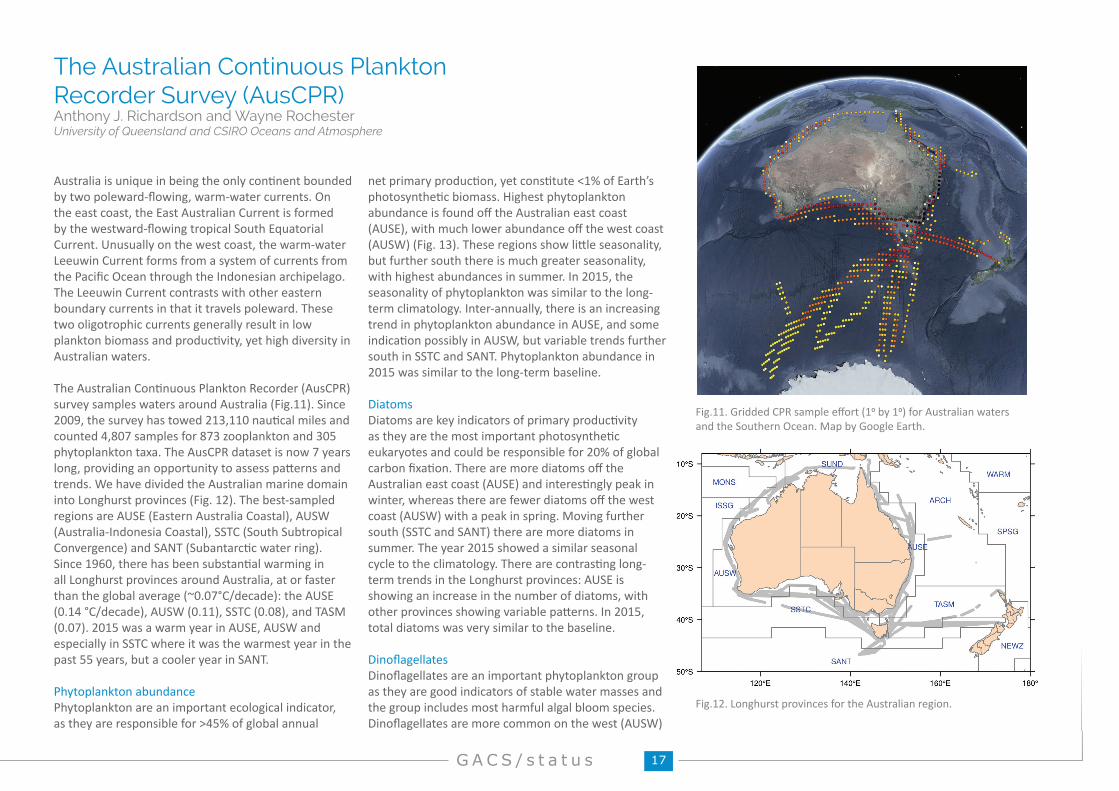
Fig.11. Gridded CPR sample effort (10 by 10) for Australian waters and the Southern Ocean. Map by Google Earth.
Fig.12. Longhurst provinces for the Australian region.
Australia is unique in being the only continent bounded by two poleward-flowing, warm-water currents. On the east coast, the East Australian Current is formed by the westward-flowing tropical South Equatorial Current. Unusually on the west coast, the warm-water Leeuwin Current forms from a system of currents from the Pacific Ocean through the Indonesian archipelago. The Leeuwin Current contrasts with other eastern boundary currents in that it travels poleward. These two oligotrophic currents generally result in low plankton biomass and productivity, yet high diversity in Australian waters.
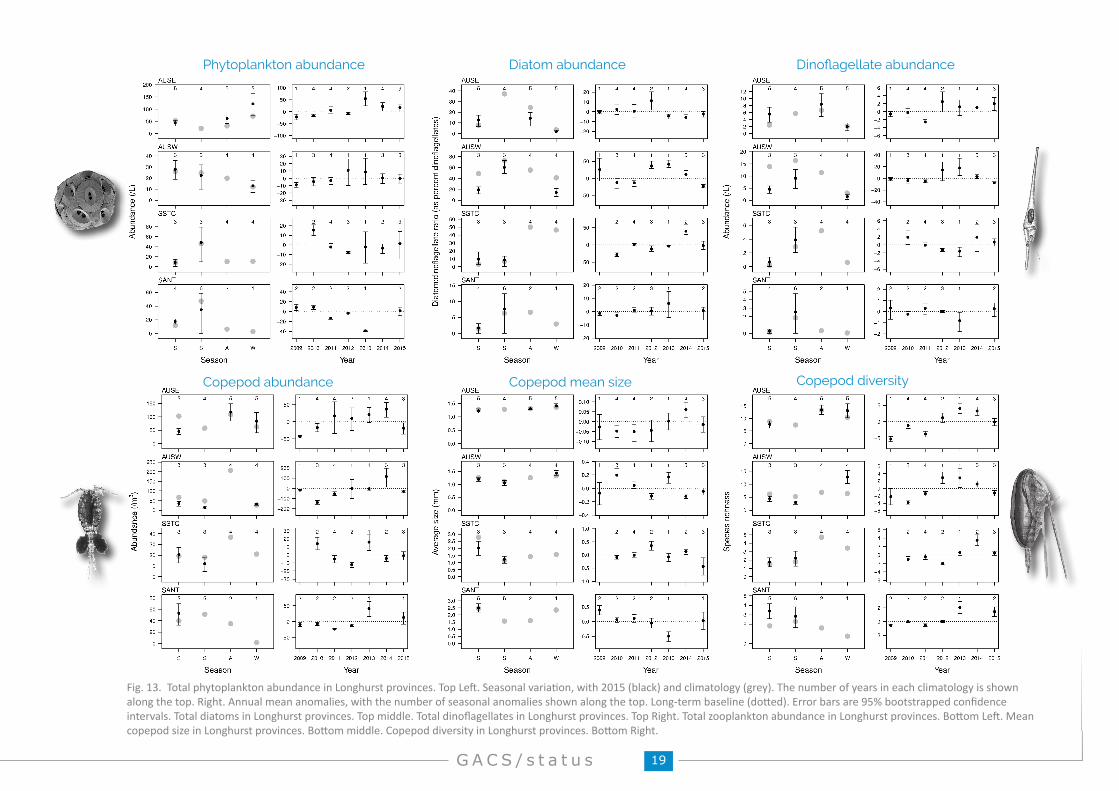
The Australian Continuous Plankton Recorder (AusCPR) survey samples waters around Australia (Fig.11). Since 2009, the survey has towed 213,110 nautical miles and counted 4,807 samples for 873 zooplankton and 305 phytoplankton taxa. The AusCPR dataset is now 7 years long, providing an opportunity to assess patterns and trends. We have divided the Australian marine domain into Longhurst provinces (Fig. 12). The best-sampled regions are AUSE (Eastern Australia Coastal), AUSW (Australia-Indonesia Coastal), SSTC (South Subtropical Convergence) and SANT (Subantarctic water ring). Since 1960, there has been substantial warming in all Longhurst provinces around Australia, at or faster than the global average (~0.07°C/decade): the AUSE (0.14 °C/decade), AUSW (0.11), SSTC (0.08), and TASM (0.07). 2015 was a warm year in AUSE, AUSW and especially in SSTC where it was the warmest year in the past 55 years, but a cooler year in SANT.
Phytoplankton abundancePhytoplankton are an important ecological indicator, as they are responsible for >45% of global annual
net primary production, yet constitute <1% of Earth’s photosynthetic biomass. Highest phytoplankton abundance is found off the Australian east coast (AUSE), with much lower abundance off the west coast (AUSW) (Fig. 13). These regions show little seasonality, but further south there is much greater seasonality, with highest abundances in summer. In 2015, the seasonality of phytoplankton was similar to the long-term climatology. Inter-annually, there is an increasing trend in phytoplankton abundance in AUSE, and some indication possibly in AUSW, but variable trends further south in SSTC and SANT. Phytoplankton abundance in 2015 was similar to the long-term baseline.
DiatomsDiatoms are key indicators of primary productivity as they are the most important photosynthetic eukaryotes and could be responsible for 20% of global carbon fixation. There are more diatoms off the Australian east coast (AUSE) and interestingly peak in winter, whereas there are fewer diatoms off the west coast (AUSW) with a peak in spring. Moving further south (SSTC and SANT) there are more diatoms in summer. The year 2015 showed a similar seasonal cycle to the climatology. There are contrasting long-term trends in the Longhurst provinces: AUSE is showing an increase in the number of diatoms, with other provinces showing variable patterns. In 2015, total diatoms was very similar to the baseline.
DinoflagellatesDinoflagellates are an important phytoplankton group as they are good indicators of stable water masses and the group includes most harmful algal bloom species. Dinoflagellates are more common on the west (AUSW)
18g l o b a l / s t a t u s Sir Alister Hardy Foundation for Ocean Science
where they peak in spring and summer, than on the east (AUSE) coast where they peak in summer and autumn (Fig. 13). Dinoflagellates become even less important further south (SSTC and SANT). In 2015, the seasonal cycle was typical in most regions, although there were significantly fewer diatoms in AUSW in spring and summer. There are no clear long-term trends in total dinoflagellates in Longhurst provinces around Australia. In 2015, the total dinoflagellates was significantly higher than the long-term baseline in AUSE, and significantly lower in AUSW, but similar to the baseline further south (SSTC and SANT).
Zooplankton abundanceZooplankton abundance is an index of secondary productivity and thus provides an estimate of the food available to fish. Potentially contrary to expectation, zooplankton abundance is greater in northern oligotrophic waters and on the west (AUSW) than east coast (AUSE) of Australia and declines further south (SSTC and SANT). Zooplankton abundance is greatest in autumn around Australia (AUSE, AUSW and SSTC), and summer further south (SANT). In 2015, the seasonal cycle of total zooplankton abundance was typical in most regions.
The long-term trend in zooplankton abundance shows a general increase around Australia (AUSE and AUSW) and a more mixed signal further south (SSTC and SANT). In 2015, zooplankton abundance was generally similar to the long-term baseline.
Copepod sizeMean copepod size is a measure of how good the food environment is for fish, as larger copepods provide more energy and are indicative of short food webs. There are large differences in copepod sizes among Longhurst provinces. The warmer AUSE and AUSW regions have much smaller copepods (<1.5 mm) on average than the colder SSTC and SANT regions (>2 mm in size). The annual cycle of mean copepod size in 2015 was similar to the climatology. There is some indication of a long-term increase in copepod size in AUSE, but the trend is variable in other regions. The size of copepods in 2015 is at or below the long-term baseline. Interestingly, the regions with smaller copepods have on average higher abundance, and those with larger copepods have lower copepod abundance.
Copepod diversityCopepod diversity (here measured by species richness) is a biodiversity indicator sensitive to warming. There is higher copepod diversity off the east (AUSE) than off the west coast (AUSW), and much lower diversity the further you move south (from SSTC to SANT). Copepod diversity peaks in autumn and winter off Australia’s east (AUSE), west (AUSW) and south (SSTC) coasts, whereas further south diversity peaks in spring and summer (SANT). In 2015, the seasonal cycles was similar to the climatology, although there were higher-than-normal values in winter in AUSW. There is some indication of increasing trends in copepod diversity in all 4 Longhurst provinces, consistent with warming water temperatures. In 2015, copepod diversity was slightly below the long-term baseline in AUSW, higher in SSTC and SANT, and similar to the baseline in AUSE.
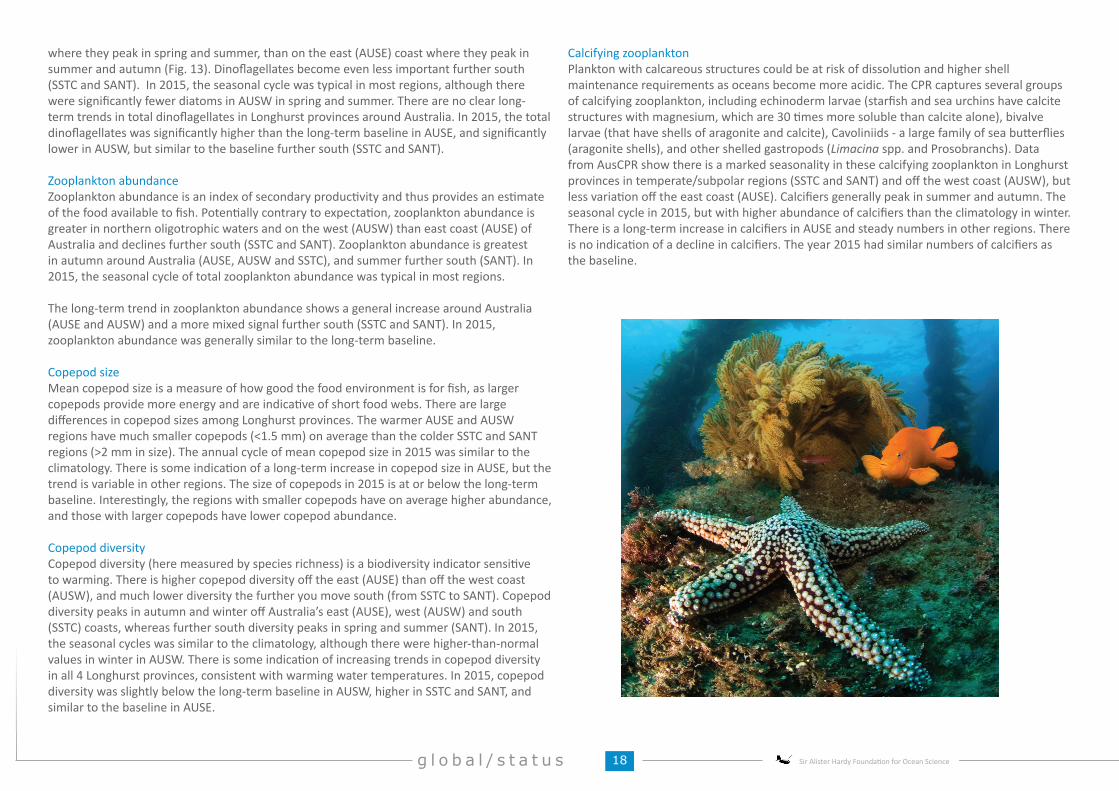
Calcifying zooplanktonPlankton with calcareous structures could be at risk of dissolution and higher shell maintenance requirements as oceans become more acidic. The CPR captures several groups of calcifying zooplankton, including echinoderm larvae (starfish and sea urchins have calcite structures with magnesium, which are 30 times more soluble than calcite alone), bivalve larvae (that have shells of aragonite and calcite), Cavoliniids - a large family of sea butterflies (aragonite shells), and other shelled gastropods (Limacina spp. and Prosobranchs). Data from AusCPR show there is a marked seasonality in these calcifying zooplankton in Longhurst provinces in temperate/subpolar regions (SSTC and SANT) and off the west coast (AUSW), but less variation off the east coast (AUSE). Calcifiers generally peak in summer and autumn. The seasonal cycle in 2015, but with higher abundance of calcifiers than the climatology in winter. There is a long-term increase in calcifiers in AUSE and steady numbers in other regions. There is no indication of a decline in calcifiers. The year 2015 had similar numbers of calcifiers as the baseline.
19G A C S / s t a t u s
Fig. 13. Total phytoplankton abundance in Longhurst provinces. Top Left. Seasonal variation, with 2015 (black) and climatology (grey). The number of years in each climatology is shown along the top. Right. Annual mean anomalies, with the number of seasonal anomalies shown along the top. Long-term baseline (dotted). Error bars are 95% bootstrapped confidence intervals. Total diatoms in Longhurst provinces. Top middle. Total dinoflagellates in Longhurst provinces. Top Right. Total zooplankton abundance in Longhurst provinces. Bottom Left. Mean copepod size in Longhurst provinces. Bottom middle. Copepod diversity in Longhurst provinces. Bottom Right.
Copepod abundance Copepod mean size Copepod diversity
Dinoflagellate abundanceDiatom abundancePhytoplankton abundance
20g l o b a l / s t a t u s Sir Alister Hardy Foundation for Ocean Science
Providing European plankton indicators
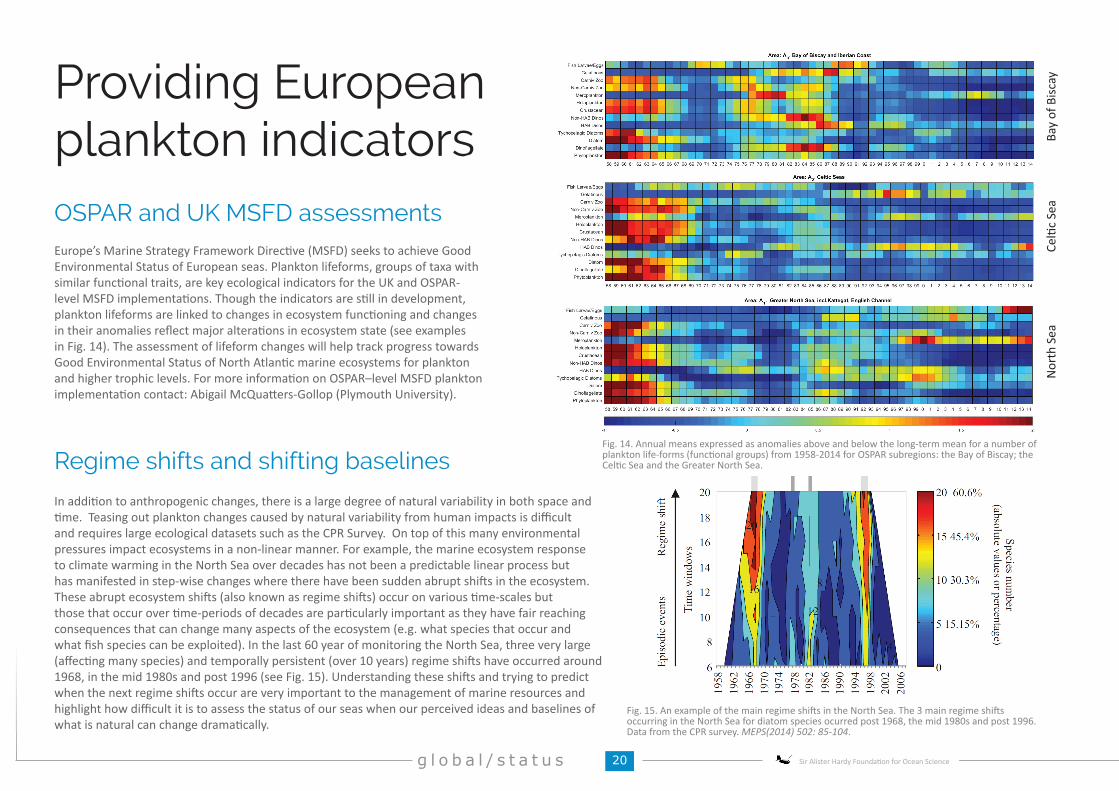
Fig. 15. An example of the main regime shifts in the North Sea. The 3 main regime shifts occurring in the North Sea for diatom species ocurred post 1968, the mid 1980s and post 1996.Data from the CPR survey. MEPS(2014) 502: 85-104.
OSPAR and UK MSFD assessments
Bay
of B
iscay
Nor
th S
eaCe
ltic
Sea
Regime shifts and shifting baselinesFig. 14. Annual means expressed as anomalies above and below the long-term mean for a number of plankton life-forms (functional groups) from 1958-2014 for OSPAR subregions: the Bay of Biscay; the Celtic Sea and the Greater North Sea.
In addition to anthropogenic changes, there is a large degree of natural variability in both space and time. Teasing out plankton changes caused by natural variability from human impacts is difficult and requires large ecological datasets such as the CPR Survey. On top of this many environmental pressures impact ecosystems in a non-linear manner. For example, the marine ecosystem response to climate warming in the North Sea over decades has not been a predictable linear process but has manifested in step-wise changes where there have been sudden abrupt shifts in the ecosystem. These abrupt ecosystem shifts (also known as regime shifts) occur on various time-scales but those that occur over time-periods of decades are particularly important as they have fair reaching consequences that can change many aspects of the ecosystem (e.g. what species that occur and what fish species can be exploited). In the last 60 year of monitoring the North Sea, three very large (affecting many species) and temporally persistent (over 10 years) regime shifts have occurred around 1968, in the mid 1980s and post 1996 (see Fig. 15). Understanding these shifts and trying to predict when the next regime shifts occur are very important to the management of marine resources and highlight how difficult it is to assess the status of our seas when our perceived ideas and baselines of what is natural can change dramatically.
Europe’s Marine Strategy Framework Directive (MSFD) seeks to achieve Good Environmental Status of European seas. Plankton lifeforms, groups of taxa with similar functional traits, are key ecological indicators for the UK and OSPAR-level MSFD implementations. Though the indicators are still in development, plankton lifeforms are linked to changes in ecosystem functioning and changes in their anomalies reflect major alterations in ecosystem state (see examples in Fig. 14). The assessment of lifeform changes will help track progress towards Good Environmental Status of North Atlantic marine ecosystems for plankton and higher trophic levels. For more information on OSPAR–level MSFD plankton implementation contact: Abigail McQuatters-Gollop (Plymouth University).
21G A C S / s t a t u s
Applied ecological indicators
Climate change
Biodiversity
Ecosystem health
Ocean acidification
22g l o b a l / s t a t u s Sir Alister Hardy Foundation for Ocean Science
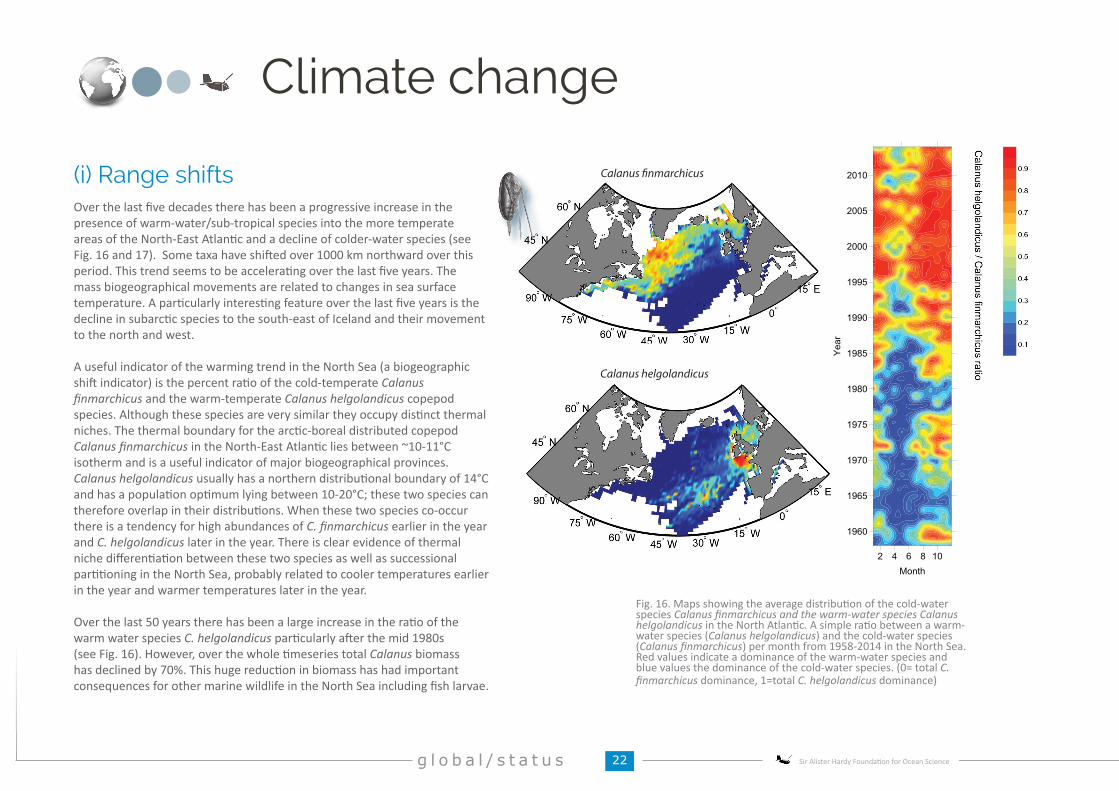
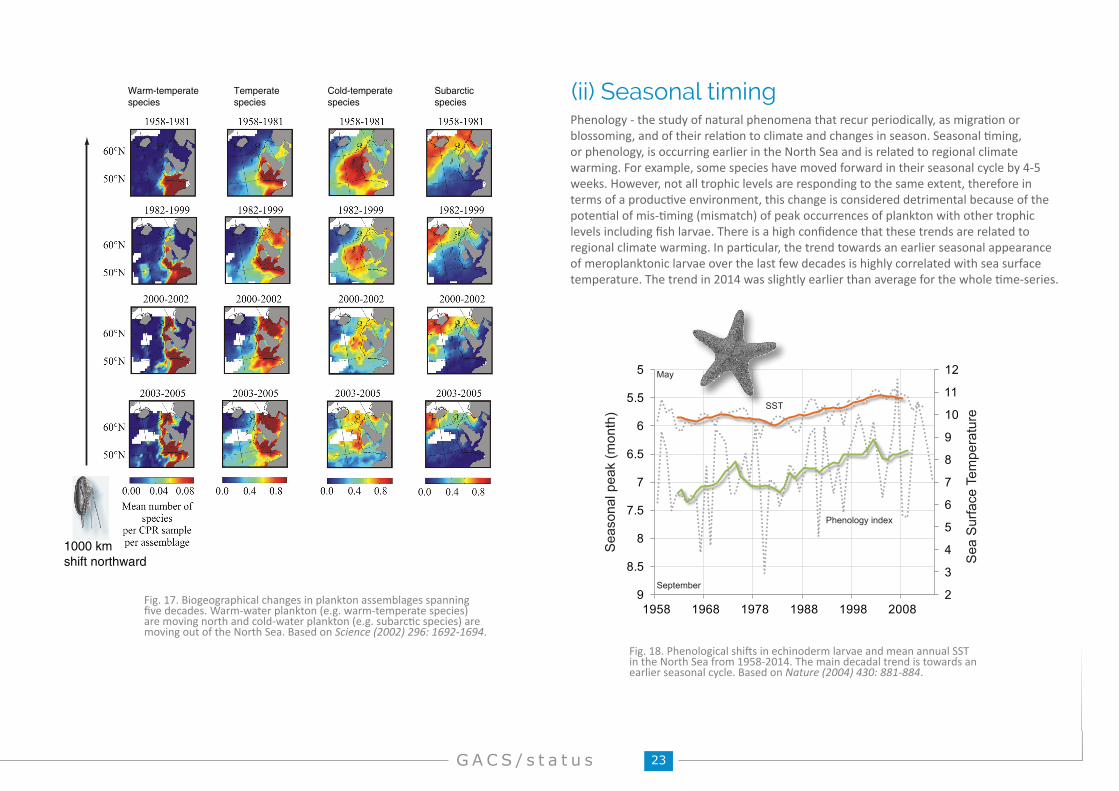
Over the last five decades there has been a progressive increase in the presence of warm-water/sub-tropical species into the more temperate areas of the North-East Atlantic and a decline of colder-water species (see Fig. 16 and 17). Some taxa have shifted over 1000 km northward over this period. This trend seems to be accelerating over the last five years. The mass biogeographical movements are related to changes in sea surface temperature. A particularly interesting feature over the last five years is the decline in subarctic species to the south-east of Iceland and their movement to the north and west.
A useful indicator of the warming trend in the North Sea (a biogeographic shift indicator) is the percent ratio of the cold-temperate Calanus finmarchicus and the warm-temperate Calanus helgolandicus copepod species. Although these species are very similar they occupy distinct thermal niches. The thermal boundary for the arctic-boreal distributed copepod Calanus finmarchicus in the North-East Atlantic lies between ~10-11°C isotherm and is a useful indicator of major biogeographical provinces. Calanus helgolandicus usually has a northern distributional boundary of 14°C and has a population optimum lying between 10-20°C; these two species can therefore overlap in their distributions. When these two species co-occur there is a tendency for high abundances of C. finmarchicus earlier in the year and C. helgolandicus later in the year. There is clear evidence of thermal niche differentiation between these two species as well as successional partitioning in the North Sea, probably related to cooler temperatures earlier in the year and warmer temperatures later in the year.
Over the last 50 years there has been a large increase in the ratio of the warm water species C. helgolandicus particularly after the mid 1980s (see Fig. 16). However, over the whole timeseries total Calanus biomass has declined by 70%. This huge reduction in biomass has had important consequences for other marine wildlife in the North Sea including fish larvae.
(i) Range shifts
Fig. 16. Maps showing the average distribution of the cold-water species Calanus finmarchicus and the warm-water species Calanus helgolandicus in the North Atlantic. A simple ratio between a warm-water species (Calanus helgolandicus) and the cold-water species (Calanus finmarchicus) per month from 1958-2014 in the North Sea. Red values indicate a dominance of the warm-water species and blue values the dominance of the cold-water species. (0= total C. finmarchicus dominance, 1=total C. helgolandicus dominance)
Calanus finmarchicus
Calanus helgolandicus
Climate change
2 4 6 8 10Month
1960
1965
1970
1975
1980
1985
1990
1995
2000
2005
2010
Yea
r
23G A C S / s t a t u s
Fig. 17. Biogeographical changes in plankton assemblages spanning five decades. Warm-water plankton (e.g. warm-temperate species) are moving north and cold-water plankton (e.g. subarctic species) are moving out of the North Sea. Based on Science (2002) 296: 1692-1694.
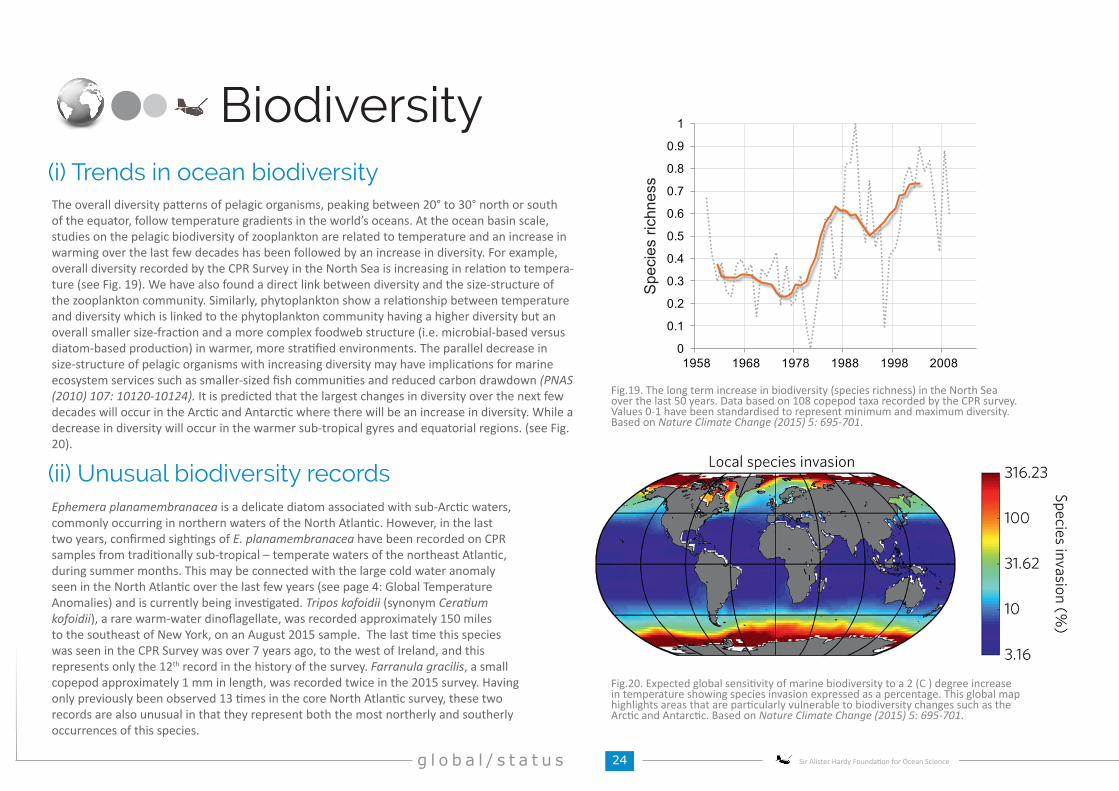
Phenology - the study of natural phenomena that recur periodically, as migration or blossoming, and of their relation to climate and changes in season. Seasonal timing, or phenology, is occurring earlier in the North Sea and is related to regional climate warming. For example, some species have moved forward in their seasonal cycle by 4-5 weeks. However, not all trophic levels are responding to the same extent, therefore in terms of a productive environment, this change is considered detrimental because of the potential of mis-timing (mismatch) of peak occurrences of plankton with other trophic levels including fish larvae. There is a high confidence that these trends are related to regional climate warming. In particular, the trend towards an earlier seasonal appearance of meroplanktonic larvae over the last few decades is highly correlated with sea surface temperature. The trend in 2014 was slightly earlier than average for the whole time-series.
(ii) Seasonal timing
1000 kmshift northward
Warm-temperate species
Temperatespecies
Cold-temperatespecies
Subarcticspecies
a. Biogeographical
2
3
4
5
6
7
8
9
10
11
125
5.5
6
6.5
7
7.5
8
8.5
91958 1968 1978 1988 1998 2008
Years
Sea
Sur
face
Tem
pera
ture
Sea
sona
l pea
k (m
onth
)
Phenology index
SST
May
September
Fig. 18. Phenological shifts in echinoderm larvae and mean annual SST in the North Sea from 1958-2014. The main decadal trend is towards an earlier seasonal cycle. Based on Nature (2004) 430: 881-884.
24g l o b a l / s t a t u s Sir Alister Hardy Foundation for Ocean Science
Biodiversity
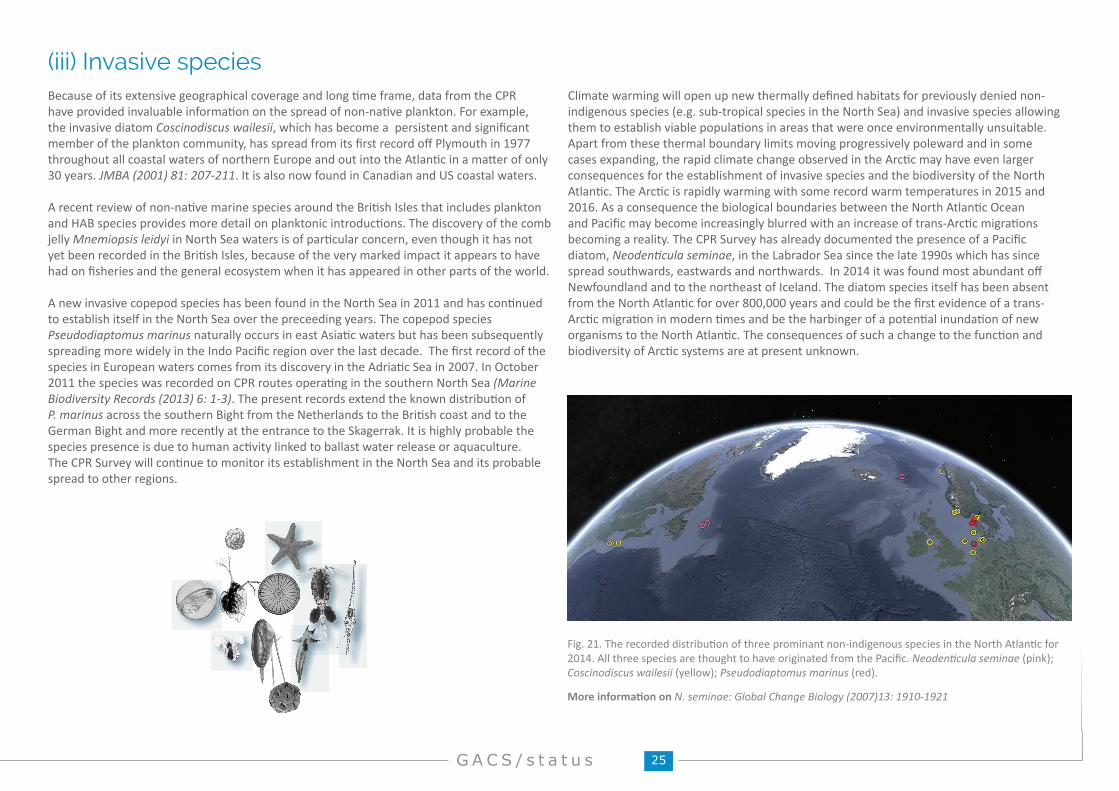
The overall diversity patterns of pelagic organisms, peaking between 20° to 30° north or south of the equator, follow temperature gradients in the world’s oceans. At the ocean basin scale, studies on the pelagic biodiversity of zooplankton are related to temperature and an increase in warming over the last few decades has been followed by an increase in diversity. For example, overall diversity recorded by the CPR Survey in the North Sea is increasing in relation to tempera-ture (see Fig. 19). We have also found a direct link between diversity and the size-structure of the zooplankton community. Similarly, phytoplankton show a relationship between temperature and diversity which is linked to the phytoplankton community having a higher diversity but an overall smaller size-fraction and a more complex foodweb structure (i.e. microbial-based versus diatom-based production) in warmer, more stratified environments. The parallel decrease in size-structure of pelagic organisms with increasing diversity may have implications for marine ecosystem services such as smaller-sized fish communities and reduced carbon drawdown (PNAS (2010) 107: 10120-10124). It is predicted that the largest changes in diversity over the next few decades will occur in the Arctic and Antarctic where there will be an increase in diversity. While a decrease in diversity will occur in the warmer sub-tropical gyres and equatorial regions. (see Fig. 20).
(i) Trends in ocean biodiversity
Fig.20. Expected global sensitivity of marine biodiversity to a 2 (C ) degree increase in temperature showing species invasion expressed as a percentage. This global map highlights areas that are particularly vulnerable to biodiversity changes such as the Arctic and Antarctic. Based on Nature Climate Change (2015) 5: 695-701.
Ephemera planamembranacea is a delicate diatom associated with sub-Arctic waters, commonly occurring in northern waters of the North Atlantic. However, in the last two years, confirmed sightings of E. planamembranacea have been recorded on CPR samples from traditionally sub-tropical – temperate waters of the northeast Atlantic, during summer months. This may be connected with the large cold water anomaly seen in the North Atlantic over the last few years (see page 4: Global Temperature Anomalies) and is currently being investigated. Tripos kofoidii (synonym Ceratium kofoidii), a rare warm-water dinoflagellate, was recorded approximately 150 miles to the southeast of New York, on an August 2015 sample. The last time this species was seen in the CPR Survey was over 7 years ago, to the west of Ireland, and this represents only the 12th record in the history of the survey. Farranula gracilis, a small copepod approximately 1 mm in length, was recorded twice in the 2015 survey. Having only previously been observed 13 times in the core North Atlantic survey, these two records are also unusual in that they represent both the most northerly and southerly occurrences of this species.
(ii) Unusual biodiversity records
Figure XX: Expected sensitivity of biodiversity to a 2 C increase in temperature. a–c, Net quantitative changes in biodiversity (a), local species extirpation (b) and invasion (c). d, Net qualitative biodiversity changes resulting from the di�erence between species invasion and extirpation. All changes are expressed as a percentage.
Fig.19. The long term increase in biodiversity (species richness) in the North Sea over the last 50 years. Data based on 108 copepod taxa recorded by the CPR survey. Values 0-1 have been standardised to represent minimum and maximum diversity. Based on Nature Climate Change (2015) 5: 695-701.
0
0.1
0.2
0.3
0.4
0.5
0.6
0.7
0.8
0.9
1
1958 1968 1978 1988 1998 2008
Spe
cies
rich
ness
25G A C S / s t a t u s
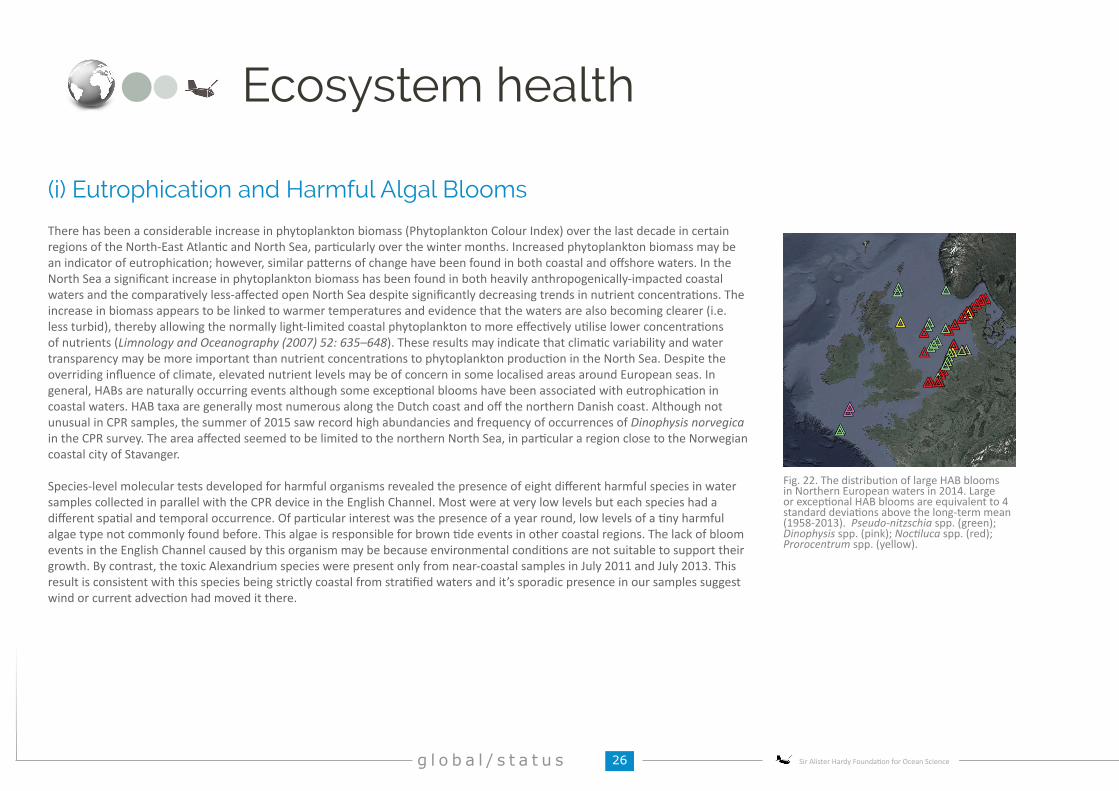
Fig. 21. The recorded distribution of three prominant non-indigenous species in the North Atlantic for 2014. All three species are thought to have originated from the Pacific. Neodenticula seminae (pink); Coscinodiscus wailesii (yellow); Pseudodiaptomus marinus (red).
More information on N. seminae: Global Change Biology (2007)13: 1910-1921
Because of its extensive geographical coverage and long time frame, data from the CPR have provided invaluable information on the spread of non-native plankton. For example, the invasive diatom Coscinodiscus wailesii, which has become a persistent and significant member of the plankton community, has spread from its first record off Plymouth in 1977 throughout all coastal waters of northern Europe and out into the Atlantic in a matter of only 30 years. JMBA (2001) 81: 207-211. It is also now found in Canadian and US coastal waters.
A recent review of non-native marine species around the British Isles that includes plankton and HAB species provides more detail on planktonic introductions. The discovery of the comb jelly Mnemiopsis leidyi in North Sea waters is of particular concern, even though it has not yet been recorded in the British Isles, because of the very marked impact it appears to have had on fisheries and the general ecosystem when it has appeared in other parts of the world.
A new invasive copepod species has been found in the North Sea in 2011 and has continued to establish itself in the North Sea over the preceeding years. The copepod species Pseudodiaptomus marinus naturally occurs in east Asiatic waters but has been subsequently spreading more widely in the Indo Pacific region over the last decade. The first record of the species in European waters comes from its discovery in the Adriatic Sea in 2007. In October 2011 the species was recorded on CPR routes operating in the southern North Sea (Marine Biodiversity Records (2013) 6: 1-3). The present records extend the known distribution of P. marinus across the southern Bight from the Netherlands to the British coast and to the German Bight and more recently at the entrance to the Skagerrak. It is highly probable the species presence is due to human activity linked to ballast water release or aquaculture. The CPR Survey will continue to monitor its establishment in the North Sea and its probable spread to other regions.
Climate warming will open up new thermally defined habitats for previously denied non-indigenous species (e.g. sub-tropical species in the North Sea) and invasive species allowing them to establish viable populations in areas that were once environmentally unsuitable. Apart from these thermal boundary limits moving progressively poleward and in some cases expanding, the rapid climate change observed in the Arctic may have even larger consequences for the establishment of invasive species and the biodiversity of the North Atlantic. The Arctic is rapidly warming with some record warm temperatures in 2015 and 2016. As a consequence the biological boundaries between the North Atlantic Ocean and Pacific may become increasingly blurred with an increase of trans-Arctic migrations becoming a reality. The CPR Survey has already documented the presence of a Pacific diatom, Neodenticula seminae, in the Labrador Sea since the late 1990s which has since spread southwards, eastwards and northwards. In 2014 it was found most abundant off Newfoundland and to the northeast of Iceland. The diatom species itself has been absent from the North Atlantic for over 800,000 years and could be the first evidence of a trans-Arctic migration in modern times and be the harbinger of a potential inundation of new organisms to the North Atlantic. The consequences of such a change to the function and biodiversity of Arctic systems are at present unknown.
(iii) Invasive species
26g l o b a l / s t a t u s Sir Alister Hardy Foundation for Ocean Science
Ecosystem health
There has been a considerable increase in phytoplankton biomass (Phytoplankton Colour Index) over the last decade in certain regions of the North-East Atlantic and North Sea, particularly over the winter months. Increased phytoplankton biomass may be an indicator of eutrophication; however, similar patterns of change have been found in both coastal and offshore waters. In the North Sea a significant increase in phytoplankton biomass has been found in both heavily anthropogenically-impacted coastal waters and the comparatively less-affected open North Sea despite significantly decreasing trends in nutrient concentrations. The increase in biomass appears to be linked to warmer temperatures and evidence that the waters are also becoming clearer (i.e. less turbid), thereby allowing the normally light-limited coastal phytoplankton to more effectively utilise lower concentrations of nutrients (Limnology and Oceanography (2007) 52: 635–648). These results may indicate that climatic variability and water transparency may be more important than nutrient concentrations to phytoplankton production in the North Sea. Despite the overriding influence of climate, elevated nutrient levels may be of concern in some localised areas around European seas. In general, HABs are naturally occurring events although some exceptional blooms have been associated with eutrophication in coastal waters. HAB taxa are generally most numerous along the Dutch coast and off the northern Danish coast. Although not unusual in CPR samples, the summer of 2015 saw record high abundancies and frequency of occurrences of Dinophysis norvegica in the CPR survey. The area affected seemed to be limited to the northern North Sea, in particular a region close to the Norwegian coastal city of Stavanger.
Species-level molecular tests developed for harmful organisms revealed the presence of eight different harmful species in water samples collected in parallel with the CPR device in the English Channel. Most were at very low levels but each species had a different spatial and temporal occurrence. Of particular interest was the presence of a year round, low levels of a tiny harmful algae type not commonly found before. This algae is responsible for brown tide events in other coastal regions. The lack of bloom events in the English Channel caused by this organism may be because environmental conditions are not suitable to support their growth. By contrast, the toxic Alexandrium species were present only from near-coastal samples in July 2011 and July 2013. This result is consistent with this species being strictly coastal from stratified waters and it’s sporadic presence in our samples suggest wind or current advection had moved it there.
(i) Eutrophication and Harmful Algal Blooms
Fig. 22. The distribution of large HAB blooms in Northern European waters in 2014. Large or exceptional HAB blooms are equivalent to 4 standard deviations above the long-term mean (1958-2013). Pseudo-nitzschia spp. (green); Dinophysis spp. (pink); Noctiluca spp. (red); Prorocentrum spp. (yellow).
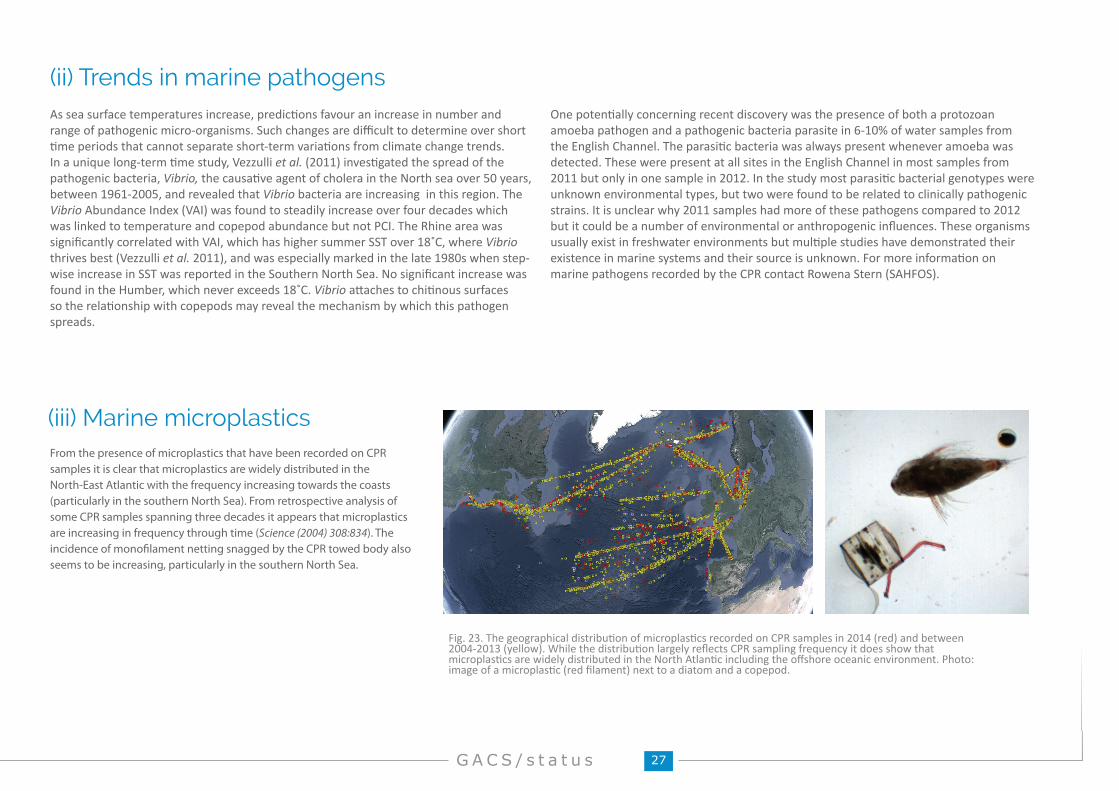
27G A C S / s t a t u s
From the presence of microplastics that have been recorded on CPR samples it is clear that microplastics are widely distributed in the North-East Atlantic with the frequency increasing towards the coasts (particularly in the southern North Sea). From retrospective analysis of some CPR samples spanning three decades it appears that microplastics are increasing in frequency through time (Science (2004) 308:834). The incidence of monofilament netting snagged by the CPR towed body also seems to be increasing, particularly in the southern North Sea.
(iii) Marine microplastics
Fig. 23. The geographical distribution of microplastics recorded on CPR samples in 2014 (red) and between 2004-2013 (yellow). While the distribution largely reflects CPR sampling frequency it does show that microplastics are widely distributed in the North Atlantic including the offshore oceanic environment. Photo: image of a microplastic (red filament) next to a diatom and a copepod.
As sea surface temperatures increase, predictions favour an increase in number and range of pathogenic micro-organisms. Such changes are difficult to determine over short time periods that cannot separate short-term variations from climate change trends. In a unique long-term time study, Vezzulli et al. (2011) investigated the spread of the pathogenic bacteria, Vibrio, the causative agent of cholera in the North sea over 50 years, between 1961-2005, and revealed that Vibrio bacteria are increasing in this region. The Vibrio Abundance Index (VAI) was found to steadily increase over four decades which was linked to temperature and copepod abundance but not PCI. The Rhine area was significantly correlated with VAI, which has higher summer SST over 18˚C, where Vibrio thrives best (Vezzulli et al. 2011), and was especially marked in the late 1980s when step-wise increase in SST was reported in the Southern North Sea. No significant increase was found in the Humber, which never exceeds 18˚C. Vibrio attaches to chitinous surfaces so the relationship with copepods may reveal the mechanism by which this pathogen spreads.
One potentially concerning recent discovery was the presence of both a protozoan amoeba pathogen and a pathogenic bacteria parasite in 6-10% of water samples from the English Channel. The parasitic bacteria was always present whenever amoeba was detected. These were present at all sites in the English Channel in most samples from 2011 but only in one sample in 2012. In the study most parasitic bacterial genotypes were unknown environmental types, but two were found to be related to clinically pathogenic strains. It is unclear why 2011 samples had more of these pathogens compared to 2012 but it could be a number of environmental or anthropogenic influences. These organisms usually exist in freshwater environments but multiple studies have demonstrated their existence in marine systems and their source is unknown. For more information on marine pathogens recorded by the CPR contact Rowena Stern (SAHFOS).
(ii) Trends in marine pathogens
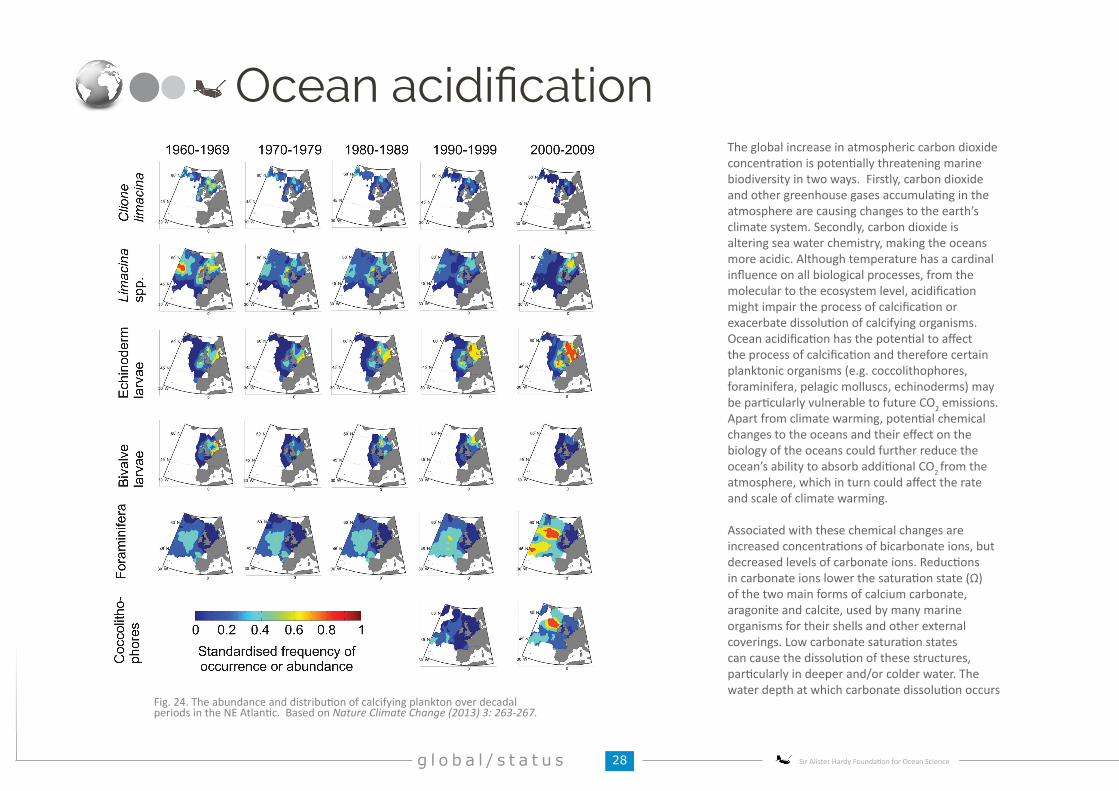
28g l o b a l / s t a t u s Sir Alister Hardy Foundation for Ocean Science
Ocean acidificationThe global increase in atmospheric carbon dioxide concentration is potentially threatening marine biodiversity in two ways. Firstly, carbon dioxide and other greenhouse gases accumulating in the atmosphere are causing changes to the earth’s climate system. Secondly, carbon dioxide is altering sea water chemistry, making the oceans more acidic. Although temperature has a cardinal influence on all biological processes, from the molecular to the ecosystem level, acidification might impair the process of calcification or exacerbate dissolution of calcifying organisms. Ocean acidification has the potential to affect the process of calcification and therefore certain planktonic organisms (e.g. coccolithophores, foraminifera, pelagic molluscs, echinoderms) may be particularly vulnerable to future CO2 emissions. Apart from climate warming, potential chemical changes to the oceans and their effect on the biology of the oceans could further reduce the ocean’s ability to absorb additional CO2 from the atmosphere, which in turn could affect the rate and scale of climate warming.
Associated with these chemical changes are increased concentrations of bicarbonate ions, but decreased levels of carbonate ions. Reductions in carbonate ions lower the saturation state (Ω) of the two main forms of calcium carbonate, aragonite and calcite, used by many marine organisms for their shells and other external coverings. Low carbonate saturation states can cause the dissolution of these structures, particularly in deeper and/or colder water. The water depth at which carbonate dissolution occurs
Fig. 24. The abundance and distribution of calcifying plankton over decadal periods in the NE Atlantic. Based on Nature Climate Change (2013) 3: 263-267.
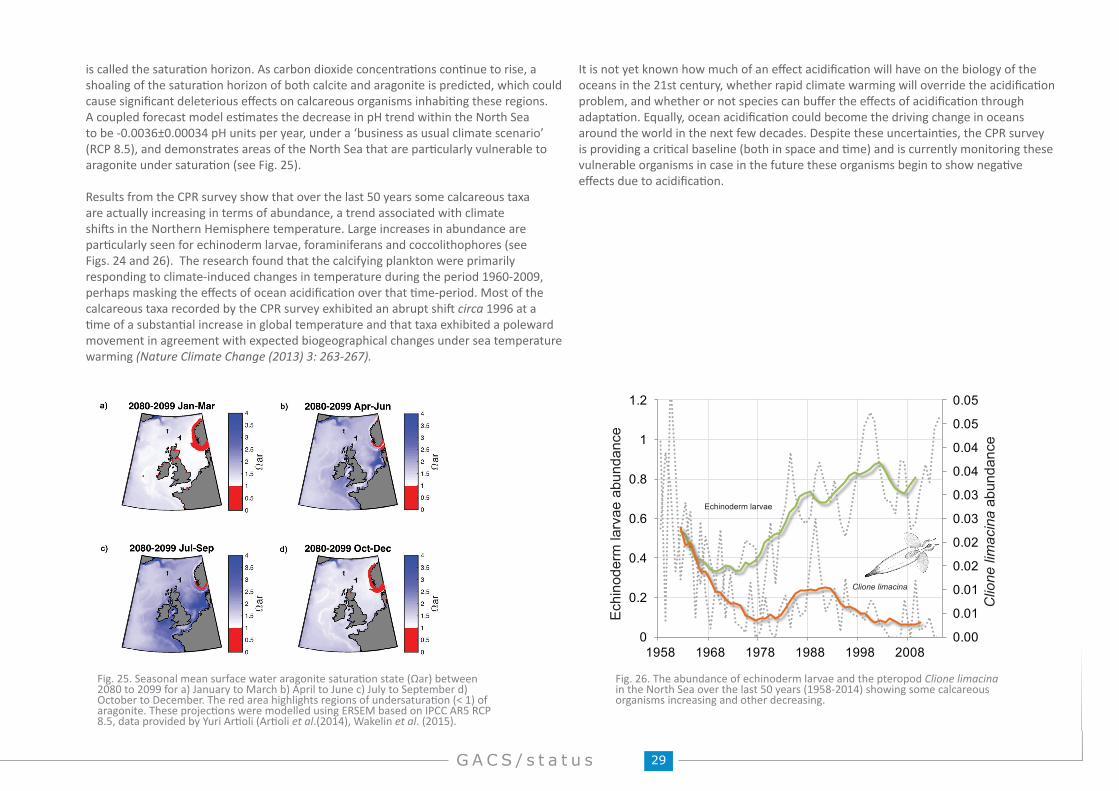
29G A C S / s t a t u s
is called the saturation horizon. As carbon dioxide concentrations continue to rise, a shoaling of the saturation horizon of both calcite and aragonite is predicted, which could cause significant deleterious effects on calcareous organisms inhabiting these regions. A coupled forecast model estimates the decrease in pH trend within the North Sea to be -0.0036±0.00034 pH units per year, under a ‘business as usual climate scenario’ (RCP 8.5), and demonstrates areas of the North Sea that are particularly vulnerable to aragonite under saturation (see Fig. 25).
Results from the CPR survey show that over the last 50 years some calcareous taxa are actually increasing in terms of abundance, a trend associated with climate shifts in the Northern Hemisphere temperature. Large increases in abundance are particularly seen for echinoderm larvae, foraminiferans and coccolithophores (see Figs. 24 and 26). The research found that the calcifying plankton were primarily responding to climate-induced changes in temperature during the period 1960-2009, perhaps masking the effects of ocean acidification over that time-period. Most of the calcareous taxa recorded by the CPR survey exhibited an abrupt shift circa 1996 at a time of a substantial increase in global temperature and that taxa exhibited a poleward movement in agreement with expected biogeographical changes under sea temperature warming (Nature Climate Change (2013) 3: 263-267).
It is not yet known how much of an effect acidification will have on the biology of the oceans in the 21st century, whether rapid climate warming will override the acidification problem, and whether or not species can buffer the effects of acidification through adaptation. Equally, ocean acidification could become the driving change in oceans around the world in the next few decades. Despite these uncertainties, the CPR survey is providing a critical baseline (both in space and time) and is currently monitoring these vulnerable organisms in case in the future these organisms begin to show negative effects due to acidification.
0.00
0.01
0.01
0.02
0.02
0.03
0.03
0.04
0.04
0.05
0.05
0
0.2
0.4
0.6
0.8
1
1.2
1958 1968 1978 1988 1998 2008
Clione limacina
Clio
ne li
mac
ina
abun
danc
e
Ech
inod
erm
larv
ae a
bund
ance
Echinoderm larvae
Fig. 26. The abundance of echinoderm larvae and the pteropod Clione limacina in the North Sea over the last 50 years (1958-2014) showing some calcareous organisms increasing and other decreasing.
Fig. 25. Seasonal mean surface water aragonite saturation state (Ωar) between 2080 to 2099 for a) January to March b) April to June c) July to September d) October to December. The red area highlights regions of undersaturation (< 1) of aragonite. These projections were modelled using ERSEM based on IPCC AR5 RCP 8.5, data provided by Yuri Artioli (Artioli et al.(2014), Wakelin et al. (2015).

30g l o b a l / s t a t u s Sir Alister Hardy Foundation for Ocean Science
Abu Alhaija, R., C. Jimenez, L. Mortier, M. Lange. 2015 Implementation of the Continuous Plankton Recorder (CPR) in the Mediterranean Sea. PERSEUS Project. ISBN no: 978-960-9798-16-7
Artioli, Y., J. C. Blackford, M. Butenschön, J. T. Holt, S. L. Wakelin, H. Thomas, A. V. Borges, and J. I. Allen (2012), The carbonate system in the North Sea: Sensitivity and model validation, Journal of Marine Systems, 102-104, 1–13.
Batten, S.D., Walne, A.W., Edwards, M. & Groom, S. B. (2003) Phytoplankton biomass from Continuous Plankton Recorder data: An assessment of the phytoplankton colour index. Journal of Plankton Research 25, 697-702.
Bond, N. A., M. F. Cronin, H. Freeland, and N. Mantua (2015), Causes and impacts of the 2014 warm anomaly in the NE Pacific. Geophys. Res. Lett., 42, 3414–3420. doi: 10.1002/2015GL063306.
Beaugrand G, Reid PC, Ibanez F, Lindley JA, Edwards, M. (2002) Reorganization of North Atlantic Marine Copepod Biodiversity and Climate. Science 296:1692-1694
Beaugrand, G., Brander, K.M., Lindley, J.A., Souissi, S., Reid, P.C. (2003) Plankton effect on cod recruitment in the North Sea. Nature 426:661-664
Beaugrand G, Edwards, M, Brander K, Luczaki C., Ibenez F. (2008) Causes and projections of abrupt climate-driven ecosystem shifts in the North Atlantic. Ecology Letters 11: 1157-1168
Beaugrand G., Edwards, M., Legendre L. (2010) Marine biodiversity, ecosystem functioning, and carbon cycles. PNAS 107: 10120–10124.
Beaugrand, G., McQuatters-Gollop, A., Edwards, M. and Goberville, E., 2012. Long-term changes in North Atlantic calcifying plankton and climate. Nature Climate Change Letters, 3: 263–267.
Beaugrand G, Harlay X, Edwards M. 2014. Detecting plankton shifts in the North Sea: a new abrupt ecosystem shift between 1996 and 2003. Marine Ecology Progress Series, 502, 85–104.
Beaugrand, G., Edwards, M., Raybaud, V., Goberville, E & Kirby, R.R. 2015. Future vulnerability of marine biodiversity compared with contemporary and past changes. Nature Climate Change 5: 695-701.
Behrenfeld, M. J, O’Malle RT, Siegel, D.A, McClain, C.R, Sarmiento J.L, Feldman G.C, Milligan A.J, Falkowski P.G Ricardo Letelier M, Boss, E.S. (2006) Climate-driven trends in contemporary ocean productivity. Nature 444: 752-755.
Chandler, P.C., King, S.A., and Perry, R.I. (Eds.). 2015. State of the physical, biological and selected fishery resources of Pacific Canadian marine ecosystems in 2014. Can. Tech. Rep. Fish. Aquat. Sci. 3131: vi + 211 p.. Can be found at http://www.dfo-mpo.gc.ca/Library/358018.pdf
Chiba S, Batten S, Sasaoka K, Sasai, Y, Sugisaki H (2012) Influence of the Pacific Decadel Oscillation on phytoplankton phenology and community structure in the western North Pacific based on satellite observation and the Continuous Plankton Recorder survey for 2001–2009. Geophysical Research Letters, 39, L15603, doi:10.1029/2012GL052912
Chiba S, S Batten, T Yoshiki, Y Sasaki, K Sasaoka, H Sugisaki, T Ichikawa (2015) Temperature and zooplankton size structure: climate control and basin-scale comparison in the North Pacific. Ecology and Evolution. doi:10.1002/ece3.1408
Davies, S., Hjort, A., Boyer, D. and Boyer, H. (2015) Benguela Current Large Marine Ecosystem: State of the Marine Environment, 2014.1st Edition. Benguela Current Commission, Swakopmund, Namibia, 88 pp.
Edwards, M., John, A.W.G., Johns, D.G., and Reid, P.C. 2001. Case-history and persistence of a non-indigenous diatom (Coscinodiscus wailesii) in the north-east Atlantic. Journal of the Marine Biological Association of the United Kingdom, 81: 207-211.
Edwards M., Beaugrand, G., Reid, P.C., Rowden, A.A., Jones, M.B. (2002) Ocean climate anomalies and the ecology of the North Sea. Marine Ecology-Progress Series 239:1-10
Edwards, M., Johns, D.G., Leterme, S.C., Svendsen, E., Richardson, A.J. (2006) Regional climate change and harmful algal blooms in the northeast Atlantic. Limnol Oceanogr 51:820-829
Edwards, M., Reid, P., Planque, B. (2001) Long-term and regional variability of phytoplankton biomass in the Northeast Atlantic (1960-1995). ICES J Mar Sci 58:39-49
Edwards, M., Richardson, A.J. (2004) Impact of climate change on marine pelagic phenology and trophic mismatch. Nature 430:881-884
Edwards, M., Beaugrand, G., Hays, G.C., Koslow, J.A. & Richardson, A.J., 2010. Multi-decadal oceanic ecological datasets and their application in marine policy and management. Trends in Ecology and Evolution,25: 602-610.
Edwards, M., Beaugrand, G., Helaouet, P., Coombs, S. 2013. Marine ecosystem response to the Atlantic Multidecadal Oscillation. PLoS ONE, 8: e57212.
Bibliography
31G A C S / s t a t u s
Harris., V., Edwards, M., Olhede, S.C. 2014. Multidecadal Atlantic Climate Variability and its Impact on Marine Pelagic Communities. Journal of Marine Systems , 133:56-69.
Jarre, A., Hutchings, L., Kirkman, S.P., Kreiner, A., Tchipalanga, P., Kainge, P., Uanivi, U., van der Plas, A., Blamey, L.K., Coetzee, J., Lamont, T., Samaai, T., Verheye, H.M., Yemane, D.G., Axelsen, B.E., Ostrowski, M., Stenevik, E.K. and Loeng, H. (2015) Synthesis: climate effects on biodiversity, abundance and distribution of marine organisms in the Benguela. Fisheries Oceanography 24 (Suppl. 1): 122-149.
Longhurst, A . 2001. Ecological Geography of the Sea. Academic Press
McQuatters-Gollop, A., Raitos, D., Edwards, M., Mee, L.D., Lavender, S.J. & Attrill, M. 2007. A new long-term chlorophyll dataset reveals a regime shift in North Sea phytoplankton biomass unconnected to nutrient levels. Limnology and Oceanography, 52: 635-648.
Prochazka, K. (2015) Status of the South African Marine Fishery Resources 2014. Department of Agriculture, Forestry and Fisheries, Cape Town, South Africa, 74 pp. ISBN 978-0-621-43109-4
MFMR (2014) Annual Report 2012/2013. Ministry of Fisheries and Marine Resources, Windhoek, Namibia, 46 pp.
MFMR (2015) Marine Resources Advisory Council Report: Management Recommendations for Hake, Horse Mackerel, Rock Lobster and Crab. Ministry of Fisheries and Marine Resources, Windhoek, Namibia, 96 pp.
Reid, P.C., Johns, D.G., Edwards, M., Starr, M., Poulin, M., Snoeijs, P. (2007) A biological consequence of reducing Arctic ice cover: arrival of the Pacific diatom Neodenticula seminae in the North Atlantic for the first time in 800 000 years. Global Change Biology 13: 1910–1921
Reid, P.C,. Edwards, M. (2001) Long-term changes in the pelagos, benthos and fisheries of the North Sea. Marine Biodiversity 31:107-115
Richardson, A.J. Shoeman, D.S. (2004) Climate Impact on Plankton Ecosystems in the Northeast Atlantic. Science 305: 1609-1612
Richardson, A.J., Walne, A.W., John, A.W.G.J., Jonas, T.D., Lindley, J.A., Sims, D.W., Stevens, D., Witt, M. (2006) Using continuous plankton recorder data. Prog Oceanogr 68:27-74.
Verheye, H. and Crawford, R. (2015) State of the Oceans and Coasts around South Africa 2014. Department of Environmental Affairs, Report No. 14, Pretoria, South Africa, 54 pp. ISBN 978-0-621-42765-3
Verheye, H.M., Lamont, T., Huggett, J.A., Kreiner, A. and Hampton, I. (2015) Plankton productivity of the Benguela Current Large Marine Ecosystem (BCLME). Environmental Development 17. http://dx.doi.org/10.1016/j.envdev.2015.07.011.
Vezzulli L, Brettar, I., Pezzati, E., Reid, P.C.,Colwell, R.R., Hofle, M.G., Pruzzo, C. (2011) Long-term effects of ocean warming on the prokaryotic community: evidence from the vibrios. ISME Journal 6: 21-30.
Vezzulli, L., Staunder, M., Grande, C., Pezzati, E., Verheye, H.M., Owens, N.J.P and Pruzzo, C. (2015) – gbpA as a novel qPCR target for the species-specific detection of Vibrio cholerae O1, O139, non-O1/non-O139 in environmental, stool, and historical Continuous Plankton Recorder samples. PLoS ONE 10(4): e0123983. DOI: 10.1371/journal.pone.0123983.
Wakelin, S. L., Y. Artioli, M. Butenschön, J. I. Allen, and J. T. Holt (2015), Modelling the com- bined impacts of climate change and direct anthropogenic drivers on the ecosystem of the northwest European continental shelf, Journal of Marine Systems, 152, 51–63.
Whitney, F. A. 2015. Anomalous winter winds decrease 2014 transition zone productivity in the NE Pacific. Geophys. Res. Lett. 42: 428–431 p. doi:10.1002/ 2014GL062634.
Yoshiki T, S Chiba, H Sugisaki, T Ichikawa, S Batten (2015) Northerly shift of warm-water copepods in the western subarctic North Pacific: Continuous Plankton Recorder samples (2001-2010), Fisheries Oceanography, 24, 414-429.
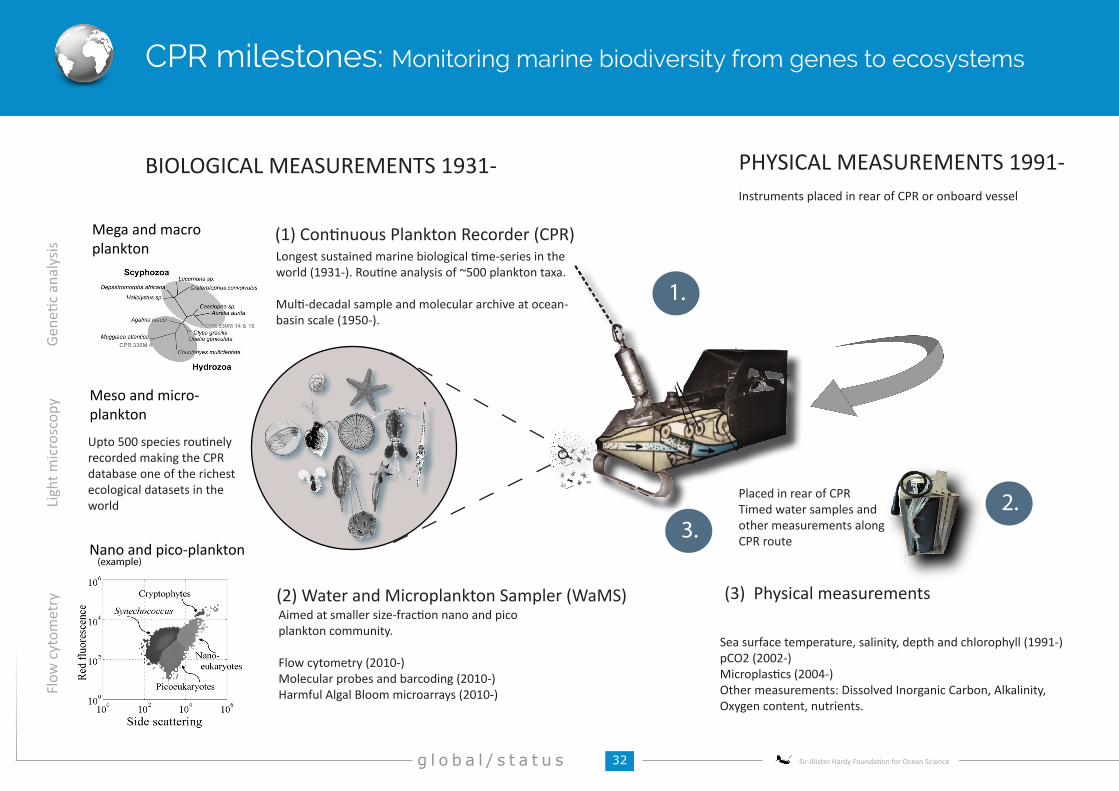
32g l o b a l / s t a t u s Sir Alister Hardy Foundation for Ocean Science
(1) Continuous Plankton Recorder (CPR)
(2) Water and Microplankton Sampler (WaMS)
Longest sustained marine biological time-series in the world (1931-). Routine analysis of ~500 plankton taxa.
Multi-decadal sample and molecular archive at ocean-basin scale (1950-).
Aimed at smaller size-fraction nano and pico plankton community.
Flow cytometry (2010-)Molecular probes and barcoding (2010-)Harmful Algal Bloom microarrays (2010-)
PHYSICAL MEASUREMENTS 1991-
Placed in rear of CPRTimed water samples and other measurements along CPR route
Meso and micro-plankton
Nano and pico-plankton
Mega and macro plankton
Upto 500 species routinely recorded making the CPR database one of the richest ecological datasets in the worldLi
ght m
icro
scop
yGe
netic
ana
lysis
Flow
cyt
omet
ry
(example)
(3) Physical measurements
BIOLOGICAL MEASUREMENTS 1931-Instruments placed in rear of CPR or onboard vessel
Sea surface temperature, salinity, depth and chlorophyll (1991-)pCO2 (2002-)Microplastics (2004-)Other measurements: Dissolved Inorganic Carbon, Alkalinity, Oxygen content, nutrients.
CPR milestones: Monitoring marine biodiversity from genes to ecosystems
2.
1.
3.
33G A C S / s t a t u s
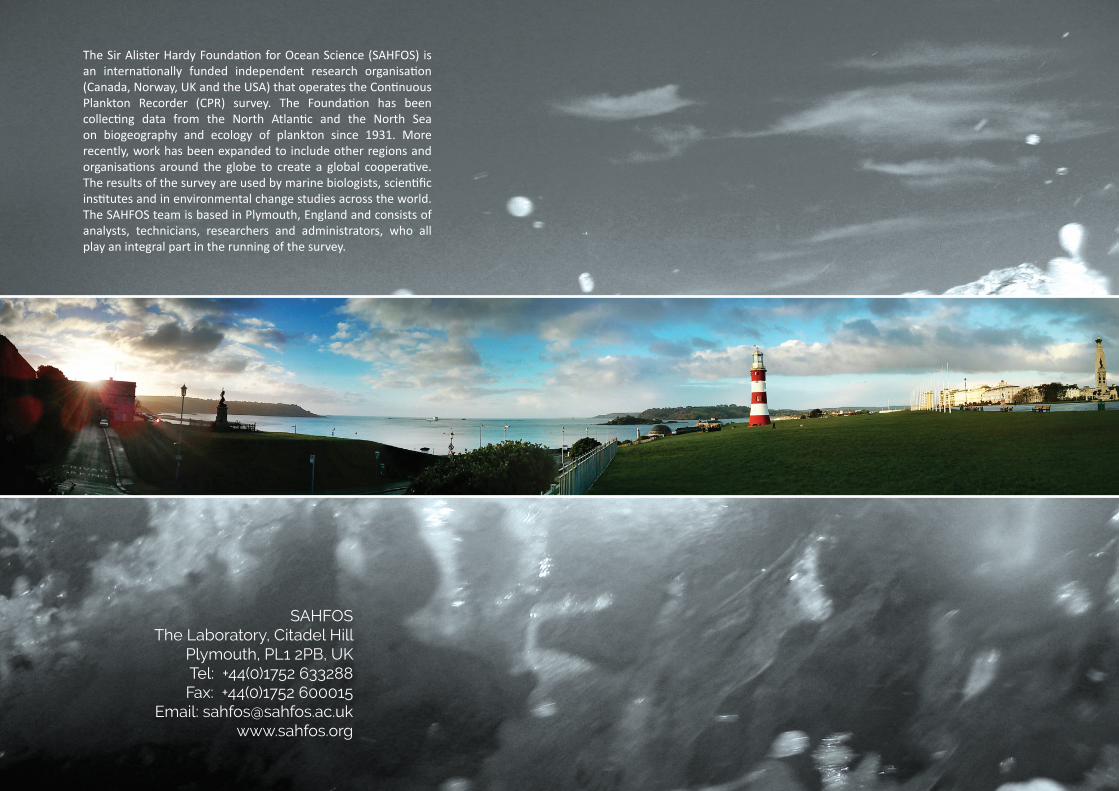
34g l o b a l / s t a t u s Sir Alister Hardy Foundation for Ocean Science
SAHFOSThe Laboratory, Citadel Hill
Plymouth, PL1 2PB, UKTel: +44(0)1752 633288Fax: +44(0)1752 600015
Email: [email protected]
The Sir Alister Hardy Foundation for Ocean Science (SAHFOS) is an internationally funded independent research organisation (Canada, Norway, UK and the USA) that operates the Continuous Plankton Recorder (CPR) survey. The Foundation has been collecting data from the North Atlantic and the North Sea on biogeography and ecology of plankton since 1931. More recently, work has been expanded to include other regions and organisations around the globe to create a global cooperative. The results of the survey are used by marine biologists, scientific institutes and in environmental change studies across the world. The SAHFOS team is based in Plymouth, England and consists of analysts, technicians, researchers and administrators, who all play an integral part in the running of the survey.