Embed Size (px)
Citation preview
RES - Status Quo, Potential and Prospects
Vasileios Tsolakidis, CRES
20 June 2017, Thessaloniki
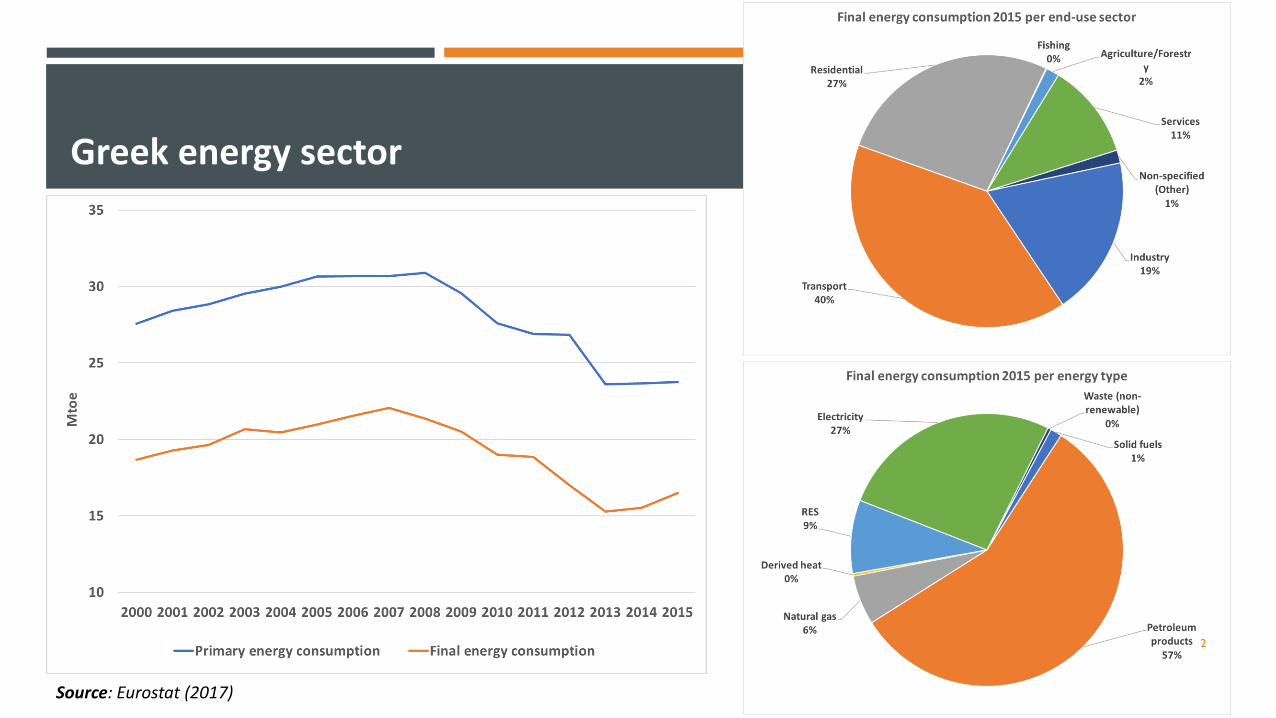
Greek energy sector
2
Source: Eurostat (2017)

RES targets
Directive 2009/28/EC • Gross final energy consumption in 2020: 18%
Law 3851/2010
• Gross final energy consumption in 2020 (RES-total): 20%
• Gross electricity consumption in 2020 (RES-E): at least 40%
• Final energy consumption for heating and cooling in 2020 (RES-H&C): at least 20%
• Final energy consumption for transport in 2020 (RES-T): at least 10%
3
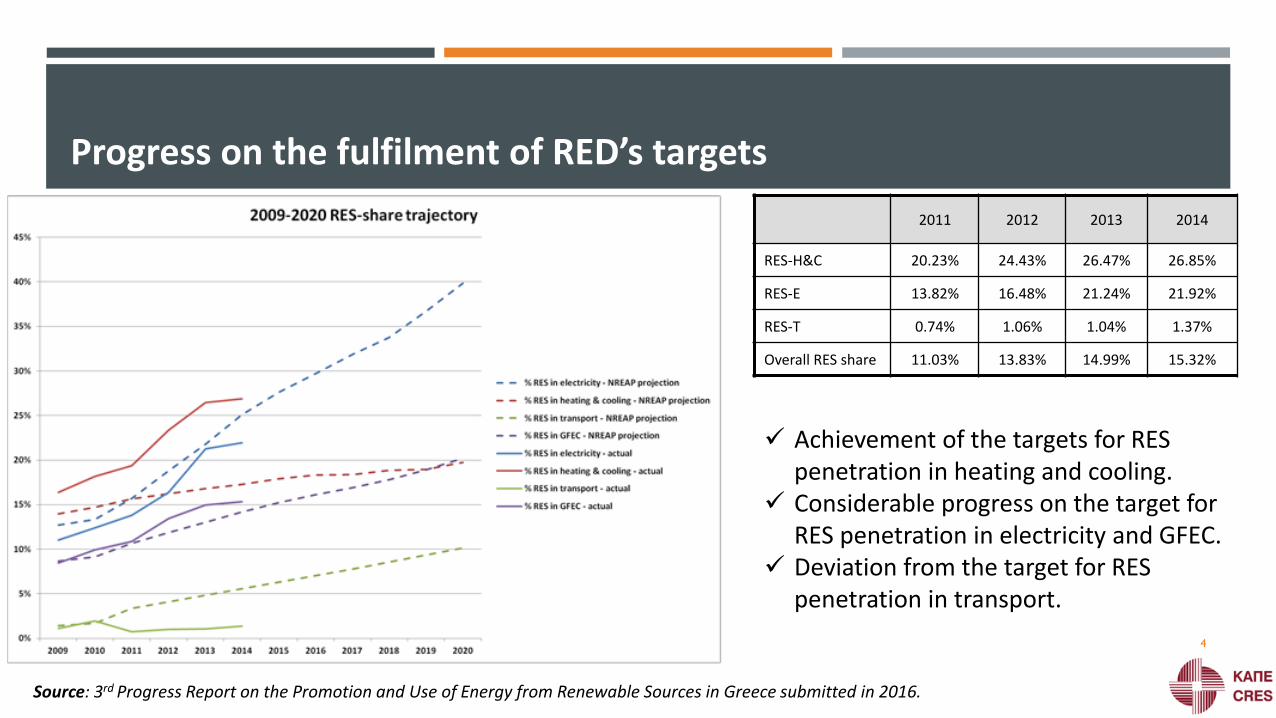
Progress on the fulfilment of RED’s targets
2011 2012 2013 2014
RES-H&C 20.23% 24.43% 26.47% 26.85%
RES-E 13.82% 16.48% 21.24% 21.92%
RES-T 0.74% 1.06% 1.04% 1.37%
Overall RES share 11.03% 13.83% 14.99% 15.32%
✓ Achievement of the targets for RES penetration in heating and cooling.
✓ Considerable progress on the target for RES penetration in electricity and GFEC.
✓ Deviation from the target for RES penetration in transport.
Source: 3rd Progress Report on the Promotion and Use of Energy from Renewable Sources in Greece submitted in 2016.
4
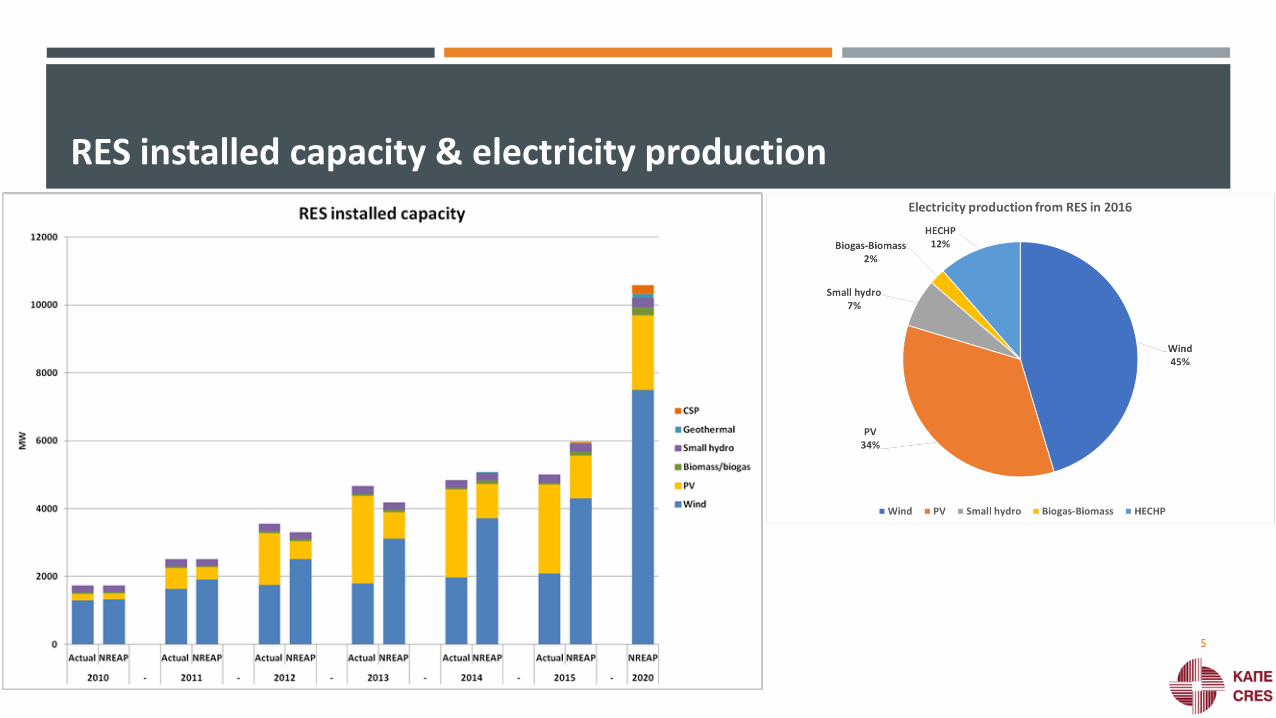
RES installed capacity & electricity production
5
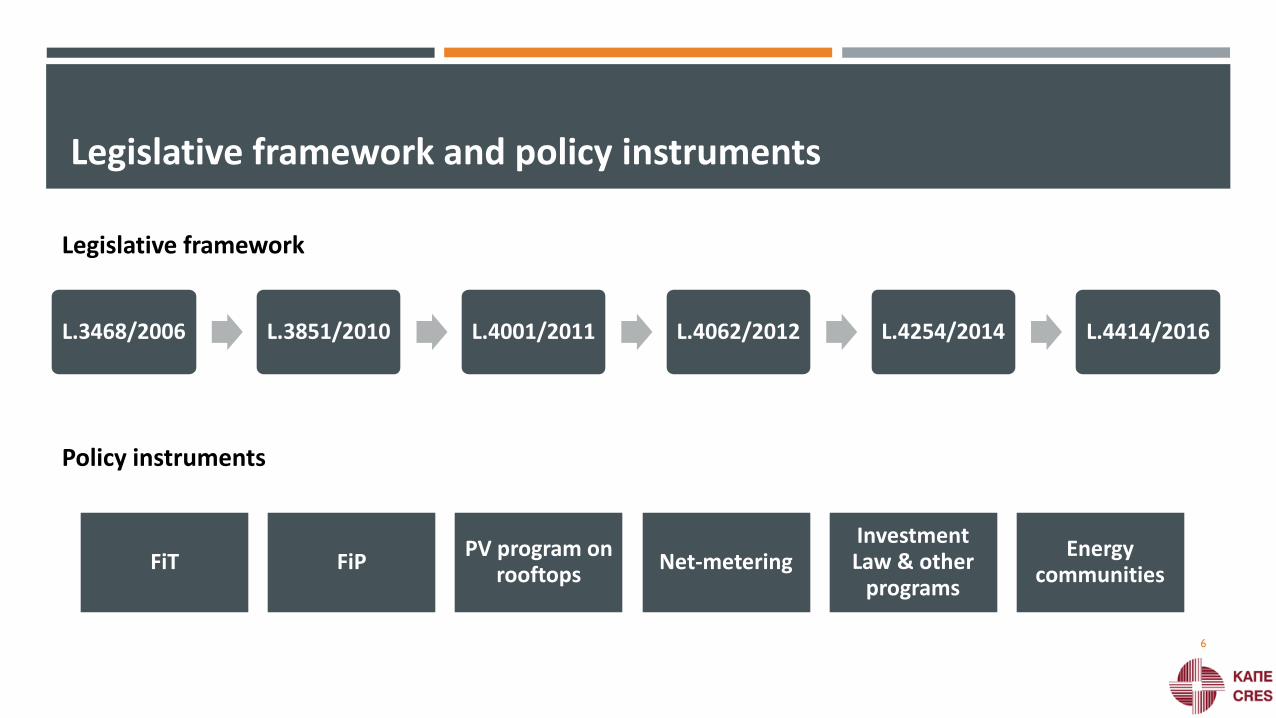
Legislative framework and policy instruments
L.3468/2006 L.3851/2010 L.4001/2011 L.4062/2012 L.4254/2014 L.4414/2016
FiT FiPPV program on
rooftopsNet-metering
Investment Law & other
programs
Energy communities
Legislative framework
Policy instruments
6
FiP
The Feed-in-Premium scheme was introduced from 01.01.2016 according to the foreseen requirements and provisions of the EC State Aid Guidelines for Environmental Protection and Energy 2014-2020.
Exemptions to specific categories giving the opportunity to receive the granted aid in the form of FiT.
RES plants should be subjected to specific obligations based on their direct participation in the electricity market providing incentives in order to optimize their hourly generation forecasts during the transitory period.
Adoption of competitive bidding processes for granting the relevant RES operating aid from 01.01.2017.
The first round of a competitive bidding process equal to at minimum 5% of the new installed RES capacity in the period 2015-2016 was conducted within 2016.
7
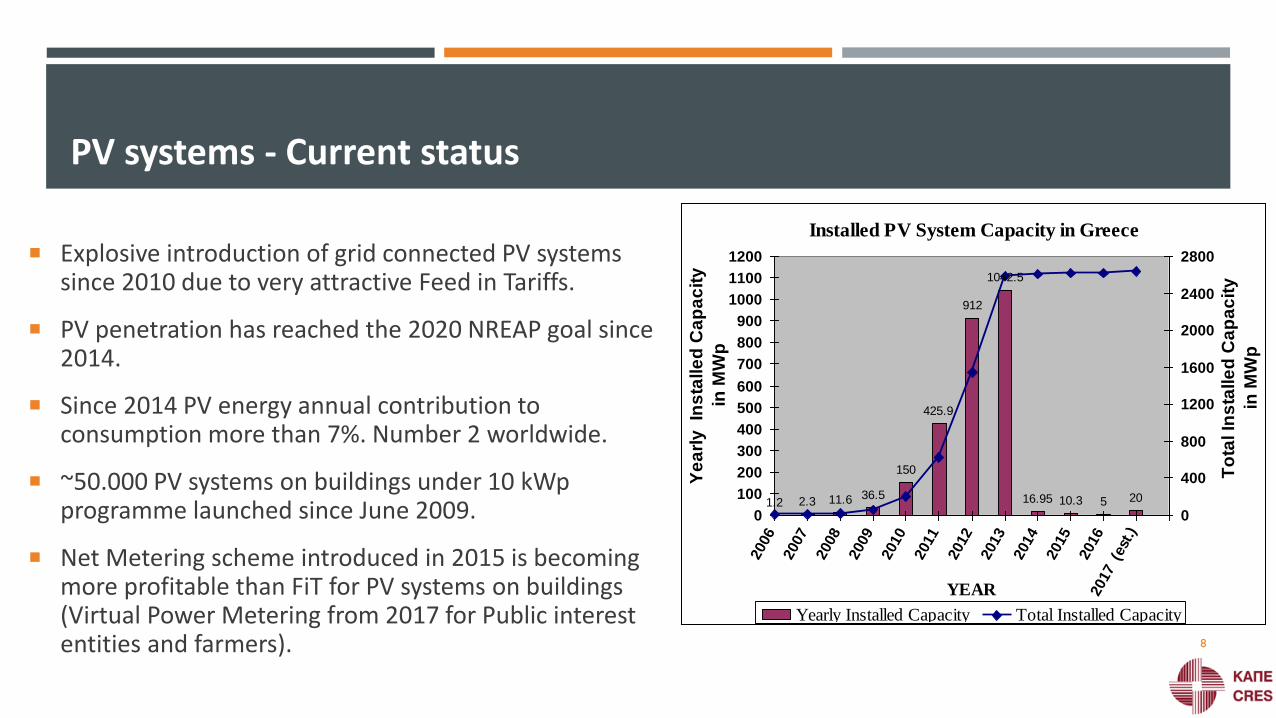
Installed PV System Capacity in Greece
1.2 2.3 11.6 36.5
150
425.9
912
1042.5
16.95 10.3 5 20
0
100
200
300
400
500
600
700
800
900
1000
1100
1200
2006
2007
2008
2009
2010
2011
2012
2013
2014
2015
2016
2017 (
est
.)
YEAR
Ye
arl
y In
sta
lle
d C
ap
ac
ity
in M
Wp
0
400
800
1200
1600
2000
2400
2800
To
tal In
sta
lle
d C
ap
ac
ity
in M
Wp
Yearly Installed Capacity Total Installed Capacity
PV systems - Current status
Explosive introduction of grid connected PV systems since 2010 due to very attractive Feed in Tariffs.
PV penetration has reached the 2020 NREAP goal since 2014.
Since 2014 PV energy annual contribution to consumption more than 7%. Number 2 worldwide.
~50.000 PV systems on buildings under 10 kWpprogramme launched since June 2009.
Net Metering scheme introduced in 2015 is becoming more profitable than FiT for PV systems on buildings (Virtual Power Metering from 2017 for Public interest entities and farmers). 8
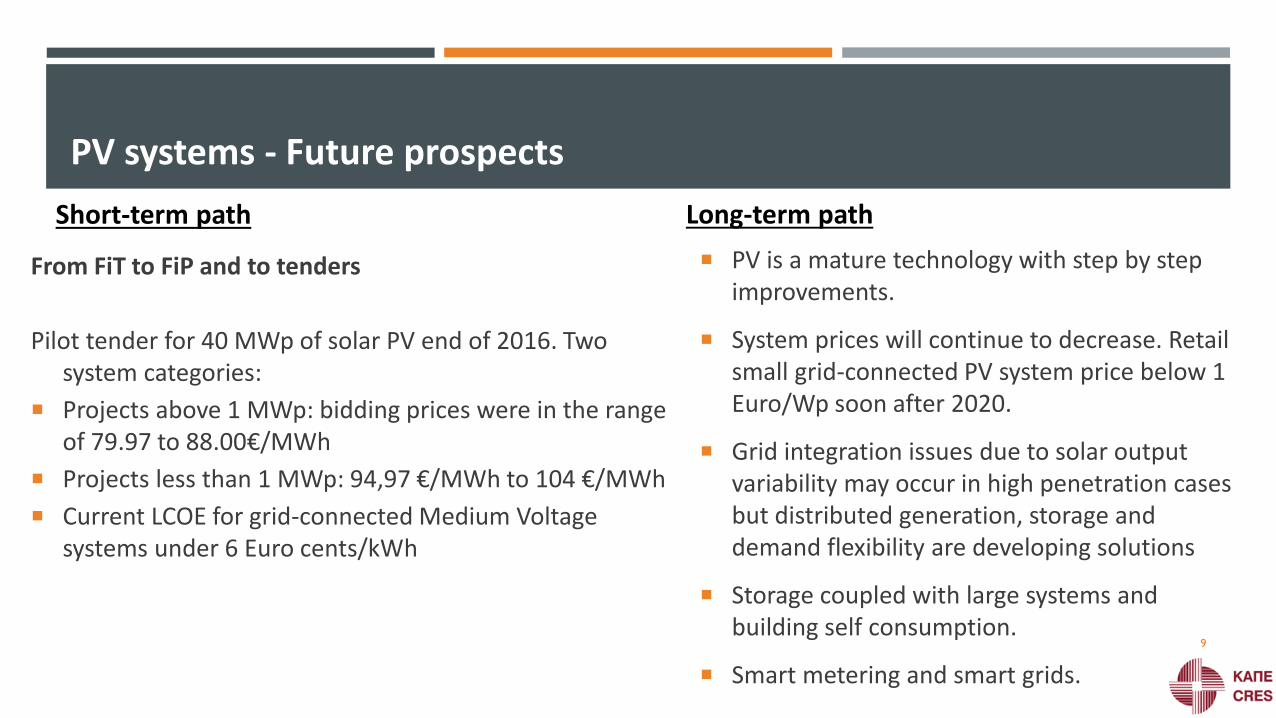
From FiT to FiP and to tenders
Pilot tender for 40 MWp of solar PV end of 2016. Two system categories:
Projects above 1 MWp: bidding prices were in the range of 79.97 to 88.00€/MWh
Projects less than 1 MWp: 94,97 €/MWh to 104 €/MWh
Current LCOE for grid-connected Medium Voltage systems under 6 Euro cents/kWh
PV systems - Future prospects
PV is a mature technology with step by step improvements.
System prices will continue to decrease. Retail small grid-connected PV system price below 1 Euro/Wp soon after 2020.
Grid integration issues due to solar output variability may occur in high penetration cases but distributed generation, storage and demand flexibility are developing solutions
Storage coupled with large systems and building self consumption.
Smart metering and smart grids.
Short-term path Long-term path
9
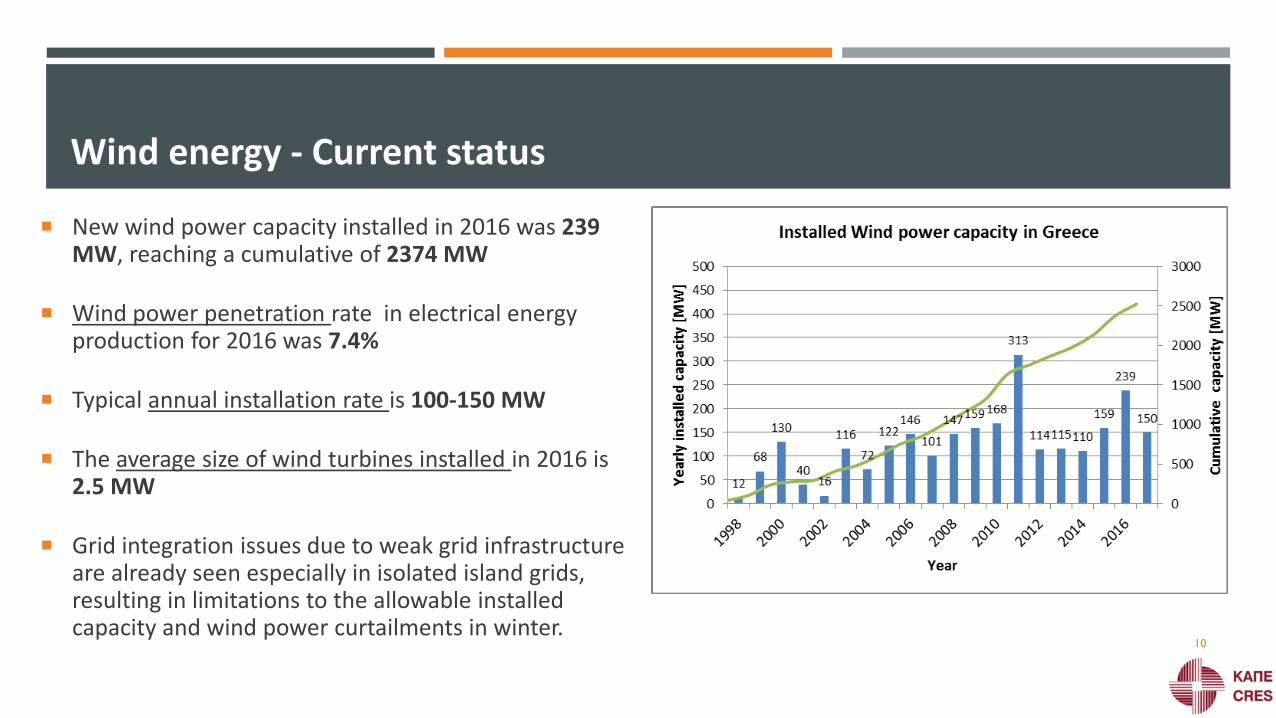
Wind energy - Current status
New wind power capacity installed in 2016 was 239 MW, reaching a cumulative of 2374 MW
Wind power penetration rate in electrical energy production for 2016 was 7.4%
Typical annual installation rate is 100-150 MW
The average size of wind turbines installed in 2016 is 2.5 MW
Grid integration issues due to weak grid infrastructure are already seen especially in isolated island grids, resulting in limitations to the allowable installed capacity and wind power curtailments in winter.
10
From FiT to FiP and to tenders
Waiting and expectations for the implementation of
the FiP support scheme for wind energy production.
Current activity related to projects still assigned to Feed in tariff under the previous scheme.
Wind energy - Future prospects
Wind is a mature technology and will provide significant share of RES energy in the future.
Electricity grid strengthening and interconnections of islands in the Aegean Sea with mainland can substantially increase the wind energy share in electricity production, improving on the same time system stability.
Offshore wind energy applications can further increase wind energy capacity after floating wind turbine foundations become mature.
Short-term path Long-term path
11
Biogas - Current status
Theoretical potential:
350 MWe installed capacity produced from biomass (animal wastes and food industrial wastes)
100 MWe from agricultural wastes
100 MWe from the degradable part of the municipal wastes
Actual situation:
57 MWe installed capacity from biogas - 31 plants of total
11.1 MWe total capacity using agro-industrial residues - 18 plants of 250-500kW each
The most prevailing technology is anaerobic digestion12
Biogas - Future prospects
Technological prospects: 40 MWe
Identified barriers
Fuel procurement & material optimization
Legislation - Gate fee
Limited funding opportunities
Absence of efficient supply chains
Technological prospects
Biomethane production for injection to NG grid and CNG
Identified barriers
Lack of biomethane prices
Competitiveness with natural gas
Short-term path Long-term path
13
Solid biomass for CHP - Current status
Theoretical potential:
Additional 1,746 GWh still unexploited with potential of CO2 mitigation at approximately 460,000 tons.
Main feedstocks: straw, olive pruning and olive kernels, cotton stalks, wood residues
Actual situation:
Consumption of 1,604.94 GWh mainly in food and wood industry for space and process heat
2 MWe from biomass - 7 plants in total
Domestically produced biomass boilers
The most prevailing technology is combustion 14
Solid biomass for CHP - Future prospects
Technological prospects
Small district heating plants, Domestic heating (commerce and service buildings, public sector)
Combustion, and co-combustion with lignite, in PPC units - Gasification
Identified barriers
Challenging logistics/service provision
High costs for biomass procurement and infrastructure
Lack of economies of scale
Challenging licensing procedure and lack of a set heat price
Absence of effective supply chains
Short and longer term path
15
Biofuels - Current status
Actual situation:
Consumption of 132,000 kL - 23% certified
16 biodiesel producing companies (125,600 kL), 7 importers (6,400 kL)
Raw material: oil seeds (73%) mainly sunflower, used cooking oils (23%) and cootton seed (7%)
Around 100,000 hectares with oil crops, 85% grown with sunflower.
The only biofuel produced is biodiesel, 1st generation
16
Biofuels - Future prospects
Technological prospects
Advanced biofuels
Identified barriers
Technologies still not mature
High investment costs
Limited funding opportunities
Recommendations
R&D efforts towards more efficient technologies
Short and longer term path
17
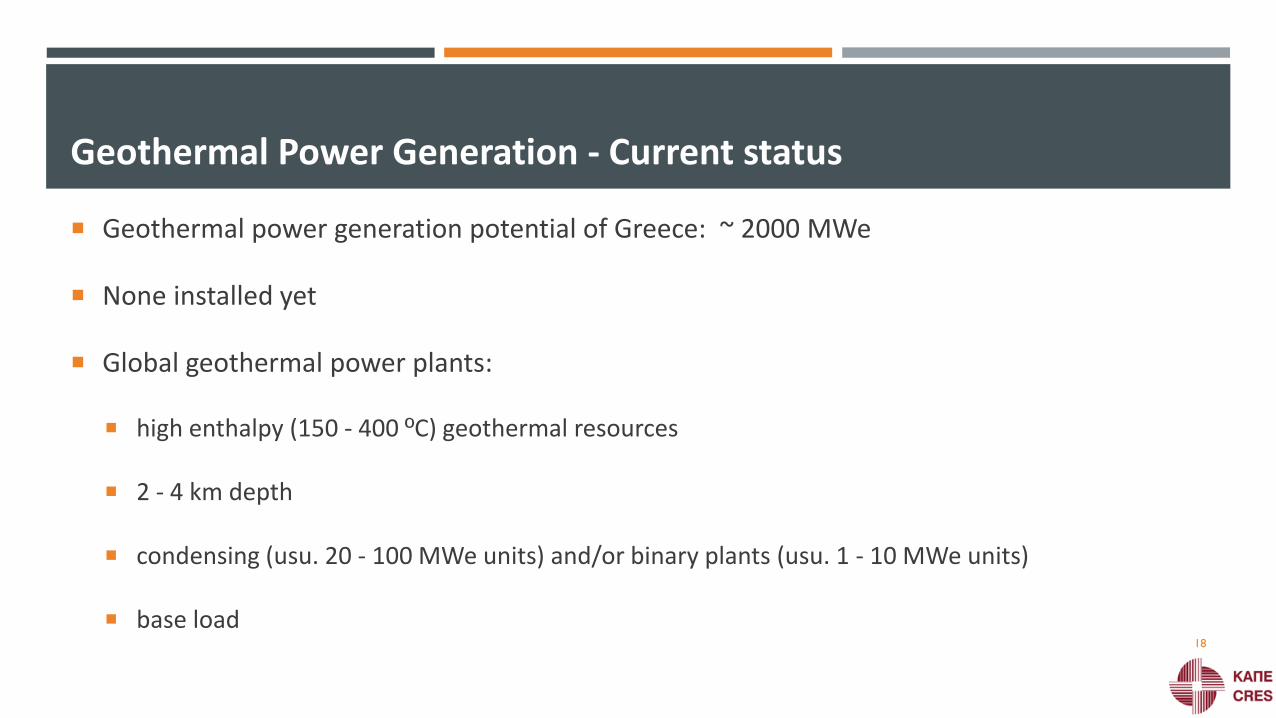
Geothermal Power Generation - Current status
Geothermal power generation potential of Greece: ~ 2000 MWe
None installed yet
Global geothermal power plants:
high enthalpy (150 - 400 ºC) geothermal resources
2 - 4 km depth
condensing (usu. 20 - 100 MWe units) and/or binary plants (usu. 1 - 10 MWe units)
base load18

Geothermal Power Generation - Future prospects
Technological prospects
Binary plants
Identified barriers
Investing environment
Interconnection to power grid
Delays in the development of existing
concessions
Technological prospects
Condensing plants
Enhanced Geothermal Systems
Identified barriers
High initial costs
Geological risk (introduction of a geological
risk insurance scheme is needed)
Short-term path Long-term path
19
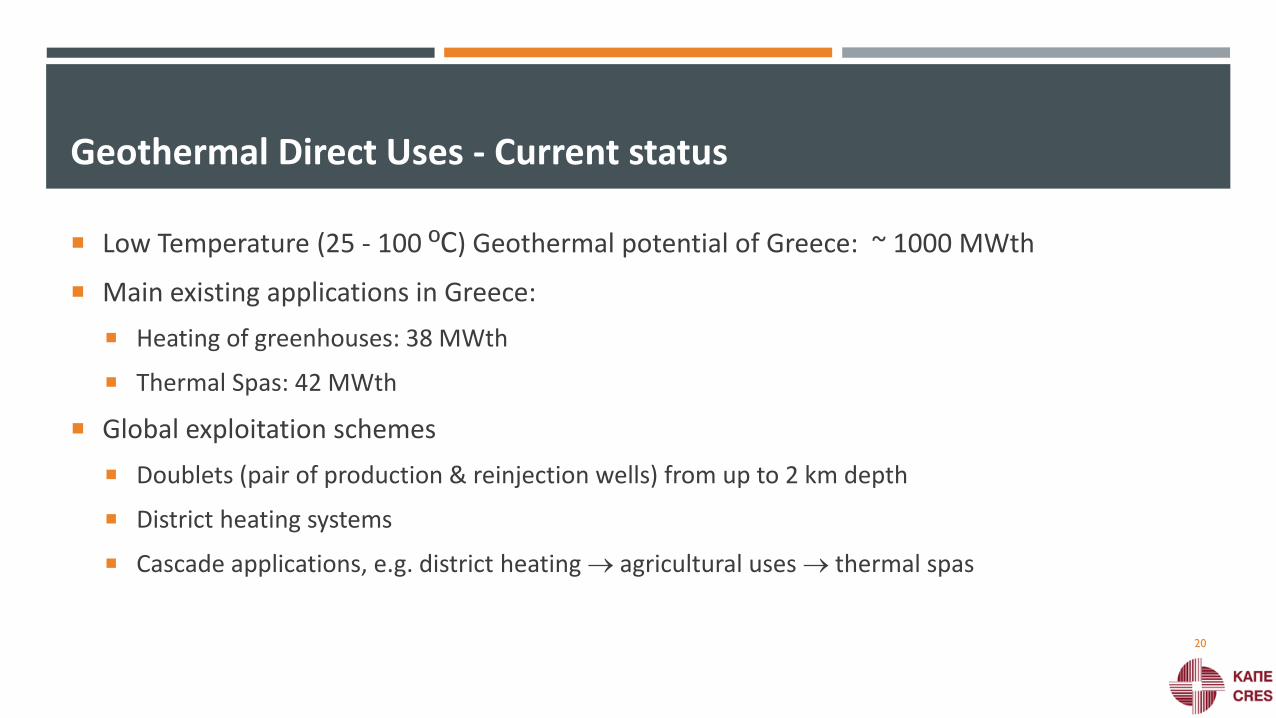
Geothermal Direct Uses - Current status
Low Temperature (25 - 100 ºC) Geothermal potential of Greece: ~ 1000 MWth
Main existing applications in Greece:
Heating of greenhouses: 38 MWth
Thermal Spas: 42 MWth
Global exploitation schemes
Doublets (pair of production & reinjection wells) from up to 2 km depth
District heating systems
Cascade applications, e.g. district heating agricultural uses thermal spas
20
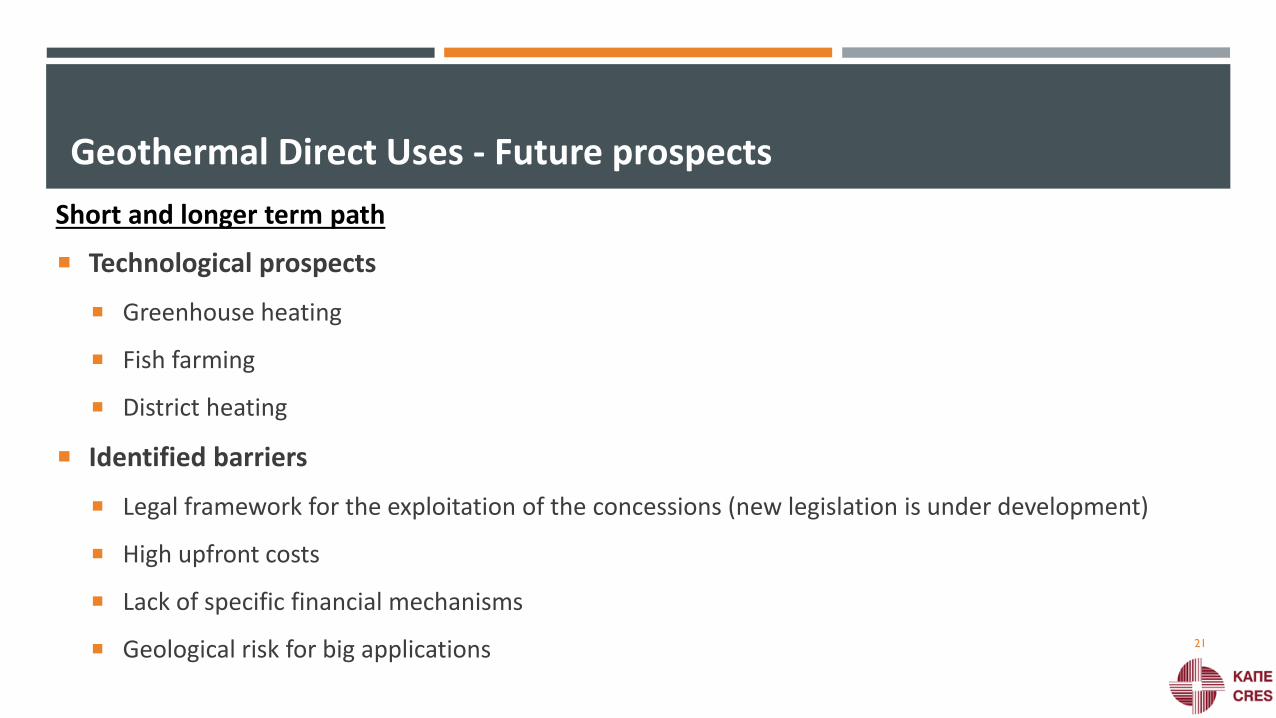
Geothermal Direct Uses - Future prospects
Technological prospects
Greenhouse heating
Fish farming
District heating
Identified barriers
Legal framework for the exploitation of the concessions (new legislation is under development)
High upfront costs
Lack of specific financial mechanisms
Geological risk for big applications
Short and longer term path
21
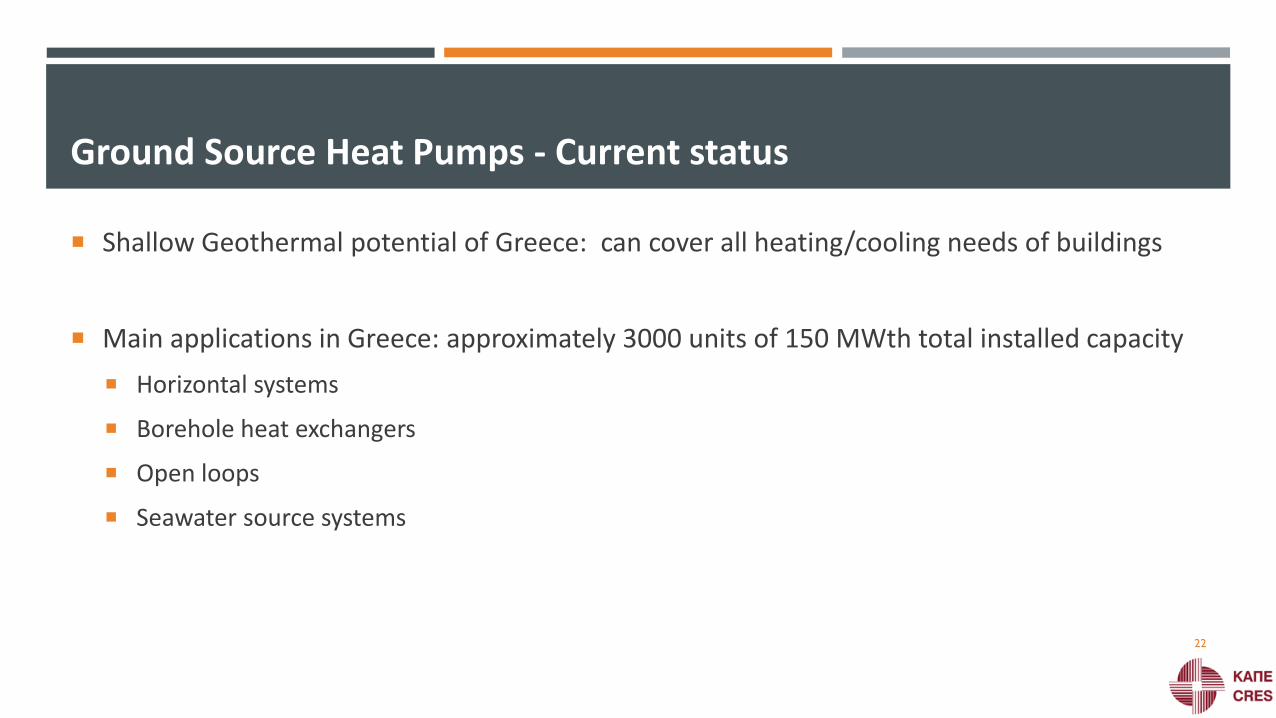
Ground Source Heat Pumps - Current status
Shallow Geothermal potential of Greece: can cover all heating/cooling needs of buildings
Main applications in Greece: approximately 3000 units of 150 MWth total installed capacity
Horizontal systems
Borehole heat exchangers
Open loops
Seawater source systems
22
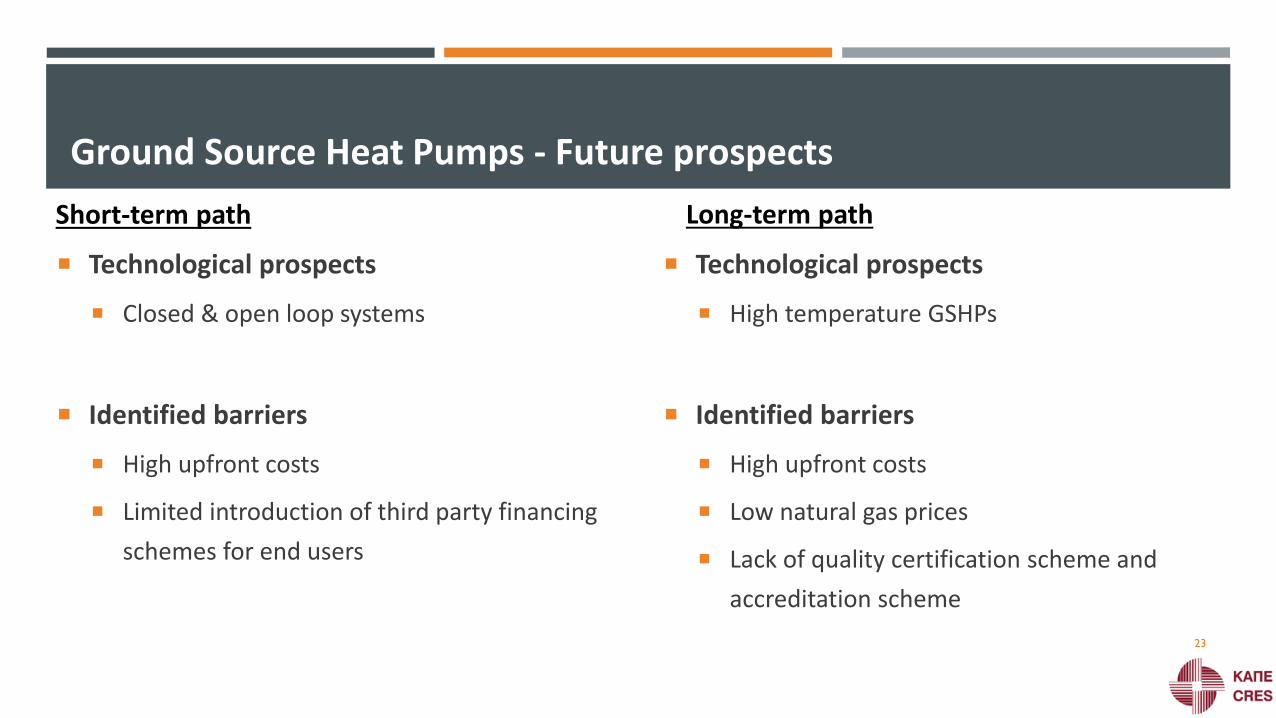
Ground Source Heat Pumps - Future prospects
Short-term path Long-term path
Technological prospects
Closed & open loop systems
Identified barriers
High upfront costs
Limited introduction of third party financing
schemes for end users
Technological prospects
High temperature GSHPs
Identified barriers
High upfront costs
Low natural gas prices
Lack of quality certification scheme and
accreditation scheme
23
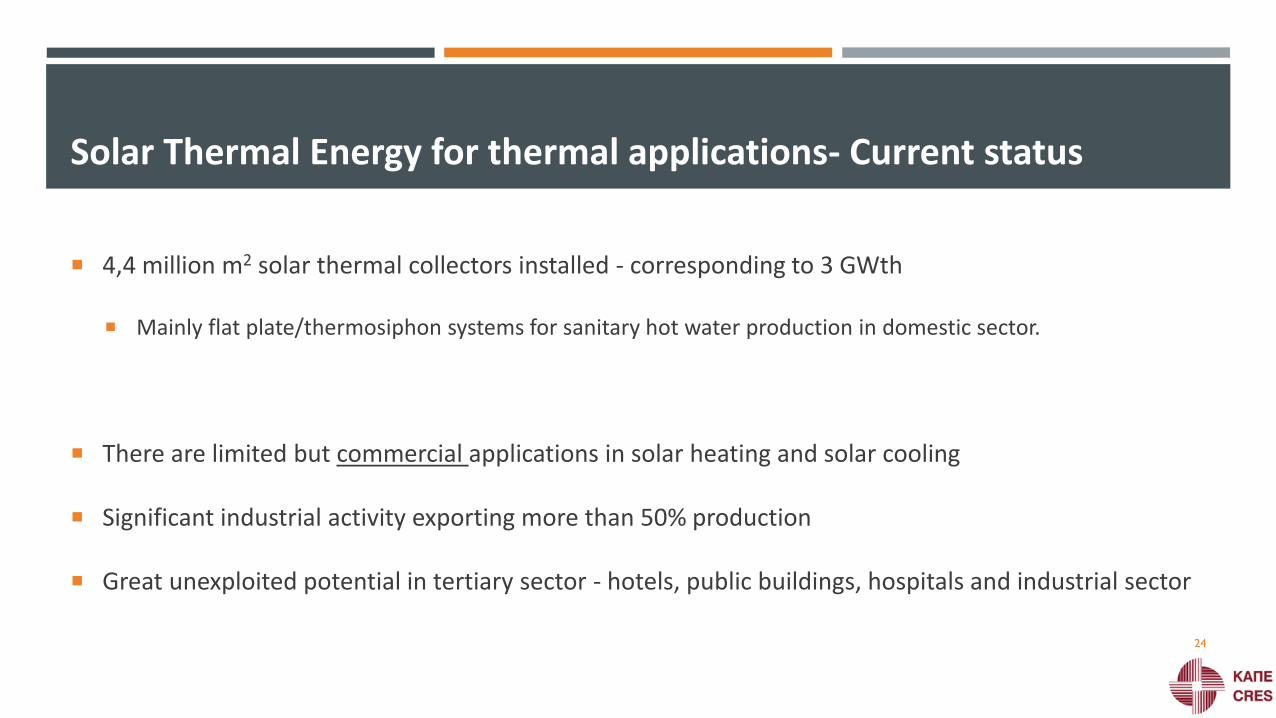
Solar Thermal Energy for thermal applications- Current status
4,4 million m2 solar thermal collectors installed - corresponding to 3 GWth
Mainly flat plate/thermosiphon systems for sanitary hot water production in domestic sector.
There are limited but commercial applications in solar heating and solar cooling
Significant industrial activity exporting more than 50% production
Great unexploited potential in tertiary sector - hotels, public buildings, hospitals and industrial sector
24
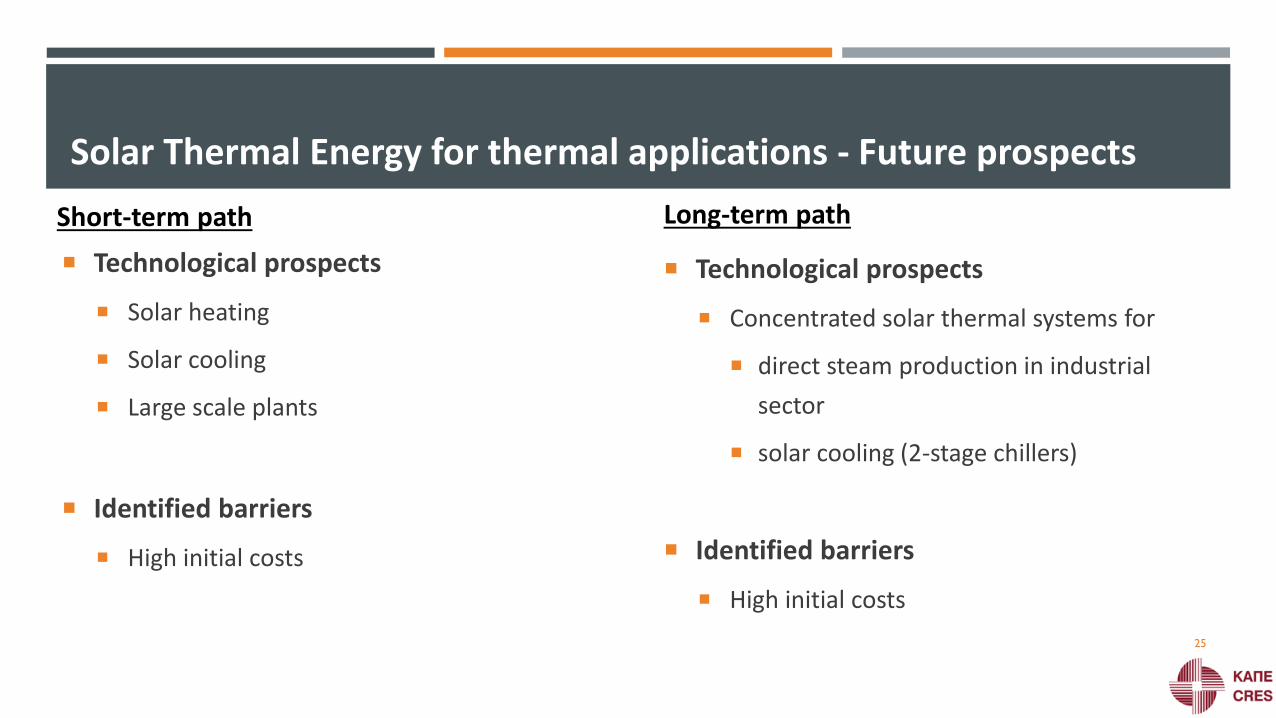
Solar Thermal Energy for thermal applications - Future prospects
Technological prospects
Solar heating
Solar cooling
Large scale plants
Identified barriers
High initial costs
Short-term path Long-term path
Technological prospects
Concentrated solar thermal systems for
direct steam production in industrial
sector
solar cooling (2-stage chillers)
Identified barriers
High initial costs
25
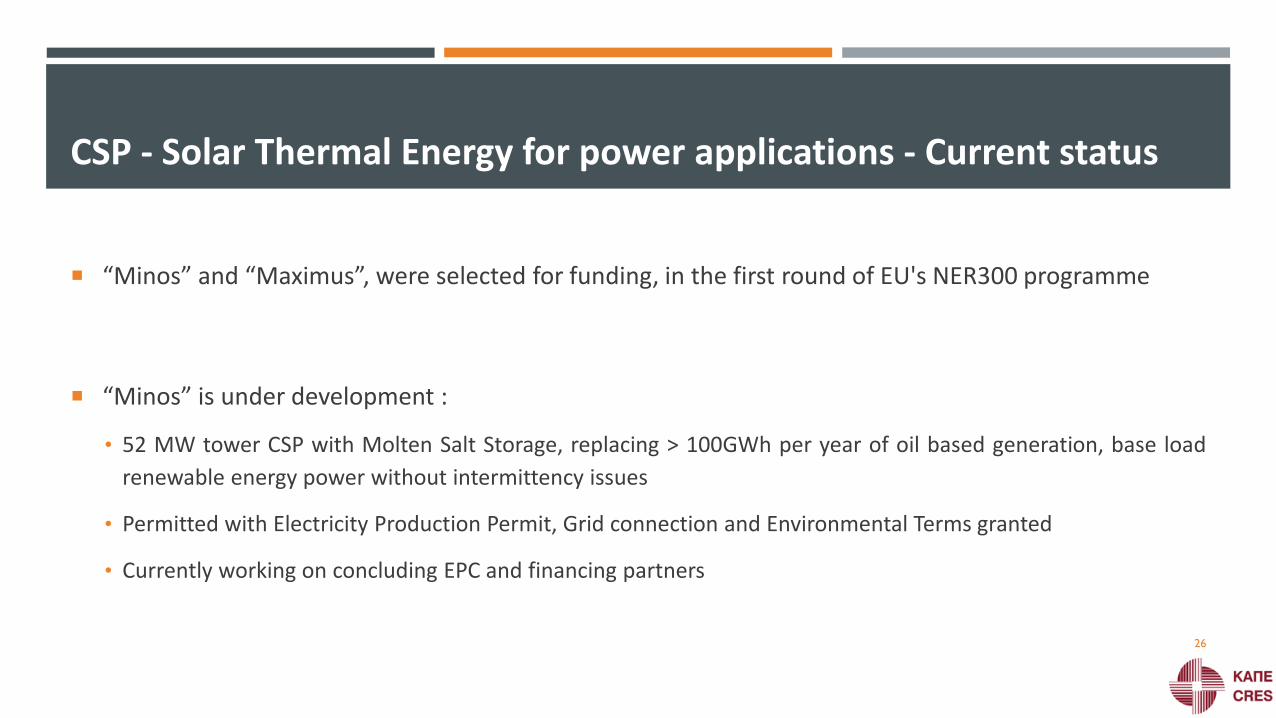
CSP - Solar Thermal Energy for power applications - Current status
“Minos” and “Maximus”, were selected for funding, in the first round of EU's NER300 programme
“Minos” is under development :
• 52 MW tower CSP with Molten Salt Storage, replacing > 100GWh per year of oil based generation, base load
renewable energy power without intermittency issues
• Permitted with Electricity Production Permit, Grid connection and Environmental Terms granted
• Currently working on concluding EPC and financing partners
26
CSP - Solar Thermal Energy for power applications - Future prospects
Technological prospects
Base - load CSP plants with storage (3-7 hours)
Identified barriers
Capital intensive
Levelized cost of energy produced by CSPs is quite high
27

Thank you for your attention…
28