Embed Size (px)
Citation preview

Gaining from Migration
Proposals for a New Mobility Management System29 March 2007

• Better understand the new mobility
system
• Identify policies to improve mobility
management and enable integration
• Expand options for engaging sending
countries
• Build a shared vision
Objectives of the Gaining from Migration Project

Gaining from Migration: Key Outputs
– Migration, employment, growth
– Challenges for integration– Diaspora networks– Migration and
development
Evaluative reviews: what do we know about…
Policy Briefs: synthesising policy
lessons regarding…
Final Report (proposals for managing a new mobility
system)

Inputs into the Policy Process
June 05
Start
Sept 07
Final Event?
July 07Global Forum onMigration and Development
April 07Euro-Mediterranean
Conference
May 07World Bank Conference
March 07Haut Conseil
de Coopération Internationale
Jan 06: 1st Experts’ Meeting
Jul 06: 2nd Experts’ Meeting
Mar 07: 3rd Experts’ Meeting
Gaining from Migration: Steering Committee
EUXavier Prats Monné , Director, DG Employment, EC
(Antonis Kastrissianakis, former Director, DG Employment, EC)
Costantinos Fotakis, DG Employment, EC
(Germana Ricciardi, DG Employment, EC)
OECDLouka T. Katseli,Director, Development Centre
John Martin, Director, Directorate of Employment, Labour and Social Affairs

Gaining from Migration: Core Project Team
• Louka T. Katseli (OECD Development Centre), Scientific Director
• Demetris Papademetriou (President, Migration Policy Institute)
• Jeff Dayton-Johnson (OECD Development Centre)• Gregory Maniatis (Senior European Fellow,
Migration Policy Institute) • Rainer Münz (Head Research & Development,
Erste Bank) • Theodora Xenogiani (OECD Development Centre)

Advisory Board• Global Commission on International
Migration (R.K. Singh, R. Süssmuth)• International and Multilateral Organisations
and Bodies: International Labour Organisation; European Parliament; The World Bank; International Organisation for Migration
• Public Sector: Agence Française de Développement; High Commissioner for Immigration and Ethnic Minorities, Portugal; Hellenic Migration Policy Institute
• Civil society, the Private Sector: AXA France; Chamber of Commerce and Industry, India; Immigrant Council of Ireland
• Universities: Universidad Complutense, Spain; University College of Cork, Ireland

Jobs and Confidence
• Jobs: Migrants, their home countries, and EU countries all benefit if migrants and native workers are employed in jobs suited to their skills
• Confidence: In rebuilding the mobility system, Member States must also rebuild public confidence in international migration – and the emerging mobility system

Topics for the Experts’ Meeting
• New Migration Thinking for a New Century
• Labour-Market and Visa Policies for an Age of Mobility
• Enabling Integration• Partnerships for Mobility
Management and Development• Encouraging Diaspora Networks

• Three migration policy regimes in Europe:– Historical and language ties
e.g. France, Benelux, Morocco, Algeria,Spain, UK, India, Pakistan,Portugal, Ireland Turkey
– Geographic proximity:e.g. Italy, Greece, Albania, Turkey,Germany, Austria Serb-Mont,
Morocco
– Humanitarian considerations:
e.g. Denmark, Finland, Iraq, Serb-Mont, B-H,
Sweden Iran
One Europe?Geography, history and politics matter

7.4
3.2
-1.8
4.7
27.2
3.5
1.2
1.4
-0.3
15.0
1.7
1.7
3.3
3.1
2.6
1.8
11.4
2.0
5.8
-3.0
3.4
-0.5
5.0
-1.2
4.7
-0.3
3.9
-0.5
2.7
3.6
0.8
-5.9
Map 2: Net MigrationEurope (EU-25/EEA, EU Accession Countries and Switzerland)
Net migration less than 0.0 per 1000
Net migration between 0.0 and 5.0 per 1000
Net migration between 5.0 and 10.0 per 1000
Net migration over 10.0per 1000
LabelNet migration (per 1000)
Migration Flows in Europe
Source: Muenz, Straubhaar, Vadean and Vadean (2006)

Share of people born in a country outside EU-27, 2005
0
2
4
6
8
10
12
14
16
18
% of total population
% of total labour force
Source: European LFS, Eurostat

Where do EU-15 migrants come from?
Latin America, 4.4%of which
Ecuador: 0.7%Colombia: 0.7%Suriname: 0.6%Brazil: 0.6%Argentina: 0.5% Jamaica: 0.4%Venezuela: 0.4%Peru: 0.3%Chile: 0.2%
EU 15 Countries
Africa, 13.6% of whichMorocco: 4.5% Nigeria: 0.4% Algeria: 3.9% Senegal: 0.4% Tunisia: 1.3% Somalia: 0.3%Angola: 0.6% Ghana: 0.3%South Africa: 0.6% Dem. Republic ofKenya: 0.4% Congo: 0.3%Egypt: 0.4% Mozambique: 0.2%
Wider Europe 16.4%, of which
Turkey: 5.8% Croatia: 1.0%Serbia-Montenegro: 2.2% Russia: 0.7%Albania: 1.7% Bulgaria: 0.3%Romania: 1.6% Lithuania: 0.3%Ukraine: 1.4% Belarus: 0.3%Bi-H: 1.1%
Asia, 7.0%, of which
India: 1.8%Pakistan: 1.2%Vietnam: 0.8%China: 0.7%Indonesia: 0.6%Bangladesh: 0.5%Philippines: 0.5%Sri Lanka: 0.4%Hong Kong, China: 0.3%Japan: 0.2%
Middle East, 1.5%of whichIran: 0.7%Iraq: 0.5%Lebanon: 0.3%
Source: OECD Database on Expatriates and Immigrants, 2004

Recent changes in sending and receiving countries
• Sharp increase of immigration in Spain, Italy and the UK
• New sending countries emerge:•Ukraine•China•Russian Federation•Countries in Latin American
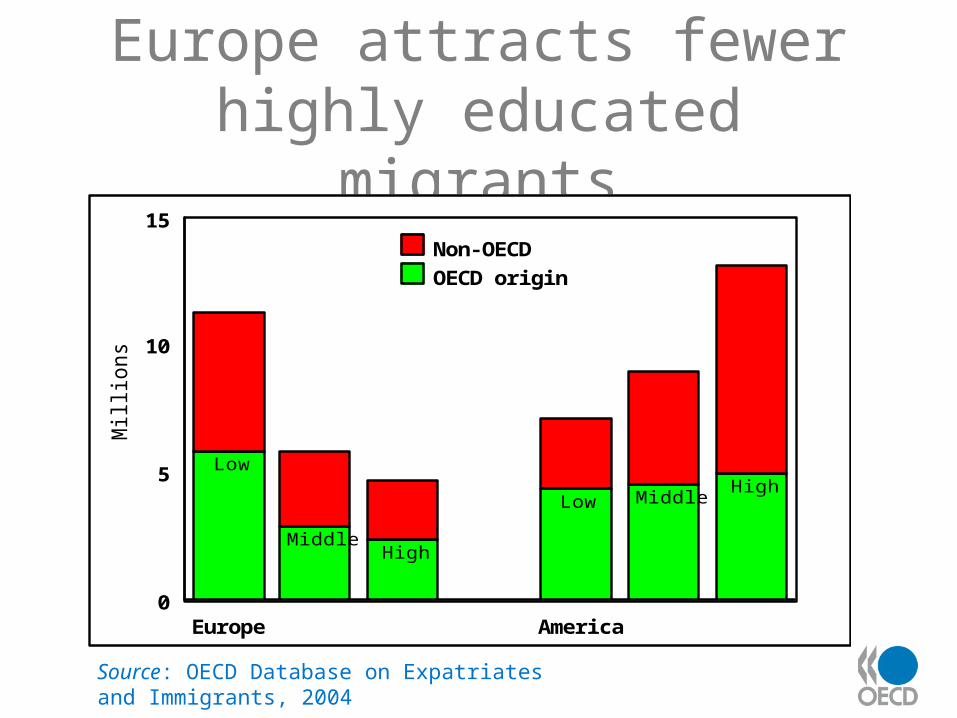
Europe attracts fewer highly educated migrants
Source: OECD Database on Expatriates and Immigrants, 2004
Low
MiddleHigh
Low MiddleHigh
Europe America0
5
10
15
Mill
ion
s
Non-OECD
OECD origin

Less-educated migrants don’t come from the poorest
countries
6 7 8 9 10 11
Log GDP per capita 2000
-6
-5
-4
-3
-2
-1
0
1
2
3
4
5
Lo
g lo
w s
kill
em
igra
tio
n r
ate
to
EU
Source: Data from OECD Database on Expatriates and Immigrants, 2004; WDI; authors’ analysis.

Percent of Tertiary Educated Population in OECD Countries
<2%<5%<10%<20%>20%
Source: OECD Database on Expatriates and Immigrants, 2004

Highly-Educated Migrants from Eastern and Central Europe
RussiaLatvia
MoldovaUkraine
HungaryPoland
RomaniaBelarusCroatia
Czech RepublicLithuania
AlbaniaSlovenia
EstoniaBosnia and Herzegovi
BulgariaSlovakia
Serbia and MontenegrMacedonia
0 20 40 60 80 100
Percent
Red: N America; Green: EU 15; Blue: other Europe; Yellow: Other

Estimates of the Irregular Migrant Stock
thousands % of pop. Year (years since
regularisation)
Japan 210 0.2 2005
United States 10 300 3.6 2004 (18)
Netherlands 125-230 0.8-1.4 2004
Spain* 690 1.6 2005 (4)
Italy 700 1.2 2002 (4)
Greece* 370 3.4 2001 (3)
Portugal 185 1.8 2001 (6)
Source: OECD 2005.
* = Subsequent regularisations not accounted for in these estimates.

Major developing country diasporas in the EU
Foreign-born or foreign (*) populationsSource: OECD International Migration Outlook 2006.
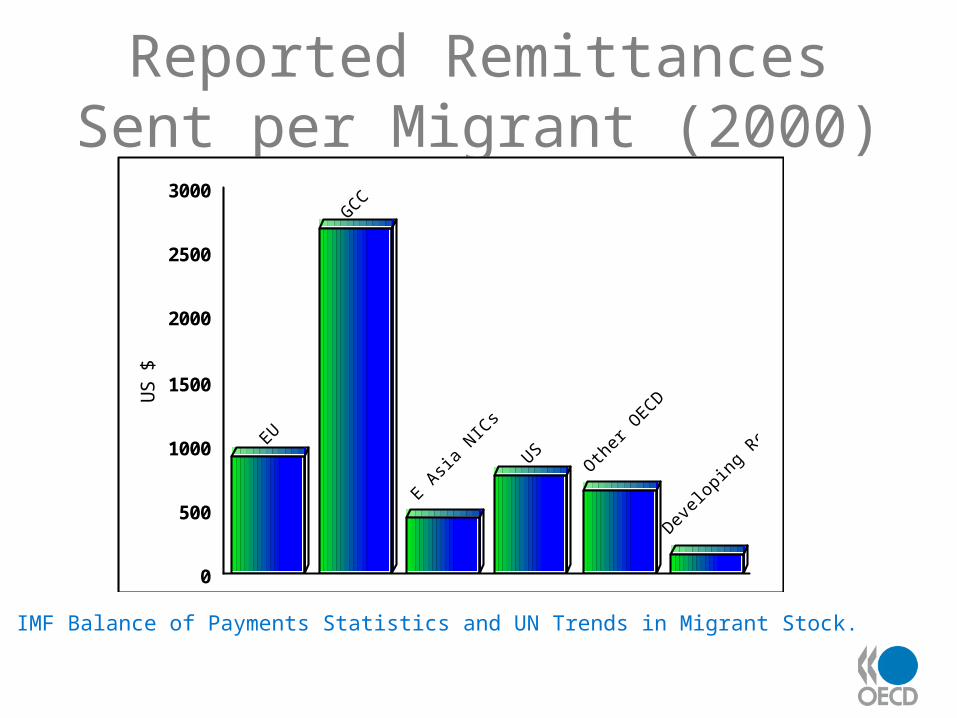
Reported Remittances Sent per Migrant (2000)
EU
GCC
E Asia
NIC
sUS
Other O
ECD
Develo
ping R
eg.
0
500
1000
1500
2000
2500
3000
US
$
Source: IMF Balance of Payments Statistics and UN Trends in Migrant Stock.

New Thinking: Benefits for All
• Goals of key stakeholders not necessarily at odds
• Gradual “devolution” of immigrant selection to employers, traffickers and migrants
• From “devolved selection” to an orderly, smart, flexibly regulated flow of legal migrants

What’s Old, What’s New, and Where We Need to Go
Dysfunctional dichotomies:• Permanent vs. temporary migrants• Economic vs. family-based migrants• High vs. low skilled migrants• Sending vs. receiving countries

Old and New Ways of Thinking and Acting on
MigrationTHE OLD• Wary of
“temporary” mobility
• Protects domestic labour markets
• Ignores migrants’ human capital
• Extends full benefits of social welfare
THE NEW • Recruits workers
that fill real needs• Provides early
access to work• Reforms
educational and training systems
• Experiments with new forms of social benefits

The Age of Mobility
• New tools (communication, monitoring, enforcement, reform)
• New relationships between public and non-governmental sectors
• New mechanisms for coherent policy making -- within and between Member States

Prerequisites for the New Mobility System
• Recapturing control of public perception of the migration system
• Addressing the admission/integration nexus
• The levels of governance issue: who should do what?
• Build effective partnerships with sending countries and diaspora networks

(1) Labour Market and Visa Policies for an Age of
Mobility1. Develop an Integrated Migration
Monitoring System2. Facilitate temporary and circular
migration (e.g. multi-year visas)3. Enable effective free movement within
the European Union4. Create opportunities for permanent
residence and citizenship5. Rethink Mode 4 to “organise the
market”

(2) Enabling Integration
1. Provide fair, equal and early access to labour markets
2. Support education, language and adult learning
3. Explore innovative models of citizenship, civic participation and EU multicultural citizenship

(3) Partnerships for Mobility Management and
Development1. Look at migration policies through
a development lens2. Integrate international migration
into development strategies3. Overhaul the organisation of
migration management4. Make policies more coherent for
more effective management

(4) Encouraging Diaspora Networks
1. Provide substantial funding to support migrant organisations and networks
2. Incorporate migrant organisations into the policy making process
3. Deepen co-development initiatives that work with migrant organisations to implement development co-operation policy

For more info: www.oecd.org/dev/migration

Thank you for your attention!Merci de votre attention !
Bedankt !