Embed Size (px)
Citation preview

GALLAGHER LONDON
Credit and Political RiskPRI Report & Market Update JULY 2013

Gallagher London Credit and Political Risks division comprises a well established group of highly experienced market practitioners with professional colleagues in Singapore, Sydney and New York.

1
Contents
Market Report – July 2013 2
Commercial Market Overview – July 2013 4
Available Market Capacity – July 2013 7
Total Capacity Available by Tenor – July 2013 8
Available Market Capacity Comparison 9
Trade Credit Insurance – July 2013 10
Emerging Markets Country Risk Ratings 12
Sub-Sahara Africa 12
Asia Pacific 13
Europe and CIS 13
Latin America and Caribbean 14
Middle East and North Africa 14
Arthur J. Gallagher & Co. 15
Credit and Political Risks Contact Details 16
The information contained in this PRI Report and Market Update has been compiled by Gallagher London from information provided by each insurer. The figures expressed reflect the theoretical maximum possible lines available which are dependent upon many underwriting factors including the nature of the risk, the country of risk and available country capacity at the time which may reduce the amount of capacity actually available and is subject to change without notice.
PRI Report and Market Update does not purport to be comprehensive or to give legal advice. While every effort has been made to ensure accuracy, Gallagher London cannot be held liable for any errors, omissions or inaccuracies contained within the document. Readers should not act upon (or refrain from acting upon) information in this document without first taking further specialist or professional advice.
2
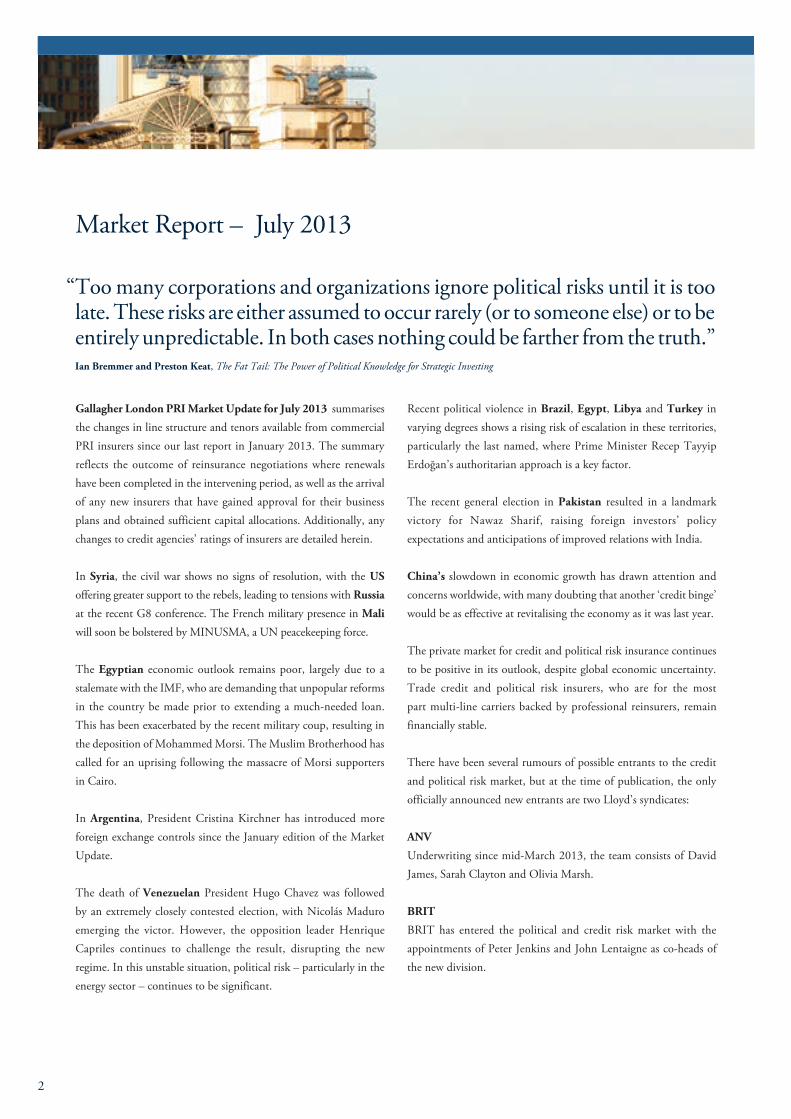
Market Report – July 2013
“ Too many corporations and organizations ignore political risks until it is too late. These risks are either assumed to occur rarely (or to someone else) or to be entirely unpredictable. In both cases nothing could be farther from the truth.” Ian Bremmer and Preston Keat, The Fat Tail: The Power of Political Knowledge for Strategic Investing
Gallagher London PRI Market Update for July 2013 summarises the changes in line structure and tenors available from commercial PRI insurers since our last report in January 2013. The summary reflects the outcome of reinsurance negotiations where renewals have been completed in the intervening period, as well as the arrival of any new insurers that have gained approval for their business plans and obtained sufficient capital allocations. Additionally, any changes to credit agencies’ ratings of insurers are detailed herein.
In Syria, the civil war shows no signs of resolution, with the US offering greater support to the rebels, leading to tensions with Russia at the recent G8 conference. The French military presence in Mali will soon be bolstered by MINUSMA, a UN peacekeeping force.
The Egyptian economic outlook remains poor, largely due to a stalemate with the IMF, who are demanding that unpopular reforms in the country be made prior to extending a much-needed loan. This has been exacerbated by the recent military coup, resulting in the deposition of Mohammed Morsi. The Muslim Brotherhood has called for an uprising following the massacre of Morsi supporters in Cairo.
In Argentina, President Cristina Kirchner has introduced more foreign exchange controls since the January edition of the Market Update.
The death of Venezuelan President Hugo Chavez was followed by an extremely closely contested election, with Nicolás Maduro emerging the victor. However, the opposition leader Henrique Capriles continues to challenge the result, disrupting the new regime. In this unstable situation, political risk – particularly in the energy sector – continues to be significant.
Recent political violence in Brazil, Egypt, Libya and Turkey in varying degrees shows a rising risk of escalation in these territories, particularly the last named, where Prime Minister Recep Tayyip Erdoğan’s authoritarian approach is a key factor.
The recent general election in Pakistan resulted in a landmark victory for Nawaz Sharif, raising foreign investors’ policy expectations and anticipations of improved relations with India.
China’s slowdown in economic growth has drawn attention and concerns worldwide, with many doubting that another ‘credit binge’ would be as effective at revitalising the economy as it was last year.
The private market for credit and political risk insurance continues to be positive in its outlook, despite global economic uncertainty. Trade credit and political risk insurers, who are for the most part multi-line carriers backed by professional reinsurers, remain financially stable.
There have been several rumours of possible entrants to the credit and political risk market, but at the time of publication, the only officially announced new entrants are two Lloyd’s syndicates:
ANV
Underwriting since mid-March 2013, the team consists of David James, Sarah Clayton and Olivia Marsh.
BRIT
BRIT has entered the political and credit risk market with the appointments of Peter Jenkins and John Lentaigne as co-heads of the new division.

3
The overall changes since the last report in January 2013 are identified in the following charts and reflect:
AIG: upgraded from A to A+ by S&P.
ANV: new entrant offering lines for CEN, CF and CR of USD 15m, USD 7.5m and USD 1.5m respectively over 5 years.
Atradius: no longer rated by S&P. Rated A(excellent) by A.M. Best and A3 by Moody’s.
CV Starr: recently underwent a divisional restructuring. Will no longer be offering CF and CR coded business to financial institutions. Increased lines for CEN from USD 40m to USD 50m for up to 10 years. Increased lines for CR from USD 20m to USD 25m for 5.5 years.
FCIA: included in this report for the first time, offering lines for CEN, CF and CR of USD 25m, USD 40m and USD 40m respectively over 7 years.
Ironshore: upgraded from A- to A by A.M. Best
The figures expressed reflect only the theoretical maximum possible lines available which are dependent upon many underwriting factors including the nature of the risk, the country of risk and available country capacity, but serve as a good indicator of commercial insurers’ support for these classes of business.
With a number of new entrants, the overall market capacity across Project Risks and Trade Risks Commercial continues to rise steadily. The total Lloyd’s of London capacity for Trade Risks
Political has fallen slightly.
In this Report we have included a ‘year to year’ 2012 - 2013 comparison of Country Risk Ratings from data provided by IHS Global Insight. We also include a brief review of the traditional multi-debtor credit insurance market.

ACE European Group Ltd* 100,000,000 10 80,000,000 10 30,000,000 5 AA- [S&P]
AIG 120,000,000 15 120,000,000 15 100,000,000 3 A+ [S&P]
Aspen* 70,000,000 7.75 70,000,000 7.75 70,000,000 7.75 A [S&P]
Atradius*** 93,000,000 7 93,000,000 7 93,000,000 7 A [A.M. Best]
Axis 50,000,000 7 50,000,000 7 35,000,000 7 A+ [S&P] ]
Catlin* 90,000,000 15 65,000,000 15 65,000,000 8 A [S&P]
CV Starr*† 50,000,000 10 40,000,000 10 25,000,000 5.5 A [A.M. Best]
Coface 70,000,000 10 70,000,000 7 70,000,000 7 AA- [Fitch]
Euler Hermes 0 0 100,000,000 8 100,000,000 8 AA- [S&P]
FCIA 25,000,000 7 40,000,000 7 40,000,000 7 A+ [S&P]
Garant** 33,000,000 7 33,000,000 7 33,000,000 7 A- [Fitch]
Houston Casualty 30,000,000 5 30,000,000 5 30,000,000 5 AA [S&P/Fitch]
Ironshore 40,000,000 7 40,000,000 7 40,000,000 7 A [A.M. Best]
Lancashire Insurance Ltd 200,000,000 10 75,000,000 10 0 0 A-[S&P]
LAU (AWAC) 8,000,000 5 20,000,000 5 20,000,000 5 A [S&P]
Liberty Mutual Insurance Europe Ltd 40,000,000 7 40,000,000 7 40,000,000 7 A- [S&P]
Markel International Insurance Company 0 0 20,000,000 5 120,000,000 3 A [Fitch]
Sovereign 80,000,000 15 80,000,000 15 0 0 AA- [S&P]
XL 75,000,000 10 75,000,000 10 50,000,000 7 A [S&P/Fitch]
Zurich 150,000,000 15 150,000,000 15 75,000,000 7 AA- [S&P/Fitch]
Total: ‘Company Markets’ 1,324,000,000 + 3.0% 1,291,000,000 +3.5% 1,036,000,000 +5.0%
Total: January 2013 1,285,000,000 1,247,000,000 987,000,000
4
Commercial Market Overview – July 2013
Insurer: Project Risks Trade Risks Political Trade Risks Ratings‘Company Markets’ (CEN) (CF) Commercial (CR)
(Highlights indicate changes since last report)
Total max Max Tenor Total max Max Tenor Total max Max Tenor per risk (years) per risk (years) per risk (years) (USD) (USD) (USD)
Notes:* Can be written via either their company or Lloyd’s syndicate.** Actual lines of EUR 25m, converted to USD for this report.*** Actual lines of EUR 70m, converted to USD for this report.† Insureds: Non-financial institution only for CF and CR.

ACE Global Markets*
Lloyd’s Syn 2488 100,000,000 10 80,000,000 10 30,000,000 5
Amlin
Lloyd’s Syn 2001 12,500,000 3 10,000,000 3 0 0
ANV
Lloyd’s Syn 1861 15,000,000 5 7,500,000 5 1,500,000 5
Ark
Lloyd’s Syn 4020 15,000,000 5.5 15,000,000 5.5 0 0
Ascot
Lloyd’s Syn 1414 15,000,000 5 10,000,000 5 0 0
Aspen*
Lloyd’s Syn 4711 45,000,000 7.75 45,000,000 7.75 45,000,000 7.75
Beazley
Lloyd’s Syn 623 40,000,000 7 40,000,000 7 25,000,000 7
Canopius
Lloyd’s Syn 4444 25,000,000 5.5 25,000,000 5.5 12,500,000 3
Catlin*
Lloyd’s Syn 2003 90,000,000 15 65,000,000 15 65,000,000 8
Chaucer
Lloyd’s Syn 1084 30,000,000 5 30,000,000 5 15,000,000 5
C V Starr
Lloyd’s Syn 1919*† 50,000,000 7 40,000,000 7 25,000,000 5
Hiscox
Lloyd’s Syn 33 25,000,000 5 25,000,000 5 25,000,000 5
Jubilee
Lloyd’s Syn 5820 15,000,000 7 15,000,000 7 10,000,000 7
5
Insurer: Project Risks Trade Risks Political Trade Risks ‘Lloyd’s Markets’ (CEN) (CF) Commercial (CR) [All Lloyd’s Markets rated A+ by S&P] Total max Max Tenor Total max Max Tenor Total max Max Tenor per risk (years) per risk (years) per risk (years) (USD) (USD) (USD)
Notes:* Can be written via either their company or Lloyd’s syndicate.† Insureds: Non-financial institution only for CF and CR.

6
Kiln
Lloyd’s Syn 510 60,000,000 5 40,000,000 5 40,000,000 5
Liberty Syn Mgmt
Lloyd’s Syn 4472 35,000,000 10 25,000,000 10 15,000,000 5
Marketform
Lloyd’s Syn 2468 20,000,000 5 20,000,000 5 10,000,000 5
MAP
Lloyd’s Syn 2791 20,000,000 3 20,000,000 3 0 0
Markel International*
Lloyd’s Syn 3000 0 0 20,000,000 5 50,000,000 3
Novae
Lloyd’s Syn 2007 25,000,000 5 25,000,000 5 20,000,000 5
O’Farrell
Lloyd’s Syn 1036 20,000,000 5 20,000,000 5 0 0
Pembroke
Lloyd’s Syn 4000 15,000,000 5 10,000,000 5 2,500,000 3
Talbot
Lloyd’s Syn 1183 30,000,000 5 30,000,000 5 15,000,000 5
XL*
Lloyd’s Syn 1209 75,000,000 10 75,000,000 10 50,000,000 7
Total: ‘Lloyd’s Markets’ 777,500,000 +2.0% 692,500,000 -0.4% 456,500,000 +0.3%
Total: January 2013 762,500,000 695,000,000 455,000,000
Insurer: Project Risks Trade Risks Political Trade Risks ‘Lloyd’s Markets’ (CEN) (CF) Commercial (CR) (Continued) Total max Max Tenor Total max Max Tenor Total max Max Tenor per risk (years) per risk (years) per risk (years) (USD) (USD) (USD)
Notes:* Can be written via either their company or Lloyd’s syndicate.† Insureds: Non-financial institution only for CF and CR .

7
Company 1,324,000,000 1,291,000,000 1,036,000,000
Lloyd’s 777,500,000 692,500,000 456,500,000
Total 1,741,500,000 +3.2% 1,658,500,000 +3.2% 1,227,500,000 +4.3%
Total: January 2013 1,687,500,000 1,607,000,000 1,177,000,000
Project Risks Trade Risks Political Trade Risks Commercial (CEN) (CF) (CR)
Notes:* Totals do not ‘double count’ the Company and Lloyd’s lines of ACE, Aspen, Catlin,
CV Starr and XL that can be written via either their Company or Lloyd’s syndicate
Available Market Capacity – July 2013
Available Market Capacity – July 2013
(Total possible maximum USD per risk)
(Total possible maximum USD million per risk)
0
200
400
600
800
1000
1200
1400
Lloyd's
Company
Trade Risks Commercial (Credit)Trade Risks Political (CF)Project Risks (CEN)
Cap
acity
Risk Type
1,324
778
1,291
693
1036
457

Cap
acity
Tenor Available (Years)
1,7421,659
1,228
1,6941,629
993
1,376
1,301
653
970
710
440 415
0
200
400
600
800
1000
1200
1400
1600
1800 Trade Risks Commercial (Credit)
Trade Risks Political (CF)
Project Risks (CEN)
1510753
8
15 440,000,000 415,000,000 0
10 970,000,000 710,000,000 0
7* 1,376,000,000 1,301,000,000 653,000,000
5** 1,694,000,000 1,628,500,000 992,500,000
3 1,741,500,000 1,658,500,000 1,227,500,000
Max tenor Project Risks Trade Risks Political Trade Risks Commercial (Years) (CEN) (CF) (CR)
* Aspen’s USD 70m can be extended to 7.75 years across all risks. Catlin can write to 8 years for Trade Risks Commercial (CR). Euler Hermes can write to 8 years for Trade Risks Political (CF) and Trade Risks Commercial (CR)
** Ark’s USD 15m can be extended to 5.5 years for Project Risks (CEN) and Trade Risks Political (CF). Canopius’ USD 25m can be extended to 5.5 years for Project Risks (CEN) and Trade Risks Political (CF)
Total Capacity Available by Tenor – July 2013
Total Capacity Available by Tenor – July 2013
(Total possible maximum USD per risk)
Total Capacity Available by Tenor - July 2013 (Total possible maximum USD million per risk)

9
Available Market Capacity Comparison(total possible maximum USD million per risk)September 2001 to July 2013
Project Risks (CEN)
Sep 01
Jan 02
Jan 03
Jan 04
Jan 05
Jan 06
Jan 07
Jul 07
Jan 08
Jul 08
Jan 09
Jul 09
Jan 10
Jul 10
Jan 11
Jul 11
Jan 12
Jul 12
Jan 13
Jul 13
Company 580 564 495 495 470 490 515 545 660 855 840 870 920 795 865 985 1015 1233 1285 1324
Lloyd’s 574 274 278 280 318 335 368 388 423 453 478 560 593 593 633 643 622 743 762 778
Total 1154 837 773 775 788 825 883 933 1083 1228 1238 1350 1348 1223 1293 1333 1382 1646 1688 1742
Trade Risks Political (CF)
Sep 01
Jan 02
Jan 03
Jan 04
Jan 05
Jan 06
Jan 07
Jul 07
Jan 08
Jul 08
Jan 09
Jul 09
Jan 10
Jul 10
Jan 11
Jul 11
Jan 12
Jul 12
Jan 13
Jul 13
Company 268 331 318 318 310 405 440 480 530 735 720 750 800 745 865 948 1085 1195 1247 1291
Lloyd’s 389 188 203 195 239 256 297 332 347 377 381 456 502 510 560 570 545 675 695 693
Total 657 519 520 513 549 661 737 812 877 1052 1041 1146 1157 1110 1240 1268 1420 1565 1607 1659
Trade Risks Commercial (CR)
Sep 01
Jan 02
Jan 03
Jan 04
Jan 05
Jan 06
Jan 07
Jul 07
Jan 08
Jul 08
Jan 09
Jul 09
Jan 10
Jul 10
Jan 11
Jul 11
Jan 12
Jul 12
Jan 13
Jul 13
Company - - 195 185 175 255 255 300 335 445 420 450 500 505 550 658 820 955 987 1036
Lloyd’s - - 73 87 79 103 167 190 208 238 251 307 346 341 353 658 338 453 455 457
Total - - 268 242 254 358 422 490 543 653 641 727 731 731 768 865 998 1158 1177 1228

10
Trade Credit Insurance – July 2013
2012 saw a strong performance from the three leading trade credit insurance companies: Euler Hermes, Coface and Atradius. Each increased profitability compared to previous year and supported their policyholders in all markets in spite of the continuing economic and political risk pressures faced by those involved in national and transnational trade.
This has been achieved through strong information-based underwriting in all markets, which has allowed for the preservation of capacity as well as active and plentiful risk appetite. This was in spite of the economic difficulties faced in numerous European markets, as well as in poorer sectors in the better performing markets, which experienced a number of insolvencies, including that of the Austrian construction group Alpine Holdings GmbH.
This information-based approach has enabled insurers to feel confident in supporting their clients, covering good risks in bad markets. Reinsurers have also remained faithful to the sector, with most programmes – monolines as well as the competitive excess of loss market – being oversubscribed.
Pricing across the various product lines has remained competitive, although the cost of capital has become more of an influence on the pricing mechanisms of insurers than in past years, with the balance of profitability and buyer exposure now being keenly considered.
The latest development from Atradius is the introduction of the ‘Cap’ product, which follows in the footsteps of first Euler Hermes and then Coface, both of whom have similar products of their own. The basic premise of the product is that if the insurer’s risk appetite on its policyholder’s standard policy is restricted, then the insurer will consider, as an add-on to that policy, an additional ‘top-up’ line of cover, proportional to the original limit, in return for additional premium at a considerably higher rate that the standard terms. This product is proving popular in the various markets into which it has been introduced. It could, however, be argued that in the multi-debtor world, if an insurer can write a higher limit then it should do so without this additional cost.

11
Main Trade Credit Insurers
ACE AA- - X X
AIG A+ X X X
Atradius A3 (Moody’s) X X X
CIFS* A+ X X -
Coface AA- (Fitch) X X X
Ducoire (ONDD) AA+ X X -
Equinox Global* A+ - X -
Euler Hermes AA- X X X
FCIA ** A+ X X X
HCC AA X X X
Ironshore A (AM Best) - X X
Latin American Underwriters*** A - X X
Liberty Mutual A- - - X
Lloyd’s A+ - X X
Markel A (Fitch) - X X
QBE* A+ X X X
XL A - - X
Zurich AA- X X X
Insurer Rating – S&P Ground Up Excess of Loss Single Risk (unless indicated)
* As per Lloyd’s of London** As per Great American Insurance*** As per AWAC

12
Emerging Markets Country Risk Ratings
The following pages analyse the Country Risk Ratings, compiled by IHS Global Insight, of various Emerging Markets. We compare the Overall Risk Ratings and the Political Risk Ratings as at the time of publication of this Market Report, and as at 1 January 2013. These countries have been selected from the International Monetary Fund’s World Economic Outlook for Emerging and Developing Economies, April 2010.
Risk Rating Risk Description
1.00 – 1.24 Insignificant
1.25 – 1.74 Negligible
1.75 – 1.99 Low
2.00 – 2.49 Moderate
2.50 – 2.99 Medium
3.00 – 3.49 Significant
3.50 – 3.99 High
4.00 – 4.49 Very High
4.50 – 5.00 Extreme
Overall Risk Ratings take into account six components: Political, Economic, Legal, Tax, Operational and Security. These ratings are principally measuring stability.
Political Risk Ratings analyse four factors:- Institutional performance- Representation of the population and organised interests- Internal political consensus- External political consensus
Sub-Sahara Africa
Burkina Faso 3.53 High 3.53 High 3.50 High 3.50 High
Côte d’Ivoire 3.95 High 4.10 Very High 4.00 Very High 4.00 Very High
Democratic 4.38 Very High 4.38 Very High 4.25 Very High 4.25 Very High
Republic of Congo
Ghana 2.65 Medium 2.68 Medium 2.75 Medium 2.75 Medium
Kenya 3.38 Significant 3.38 Significant 3.50 High 3.50 High
Liberia 3.78 High 3.84 High 3.75 High 3.75 High
Nigeria 3.94 High 3.94 High 4.00 Very High 4.00 Very High
Sierra Leone 3.73 High 3.86 High 3.50 High 3.50 High
South Africa 2.54 Moderate 2.54 Moderate 2.50 Moderate 2.50 Moderate
Tanzania 3.30 Significant 3.36 Significant 3.00 Significant 3.00 Significant
Overall Risk Overall Risk Political Risk Political Risk at 01 Jul 2013 at 01 Jan 2013 at 01 Jul 2013 at 01 Jan 2013

13
Asia Pacific
Cambodia 3.11 Significant 3.11 Significant 2.75 Medium 2.75 Medium
China 2.87 Medium 2.93 Medium 2.75 Medium 3.00 Significant
India 2.86 Medium 2.86 Medium 3.00 Significant 3.00 Significant
Indonesia 2.75 Medium 2.75 Medium 2.50 Medium 2.50 Medium
Laos 3.06 Significant 3.12 Significant 3.00 Significant 3.00 Significant
Pakistan 4.05 Very High 3.93 High 4.50 Extreme 4.25 Very High
Papua New Guinea 3.32 Significant 3.39 Significant 3.50 High 3.75 High
Philippines 2.78 Medium 2.78 Medium 2.75 Medium 2.75 Medium
Thailand 2.84 Medium 2.84 Medium 3.25 Significant 3.25 Significant
Vietnam 3.01 Significant 2.95 Medium 3.25 Significant 3.00 Significant
Overall Risk Overall Risk Political Risk Political Risk at 01 Jul 2013 at 01 Jan 2013 at 01 Jul 2013 at 01 Jan 2013
Europe and CIS
Belarus 3.58 High 3.58 High 3.75 High 3.75 High
Czech Republic 2.04 Moderate 2.04 Moderate 2.25 Moderate 2.25 Moderate
Greece 2.96 Medium 2.96 Medium 3.00 Significant 3.00 Significant
Kazakhstan 3.05 Significant 3.05 Significant 3.00 Significant 3.00 Significant
Kyrgyzstan 3.65 High 3.70 High 4.00 High 4.00 High
Poland 1.90 Low 1.90 Low 1.75 Low 1.75 Low
Romania 2.59 Medium 2.59 Medium 2.50 Medium 2.50 Medium
Russia 2.98 Medium 2.98 Medium 3.00 Significant 3.00 Significant
Slovakia 1.88 Low 1.88 Low 2.00 Moderate 2.00 Moderate
Ukraine 3.26 Significant 3.26 Significant 3.25 Significant 3.75 High
Overall Risk Overall Risk Political Risk Political Risk at 01 Jul 2013 at 01 Jan 2013 at 01 Jul 2013 at 01 Jan 2013

14
Latin America and Caribbean
Argentina 3.37 Significant 3.37 Significant 3.00 Medium 3.00 Medium
Bolivia 3.45 Significant 3.50 High 3.50 Medium 3.50 Medium
Brazil 2.63 Medium 2.63 Medium 2.50 Medium 2.50 Medium
Colombia 2.83 Medium 2.83 Medium 2.75 Medium 2.75 Medium
Dominican Republic 2.84 Medium 2.84 Medium 3.00 Significant 3.00 Significant
Ecuador 3.63 High 3.69 High 3.50 High 3.75 Very High
Guatemala 3.31 Significant 3.31 Significant 3.50 High 3.50 High
Nicaragua 3.49 Significant 3.55 High 3.50 High 3.75 High
Peru 2.95 Medium 2.95 Medium 3.25 Significant 3.25 Significant
Venezuela 3.86 High 3.86 High 4.00 Significant 4.00 Significant
Overall Risk Overall Risk Political Risk Political Risk at 01 Jul 2013 at 01 Jan 2013 at 01 Jul 2013 at 01 Jan 2013
Middle East and North Africa
Algeria 3.11 Significant 3.08 Significant 3.25 Significant 3.25 Significant
Bahrain 2.77 Medium 2.77 Medium 3.50 High 3.50 High
Egypt 3.44 Significant 3.32 Significant 3.75 High 3.75 High
Kuwait 2.65 Medium 2.65 Medium 3.25 Significant 3.25 Significant
Lebanon 3.27 Significant 3.16 Significant 3.75 High 3.50 High
Libya 3.91 High 3.84 High 4.00 Very High 4.00 Very High
Saudi Arabia 2.53 Medium 2.53 Medium 2.75 Medium 2.75 Medium
Tunisia 2.87 Medium 2.87 Medium 3.00 Significant 3.00 Significant
United Arab Emirates 2.20 Moderate 2.20 Moderate 2.25 Moderate 2.25 Moderate
Yemen 4.10 Very High 4.10 Very High 4.25 Very High 4.25 Very High
Overall Risk Overall Risk Political Risk Political Risk at 01 Jul 2013 at 01 Jan 2013 at 01 Jul 2013 at 01 Jan 2013

15
Arthur J. Gallagher & Co.
Founded in 1927, Arthur J. Gallagher & Co. is one of the largest international insuranceand risk management firms in the world. We employ almost 13,000 staff in 17 countriesand transact business in more than 110 countries.
Arthur J. Gallagher International has a truly global reach, with close to 2,500 broking staff, led and managed by highly-motivated market practitioners with a dedicated client focus.
Gallagher London
Gallagher London is one of the fastest-growing Lloyd’s brokers and a leading insurance intermediary with the capacity to handle a broad range of client needs – from large and complex multi-national business to small, single-territory professional firms. Gallagher London offers a full range of broking and risk management advisory skills and capabilities to meet client needs in countries across the globe.
Gallagher London is a trading name of Arthur J. Gallagher (UK) Limited which is authorised and regulated by the Financial Services Authority.
Credit and Political Risks Division
The Credit and Political Risks division comprises a well-established group of highly experienced market practitioners with professional colleagues in Singapore and Sydney as well as New York.
The combined resources offer the most comprehensive service that:− provides access to specialist London and international insurers
and reinsurers − covers the full range of Political Risks, Trade Credit, Terrorism
(including War and Political Violence) and Surety markets− is dedicated to structuring innovative insurance solutions that
go beyond transactional broking− has the resources and relationships to negotiate the most competitive
and appropriate terms− maintains the highest standards of documentation, management
accounting and claims collection
Gallagher London’s product offering includes all aspects of:
Credit Risks Political Risks Project Risks
Private buyer insolvency risks Risk to contracts Risks to project developers
Protracted default risks Risks to overseas assets Risks to lenders
Export or domestic credit risks Risks to receivables Currency transfer risks
Counterparty bank default risks Risks to revenues Political violence and war risks

16
Credit and Political Risks Contact Details
London
Kit Brownlees
Managing Director Direct: +44 (0)20 7204 8586 [email protected]
Mark Gubbins
Managing DirectorTel: +44 (0)20 3425 3194 [email protected]
Gallagher London 133 Houndsditch, London EC3A 7AHwww.ajginternational.com
Political and Project Risks
David Maule
Executive DirectorTel: +44 (0)20 7204 [email protected]
David Evans
Executive DirectorTel: +44 (0)20 7204 6156 [email protected]
Rupert Morgan
Executive DirectorTel: +44 (0)20 3425 [email protected]
Matthew Solley
Divisional DirectorTel: +44 (0)20 7204 [email protected]
Credit and Surety
Rupert Murray
Executive Director Tel: +44 (0)20 7204 8560 [email protected]
Genevieve Ahinful
Associate Director+44 (0)20 7204 [email protected]
Pamela Fox
Divisional Director Tel: +44 (0)20 3425 3192 [email protected]
Sam Brentnall
BrokerTel: +44 (0)20 7204 [email protected]
Political Violence, War and Terrorism
Singapore New York Sydney
Freddie Lim
Managing Director Tel: +65 6438 1771 [email protected]
Gabe Mansky
Executive Vice President Tel: +1 212 994 7068 [email protected]
Michael Woodward
Divisional ManagerTel: +61 2 9242 [email protected]


Gallagher London is a trading name of Arthur J. Gallagher (UK) Limited which is authorised and regulated by the Financial Services Authority. Registered address: 9 Alie Street, London, E1 8DE. Registered No. 1193013 England and Wales. www.ajginternational.com
CD3554_B/01012013