Embed Size (px)
Citation preview
BIA AND DODSCHOOLS
Student Achievementand OtherCharacteristics OftenDiffer from PublicSchools’
Report to Congressional RequestersUnited States General Accounting Office
GAO
September 2001
GAO-01-934
Page i GAO-01-934 BIA and DOD Schools
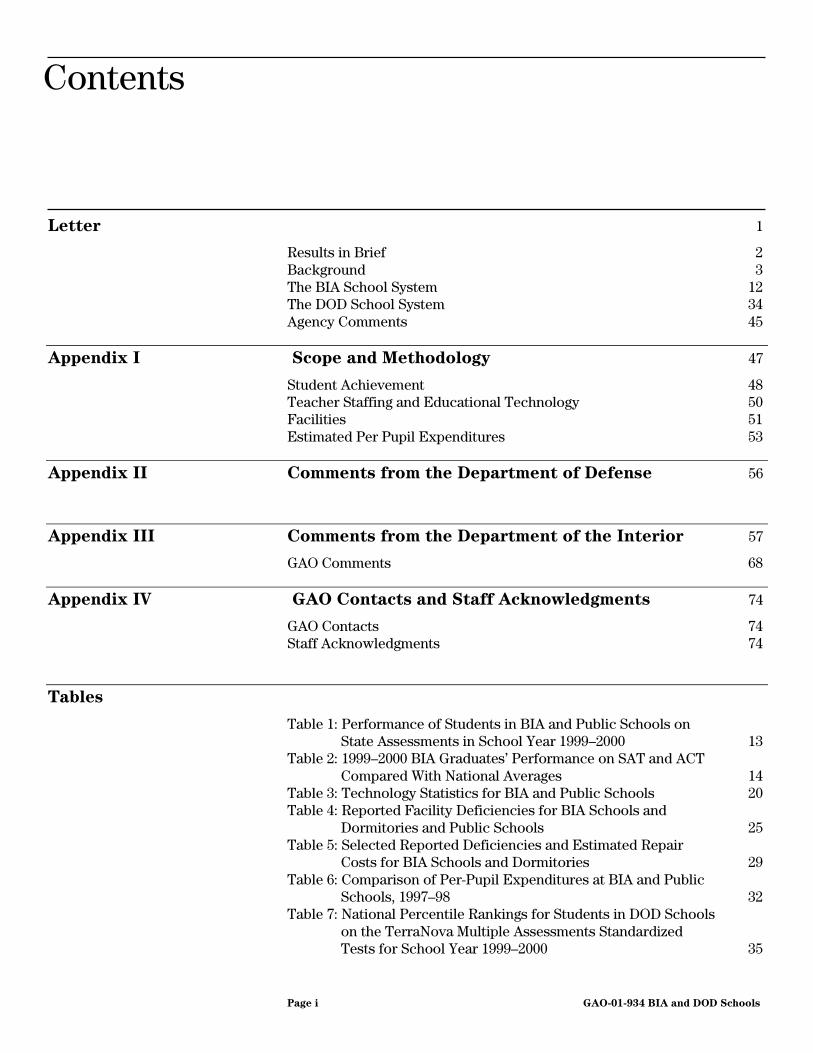
Letter 1
Results in Brief 2Background 3The BIA School System 12The DOD School System 34Agency Comments 45
Appendix I Scope and Methodology 47
Student Achievement 48Teacher Staffing and Educational Technology 50Facilities 51Estimated Per Pupil Expenditures 53
Appendix II Comments from the Department of Defense 56
Appendix III Comments from the Department of the Interior 57
GAO Comments 68
Appendix IV GAO Contacts and Staff Acknowledgments 74
GAO Contacts 74Staff Acknowledgments 74
Tables
Table 1: Performance of Students in BIA and Public Schools onState Assessments in School Year 1999–2000 13
Table 2: 1999–2000 BIA Graduates’ Performance on SAT and ACTCompared With National Averages 14
Table 3: Technology Statistics for BIA and Public Schools 20Table 4: Reported Facility Deficiencies for BIA Schools and
Dormitories and Public Schools 25Table 5: Selected Reported Deficiencies and Estimated Repair
Costs for BIA Schools and Dormitories 29Table 6: Comparison of Per-Pupil Expenditures at BIA and Public
Schools, 1997–98 32Table 7: National Percentile Rankings for Students in DOD Schools
on the TerraNova Multiple Assessments StandardizedTests for School Year 1999–2000 35
Contents

Page ii GAO-01-934 BIA and DOD Schools
Table 8: Average SAT and ACT Scores for DOD and Public SchoolStudents Graduating in 2000 36
Table 9: Median Class Sizes at DOD Schools 38Table 10: Technology Statistics for DOD and Public Schools 39Table 11: Reported Facilities Deficiencies for DOD and Public
Schools 42Table 12: Selected Reported Deficiencies and Estimated Repair
Costs for DOD Schools 44Table 13: Comparison of Per-Pupil Expenditures at DOD and
Public Schools, 1997–98 45
Figures
Figure 1: Locations of BIA Schools in School Year 1999–2000 4Figure 2: Locations of DOD Europe Area Schools in School Year
1999–2000 7Figure 3: Locations of DOD Pacific Area Schools in School Year
1999–2000 8Figure 4: Locations of DOD Domestic and Cuba Schools in School
Year 1999–2000 9Figure 5: Percentage of BIA Schools Reporting That a Majority of
Teachers Received Various Types of Training 17Figure 6: Percentage of BIA Schools Reporting That a Majority of
Teachers Assign Students Computer or Internet Work atLeast Once Per Week for Various Classroom Activities 22
Figure 7: Percentage of BIA Schools Reporting That Various WorkSpaces and Equipment Are Insufficient 27
Figure 8: Percentage of DOD Schools Reporting That a Majority ofTeachers Received Various Types of Training 37
Figure 9: Percentage of DOD Schools Reporting That a Majority ofTeachers Assign Students Computer or Internet Work AtLeast Once Per Week for Various Classroom Activities 40
Figure 10: Percentage of DOD Schools Reporting That VariousWork Spaces and Equipment Are Insufficient 43
Abbreviations
ACT American College TestAIMS Arizona Instrument to Measure StandardsAME Applied Management Engineering, Inc.BIA Bureau of Indian Affairs
Page iii GAO-01-934 BIA and DOD Schools
DOD Department of DefenseDODEA Department of Defense Education ActivityNAEP National Assessment of Educational ProgressNCES National Center for Education StatisticsNRC National Research CouncilOIEP Office of Indian Education ProgramsSAT Scholastic Assessment TestUSDA U.S. Department of Agriculture

Page 1 GAO-01-934 BIA and DOD Schools
September 28, 2001
The Honorable Robert C. ByrdThe Honorable Ben Nighthorse CampbellThe Honorable Byron L. DorganThe Honorable Daniel K. InouyeUnited States Senate
The federal government has direct responsibility for two school systemsserving elementary and secondary students—the Bureau of Indian Affairs(BIA) and the Department of Defense (DOD) school systems. Unlikepublic schools, where federal funding constitutes a small portion of totalresources, the BIA and DOD school systems depend almost entirely onfederal funds. Although the two school systems have this feature incommon, their histories and settings are quite different. Because theseschool systems are a federal responsibility, the Congress is interested inensuring that children attending BIA and DOD schools are receiving aquality education.
To better understand the quality of the educational environments in BIAand DOD schools, you asked us to provide information about severalaspects of both school systems. Our study provides information on studentacademic performance, teacher staffing, access to educational technology,the condition of facilities, and expenditure levels for each system. Thisstudy also provides comparative data for public schools when these datawere available.
The scope of our review included BIA day schools and boarding schools,and DOD schools located both in the United States and overseas. To theextent possible, we excluded from our analyses BIA peripheraldormitories on reservations—which house Indian students who attendnearby public schools—because they generally do not have academicprograms. Information for this review was gathered primarily from agencydata obtained from BIA and DOD, and from a mail survey ofadministrators at all BIA and DOD schools covering the 1999–2000 schoolyear. Survey response rates were 81 percent and 92 percent for BIA andDOD schools, respectively. We also obtained data on student performanceon achievement tests and college entrance examinations from states andcollege testing organizations for students in BIA schools. Data needed toprecisely compute per-pupil expenditures for both BIA and DOD schoolswere not available. Therefore, our calculations are estimates based on BIAand DOD agency data and federal expenditure information from tribal
United States General Accounting Office
Washington, DC 20548

Page 2 GAO-01-934 BIA and DOD Schools
audit reports submitted under the Single Audit Act. We also conducted sitevisits to nine BIA schools located in South Dakota, Arizona, Minnesota,and Washington, and seven DOD schools located at three militaryinstallations in the United States—Maxwell Air Force Base, in Alabama;and Fort Benning and Robins Air Force Base, in Georgia. For furtherdetails about our scope and methodology, see appendix I. We did notverify information collected for this study but obtained supportingdocumentation where appropriate. We conducted our work between June2000 and July 2001 in accordance with generally accepted governmentauditing standards.
The academic achievement of many BIA students as measured by theirperformance on standardized tests and other measures is far below theperformance of students in public schools. BIA students also scoreconsiderably below national averages on college admission tests.Academic performance has been strongly associated with educational andincome levels of parents, and students in BIA schools often come fromfamily settings where education, employment, and earning levels are lowerthan the national average. BIA school administrators indicate that nearlyall BIA teachers are fully certified for the subjects or grade levels theyteach, although several officials said that some schools experienceconsiderable difficulties recruiting and retaining qualified staff. In terms ofeducational technology, access levels to computers and the Internetreported by BIA school administrators exceeded those of public schools,but technical support to maintain computers and to assist teachers withusing technology in the classroom was more limited than in publicschools. Problems with school facilities were reported by many schooladministrators. For example, administrators at more than 60 percent ofresponding BIA schools reported having at least one building ininadequate condition compared with about a quarter of administrators atpublic schools surveyed by the Department of Education (Education) in1999. Finally, our estimated per-pupil expenditures for BIA schools varywidely by school type (for example, day or boarding), but are generallyhigher than for public schools nationally. A number of factors distinguishBIA schools from public schools, which may add to their costs. Forexample, a high proportion of BIA students have special needs, and BIAschools support a broader infrastructure (such as sewer and watersystems) than most public schools.
The academic achievement of DOD students, as measured by theirperformance on standardized tests and their plans for enrolling in college,generally exceeds that of elementary and secondary students nationwide.
Results in Brief

Page 3 GAO-01-934 BIA and DOD Schools
On college admission tests, DOD students score at or near nationalaverages. DOD school administrators indicated that nearly all theirteachers are fully certified for the subjects or grade levels they teach, andabout two-thirds have advanced degrees. Access levels to computers andthe Internet reported by these administrators were better than publicschools, and nearly all administrators reported that technical support isavailable in their school. Many DOD school administrators reported someproblems with their school facilities, but overall the conditions of theirbuildings did not vary greatly from those reported by public schools in1999. Our estimated per-pupil expenditures at DOD schools locatedoverseas were higher than expenditures for those located in the U.S. DODrecords show that a substantial part of the difference is related to movingand housing costs for teachers and staff in overseas schools. DOD’sdomestic schools, which generally do not have these expenses, are muchcloser to national per-pupil expenditures.
The BIA and DOD school systems are unlike public school systems in anumber of ways and are also distinct from each other. Information on theschools, the students and families they serve, the settings in which theyoperate, and other fundamental aspects of these systems helps put ourfindings into context.
BIA schools serve less than 10 percent of all Indian students enrolled inelementary and secondary schools in this country.1 In school year 1999–2000, the total enrollment was 47,080 students in the 1712 schools fundedby BIA. BIA schools are located in 23 states; however, over 70 percent ofthe schools are in four states—Arizona, New Mexico, North Dakota, andSouth Dakota (see fig. 1). The schools are located primarily in rural areasand small towns and serve Indian children living on or near reservations.Individual school enrollments range in size from 14 to over 1,000 students,but a little over half of the schools enroll fewer than 250 students; most arecombined schools spanning both elementary and secondary grades. A
1According to the National Center for Education Statistics (NCES), approximately 541,000American Indian/Alaska Native children were enrolled in public elementary and secondaryschools in the 50 states and the District of Columbia in school year 1999–2000.
2 In addition, BIA supports 14 peripheral dormitories which served 1,689 children in schoolyear 1999-2000. Two of the 14 peripheral dormitories offered kindergarten-only programs inschool year 1999-2000. We considered peripheral dormitories to be outside the scope ofthis report and excluded them from our analyses where possible.
Background
BIA Schools

Page 4 GAO-01-934 BIA and DOD Schools
unique feature of the BIA school system is that almost one-third of theschools have a residential component; that is, they board at least a portionof the students who attend the school. In total, about 17 percent of BIAstudents reside in school dormitories. Some students board because theirhomes are so far away or inaccessible that daily transportation isimpractical. However, an increasing proportion of students reside in thedormitories for other reasons; for example, some students live in boardingschools to separate them from dysfunctional or severely impoverishedhome environments.
Figure 1: Locations of BIA Schools in School Year 1999–2000
Source: Data are from BIA’s Office of Indian Education Programs. School locations are indicated bystars, but some stars represent more than one school.
Education programs and activities of BIA schools are administered by theBIA’s Office of Indian Education Programs (OIEP); however, in general,the organization of BIA schools is highly decentralized. Each school is

Page 5 GAO-01-934 BIA and DOD Schools
governed by its own independent school board, which has authority overfunctions such as hiring personnel, adopting budgets, and setting policy.Another important aspect of the BIA school system is the agency’s supportand encouragement of tribal control of school programs. In school year1999–2000, 108 schools, or about two-thirds of all BIA-funded schools,were operated by tribes or tribal organizations under grants, contracts, orcompacts with BIA; the remainder were operated by BIA.
In fiscal year 2001, BIA received a total of $777.6 million to support theoperations of its schools and address educational facility needs.3 Thisrepresented a substantial (30 percent) increase over fiscal year 2000funding levels. Nearly all of the increase was for repair or replacement ofschool facilities; funding for school operations increased only moderately. 4
Like many public schools, BIA schools also receive funding fromEducation programs, such as Title I and Safe and Drug Free Schools andCommunities. Funds from these programs are provided to BIA and passedthrough to schools.5 Fiscal year 2000 funding from Education programstotaled $132 million. BIA schools also participate in the U.S. Department ofAgriculture’s (USDA) child nutrition programs, such as the NationalSchool Lunch and Breakfast programs, which provide free or reduced-price meals for children living in families earning below certain incomelevels.
DOD operates schools for the children of military and civilian DODpersonnel overseas and on certain military bases in the United States.6 Intotal, DOD operated 224 elementary and secondary schools in school year1999–2000, with an enrollment of almost 108,000 students. A little over
3Funding for BIA schools comes primarily from two BIA appropriations: Operation ofIndian Programs and Construction.
4Funding for school facilities repair and replacement—which comprises a smaller portionof BIA’s education budget—increased by 121 percent. Funding for school operations, themajority of the budget, increased by about 5 percent. Taken together these increases infiscal year 2001 raised funding 30 percent over the previous year.
5Under an agreement with Education, BIA receives flow through funds for severalEducation programs and is permitted to retain 1.5 percent of these funds to performadministrative responsibilities similar to those performed by state education agencies.
6The schools are organized into two separate but parallel systems: Department of DefenseDependents Schools overseas, and the Department of Defense Domestic DependentElementary and Secondary Schools in the United States. We refer to schools in bothsystems as DOD schools.
DOD Schools
Page 6 GAO-01-934 BIA and DOD Schools
two-thirds of DOD schools are located overseas, concentrated in severalcountries in Europe and in Japan, Korea, and Cuba (see figs. 2 and 3).About 74,280 students were enrolled in DOD overseas schools in schoolyear 1999–2000.7 The domestic schools are located on military bases inseven states concentrated in the Southeast and in Guam and Puerto Rico(see fig. 4) and enrolled about 33,690 students in school year 1999–2000.8
Individual school enrollments range in size from 32 to over 1,300 in thetwo DOD systems, with the median school size being about 450 students.According to a DOD official, nearly all eligible children of military parentsoverseas attend DOD schools. However, most children of military parentsin the U.S. attend public schools. DOD officials estimate that about 15percent of school age military dependents in total attend DOD schoolsabroad and in the United States.
7In addition, DOD pays tuition for about 2,080 eligible students overseas to attend non-DODschools in countries where no DOD schools are available.
8In addition, DOD pays tuition and/or transportation costs for approximately 2,085 DODstudents enrolled in public schools operated by the local education agency in four states.

Page 7 GAO-01-934 BIA and DOD Schools
Figure 2: Locations of DOD Europe Area Schools in School Year 1999–2000
Source: Data are from DODEA 1999–2000 Accountability Report. (Arlington, Va.: Department ofDefense Education Activity (DODEA)). Some locations may have more than one school.
A F R I C A
E U R O P E
A T L A N T I C
O C E A N

Page 8 GAO-01-934 BIA and DOD Schools
Figure 3: Locations of DOD Pacific Area Schools in School Year 1999–2000
Source: Data are from DODEA 1999–2000 Accountability Report. Some locations may have morethan one school.
A S I A
P A C I F I C
O C E A N

Page 9 GAO-01-934 BIA and DOD Schools
Figure 4: Locations of DOD Domestic and Cuba Schools in School Year 1999–2000
Source: Data are from DODEA 1999–2000 Accountability Report. Some locations may have morethan one school.
Cuba
Guam Puerto Rico

Page 10 GAO-01-934 BIA and DOD Schools
Education programs and activities of DOD schools are managed anddirected by the Department of Defense Education Activity (DODEA). Theoverseas and domestic schools are organized into 24 districts, eachmanaged by a superintendent and other district staff, such as curriculumcoordinators and maintenance supervisors.
In fiscal year 2001, DOD schools received a total of $1.3 billion to supportschool operations and address facility needs.9 Overall, this representedlevel funding since fiscal year 2000, although funding for school operationsand maintenance rose slightly while funding for school constructiondecreased. DOD schools are not authorized to receive grants from federalprograms, including those administered by Education; however, DODschools do participate in the USDA child nutrition programs.
While the federal government has responsibility for both the BIA and DODschool systems, the two systems are very distinct from each other,particularly with respect to the types of students and families they serve.The proportion of students who have special needs is much higher in BIAschools than DOD schools. For example, according to agency records,about 1 in every 5 BIA students is enrolled in special education, comparedwith 1 in every 12 DOD students; and nearly 60 percent of BIA studentshave limited English proficiency compared with just 6 percent of DODstudents. Students in the two systems also differ in terms of theireconomic need. Eligibility for the USDA’s free or reduced-price lunchprograms is often used as an indicator of poverty. While data on theproportion of children eligible for free or reduced-price lunch were notcomplete for BIA schools, available data for 123 of the 171 schools showedthat over 80 percent of students were eligible, compared with about one-third of students at DOD schools.
Specific information on the education levels and employment status ofparents of BIA and DOD students was not available, but other informationsuggests significant differences between the two. For example,unemployment on or near Indian reservations is very high—over 40percent in 1999. In contrast, students attending DOD schools are generallymilitary dependents and, by virtue of that fact, have at least one parent
9Funding for DOD schools comes from Military Construction Appropriations, Defense-Wide; and Defense Appropriations—Operations and Maintenance, Defense-Wide, andProcurement, Defense-Wide.
Characteristics of BIA andDOD Students and TheirFamilies Differ

Page 11 GAO-01-934 BIA and DOD Schools
who is employed. With respect to education, about one-third of Indianadults do not have high school diplomas, according to Census Bureau datafor 1990; in contrast, nearly all DOD active military personnel havecompleted high school. Moreover, a number of factors can affect parentalinvolvement in BIA schools, including long distances between home andschool, language barriers, and parents’ poor associations with schools dueto past federal policies emphasizing the assimilation of Indian children. Incomparison, military communities have a tradition of supporting militaryfamilies, and this support extends to their schools. Parental involvement ishighly emphasized in DOD schools, with some base commands providingrelease time to military personnel to volunteer in schools.
At various times, the Congress has considered the question of whetherthere is a need for BIA and DOD schools in locations where public schoolsystems are close by. Since 1794, when the first treaty providing for anyform of Indian education was signed, the federal government has providededucation services for Indian children, and has carried it out almostexclusively through the BIA. However, in the 20th century, the statesbegan providing for Indian education and currently provide schooling forthe majority of Indian elementary and secondary students. During thelatter part of the 1970s, the Congress reviewed the need to constructcertain BIA schools close to public schools to determine if BIA wasproperly ranking schools on its school construction list. Though Indianfamilies can choose where to send their children to school, BIA’s policy atthat time was to have children attend nearby public schools with adequatefacilities instead of building new BIA schools to serve these students.However, in 1988, the Congress decided that proximity to a public schoolcould not be the primary reason for rejecting a BIA school constructionproject.
The need for DOD domestic schools also has been reviewed a number oftimes, specifically to determine whether transferring schools to nearbypublic school districts is feasible. DOD domestic schools were establishedto provide education to military children in communities where the localschools were deemed unable to provide a suitable education. After 1950,schools were added to the system to allow military children to attendintegrated schools in locations where local schools remained segregated.Since that time, however, more and more schools have been transferred topublic school districts, in part because of the integration of public schoolsand Education’s emphasis on state and local responsibility for theeducation of military children. Thus, while at one time there were about100 installations with DOD-operated schools, now there are 14 located in
Need for BIA and DODSchools

Page 12 GAO-01-934 BIA and DOD Schools
the 50 states. According to a DOD official, most children of militaryparents in the U.S. attend public schools.
The academic achievement of many BIA students falls far below that ofpublic school students. As in most public schools, nearly all BIA teachersare certified and class sizes in BIA schools are smaller than nationalaverages, even though officials report some difficulty recruiting staff. BIAstudents have greater access to computers and Internet connections thanpublic school students generally, though a smaller proportion of BIAschools than public schools has technology support staff to maintainequipment and assist teachers in integrating technology into classrooms.BIA administrators report extensive facilities problems and agencyrecords show a deferred maintenance and repair backlog approaching $1billion. Estimated per-pupil expenditures vary widely among differenttypes of BIA schools, such as boarding schools and day schools, and arehigher than per-pupil expenditures at public schools. It is difficult to drawconclusions about differences in expenditure levels between BIA andpublic schools, in part because of cost factors that affect some BIAschools, such as higher proportions of students who have special needs,broader infrastructure responsibilities, longer distances to transportchildren, and the cost of residential programs in boarding schools.
In school year 1999–2000, BIA students scored far below public schoolstudents on state assessments in North Dakota, South Dakota, andArizona—three states with large numbers of BIA schools.10 As shown intable 1, the average national percentile rankings for BIA students on NorthDakota’s statewide assessment, for all grades and subject areas tested,ranged from the 25th to the 33rd percentiles in school year 1999–2000. (Bydefinition, the national average on the norm-referenced tests used in NorthDakota and South Dakota is the 50th percentile.) The correspondingaverages for public school students in North Dakota ranged between the64th and 71st percentiles. Similarly, in South Dakota, the average nationalpercentile rankings for BIA students on South Dakota’s statewideassessment were much lower than the averages for public school students
10We were able to obtain data for all BIA schools in North Dakota and South Dakota and for19 of the 50 BIA schools in Arizona that participated in the state’s assessment program.About 36 percent of all BIA students attend the schools to which our data relate. Data werenot available for BIA schools in New Mexico, which has about one-quarter of all BIAstudents.
The BIA SchoolSystem
Academic Performance ofMany BIA Students isBelow That of PublicSchool Students
Page 13 GAO-01-934 BIA and DOD Schools
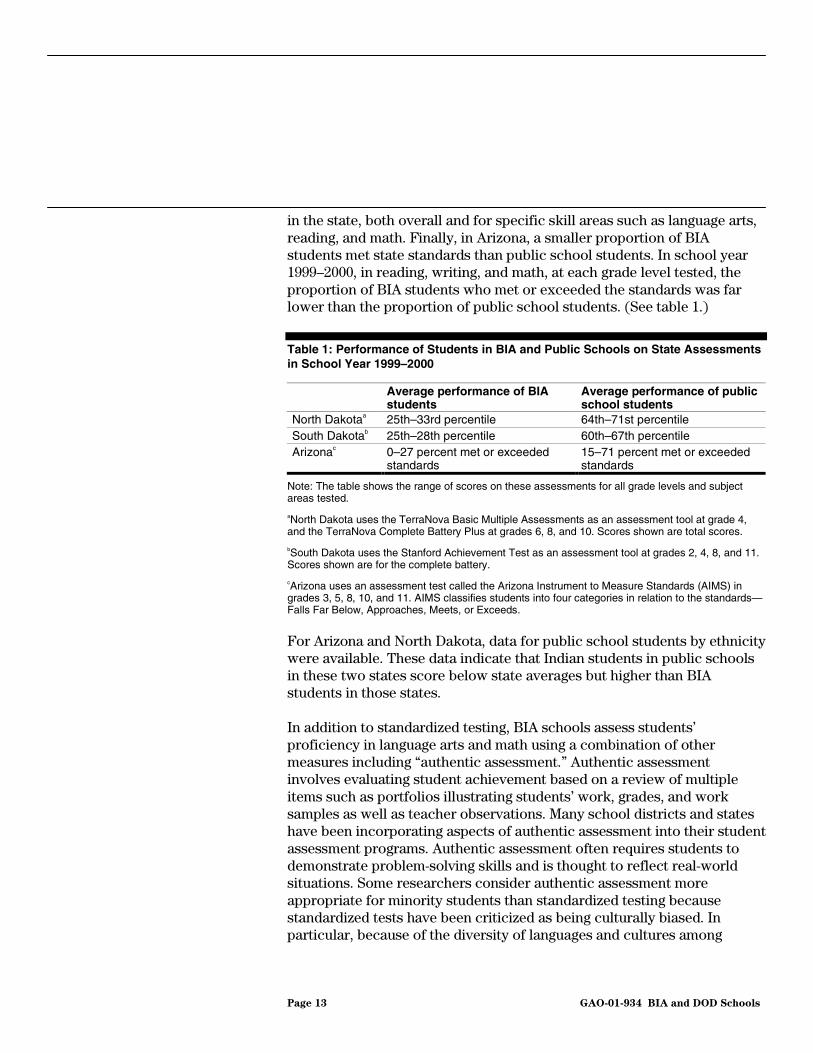
in the state, both overall and for specific skill areas such as language arts,reading, and math. Finally, in Arizona, a smaller proportion of BIAstudents met state standards than public school students. In school year1999–2000, in reading, writing, and math, at each grade level tested, theproportion of BIA students who met or exceeded the standards was farlower than the proportion of public school students. (See table 1.)
Table 1: Performance of Students in BIA and Public Schools on State Assessmentsin School Year 1999–2000
Average performance of BIAstudents
Average performance of publicschool students
North Dakotaa 25th–33rd percentile 64th–71st percentileSouth Dakotab 25th–28th percentile 60th–67th percentileArizonac 0–27 percent met or exceeded
standards15–71 percent met or exceededstandards
Note: The table shows the range of scores on these assessments for all grade levels and subjectareas tested.
aNorth Dakota uses the TerraNova Basic Multiple Assessments as an assessment tool at grade 4,and the TerraNova Complete Battery Plus at grades 6, 8, and 10. Scores shown are total scores.
bSouth Dakota uses the Stanford Achievement Test as an assessment tool at grades 2, 4, 8, and 11.Scores shown are for the complete battery.
cArizona uses an assessment test called the Arizona Instrument to Measure Standards (AIMS) ingrades 3, 5, 8, 10, and 11. AIMS classifies students into four categories in relation to the standards—Falls Far Below, Approaches, Meets, or Exceeds.
For Arizona and North Dakota, data for public school students by ethnicitywere available. These data indicate that Indian students in public schoolsin these two states score below state averages but higher than BIAstudents in those states.
In addition to standardized testing, BIA schools assess students’proficiency in language arts and math using a combination of othermeasures including “authentic assessment.” Authentic assessmentinvolves evaluating student achievement based on a review of multipleitems such as portfolios illustrating students’ work, grades, and worksamples as well as teacher observations. Many school districts and stateshave been incorporating aspects of authentic assessment into their studentassessment programs. Authentic assessment often requires students todemonstrate problem-solving skills and is thought to reflect real-worldsituations. Some researchers consider authentic assessment moreappropriate for minority students than standardized testing becausestandardized tests have been criticized as being culturally biased. Inparticular, because of the diversity of languages and cultures among

Page 14 GAO-01-934 BIA and DOD Schools
Indian students, some educators have found these authentic assessmentmethods more useful. These assessments are reported annually by all BIA-funded schools. Using authentic assessment approaches, about half of BIAstudents have been assessed as proficient or advanced, in both math andlanguage arts, each year over the last 3 years.
Other measures often used as indicators of students’ academic successinclude dropout rate, college admissions test scores, and the proportion ofstudents planning to attend college. On these measures, BIA studentsperform less well than public school students. For example, in their annualreports, BIA high schools report dropout rates—the proportion of highschool students who leave school and do not enroll in another schoolduring the year—averaging about 10 percent. This is higher than thenational average dropout rate (about 5 percent) and slightly higher thandropout rates for other ethnic minority groups. In addition, BIA studentsscore significantly below national averages on college admission tests. Asshown in table 2, BIA students who take the Scholastic Assessment Test(SAT) and the American College Test (ACT)—two widely used collegeentrance examinations—score below students nationally in bothverbal/English and math assessments. They also score below studentsfrom low-income families on these tests. Finally, in our survey, BIA schoolofficials estimated that about 28 percent of their graduates planned onenrolling in college after graduation, about evenly split between 4-year and2-year colleges. Nationally, in 1999, a little less than two-thirds of highschool graduates were enrolled in college the year after they completedhigh school—about 40 percent in 4-year colleges and 24 percent in 2-yearcolleges. For students from low-income families, the percentage who wereenrolled in college the year after they graduated was around 50 percent.
Table 2: 1999–2000 BIA Graduates’ Performance on SAT and ACT Compared WithNational Averages
SAT scoresa ACT scoresb
Verbal Math English MathBIA students 383 382 14.7 15.9National average 505 514 20.5 20.7
Note: A small number of BIA seniors (fewer than 70) take the SAT. Far more BIA students (about800) take the ACT because BIA schools are located in areas of the country where the ACT is thepredominant college admission test.
aData provided by the College Board.
bData provided by the American College Testing Service.

Page 15 GAO-01-934 BIA and DOD Schools
While the academic achievement of BIA students is low relative tostudents nationally, to some extent the performance of BIA students maybe associated with conditions that are beyond a school system’s control.Higher student outcomes have been strongly associated with highereducational and income levels of parents. BIA students come fromenvironments where family education levels are low and unemploymentand poverty rates are high. For example, 1990 Census Bureau data showthat one-third of Indians age 25 or older do not have high school diplomascompared with one-quarter of all adults nationally; and for Indians livingon reservations or trust lands, the proportion of adults who are not highschool graduates is over 45 percent. Indians living on or near reservationsalso experience high rates of unemployment. Data from BIA’s Indian LaborForce Report show that 43 percent of the potential labor force living on ornear reservations remained unemployed in 1999. Poverty rates are alsohigh among Indian families, with 27 percent having incomes below thepoverty level, compared with 10 percent of all families. Other data suggestthat the proportion of families with incomes below the poverty level iseven higher for those living on reservations and trust lands. Finally, theissue of alcohol and substance abuse is significant for Indian communities;the death rate due to alcoholism is about 7 times higher for Indians thanfor all races. Parental substance abuse has been identified as anenvironmental risk factor associated with learning problems, learningdisabilities, and developmental delays in children. In a previous Educationsurvey, almost 60 percent of BIA teachers considered parental alcohol ordrug abuse a serious problem in their schools, compared with about 13percent of teachers in public schools with low Indian student enrollment.11
BIA officials noted that the agency has developed programs to begin tomoderate the influences of economic and family conditions on students’academic performance. These include early childhood and family literacyprograms as well as a therapeutic residential model aimed at achievingpositive changes in attitude, behavior, and the academic performance ofstudents attending boarding schools. In addition, in its AnnualPerformance Plan, BIA has established several goals that address studentacademic performance. These goals concern student proficiency inlanguage arts and math, student attendance, teacher proficiency in newassessments and technology, school accreditation, and number of degrees
11NCES, Characteristics of American Indian and Alaska Native Education: Results From
the 1990–91 and 1993–94 Schools and Staffing Surveys, NCES 97-451 (Washington D.C.:U.S. Department of Education, March 1997).

Page 16 GAO-01-934 BIA and DOD Schools
conferred on Indian students at tribally controlled community colleges andat BIA’s two post-secondary schools.12
According to the National Center for Education Statistics (NCES), one ofthe major elements that characterizes teacher quality is teacherpreparation and qualifications. This refers to certification, education, andcontinuing learning. Results from our survey indicate that nearly allteachers in BIA schools were certified in school year 1999–2000. Typically,about 95 percent of teachers in BIA schools were fully certified in thesubjects or grades they taught and another 3 percent had temporary orprovisional certification. About 92 to 93 percent of public school teachersin general were fully certified in the subjects they taught.13 Teachers inBIA-operated schools were slightly more likely to be fully certified thanteachers in tribally operated schools. In addition to certification, teachersare being encouraged to pursue advanced degrees in order to gain a moreadvanced understanding of their discipline. About one-fourth of teachersin BIA schools had advanced degrees, compared to about 46 percent ofpublic school teachers generally.14 The proportion of teachers withadvanced degrees in BIA-operated schools was about 33 percent, while intribally operated schools it was about 21 percent.
BIA teachers have access to various kinds of professional developmentand BIA schools support professional development in several ways. Forexample, 93 percent of the BIA schools that responded to our surveyreported that the majority of their teachers received in-service trainingprovided by the school during the 1999–2000 school year. Other types oftraining widely used included in-service training provided by the agencyand workshops provided by professional associations, as shown infigure 5.
12 BIA receives funds for two post-secondary schools: Haskell Indian Nations Universityand the Southwestern Indian Polytechnic Institute.
131998 data as reported in The Condition of Education 2000, Table 47-3, NCES(Washington, D.C.: U.S. Department of Education, June 2000).
141998 data from Fast Response Survey System as reported in The Condition of Education
2000, Table 47-1, NCES (Washington, D.C.: U.S. Department of Education, June 2000).
Teacher Staffing at BIASchools Is Comparable toThat of Public SchoolsDespite Some RecruitingDifficulties

Page 17 GAO-01-934 BIA and DOD Schools
Figure 5: Percentage of BIA Schools Reporting That a Majority of Teachers Received Various Types of Training
Source: GAO survey.
BIA schools facilitate their teachers’ professional development in a varietyof ways. The following supports were each reported by nine out of tensurvey respondents: permitting time off to participate in training, settingdays aside for training, paying travel or per diem for training, and payingtuition or fees. Such training and supports for professional developmentare comparable to the situation for public school teachers generally,nearly all of whom report having some professional development in theprevious year with similar kinds of support from their schools.15
While nearly all teachers at BIA schools were certified, officials at someschools we visited, particularly tribally operated schools, recounted somedifficulties recruiting and retaining qualified staff. At one tribally operatedschool in Washington, the chief school administrator said it was difficultto attract teachers because the school could not compete with
15NCES, Schools and Staffing Survey, 1993–94, a national sample survey (Washington,D.C.: U.S. Department of Education).
0 10 20 30 40 50 60 70 80 90 100
College Courses in Teaching Methodsor Assessment
College Courses in Subject Matter
Professional Association Workshop
In-Service Provided by Agency
In-Service Provided by School 93
66
38
11
13
Percentage of Schools
Type of Training

Page 18 GAO-01-934 BIA and DOD Schools
compensation packages offered by nearby urban districts.16 The 2000–2001school year was the first year the school was able to pay teachers at thestate salary scale, but the school offered limited retirement benefits. As aresult, the administrator said the school tended to attract beginningteachers or retired teachers who had pensions from their public schoolcareers. Other officials noted that the remote locations of some schoolshinder recruiting. Many BIA schools are located in settings with fewamenities to attract teachers and other staff. For example, at one schoolwe visited in Arizona, the closest town offering major shopping andbanking services was 96 miles away, and the principal said thecommunity’s isolation and lack of amenities contributed to teacherturnover. In many locations, basic housing is not even available for staff topurchase or rent, so BIA has constructed employee quarters for whichstaff pay rent. About one-third of all BIA schools and 45 percent oftribally operated schools had teacher turnover rates of 25 percent orhigher in school year 1999–2000; the average turnover rate was 18 percent.Nationwide, about 87 percent of full-time public school teachers remain atthe same school from one year to the next, implying a turnover rate ofabout 13 percent.17
A teacher’s ability to effect student learning may be influenced by thenumber of students in the classroom, and various studies have associatedsmaller class sizes with higher student achievement. Class sizes reportedby BIA administrators are generally smaller than national averages, withtribally operated schools reporting smaller classes than BIA-operatedschools. Nationally, in 1998 the average class size for general elementaryclassrooms was 23 students and in departmentalized settings (those inwhich a teacher’s main assignment is in one particular subject area, suchas English or social studies) it was 24 students.18 The median number ofstudents per classroom reported by BIA-operated schools was about 20 to22 in grades K through 8 and about 17 in grades 9 through 12. Triballyoperated schools had about 17 to 18 students per classroom in grades K
16BIA-operated schools use a uniform salary schedule comparable to the salary scheduleused by the Department of Defense. This was implemented in part in an effort to recruitand retain quality staff. However, tribally operated schools determine salariesindependently and there are no summary data available about their teachers’ salaries.
17NCES, Schools and Staffing Survey, 1993–94 and Teacher Follow-up Survey, 1994–95
(Washington, D.C.: U.S. Department of Education).
18NCES, Teacher Quality: A Report on the Preparation and Qualifications of Public
School Teachers, NCES 1999-080 (Washington, D.C.: U.S. Department of Education, Jan.1999). Departmentalized settings are most often at the secondary level.

Page 19 GAO-01-934 BIA and DOD Schools
through 6 and about 16 students per classroom in grades 7 through 12. Oursurvey did not ask specifically about multiple grades in a classroom.However, some BIA schools are very small and have fewer full-timeteachers than grade levels taught in the school. For example, there are fiveBIA schools with 51 or fewer students in grades ranging from K to 6 and Kto 12. Four of these five schools have fewer full-time teachers than thenumber of grades in the school, suggesting that multiple grades are beingtaught in some classrooms.
BIA schools appear to be in step with schools around the country inmaking technology available as an integral tool for learning. Based on oursurvey results, BIA students have greater access to computers than publicschool students nationwide. BIA administrators reported having about 1instructional computer for every 3.5 students overall, although accesslevels varied somewhat from school to school, ranging from 1 computerfor every student to 1 computer for every 18 students. In comparison, thenational average for public schools is 1 computer for every 5 students, asreported by NCES for 2000.19 A major goal set by Education is that schoolshave 1 modern multimedia computer for every 5 students.20 We do notknow about the quality or capacity of the computers in BIA or publicschools, but 46 percent of the computers in BIA schools were reported tobe 3 years old or older.
In some respects BIA schools provide their students with greater access tothe Internet than public schools. According to a BIA official, all 171 BIAschools are connected to the Internet. Nationally, nearly all public schoolsnow have Internet access. However, BIA school officials reported that 1computer with Internet access was available for every 4.3 students, a ratioappreciably better than the 1 to 7 ratio for public schools nationwide.Some policymakers have stressed the importance of not only connectingevery school to the Internet but eventually connecting every classroom. Alittle over 80 percent of BIA instructional rooms have at least onecomputer with a connection to the Internet. This number is also slightlyabove the national average for public schools. However, as with somepublic schools, some BIA schools still use the lowest-speed connections
19NCES, Internet Access in U.S. Public Schools and Classrooms: 1994–2000, NCES 2001-071 (Washington, DC: U.S. Department of Education, May 2001).
20U.S. Department of Education, 1999 Performance Report and 2001 Annual Plan
(Washington, D.C.: 2000).
Access to Computers andthe Internet Reported byBIA Schools Is GreaterThan Public Schools, butTechnology Support IsMore Limited

Page 20 GAO-01-934 BIA and DOD Schools
for their primary connection to the Internet, and thus cannot accesscomplex computer applications and resources. Table 3 summarizes theinformation on students’ access to technology at BIA schools based on oursurvey and for public schools nationally.
Table 3: Technology Statistics for BIA and Public Schools
BIAschoolsa
Publicschoolsb
Number of students per instructional computer 3.5 5Number of students per instructional computer with Internetaccess
4.3 7
Percentage of schools connected to the Internet 100 98Percentage of instructional rooms with Internet access 81 77Percentage of schools using dial-up connections to the Internetc 10 11
aData for BIA schools come from GAO’s survey, with the exception of the percentage of schoolsconnected to the Internet, which was provided by a BIA official. Data represent technology access inBIA schools at the time of our survey, which was administered in Nov. 2000.
bPublic school data are for school year 1999–2000 and come from NCES’ Internet Access in U.S.Public Schools and Classrooms: 1994–2000, NCES 2001–071 (Washington, D.C.: U.S. Departmentof Education, May 2001).
cOther types of connections schools may be using include dedicated line, cable modem, and wirelessconnection.
While computers and the Internet are generally available at BIA schools, asmaller proportion of the schools have paid (versus volunteer) technologysupport staff than public schools. In a survey conducted by Education,nearly all (95 percent) of public schools reported having some paid staff,either full- or part-time, to support advanced telecommunications (forexample, networked computers and computer hardware and software) intheir school in 1999. In our survey, we asked whether schools had (1) staffwho provided technical support or performed maintenance on computersand (2) staff who assisted teachers in using computer software or theInternet to instruct students. The results indicated that more than one-quarter of BIA schools did not have paid technical support and about one-third did not have paid staff to help teachers use computers for instructionin 2000. Evidence suggests that technology support of this kind has apositive impact on teacher use of technology in the classroom.21 Accordingto an NCES report, research in general shows that public school teachers
21A. Ronnkvist, S. Dexter, and R. Anderson, Technology Support: Its Depth, Breadth, and
Impact in America’s Schools, Teaching, Learning and Computing: 1998 National Survey
(Irvine, Calif.: June 2000).

Page 21 GAO-01-934 BIA and DOD Schools
view the lack of technology support for integrating telecommunicationsinto the classroom and the lack of technical assistance in schools to beobstacles to their effective use of technology.22 Our survey results showthat these areas of support are not available in many BIA schools. Onereason why technology staff is more limited in BIA schools, according toone BIA official, is that the high turnover rate for technology coordinatorsis a problem throughout the BIA school system. He indicated that thesetechnology coordinators often receive training for the work and then leavethe schools for higher-paying positions.
BIA school administrators reported that their computers are usedregularly for learning activities. Although there is evidence to suggest thatthe effective use of technology in the classroom can improve studentlearning, the research on what types of classroom activities are bestserved by technology applications is not conclusive.23 Nonetheless, studieson the uses of technology in schools tend to distinguish more basic uses ofcomputers—such as for drill and practice, which the research shows canbe effective for learning—from more pedagogically complex uses ofcomputers—such as using the Internet in small groups for class projects,where the research data are less extensive. In our survey, we asked schooladministrators to estimate the portion of their teachers who routinelyengaged their students in the use of computers for certain activities. Asshown in figure 6, many of the teachers at BIA schools regularly engagestudents in the use of computers for practice drills and for learning subjectmatter. Fewer BIA teachers are using them on a regular basis for studentresearch or to develop student skills in problem solving.
22NCES, Teachers’ Tools for the 21st Century, A Report on Teachers’ Use of Technology,NCES 2000-102 (Washington, D.C.: U.S. Department of Education, Sept. 2000).
23H. Wenglinsky, Does It Compute? The Relationship Between Educational Technology
and Student Achievement in Mathematics (Princeton, N.J.: Educational Testing Service,Sept. 1998).

Page 22 GAO-01-934 BIA and DOD Schools
Figure 6: Percentage of BIA Schools Reporting That a Majority of Teachers Assign Students Computer or Internet Work atLeast Once Per Week for Various Classroom Activities
Source: GAO survey.
BIA schools appear to be making substantial investments in schooltechnology. Administrators reported to us that in 1999–2000 they spent anaverage of $401 per student to support educational technology in theirschools. In comparison, according to a national survey, public schooldistricts planned to spend $113 per student on educational technology inthe 2000–2001 school year.24 These expenditures covered all aspects ofsupporting educational technology, such as purchasing computerhardware and software, installing and upgrading local and wide areanetworks, paying for technical support and training for teachers, andpaying for telecommunications access.
24Quality Education Data, Inc., Technology Purchasing Forecast 2000–2001, 6th Edition
(Denver, Colo.: 2000).
0 10 20 30 40 50 60 70 80 90 100
Problem Solving or Data Analysis
Research
Learning Subject Matter
Computer Applications
Practice Drill Work 40
38
52
32
17
Percentage of Schools
Classroom Activities

Page 23 GAO-01-934 BIA and DOD Schools
Most of the BIA school administrators responding to our survey reportedsignificant problems with the condition of their facilities. They notedproblems with specific building features, such as roofs and plumbing, andwith certain environmental conditions, such as indoor air quality. Inaddition, they indicated that work spaces for teachers and students, suchas classrooms and libraries, were insufficient. The extent of the concernsthey reported in the survey are reflected in BIA’s backlog of maintenanceand repair needs. Among the backlog of such needs, which was recentlyverified by an independent engineering firm, is more than $960 million inneeded repairs for school facilities and dormitories. A contributing factorto the facility needs of BIA schools is their isolation. Many schools arelocated in remote areas where, in addition to maintaining school buildingsand grounds, facilities managers must also maintain other components ofthe infrastructure such as water and sewer systems, electric utilities, andfire stations—systems normally provided by local municipalities for mostpublic schools. The Congress has recently increased funding used toaddress the backlog. However, budget allocations for the maintenance andrepair of facilities have generally been less than amounts recommended bynational guidelines.
Compared to an earlier survey of administrators in public schools,significantly more BIA school administrators responding to our surveyreported that the overall condition of their buildings and specific buildingfeatures was inadequate. As shown in table 4, administrators at 65 percentof BIA schools reported that one or more of their school buildings was inless-than-adequate condition and 76 percent of boarding schools reportedthe same for their dormitory buildings.25 In comparison, in a 1999Education survey on the condition of public school buildings,26
administrators at about one-quarter of public schools reported that one ormore of their buildings was in less-than-adequate condition. Looking back
25Our survey asked school administrators to rate the condition of original buildings,attached or detached permanent additions to original buildings, and temporary buildingssuch as portables or trailers.
26NCES, Condition of America’s Public School Facilities: 1999, NCES 2000-32(Washington, D.C.: U.S. Department of Education, June 2000).
Extensive Problems WithBIA School FacilitiesReported
BIA School Buildings, Features,and Work Spaces Reported ToBe Less Than Adequate

Page 24 GAO-01-934 BIA and DOD Schools
to reported conditions in 1994, the conditions of both BIA and publicschools appear to have generally improved.27
Administrators also reported that specific features of school buildings anddormitories, such as the plumbing system or roof, needed substantialrepair or replacement. Overall, more than 70 percent of responding BIAschools reported that one or more of the features of school buildings wasin less-than-adequate condition and 87 percent of boarding schoolsreported the same for dormitory buildings. In contrast, administrators athalf of public schools reported that one or more of the features in theirschool buildings was inadequate. As shown in table 4, for many of thefeatures listed, BIA administrators were at least twice as likely as publicschool administrators to report that their school buildings and dormitorieshad inadequate building features.
27GAO conducted a survey of public school and BIA school building conditions in 1994. Ourcurrent survey (2000) asked questions similar to those used in our 1994 survey andEducation’s 1999 survey of public schools. For results from our previous study, see School
Facilities: Condition of America’s Schools (GAO/HEHS-95-61, Feb. 1995) and School
Facilities: Reported Condition and Costs to Repair Schools Funded by the Bureau of
Indian Affairs (GAO/HEHS-98-47, Dec. 1997). It should be noted that the results of our1994 study of BIA schools reflect the reported conditions of responding schools; surveyresponse rates were too low (41 percent) to permit generalization to all BIA schools.

Page 25 GAO-01-934 BIA and DOD Schools
Table 4: Reported Facility Deficiencies for BIA Schools and Dormitories and Public Schools
Percentage of schools reporting inadequacyBuilding deficiencies BIA schoolsa BIA dormitoriesa Public schoolsb
Onsite school buildingsOne or more buildings in less-than-adequate condition (original buildings,additions to original buildings, and temporary buildings)
65 76 24
Features of onsite buildingsOne or more inadequate building features 72 87 50 Roofs 48 50 22 Framing, floors, foundation 41 61 14 Exterior walls, finishes, windows, doors 49 57 24 Interior finishes, trim 39 58 17 Plumbing 47 66 25 Heating, ventilation, air conditioning 54 76 29 Electric power 43 66 22 Electrical lighting 34 65 17 Safety features such as sprinklers, fire alarms, smoke detectors 37 53 20
aSource: GAO survey.
bSource: NCES, Condition of America’s Public School Facilities: 1999, NCES 2000–32 (Washington,D.C.: U.S. Department of Education, June 2000).
Administrators responding to our survey also indicated that someenvironmental conditions were a problem in their schools. For example,over 40 percent reported unsatisfactory indoor air quality, acoustics ornoise control, or physical security in their buildings. Administrators atover 70 percent of responding boarding schools reported the same fordormitory buildings. In comparison, these environmental conditions werea problem for 20 percent or less of public schools in 1999.
During our site visits, school officials indicated various problems withtheir school buildings. For example, the principal of a school inWashington said that in one portable classroom building the roof andwindows leaked, and in two buildings there was a continuous problemwith mold in the walls, which was difficult to control due to the wetclimate. She said that the mold was a health problem for children withcertain allergies. In a South Dakota school, a teacher expressed concernsabout aging asbestos floor tiles in her classroom that had to be partiallyremoved due to cracking, leaving other tiles exposed. Asbestos floor tiles,which are present in more than 90 of BIA’s schools, can be a threat to the

Page 26 GAO-01-934 BIA and DOD Schools
health of students and staff if the asbestos fibers are disturbed, releasedinto the air, and inhaled.28
In addition to questions about the condition of buildings and aspects oftheir environment, our survey asked administrators about the sufficiencyof work spaces for students and teachers, such as classrooms, libraries,labs, and eating areas. We also asked whether some of these work spaceswere adequately equipped—for example, whether libraries had sufficientnumbers of books or whether buildings were adequately wired to supporttechnology needs. As shown in figure 7, many BIA school administratorsresponding to our survey reported that various work spaces andequipment were insufficient at their school. For example, administratorsat 55 percent of responding schools reported that the number ofclassrooms was insufficient and over 60 percent reported the space intheir libraries was a problem. Insufficient classroom space was noted byofficials at some schools we visited. For example, at a large K–12 school inSouth Dakota, officials said that the number of students in the high schoolbuilding exceeded capacity. According to school officials, the building wasintended to house 250 students, but they currently had about 400 studentsenrolled. In an Arizona school, because there was no other space, theschool held special education classes in an area previously used forstorage and teachers used partitions to separate the different groups ofstudents.
28Asbestos is a fibrous mineral that was used widely from the 1950s through the early 1970sin construction materials, such as shingles for roofing and siding, pipe and boilerinsulation, floor tiles, ceiling panels, coatings, and gaskets. It is present in most BIA schoolsin the form of floor tiles and/or insulation. A danger occurs when tiny asbestos fibers arereleased into the air and can be inhaled or swallowed, increasing the potential forconditions such as lung cancer.

Page 27 GAO-01-934 BIA and DOD Schools
Figure 7: Percentage of BIA Schools Reporting That Various Work Spaces and Equipment Are Insufficient
Source: GAO survey.
A large proportion of BIA schools (60 percent) also reported that thecapacity of the building’s telephone and electrical wiring systems tosupport computers, the Internet, and telephones was inadequate for theirbuildings. For BIA schools with insufficient telephone and electricalwiring, the age of the buildings may be a factor. Almost half of thebuildings are more than 30 years old and almost 15 percent are between 50and 100 years old. The principal of an Arizona school built in the 1930ssaid that most of the electrical wiring in the school is original and as newtechnology has been added, they have had frequent problems with systemoverloads. He said that this is likely to get worse as more new technologyis added.
0 10 20 30 40 50 60 70 80 90 100
Telephone and Electrical Wiring
Size of Eating Area
Number of Science Labs
Number of Computer Labs
Number of Library Books
Library Space
Size of Classrooms
Number of Classrooms 55
29
62
64
38
31
44
60
Percentage of Schools
Work Space and Equipment

Page 28 GAO-01-934 BIA and DOD Schools
Administrators’ concerns about the condition of their facilities arereflected in the BIA backlog of deferred maintenance and repairs.29 Thisbacklog is a catalog of deficiencies—related to buildings, surroundinggrounds, and other infrastructure—identified by architects, engineers,facilities managers, and safety officers over the years. The inventorydescribes in detail individual work items required in schools to meetnational standards and codes such as the Uniform Building Code andNational Fire Codes. The backlog contains a description of the work thatneeds to be done and the estimated cost for each item. The deficienciesmay involve safety and health, access for persons with disabilities, ornoncompliance with building codes. Recently, BIA’s backlog was validatedby an independent engineering firm.30 According to BIA officials andrepresentatives from the engineering firm, this process included on-siteinspections of each BIA school building. Based on their inspections, theengineers validated current projects and their cost estimates, removeditems that had already been addressed, and added new deficiencies theyidentified.
As of February 2001, BIA’s backlog for educational facilities totaled $962million31—an increase of almost $270 million (in current dollars), or 39percent, since October 1997.32 Table 5 shows estimated costs from BIA’sbacklog to address deficiencies related to certain building features at BIAschools. BIA school administrators often indicated problems with thesefeatures in our survey. For example, the cost to address all deficiencies
29Maintenance is generally defined as the upkeep of property and equipment and includesthe adjustment, cleaning, or lubrication of equipment; replacement of parts; painting; andother actions to assure continuing service and prevent breakdown. Deferred maintenanceis maintenance that was not performed when it should have been or when it was scheduledto be and which, therefore, is put off or delayed for a future period. Repair is work torestore damaged or worn-out property to a normal operating condition. Repairs arecurative, while maintenance is preventive.
30The review of BIA’s backlog was conducted by Applied Management Engineering, Inc.(AME). In addition to the validation of the backlog, AME developed a process for BIA toensure the consistency and quality of information going into the backlog. AME is alsoconducting a study on the adequacy of operations and maintenance funding for BIAschools and an assessment of their facilities with respect to educational program needs,according to AME’s general manager.
31According to a BIA official, in some cases, the backlog may include both the deficienciesfor a certain building and the estimated cost for planning, design, and/or construction toreplace that same building.
32See School Facilities: Reported Condition and Costs to Repair Schools Funded by
Bureau of Indian Affairs (GAO/HEHS-98-47, Dec. 31, 1997).
BIA Reports Needing MoreThan $960 Million To AddressEducational FacilitiesDeficiencies but Funding HasBeen Increasing

Page 29 GAO-01-934 BIA and DOD Schools
related to heating, ventilation, and air conditioning systems in schoolstotaled more than $63 million at the time of this review. Administrators atmore than half of the schools responding to our survey indicated problemswith these systems. One school we visited in Arizona did not have acentral cooling system, so each classroom had an air conditioner orevaporative cooling unit. The principal said the units were quite old and sonoisy that they disrupted the students’ learning environment.33
Table 5: Selected Reported Deficiencies and Estimated Repair Costs for BIASchools and Dormitories
Building features often indicated asinadequatea
Estimated cost to repair relateddeficiencies b (dollars in millions)
Heating, ventilation, air conditioning $63.2Plumbing 31.6Roofs 24.5
aSource: GAO survey.
bSource: BIA backlog data as of February 2001.
More than $127 million of the backlog total represents deficiencies relatedto the health and safety of students, and a significant portion of this ($44million) relates to fire safety alone. For example, the backlog listsbuildings at more than 100 schools that need to have their fire alarmsystems replaced or upgraded because they are old, not working, ormissing. At one school we visited, the facilities manager said that the firealarm system on the school campus was no longer reliable, and that it wasso old that buying replacement parts was becoming difficult. With respectto sprinkler systems, the BIA Chief of Safety and Risk Management saidthat it is BIA’s goal to have sprinkler systems and smoke detectors in alldormitories to ensure the safety of the residents. However, at the time ofour review, the backlog showed that more than half of the 54 boardingschools’ dormitories needed sprinkler systems either to be installed orupgraded. None of the boarding schools we visited had sprinkler systemsin student dormitories. In addition, a dormitory at one school was closeddue, in part, to fire-related safety deficiencies, according to the schoolsuperintendent.
33Some studies have concluded that school facility conditions, such as inadequateventilation, faulty heating systems, and excessive noise, can affect student learning as wellas the health and morale of staff and students. However, overall, the research isinconclusive and many scholars say that more research is needed to establish a linkbetween school facility conditions and student performance.

Page 30 GAO-01-934 BIA and DOD Schools
A contributing factor to BIA school facility needs and the backlog is thatBIA schools have to support a more extensive infrastructure than mostpublic schools. Because many BIA schools are located in isolated areas,they maintain their own water and sewer systems, electric utilities, firestations, and other important services that are generally provided to publicschools by municipalities. Among the 171 BIA schools and 14 peripheraldormitories, 146 sites (79 percent) had responsibility for maintaining somekind of water infrastructure such as wells, water distribution lines, and/orwater treatment facilities; 138 (75 percent) had responsibility for sewerinfrastructure, such as sewage lagoons and sewage lines; and 52 schools(30 percent) operated and maintained fire trucks.
BIA officials indicated that providing and maintaining this additionalinfrastructure was a considerable drain on resources. For example, at a K–8 school we visited in Arizona, the facilities manager said that his staffmust maintain a water system that includes five wells with distributionlines, pumps, pump houses, and water storage tanks; a sewer system thatincludes sewer lines, a lagoon, and a lift station; a fire station, fire truck,and hydrants; and a landfill. The facilities manager said the school haschronic problems with the sewer system, and an independent engineeringfirm has recommended that the sewer mains and service lines be replaced.For water and sewer systems alone, deficiencies in BIA’s backlog foreducational facilities totaled almost $56 million.
BIA’s infrastructure also includes dormitory facilities for boardingstudents and housing for staff and their families. In total, BIA schoolssupport 157 dormitory buildings for students and 1,879 single-familyquarters and 194 apartment buildings for employees. However, we did notinclude employee housing in the scope of our study because the rent paidby staff is meant to cover the upkeep of these facilities.
Funding from BIA’s construction budget that is used largely to address thebacklog was increased substantially by the Congress last year. Thisfunding more than doubled from $40 million in fiscal year 2000 to $110million in fiscal year 2001. BIA uses this funding to support a wide range offacility-related activities, including minor projects, such as thereplacement of boiler systems, and major projects, such as thereplacement of a natural gas line or the renovation of a school officebuilding. In addition, the Congress provided even greater increases forreplacement school construction the last 2 years. Funding rose from $17million in fiscal year 1999 to $141 million in fiscal year 2001. This fundingcan reduce the backlog when new facilities are constructed to replace
Page 31 GAO-01-934 BIA and DOD Schools
those that cannot accommodate current education programs or arebeyond repair.
While funding has increased during the last few years for certain facility-related line items in BIA’s budget, we attempted to look more closely atfunding available specifically for maintenance and repair needs.Adequately funding maintenance and repair is important because deferralof these tasks can increase the backlog. One guideline set forth by theNational Research Council (NRC)34 considers maintenance and repairbudgets in terms of the current replacement value of buildings.35 The NRChas recommended that budget allocations for routine maintenance andrepair be in the range of 2 to 4 percent of the current replacement value ofbuildings.36
Using NRC’s definitions, we extracted and combined pieces of BIA’sbudget to identify funding available for the maintenance and repair ofbuildings and other infrastructure and determined that funding levels werebelow those recommended by the NRC. From 1997–2000, fundingrequested for and allocated to the maintenance and repair of BIA schoolswas between 1.5 percent and 1.8 percent—below the lower end of therecommended range of 2 to 4 percent. Funding increased in fiscal year2001, resulting in maintenance and repair budget allocations providingabout 2.5 percent of current replacement value that year. However, basedon discussions with recognized experts in budgeting and facilitiesoperations and maintenance, even with this increase, budget allocationlevels over the past 5 years have been too low.37 These experts suggestedthat because of the extensive infrastructure beyond buildings that BIAmust support, the isolation of the schools which dramatically increasesmaintenance and repair costs, and the age of BIA facilities, BIA schools
34NRC is the principal operating agency of both the National Academy of Sciences and theNational Academy of Engineering in providing advisory services in science and technologyto the federal government and other entities.
35Current replacement value is the amount in current dollars it would cost to duplicate thefacility.
36NRC, Committing to the Cost of Ownership: Maintenance and Repair of Public
Buildings (Washington, D.C.: National Academy Press, 1990).
37The experts we spoke with included a member of the National Academy of Engineering,two engineering consultants, and a retired director of facilities for a historical society withpast experience developing capital and facilities operations budgets for the Congress.
BIA Funding for Maintenanceand Repair Is Less ThanNational Guidelines

Page 32 GAO-01-934 BIA and DOD Schools
likely require maintenance and repair funding in the range of 4 to 6 percentof current replacement value.
Estimated per-pupil expenditures for BIA day schools were $9,647 in 1997–98.38 In comparison, the national average per-pupil expenditure for publicschools was $6,189 in 1997–98, the latest year for which national data wereavailable at the time we did our work. It is important to note that per-pupilexpenditures can range widely. Within the 50 states, per-pupilexpenditures for public schools in 1997–98 ranged from $4,288 inMississippi to $9,643 in New Jersey.
Estimated per-pupil expenditures at BIA schools also varied widelydepending upon the type of school. As shown in table 6, BIA boardingschool expenditure estimates were almost $2,000 more per pupil than BIAday schools overall; the additional estimated expenditures for theboarding schools were likely due to their residential components. AmongBIA day schools, estimated expenditures per pupil were higher for triballyoperated schools than BIA-operated schools.
Table 6: Comparison of Per-Pupil Expenditures at BIA and Public Schools, 1997–98
BIA-funded schools
Estimatedper pupil
expenditure Public schoolsPer-pupil
expenditureb
Day schools $9,647 All schools $6,189 BIA-operated 7,677 Rural schools 5,817 Tribally operated 10,423 Large city schools 6,293Boarding schoolsa $11,643
aIncludes BIA-operated and tribally operated boarding schools.
bData are from the National Public Education Financial Survey, Fiscal Year 1998, as cited in NCES’Statistics in Brief: Revenues and Expenditures for Public Elementary and Secondary Education:School Year 1997–98, NCES 2000–348 (Washington, D.C.: U.S. Department of Education, May2000).
One reason for the difference between estimated per-pupil expendituresfor day schools operated by BIA and those by tribes is that triballyoperated schools bear higher administrative costs—each school must
38Our analysis of expenditures at BIA schools considered expenditures from federalfunding sources alone. According to BIA officials, federal funds constitute by far the largestpart of funding for BIA schools. The national per-pupil expenditure figures include fundingfrom federal, state, local, and private sources.
Estimated ExpendituresPer Pupil for BIA SchoolsAre Higher Than PublicSchools’, and VarySubstantially BetweenCategories of Schools

Page 33 GAO-01-934 BIA and DOD Schools
provide its own accounting and other support services that otherwisewould be provided by BIA for a comparable BIA-operated school. Tosupport these additional operating expenses, BIA provides administrativecost grants to tribally operated schools, which averaged about $1,400 perstudent in 1997–98.
In comparing BIA and public school per-pupil expenditures, it is difficultto draw meaningful conclusions because the many factors that distinguishBIA schools from public schools may add to their educational costs.Special-needs students generally require additional educational resourcesand, as mentioned previously, a high proportion of BIA students havespecial needs. For example, according to BIA records for the 2000–2001school year, about 21 percent of BIA students are enrolled in specialeducation compared with 13 percent of public school students, and 58percent of BIA students have limited English proficiency, compared with 8percent of public school students.39 Available data also indicate that a highproportion of BIA students are poor.40 The student populations of BIAschools in fact may be more similar to those of large city or rural publicschools, where higher proportions of students tend to have special needs.
Other characteristics of BIA schools may lead to increased expenditures.The isolation that results in additional infrastructure needs for BIAschools also results in higher costs in other areas, such as transportation.For example, the number of miles transported per student for BIA schoolsin school year 1999–2000 was about 296, while that of public schools wasabout 165 for school year 1998–1999. Many of the miles traveled by BIAstudents are on unimproved roads or roads in poor condition, whichincreases wear and tear on vehicles. BIA also provides long-distancetransportation four times a year for many of the 8,000 students living inboarding schools. Because BIA schools are generally small and often far
39Data on the proportion of public school students in special education are for 1998–99 andare from Digest of Education Statistics 2000 (Washington, D.C.: U.S. Department ofEducation, Jan. 2001). Data on the proportion of public school students who areconsidered to have limited English proficiency are for 1996–97 and are from the NationalClearinghouse for Bilingual Education Summary Report of the Survey of the States’
Limited English Proficient Students and Available Educational Programs and Services
1996–97 (Washington, D.C.: George Washington University, Graduate School of Educationand Human Development, Sept. 1998).
40As noted earlier, available data for 123 of the 171 BIA schools show that over 80 percentof students were eligible for free or reduced-price lunch for school year 1999–2000.According to data from USDA, about 40 percent of students enrolled in schools nationwideare approved for free or reduced-price lunch.
Page 34 GAO-01-934 BIA and DOD Schools
from each other, it can be difficult for them to achieve economies of scale.Many, for example, must have their own facility maintenance shops andgarages; in contrast, public school districts generally have such facilitiesthat serve several schools.
DOD students’ academic achievement generally exceeds that ofelementary and secondary students as measured by national standardizedtests. DOD school administrators indicated that nearly all teachers in DODschools are certified in the subjects or grades they teach, and the majorityof teachers hold advanced degrees—this proportion is greater than thenational average for public school teachers. Students’ access to computersreported by DOD school administrators is greater than that reported forpublic schools nationwide. In addition, the vast majority of DOD schoolsprovide their teachers with technical and instructional assistance for usingcomputers in the classroom. Many DOD school administrators reportedsome problems with their school facilities and some reported that workspaces for teachers and students were not adequate. However, overall theconditions of facilities reported by DOD schools and public schools in1999 were not substantially different. The estimated per-pupil expenditurefor DOD schools is higher than the national average, and the estimatedper-pupil expenditure is higher for overseas schools than for domesticschools.
On standardized achievement tests, DOD students on average score at orabove national norms. DOD schools use the TerraNova MultipleAssessments to assess students in grades 3 through 11. In math andlanguage arts, DOD students’ average national percentile rankings rangedfrom the 61st percentile to the 72nd percentile (see table 7). Overseas anddomestic schools scored in a comparable range. By definition, the nationalaverage is the 50th percentile. At most grade levels, the rankings foroverseas schools were a few points higher than those for domesticschools. For both boys and girls, and for various ethnic groups, DODstudents were at or above national averages. On the National Assessment
The DOD SchoolSystem
Academic Performance ofDOD Students ExceedsThat of StudentsNationally

Page 35 GAO-01-934 BIA and DOD Schools
of Educational Progress (NAEP), another standardized test, DOD studentsscored at or above national benchmarks.41
Table 7: National Percentile Rankings for Students in DOD Schools on theTerraNova Multiple Assessments Standardized Tests for School Year 1999–2000
National percentile rankingsGrade Language arts Math3 63 614 64 645 64 636 68 657 66 658 68 629 70 6610 72 7211 68 67
Source: DOD data.
On other measures that are often used as indicators of students’ academicachievement, such as college admissions tests and plans to attend college,DOD students generally perform as well as or better than public schoolstudents. A high proportion of DOD students take college admissions tests,scoring at or near national averages. (See table 8.) In addition, DOD schooladministrators reported that about three-quarters of DOD graduates planto pursue higher education. Nationally, just under two-thirds of highschool graduates are enrolled in college the year after they complete highschool. DOD administrators responding to our survey also estimated thatabout 60 percent of their graduates planned to enter 4-year colleges andanother 15 percent planned to enter 2-year colleges. Nationally, about 40percent of high school graduates enroll in 4-year colleges the year afterthey graduate and about 24 percent enroll in 2-year colleges.
41The NAEP is a nationally administered test that assesses students’ proficiency in differentsubject areas, such as reading, math, and writing, in different years. We examined DODdata on students’ performance on the NAEP in math (1996), reading (1998), and writing(1998).
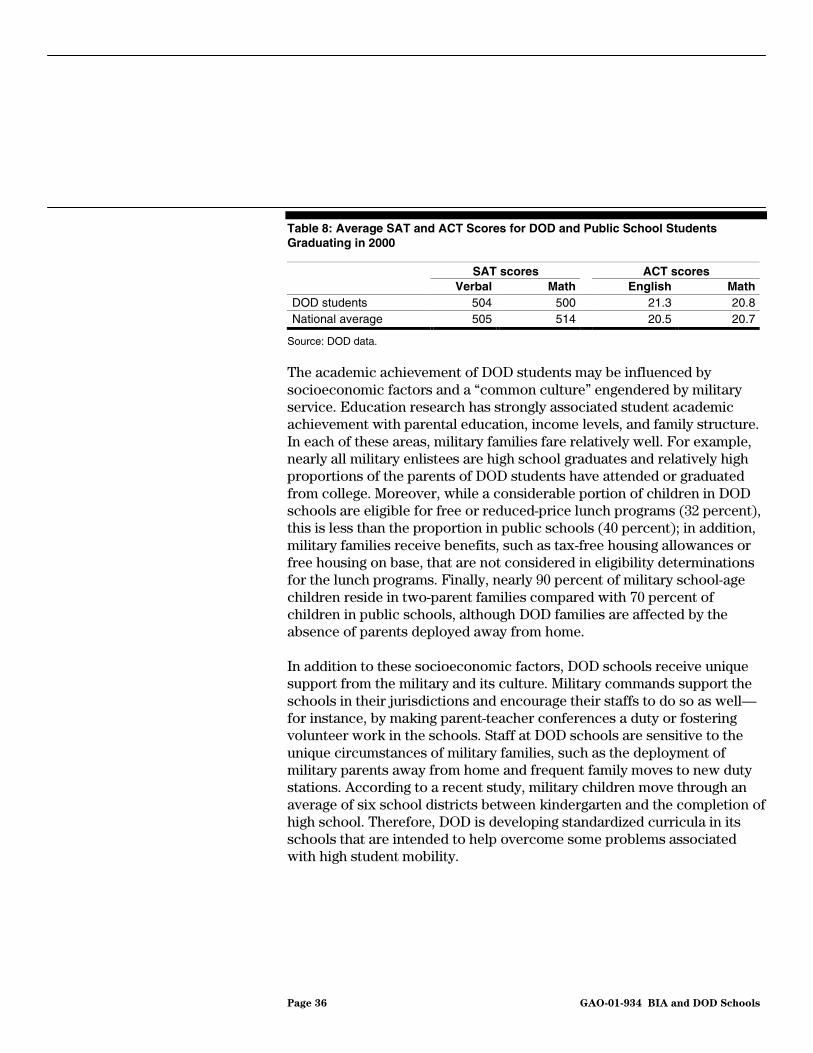
Page 36 GAO-01-934 BIA and DOD Schools
Table 8: Average SAT and ACT Scores for DOD and Public School StudentsGraduating in 2000
SAT scores ACT scoresVerbal Math English Math
DOD students 504 500 21.3 20.8National average 505 514 20.5 20.7
Source: DOD data.
The academic achievement of DOD students may be influenced bysocioeconomic factors and a “common culture” engendered by militaryservice. Education research has strongly associated student academicachievement with parental education, income levels, and family structure.In each of these areas, military families fare relatively well. For example,nearly all military enlistees are high school graduates and relatively highproportions of the parents of DOD students have attended or graduatedfrom college. Moreover, while a considerable portion of children in DODschools are eligible for free or reduced-price lunch programs (32 percent),this is less than the proportion in public schools (40 percent); in addition,military families receive benefits, such as tax-free housing allowances orfree housing on base, that are not considered in eligibility determinationsfor the lunch programs. Finally, nearly 90 percent of military school-agechildren reside in two-parent families compared with 70 percent ofchildren in public schools, although DOD families are affected by theabsence of parents deployed away from home.
In addition to these socioeconomic factors, DOD schools receive uniquesupport from the military and its culture. Military commands support theschools in their jurisdictions and encourage their staffs to do so as well—for instance, by making parent-teacher conferences a duty or fosteringvolunteer work in the schools. Staff at DOD schools are sensitive to theunique circumstances of military families, such as the deployment ofmilitary parents away from home and frequent family moves to new dutystations. According to a recent study, military children move through anaverage of six school districts between kindergarten and the completion ofhigh school. Therefore, DOD is developing standardized curricula in itsschools that are intended to help overcome some problems associatedwith high student mobility.

Page 37 GAO-01-934 BIA and DOD Schools
Administrators responding to our survey indicated that virtually allteachers in DOD schools are certified in the subjects or grades they teach,both in domestic and overseas schools. About two-thirds of teachers inDOD schools have advanced degrees compared to about 46 percent ofpublic school teachers generally. Again, this proportion was about thesame for both domestic and overseas schools.
DOD teachers have access to various kinds of professional development,and DOD schools support professional development in several ways. Forexample, 95 percent of the DOD schools that responded to our surveyreported that the majority of their teachers received in-service trainingprovided by the school during the 1999–2000 school year. Other types oftraining are shown in figure 8.
Figure 8: Percentage of DOD Schools Reporting That a Majority of Teachers Received Various Types of Training
Source: GAO survey.
DOD schools facilitate their teachers’ professional development in severalways. Nearly all DOD schools reported allowing time off to participate intraining and setting days aside for training. In addition, nearly nine out often schools reported paying travel or per diem for training; about halfreported paying tuition or fees. These types of training and supports for
DOD Teachers AreCertified and Most HaveAdvanced Degrees
0 10 20 30 40 50 60 70 80 90 100
College Courses in Teaching Methodsor Assessment
College Courses in Subject Matter
Professional Association Workshop
In-Service Provided by District
In-Service Provided by School 95
71
6
7
5
Percentage of Schools
Type of Training

Page 38 GAO-01-934 BIA and DOD Schools
professional development are comparable to those for public schoolteachers generally, nearly all of whom reported having some professionaldevelopment with similar kinds of support from their schools.42
DOD officials related few problems attracting teachers to domesticschools but noted that recruiting was somewhat more difficult in certainoverseas locations, particularly in parts of Asia. To ease recruiting, DODoften pays moving expenses for teachers it hires in the U.S. to work inoverseas schools. DOD provides transportation for the employees andtheir family members, and ships their household goods to and from theoverseas area. Applicants recruited in the U.S. for overseas posts alsoreceive housing allowances to cover rent and utility costs.43
Class sizes reported by DOD administrators are close to national averageswith no consistent pattern between domestic and overseas schools.Nationally, in 1998, the average class size was 23 students for generalelementary classrooms and 24 students for teachers in departmentalizedsettings. The median number of students per classroom reported by DODschools was in the low 20s in grades K through 8 and in the high teens ingrades 9 through 12, as shown in table 9.
Table 9: Median Class Sizes at DOD Schools
Median number of students per classGrades
K to 3Grades
4 to 6Grades
7 to 8Grades9 to 12
Overseas schools 22 24 20 19Domestic schools 20 23 23 19
Source: GAO survey.
Beginning in school year 1999–2000, DOD obtained additional funding toreduce class sizes in grades 1 through 3 in order to enhance learningopportunities and improve the quality of instruction. The target is a pupil-teacher ratio of 18 to 1. Reduced class sizes were to be implemented in 18overseas schools and 25 domestic schools, with all DOD schools phased inover the next 6 years.
42NCES, Schools and Staffing Survey, 1993–94 (Washington, D.C.: U.S. Department ofEducation).
43According to a DOD official, a small number of staff in DOD overseas schools live ingovernment-provided quarters, but the majority receive allowances intended to cover thecost of housing in the areas where they choose to live.

Page 39 GAO-01-934 BIA and DOD Schools
Based on the responses of DOD school officials to our survey, DODstudents appear to have greater access to computers, including computersconnected to the Internet, than do public school students nationwide.These administrators reported having about 1 instructional computer forevery 3.7 students. This ratio is slightly better than the national averagereported by NCES for 2000. (See table 10.) We do not know about thequality or capacity of computers in DOD schools, but a significant portionof these computers (59 percent) are 3 years old or older.
Administrators at DOD schools reported that students had 1 computerconnected to the Internet available for every 4.8 students. This ratio also isbetter than the ratio for public schools nationwide (1 computer for every 7students). In addition, DOD administrators reported that almost 90 percentof instructional rooms in their schools have at least one computer with aconnection to the Internet. This figure exceeds the national average in2000 by more than 10 percentage points.
Table 10: Technology Statistics for DOD and Public Schools
DODschoolsa
Publicschoolsb
Number of students per instructional computer 3.7 5Number of students per instructional computer with Internetaccess
4.8 7
Percentage of schools connected to the Internet 100 98Percentage of instructional rooms with Internet access 89 77Percentage of schools using dial-up connections to theInternetc
5 11
aData for DOD schools come from GAO’s survey, with the exception of the percentage of schoolsconnected to the Internet, which was provided by a DOD official. Data represent technology access inDOD schools at the time of our survey, which was administered in Nov. 2000.
bPublic school data are for school year 1999–2000 and come from NCES’ Internet Access in U.S.Public Schools and Classrooms: 1994–2000, NCES 2001–071 (Washington, D.C.: U.S. Departmentof Education, May 2001).
cOther types of connections schools may be using include dedicated line, cable modem, and wirelessconnection.
DOD schools also appear to have greater staff support for technology thanpublic schools nationwide. Almost all DOD school administrators reportedthat in 2000 they had paid (versus volunteer) staff that maintainedtechnology and provided technical assistance. In addition, 98 percent ofDOD schools have paid staff to support teachers in using technology forinstruction. In a survey conducted by Education in 1999, 95 percent ofpublic schools reported having some paid staff to support advancedtelecommunications in their school. A school technology administrator at
Technology Access andSupport Reported by DODSchools is on AverageGreater Than PublicSchools

Page 40 GAO-01-934 BIA and DOD Schools
one Army base told us that each school on the base has a technologistavailable to instruct teachers on how to use technology in the classroom,and that, as a result, teachers were integrating the technology into thecurriculum on a daily basis. At one school in this district, first graderswere learning how to create and deliver PowerPoint presentations.
As previously noted, though research suggests that effective use oftechnology in the classroom can improve student learning, research isinconclusive concerning what types of classroom activities are best servedby technology. In responding to our questions concerning teachers’ use ofcomputers in the classroom, about half of DOD school administratorsreported that the majority of their teachers regularly engage students inthe use of computers to learn subject matter, conduct research, and learncomputer applications. Fewer DOD administrators reported that amajority of their teachers are routinely using computers to developstudent problem-solving or data-analysis skills or for drill and practicepurposes. (See fig. 9.)
Figure 9: Percentage of DOD Schools Reporting That a Majority of Teachers Assign Students Computer or Internet Work AtLeast Once Per Week for Various Classroom Activities
Source: GAO survey.
0 10 20 30 40 50 60 70 80 90 100
Problem Solving or Data Analysis
Research
Learning Subject Matter
Computer Applications
Practice Drill Work 40
47
54
48
25
Percentage of Schools
Classroom Activities

Page 41 GAO-01-934 BIA and DOD Schools
DOD schools appear to be making significant investments in educationaltechnology. According to agency records and estimates, the DOD schoolsystem obligated about $356 per student for educational technology infiscal year 2000 for domestic and overseas schools. By comparison,according to a national survey, public school districts planned to spend$113 per student on educational technology in the 2000–2001 school year.44
Many DOD school administrators responding to our survey reportedproblems with their school facilities but, for the most part, their responseswere not substantially different from those reported nationally by publicschool administrators in 1999.45 As shown in table 11, 32 percent of theschool administrators reported that they had one or more buildings in lessthan adequate condition; in 1999, 24 percent of public schooladministrators responding to a national survey reported that they had oneor more buildings in less than adequate condition. Looking at specificbuilding features, such as roofs and plumbing, administrators at about halfof both DOD and public schools reported having at least one inadequatefeature. For many features, about the same proportion of DOD and publicschools reported problems. For some features, including electric power,electrical lighting, and safety features, fewer DOD schools reportedproblems than public schools.
44Quality Education Data, Inc., Technology Purchasing Forecast 2000-2001, 6th Edition
(Denver, Colo.: 2000).
45NCES, Condition of America’s Public School Facilities: 1999, NCES 2000–32(Washington, D.C.: U.S. Department of Education, June 2000).
Administrators ReportSome Problems With DODSchool Facilities

Page 42 GAO-01-934 BIA and DOD Schools
Table 11: Reported Facilities Deficiencies for DOD and Public Schools
Percentage of schools reportinginadequacy
DOD schoolsaPublic
schoolsb
Building deficienciesOnsite school buildingsOne or more buildings in less than adequatecondition (original buildings, additions to originalbuildings, and temporary buildings)
32 24
Features of onsite buildingsOne or more inadequate building features 52 50
Roofs 21 22Framing, floors, foundation 15 14Exterior walls, finishes, windows, doors 20 24Interior finishes, trim 14 17Plumbing 22 25Heating, ventilation, air conditioning 29 29Electric power 14 22Electrical lighting 11 17Safety features such as sprinklers, fire alarms,or smoke detectors
14 20
aSource: GAO survey.
bSource: NCES, Condition of America’s Public School Facilities: 1999, NCES 2000–32 (Washington,D.C.: U.S. Department of Education, June 2000).
When asked about the condition of certain environmental factors in DODschools, such as indoor air quality, again about the same proportion ofadministrators at DOD schools as public schools reported unsatisfactoryconditions. About 20 percent or less of administrators at DOD and publicschools reported that indoor air quality, acoustics or noise control, orphysical security were inadequate in their buildings.
Some DOD schools reported that various work spaces and equipment forstudents and teachers were insufficient at their schools: 29 percent ofschools reported that the number of classrooms was insufficient; aboutthe same proportion reported inadequate library space (see fig. 10). Theprincipal of a 40-year-old school we visited that had not been renovatedsaid that the lack of space for storage was a major problem. In addition, 40percent of DOD schools reported that the telephone and electrical wiringin their facilities was inadequate. The problems with inadequate telephoneand electrical wiring may be due to the age of DOD education facilities.About 60 percent of the DOD school buildings are 30 to 70 years of age,

Page 43 GAO-01-934 BIA and DOD Schools
and as the level of technology introduced into the schools has increased,so have the demands on the telephone and electrical systems.
Figure 10: Percentage of DOD Schools Reporting That Various Work Spaces and Equipment Are Insufficient
Source: GAO survey.
DOD estimates that about $529 million is needed to improve itseducational facilities, as of May 2001. This estimate comes from the 5-YearFacilities Plan for DOD schools. This plan lists projects for repair andimprovement identified by school engineers and principals.46
Each year, each DOD school principal and a DOD school district facilitiesengineer inspect the school facilities and grounds to validate existingprojects on the plan, identify new projects, coordinate routinemaintenance, identify construction projects, and discuss prioritization.Headquarters-level facilities officials prioritize the projects for DODschools systemwide and determine which projects will be funded based on
46The 5-Year Facilities Plan for DOD schools also includes the cost to replace some schools.At the time of this review, the plan included the costs to replace six schools.
DOD Reports Needing MoreThan $500 Million to ImproveEducational Facilities
0 10 20 30 40 50 60 70 80 90 100
Telephone and Electrical Wiring
Size of Eating Area
Number of Science Labs
Number of Computer Labs
Number of Library Books
Library Space
Size of Classrooms
Number of Classrooms 29
24
28
16
14
18
28
40
Percentage of Schools
Work Space and Equipment

Page 44 GAO-01-934 BIA and DOD Schools
the availability of funds. Included on this list are repair and maintenancerequirements that cost more than $25,000 for domestic schools and$10,000 for overseas schools. Projects below these levels are fundedcentrally out of school or district operations and maintenance budgets,according to the DOD’s chief of school facilities. DOD schoolsuperintendents/principals and facilities managers at the schools wevisited indicated that they were generally able to meet the repair andmaintenance needs of their facilities with these funds.
Table 12 shows DOD’s estimated costs to address deficiencies related tocertain building features at DOD schools. DOD school administratorsoften indicated problems with these features in our survey. For example,the cost to address all deficiencies related to heating, ventilation, and airconditioning systems in schools totaled more than $44 million at the timeof this review. Administrators at almost 30 percent of schools respondingto our survey indicated problems with these systems. During our site visitsto seven DOD schools in Alabama and Georgia, the condition of theheating, ventilation, and cooling systems was the most common complaintabout school facilities.
Table 12: Selected Reported Deficiencies and Estimated Repair Costs for DODSchools
Building features often indicated asinadequatea
Estimated cost to repair relateddeficienciesb (dollars in millions)
Heating, ventilation, and air conditioning $44.5Roofs 29Playground surfaces and equipment 21
aSource: GAO Survey.
bSource: 5-Year Facilities Plan for DOD schools, May 2001.
Funding to address projects in the 5-year plan comes primarily from repairand maintenance and minor construction allocations from the operationand maintenance budget for DOD schools, according to a DOD official.These allocations have decreased from about $71 million in fiscal year1998 to $40 million in fiscal year 2000. According to agency officials, thesedecreases were implemented in part to help pay for escalating payrollcosts at DOD domestic schools. In addition to allocations from theoperation and maintenance budget, funding from the construction budgetfor DOD schools is used for projects in the 5-year plan. The constructionbudget has fluctuated over the last several years. In fiscal year 1999, theconstruction budget for DOD schools totaled $44 million; in fiscal year

Page 45 GAO-01-934 BIA and DOD Schools
2000, this amount rose to $82 million; and in fiscal year 2001, it decreasedto $36 million.
Estimated per-pupil expenditures for DOD domestic and overseas schoolswere above the national average for 1997–98 (see table 13), and DODschools’ estimated expenditures per pupil vary depending on theirlocations.47 Schools located overseas tend to have substantially higherestimated per-pupil expenditures ($10,097) than DOD domestic schools($7,725). Much of this difference, according to DOD data, reflects theadded costs of having teachers and other school-related staff overseas.48
These costs include such things as benefits paid to employees inconnection with moves to overseas locations and allowances tocompensate for substantially higher living costs outside the United States.
Table 13: Comparison of Per-Pupil Expenditures at DOD and Public Schools,1997–98
DOD schools
Estimatedper pupil
expenditure Public schools Per-pupil expenditureDomestic $7,725 All schools $6,189a
Overseas 10,097aData are from the National Public Education Financial Survey, Fiscal Year 1998, as cited in NCES’Statistics in Brief: Revenues and Expenditures for Public Elementary and Secondary Education:School Year 1997–98, NCES 2000–348 (Washington, D.C.: U.S. Department of Education, May2000).
We provided officials at DOD, Education, and the Department of theInterior (Interior), which oversees BIA, an opportunity to comment on adraft of this report. In its written comments, DOD concurred with thecontent of the report and had no technical comments. DOD’s letter isprinted in appendix II. Education found the report to be helpful andinformative and provided technical comments which we incorporated intothe report when data were available. Interior provided written commentsand agreed with many aspects of our report. However, the agency pointed
47DOD does not have readily available expenditure data to determine per-pupilexpenditures. Therefore, we used obligation data as a proxy for expenditures.
48Although there are some such costs associated with teachers and school-related staff inGuam and Puerto Rico, they are much less than those for overseas schools because thereare fewer schools in these locations than overseas.
Estimated ExpendituresPer Pupil for DOD SchoolsAre Higher Than PublicSchools’ and VarySubstantially BetweenDomestic and OverseasSchools
Agency Comments

Page 46 GAO-01-934 BIA and DOD Schools
out that BIA’s students and schools are very different from those in thepublic school system and stated that in some cases GAO had madeinappropriate comparisons between BIA schools and the public schoolsystem. Interior stressed this most with respect to measures we used toconsider the academic performance of BIA students and our calculation ofexpenditures per pupil. However, we believe that we have provided aframework for our analysis that shows a sensitivity to these issues andthat our analysis is a fair and balanced representation of the achievementof and expenditures for BIA students. We discuss Interior’s comments inappendix III following the agency’s printed letter. Interior also providedtechnical corrections which we incorporated where appropriate.
As agreed with your offices, unless you publicly release its contentsearlier, we will make no further distribution of this report until 30 daysafter its issue date. At that time, we will send copies of this report to theHonorable Gale A. Norton, Secretary of the Interior; Neal McCaleb,Assistant Secretary of Indian Affairs, Department of the Interior; theHonorable Donald H. Rumsfeld, Secretary of Defense; John M. Molino,Deputy Assistant Secretary of Defense for Military Community and FamilyPolicy; the Honorable Roderick R. Paige, Secretary of Education;appropriate congressional committees; and other interested parties. Pleasecall me at (202) 512–7215 if you or your staff have any questions about thisreport. Key contacts and staff acknowledgments for this report are listedin appendix IV.
Marnie S. ShaulDirector, Education, Workforce, and Income Security

Appendix I: Scope and Methodology
Page 47 GAO-01-934 BIA and DOD Schools
This appendix discusses in more detail the scope and methodology forexamining the following aspects of Bureau of Indian Affairs (BIA) andDepartment of Defense (DOD) school systems: (1) student achievement,(2) teacher staffing, (3) access to educational technology, (4) condition ofschool facilities, and (5) expenditure levels.
The scope of our review included BIA day schools and boarding schools,and DOD schools located both in the United States and overseas. To theextent we could, we excluded from our analyses BIA peripheraldormitories, which house Indian students on reservations who attendnearby public schools and generally do not have academic programs. Ourfocus was the 1999–2000 school year, and most of the data we collectedrelate to that year.
A major source of information for this review was a mail survey ofadministrators at all BIA and DOD schools. We pretested a draftquestionnaire at eight schools and revised it based on their comments. InNovember 2000, we mailed the final questionnaire to all 171 BIA schoolsand 224 DOD schools. We did follow-up mailings in January and March2001 and accepted returns through early May 2001, yielding response ratesof 81 percent for BIA schools and 92 percent for DOD schools. We did notindependently verify the accuracy of the information provided in thequestionnaire responses. In addition to information collected through thesurvey, we obtained budget, facilities, and other data from BIA and DOD,and testing data from state departments of education and college testingorganizations. We obtained and reviewed supporting documentation forsome budget and expenditure data but otherwise did not verify thisinformation.
In the course of this review, we interviewed various staff at BIA’s Office ofIndian Education Programs and DOD’s Department of Defense EducationActivity who are responsible for education programs, budgets, technology,and facilities. As shown below, we also conducted site visits to nine BIAschools located in South Dakota, Arizona, Minnesota, and Washington andseven DOD schools located in the United States at three militaryinstallations—Maxwell Air Force Base in Alabama and Fort Benning andRobins Air Force Base in Georgia. At these schools, we toured the schoolfacilities and met with a variety of officials, including principals,superintendents, education specialists, and facilities management staff.The BIA schools we visited were
• Greasewood Springs Community School, Ariz.,• Hopi Day School, Ariz.,
Appendix I: Scope and Methodology

Appendix I: Scope and Methodology
Page 48 GAO-01-934 BIA and DOD Schools
• Muckleshoot Tribal School, Wash.,• Chief Leschi School, Wash.,• Flandreau Indian Boarding School, S. Dak.,• Pine Ridge School, S. Dak.,• Loneman Day School, S. Dak.,• Fond du Lac Ojibwe School, Minn., and• Nay-Ah-Shing School, Minn.
The DOD schools we visited were
• Maxwell AFB Elementary School, Maxwell AFB, Ala.,• Dexter Elementary School, Fort Benning, Ga.,• Faith Middle School, Fort Benning, Ga.,• Loyd Elementary School, Fort Benning, Ga.,• White Elementary School, Fort Benning, Ga.,• Linwood Elementary School, Robins AFB, Ga., and• Robins Elementary School, Robins AFB, Ga.
We obtained data on public schools from readily available sources,typically from Department of Education (Education) studies.
We conducted our work between June 2000 and July 2001 in accordancewith generally accepted government auditing standards.
To provide an indication of BIA and DOD students’ academic achievement,we reviewed their performance on standardized tests and stateassessments. We also obtained data on their performance on collegeentrance examinations, namely the Scholastic Assessment Test (SAT) andthe American College Test (ACT). In addition, our survey askedadministrators to report on the post-high-school plans of graduatingseniors.
For BIA schools, we attempted to collect data on BIA students’performance on state assessments from four states that account for morethan 70 percent of all BIA schools—Arizona, New Mexico, North Dakota,and South Dakota. We were able to obtain data for all BIA schools inNorth Dakota and South Dakota and for 19 of 50 BIA schools in Arizonathat participated in Arizona’s state assessment program. No data wereavailable for BIA schools in New Mexico, which has about one-quarter ofall BIA students. In total, about 36 percent of BIA students attend the
Student Achievement

Appendix I: Scope and Methodology
Page 49 GAO-01-934 BIA and DOD Schools
schools to which our data relate. All data obtained were for school year1999–2000.
From the North Dakota Department of Public Instruction, we obtaineddata on students’ performance on the statewide assessment. North Dakotauses the TerraNova Basic Multiple Assessments to assess students ingrade 4 and the TerraNova Complete Battery Plus to assess students ingrades 6, 8, and 10. The state provided data on statewide averages forstudents’ performance on the test, a breakdown of these scores by studentethnicity, and the scores for all BIA schools. We focused on students’ totalscores on the test and reported the range of scores across all grades. InSouth Dakota, schools use the Stanford Achievement Test to assessstudents in grades 2, 4, 8, and 11. From South Dakota’s Department ofEducation, we obtained the average scores for students statewide, and thescores for all BIA schools on the complete battery and for specific skillareas such as language arts, reading, and math.1 We reported specificallyon the range of scores on the complete battery across all grades. Arizonauses an assessment test customized for its standards, called the ArizonaInstrument to Measure Standards (AIMS), in grades 3, 5, 8, 10, and 11.AIMS classifies students into four categories in relation to the standards:Falls Far Below, Approaches, Meets, or Exceeds. The Arizona Departmentof Education provided us with statewide averages for students’performance on the AIMS, including a breakdown of statewide scores byethnicity, and the scores for participating BIA schools. We reported therange for the proportion of children who met or exceeded the statestandards, across all grades and across all subjects (reading, writing, andmath).
We requested data on the performance of BIA students on the SAT andACT from the respective college testing organizations. With BIA’sapproval, the testing organizations provided us data on the scores for BIAstudents who graduated in 1999 or 2000. It should be noted that a smallnumber of BIA graduates (fewer than 70) take the SAT. Far more BIAstudents (about 800) take the ACT because BIA schools are located inareas of the country where the ACT is the predominant college admissionstest.
BIA also provided the annual reports for virtually all BIA-funded schools,which include data on the proficiency of students as assessed by schools.
1The complete battery score is a composite score that includes all subject areas tested.
Appendix I: Scope and Methodology
Page 50 GAO-01-934 BIA and DOD Schools
These assessments are based on multiple measures, which in addition tostudents’ performance on standardized tests can include measures such asportfolios illustrating students’ work, grades, teacher observations, andwork samples.
DOD students in both overseas and domestic schools are assessed usingthe TerraNova Multiple Assessments in grades 3 through 11. We obtaineddata from DOD on students’ performance for school year 1999–2000 andfocused on students’ scores in language arts and math. We reported therange of scores for students in all grades, across both language arts andmath, and across students in both overseas and domestic schools. We alsoobtained data from DOD on students’ performance on the NationalAssessment of Educational Progress (NAEP). The NAEP is a nationallyadministered test offered in different subject areas, such as reading, math,science, and writing, in different years. We examined DOD data onstudents’ performance on the NAEP in math (1996), reading (1998), andwriting (1998). We reviewed overall averages for DOD students in bothoverseas and domestic schools and compared these scores with nationalaverages. Finally, we obtained SAT and ACT results from DOD forstudents graduating during the 1999–2000 school year.
Nearly all information about BIA and DOD teacher qualifications andtraining was obtained through GAO’s survey. Some information on teacherturnover rates and staff tenure was obtained from agency records. Todetermine class sizes, we asked administrators on the survey to report theaverage number of students in a classroom for grades K–3, 4–6, 7–8, and9–12.
Nearly all information on BIA and DOD students’ access to technology inschools, technology staffing levels, and how technology is used in theclassroom was obtained through the survey. We calculated student-to-computer ratios systemwide for BIA and DOD schools by dividing the totalnumber of computers reported by responding schools by the total numberof students at the schools. For individual schools in the BIA and DODsystems, student-to-computer ratios varied somewhat from the ratio forthe systems overall. With respect to technology spending, DODEAprovided us with estimates of how much the agency spent to support
Teacher Staffing andEducationalTechnology

Appendix I: Scope and Methodology
Page 51 GAO-01-934 BIA and DOD Schools
educational technology programs in its schools for the 1999–2000 schoolyear. BIA schools provided this information to us through the survey.
We gathered information on the condition of BIA and DOD schoolbuildings primarily through the survey. We asked school administrators toreport on the physical condition of buildings and on specific buildingfeatures, such as roofs and plumbing. We also asked about whether certainenvironmental conditions were satisfactory, such as indoor air quality andacoustics or noise control, and whether working facilities for teachers andstudents, such as classrooms, libraries, and computer labs, were sufficient.Many of the questionnaire items were based on those used in two previoussurveys: a 1999 Education survey on the condition of school buildings,which was conducted on a nationally representative sample of publicschools;2 and a 1994 GAO survey on the condition of school buildings,conducted on a nationally representative sample of public schools and allBIA schools.3 We asked administrators to report separately on thecondition of school buildings and on the condition of dormitory buildings.
As a further indication of the condition of schools, we reviewed BIA andDOD agency data on needed maintenance and repairs at school facilities.In reviewing BIA’s backlog of deferred maintenance and repairs, we firstexcluded data for buildings not related to schools, such as administrativebuildings, employee quarters, and buildings supporting law enforcementservices. We then looked at estimated costs to address certain types ofdeficiencies according to categories used by BIA—for example, thoserelated to student and staff safety; environmental needs, such as asbestosand radon testing; and energy-related needs. Finally, we asked BIAofficials to conduct searches on the backlog database for deficienciesrelated to certain items asked about on our survey—for example, roofs;plumbing; fire safety; handicapped access requirements; sewer and waterinfrastructure; asbestos; heating, ventilation, and air conditioning; andplayground surfaces and equipment—and then totaled the estimated costs
2National Center for Education Statistics (NCES), Condition of America’s Public School
Facilities: 1999, NCES 2000-32 (Washington, D.C.: U.S. Department of Education, June2000).
3School Facilities: Condition of America’s Schools (GAO/HEHS-95-61, Feb. 1995).
Facilities
Condition
Backlogs of Maintenanceand Repair Needs

Appendix I: Scope and Methodology
Page 52 GAO-01-934 BIA and DOD Schools
for these deficiencies. We also obtained the 5-Year Facilities Plan for DODschools, which includes a total for the estimated amount needed toaddress all identified items. It should be noted that the 5-year plan doesnot include repair projects costing under $25,000 for domestic schools and$10,000 for overseas schools. We reviewed the 5-year plan data for specificbuilding deficiencies that were noted more often as problems by DODschools in our survey: roofs; heating, ventilation, and air conditioning; andplayground surfaces and equipment.
To assess maintenance and repair funding levels for BIA schools, wemeasured funding against guidelines set by the National Research Council(NRC). The NRC has recommended that budget allocations formaintenance and repair be between 2 and 4 percent of currentreplacement value.4 We first determined the current replacement value ofBIA schools by multiplying the square footage of the schools by the cost toconstruct a new school per square foot. We obtained BIA’s total educationfacility square footage for maintained buildings for 1997–2001. (These dataincluded 14 peripheral dormitories and two colleges, which account forabout 11 percent of BIA’s total education facility square footage.) We thenobtained data on the average cost per square foot of a new school for eachyear from 1997 through 2000, from annual education construction reportspublished by American School and Universities.5 (The average cost persquare foot of a new school was not yet available for 2001, so we used theaverage amount per square foot reported for 2000 for this year.) Then, foreach year from 1997 to 2001, we multiplied BIA’s educational facilitysquare footage by the average cost per square foot to construct a schoolthat year.
To identify BIA budget allocation categories that met the NRC’s definitionof maintenance and repair, we reviewed BIA documents describing thecategories and discussed these with experts. Once we identified theappropriate categories, we obtained the amounts BIA requested andallocated for these categories for fiscal years 1997–2001. Then for eachyear, we determined the percentage that the requested and allocated
4NRC, Committing to the Cost of Ownership: Maintenance and Repair of Public
Buildings (1990).
5J. Agron, 24th, 25th, 26th and 27th Annual Official Education Construction Reports,(Overland Park, Kan.: American School and University, May 1998, May 1999, May 2000, andMay 2001).
BIA’s Allocations forMaintenance and Repairsof Schools as a Percentageof Replacement Value
Appendix I: Scope and Methodology
Page 53 GAO-01-934 BIA and DOD Schools
amounts represented of the current replacement value and comparedthese with NRC guidelines.
To calculate estimated per pupil expenditures for DOD and BIA schoolsthat would be comparable to public school figures, we followed guidelinesfor identifying expenditures set forth by the National Center for EducationStatistics (NCES) in its National Public Financial Education Survey.6 Theresults of this survey are used to develop the national per-pupil figure.National per-pupil expenditure figures reflect current expenditures fromfederal, state, local and private sources, at the district level for pre-kindergarten through grade 12. Current expenditures include salaries,benefits, purchased services, and supplies for the following functions:instruction; support services; noninstructional services, such as foodservices; and direct program support, such as state contributions toemployee retirement funds. Long-term expenditures such as capitaloutlay, debt service, facilities acquisition and construction services, andproperty expenditures (for example, for equipment and vehicles) areexcluded from current expenditures by NCES and, in most cases, by ourevaluation. At the time we did our work, the latest school year for whichnational public school per-pupil expenditures were available was 1997–98.
Data needed to precisely compute per-pupil expenditures for both BIA andDOD schools were not available. Therefore, our calculations are estimatesbased on BIA and DOD agency data and federal expenditure informationfrom tribal audit reports submitted under the Single Audit Act. BecauseBIA and DOD data were generally not available by categories specified byNCES, we used agency or tribal expenditure or obligation data forprograms or budget line items which included these categories. Using thisapproach we were able to include expenditures for salaries, benefits,purchased services, and supplies for the categories included in thenational per-pupil expenditure: instruction, support services, andnoninstructional services. Direct program support generally did not apply.Similarly, we were generally able to exclude expenditures for capitaloutlay, debt service, and facilities acquisition and construction services byexcluding budget line items that contain these expenditures. In some
6NCES, The National Public Education Financial Survey Instruction Booklet, January
1999 (Washington, D.C.: U.S. Department of Education). Because 1997–98 was the latestyear for which national public school per-pupil expenditures were available at the time wedid our work, we used the guidelines dated January 1999, since these guidelines applied tothe 12-month period beginning July 1, 1997, and ending June 30, 1998.
Estimated Per PupilExpenditures
Appendix I: Scope and Methodology
Page 54 GAO-01-934 BIA and DOD Schools
cases, we were not able to extract specific expenditures or obligationsrelating to property expenditures within selected programs; however,these amounts were likely to be relatively small.
For BIA schools, we developed estimated per-pupil calculations for (1)BIA-operated day schools, (2) tribally operated day schools, (3) dayschools overall, and (4) boarding schools. For BIA-operated schools, weobtained expenditure information from the Department of the Interior’s(Interior) financial system based on codes indicating programs thatsupport kindergarten through grade 12. We were not able to identifyexpenditures for administrative services provided by Interior for BIA-operated schools, such as payroll and procurement. We used fiscal year1998 data. A fiscal year reasonably approximates the period July 1, 1997,and ending June 30, 1998, used by NCES. For tribally operated schools,we relied primarily on federal expenditure information from audit reportssubmitted under the Single Audit Act. These reports were generally for theperiod July 1, 1997, through June 30, 1998. We were able to obtainexpenditure information for 54 of the 98 schools that were triballyoperated that year. We could not obtain expenditure information for theremaining 44 schools because, in some cases, the school expenditureinformation in the audit report was included with other expenditureinformation for tribal or other organizations and could not be readilyextracted, or because related audit reports were not available.
For both BIA-operated and tribally operated schools, we consideredexpenditures from federal funding sources only, which, according to BIAofficials, represent by far the greatest source of funding for BIA schools.This included expenditure data for Education programs, such as Title I;and the Department of Agriculture’s (USDA) child nutrition programs,such as the National School Lunch and Breakfast programs. The per-pupilexpenditure figures for public schools nationally consider funding from allsources. Most funding for public schools comes from state, intermediate,and local sources.
In order to determine overall estimated per-pupil expenditures for day andboarding schools, we weighted the calculated estimated per-pupilexpenditures for BIA-operated and tribally operated schools of both types,according to the number of students attending each type of school. Weused student enrollment figures from BIA internal reports for each schooltype.
In order to calculate DOD overseas and domestic estimated per-pupilexpenditures, we used obligations from DOD internal financial reports for
Appendix I: Scope and Methodology
Page 55 GAO-01-934 BIA and DOD Schools
fiscal year 1998 as a proxy for expenditures, since DOD does not maintainexpenditure information in the detail necessary for this type of analysis.We also used fiscal year 1998 data since, similar to other federal agencies,DOD tracks obligations by fiscal year and not for other periods. Forstudent enrollment figures, we relied on data from DOD internal reportsfor domestic and overseas schools. We also obtained information for thevalue of USDA’s child nutrition programs, such as the National SchoolLunch and Breakfast programs, for fiscal year 1998, which we included inthe estimated expenditure per pupil calculation.

Appendix II: Comments from the Department
of Defense
Page 56 GAO-01-934 BIA and DOD Schools
Appendix II: Comments from the Departmentof Defense
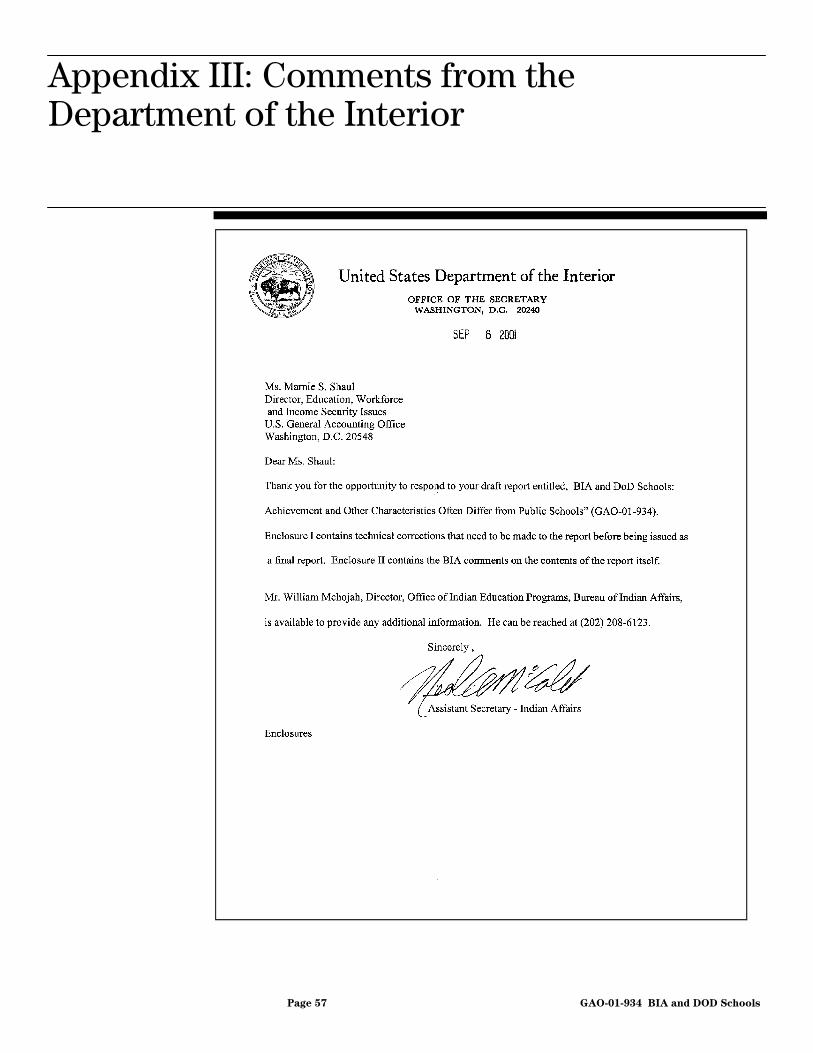
Appendix III: Comments from the Department
of the Interior
Page 57 GAO-01-934 BIA and DOD Schools
Appendix III: Comments from theDepartment of the Interior

Appendix III: Comments from the Department
of the Interior
Page 58 GAO-01-934 BIA and DOD Schools
See comment 3.
See comment 2.
See comment 1.

Appendix III: Comments from the Department
of the Interior
Page 59 GAO-01-934 BIA and DOD Schools
See comment 6.
See comment 5.
Now on p. 12.
See comment 4.
Now on p. 10.

Appendix III: Comments from the Department
of the Interior
Page 60 GAO-01-934 BIA and DOD Schools
See comments 8 & 9.
Now on p. 14.
See comment 7.

Appendix III: Comments from the Department
of the Interior
Page 61 GAO-01-934 BIA and DOD Schools
Now on p. 19
See comment 10.
Now on pp. 17-18.
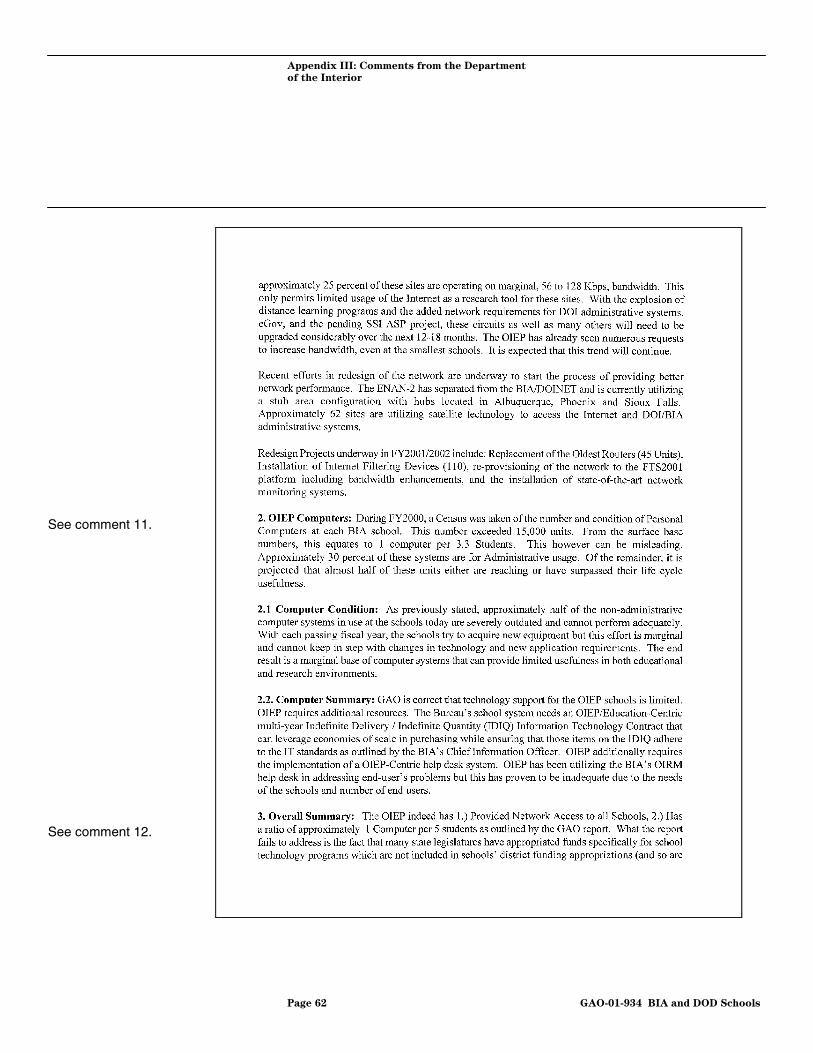
Appendix III: Comments from the Department
of the Interior
Page 62 GAO-01-934 BIA and DOD Schools
See comment 12.
See comment 11.
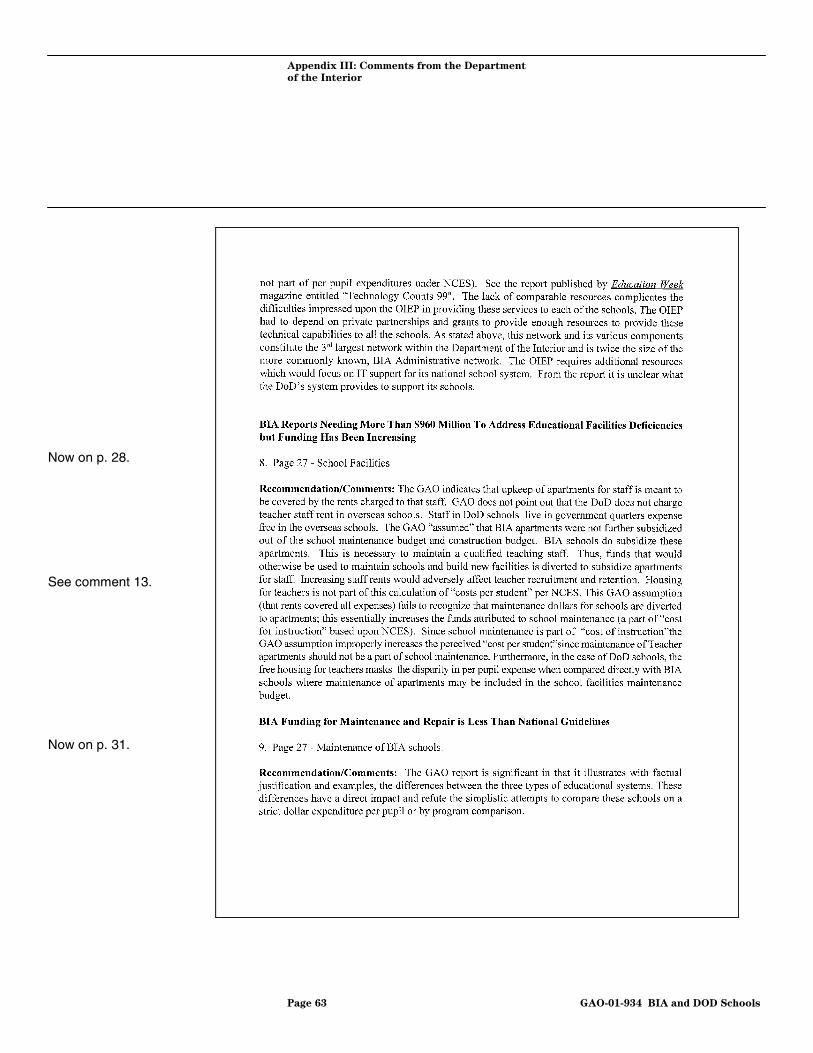
Appendix III: Comments from the Department
of the Interior
Page 63 GAO-01-934 BIA and DOD Schools
Now on p. 28.
Now on p. 31.
See comment 13.
Appendix III: Comments from the Department
of the Interior
Page 64 GAO-01-934 BIA and DOD Schools
Now on p. 32.
See comment 16.
See comment 15.
See comment 14.

Appendix III: Comments from the Department
of the Interior
Page 65 GAO-01-934 BIA and DOD Schools
See comment 17.
See comment 18.
See comment 17.

Appendix III: Comments from the Department
of the Interior
Page 66 GAO-01-934 BIA and DOD Schools
See comment 19.
Now on p. 33.
Appendix III: Comments from the Department
of the Interior
Page 67 GAO-01-934 BIA and DOD Schools

Appendix III: Comments from the Department
of the Interior
Page 68 GAO-01-934 BIA and DOD Schools
1. We stated that BIA’s funding for school operations and facilities needsincreased 30 percent from fiscal years 2000 to 2001. Interior suggestedthat GAO differentiate the actual amount of the increase between theOperation of Indian Programs and Construction appropriationaccounts, initially stating that each account had increased by 25percent. Based on our calculations, we added information to the reportspecifying that funding for Operation of Indian Programs increased byabout 5 percent and funding for Construction increased 121 percentbetween fiscal years 2000 and 2001. This supports our statement thatnearly all the increase was for the repair and replacement of schoolfacilities while funding for school operations received only a modestincrease.
2. Interior commented that our report should acknowledge that theDepartment of Education (Education) funding that BIA schoolsreceive is available to all public schools across the country. Interiorspecifically noted that public schools that educate Indian children onor near Indian reservations receive Impact Aid Funds from Education.We added text to the report indicating that like BIA schools, manypublic schools also receive funding from Education.
3. Interior noted that in an agreement with Education, BIA serves as astate education agency and is authorized to receive flow through fundsfrom Education. We have added this information in the report.
4. Interior suggested that we provide some examples to further highlightdifferences between BIA and DOD schools. Interior stated that theDOD school system has no schools with small enrollments orcombinations of grades like those in the BIA school system. The DODschool system does have several schools with enrollments under 100students and schools that span both elementary and secondary grades,but we agree that these types of schools are less prevalent in DOD’sschool system. Interior also said that it would have been helpful forGAO to provide an example of how BIA schools are less able to takeadvantage of economies of scale and that this would help explain theschool system’s per- pupil expenditure. In our report section on perpupil expenditures, we describe a situation that illustrates howdifficult it can be for BIA schools to achieve economies of scale.Finally, Interior stated that the report could comment on how thephysical conditions found in BIA schools could affect studentoutcomes. Thus, we added a note to the report stating that thoughsome studies conclude that school facility conditions—such as
GAO Comments

Appendix III: Comments from the Department
of the Interior
Page 69 GAO-01-934 BIA and DOD Schools
inadequate ventilation or faulty heating systems—can affect studentlearning, the research is inconclusive overall.
5. Regarding the performance of BIA students on state assessments,Interior argued that state standardized tests may be culturally biasedand may be a less reliable measure for Indian students than otherminorities. In the report we acknowledged that standardized tests havebeen criticized as being culturally biased, and we therefore providedinformation on authentic assessments of BIA students. However, weare not aware of any research that shows standardized tests are lessreliable for Indian students than other minority students.
6. Interior said GAO should have compared BIA student achievementwith public schools serving large numbers of Indian students in ruralareas. We agree that these would be worthwhile analyses. However,the additional audit work and data required to perform these analysesdid not allow us to include them in this report.
7. Interior noted BIA’s efforts to address differences in studentachievement through programs designed to moderate the effects ofpoor economic and family conditions on student achievement. Theagency also noted that BIA had established long term goals thataddress student performance. We have added information to the reportto acknowledge BIA’s efforts in these areas.
8. Interior questioned our comparison of BIA students’ plans to attendcollege and performance on college entrance examinations with thoseof students nationally. The agency argued that the economies of ruralareas, where most BIA schools are located, do not offer jobs thatrequire post-secondary education, and for this and other reasons, lesscultural emphasis is placed on BIA students to perform well on testslike the SAT and to attend college. The agency stated that BIA studentsgenerally expect to go to tribal colleges that do not require collegeentrance examinations, such as the SAT. We believe that thesemeasures are appropriate given that one of the Office of IndianEducation Program’s goals is to increase post-secondary enrollmentrates. Also, a significant number of BIA students take the SAT andACT, perhaps to enter colleges that require these examinations.
9. Interior also said that we should have compared BIA students’ plans toattend college and their performance on college entranceexaminations with students from other rural regions of the U.S. orstudents in public schools on Indian reservations. Some data are

Appendix III: Comments from the Department
of the Interior
Page 70 GAO-01-934 BIA and DOD Schools
available for students living in rural areas but these are not specificallyfocused on Indian students. For example, data from 1993-94 show thaton average 54 percent of 12th graders living in small towns or ruralareas applied to college, compared with BIA school administrators’estimates that 28 percent of graduating seniors planned to enroll incollege. With regard to the SAT, for students graduating in 2000, ruralstudents received an average total score of 992 on the verbal and mathsections of the SAT, compared with 1,019 for students nationally, and765 for BIA students.
10. Interior stated that teacher turnover correlates with reduced studentachievement, but did not provide support for this statement. We werenot able to identify any studies establishing a link between teacherturnover and student achievement.
11. Interior noted that in fiscal year 2000, BIA conducted a census ofpersonal computers in BIA schools and concluded that the schoolsystem had a ratio of 1 computer for every 3.3 students. BIA added,however, that 30 percent of these computers are for administrativeusage and that almost half are reaching or have surpassed their lifecycle usefulness. Our survey asked school administrators aboutcomputers used specifically for instructional purposes. Using thesedata, we determined that the school system had a ratio of 1 computerfor instructional purposes for every 3.5 students.
12. Interior said that we had failed to address the fact that statelegislatures have appropriated funds for school technology and thatthese funds are not included in district funding appropriations andtherefore are not included in calculations of expenditures per pupil byNCES. We contacted NCES and were told that state funding foreducational technology should be included in the data that statesreport to NCES for expenditure per pupil calculations. Thus, based onthis information, we did not modify our report. Interior also noted thatthe Office of Indian Education Programs had to rely on privatepartnerships and grants to provide enough resources to place technicalcapabilities in all its schools. (It should be noted that these additionalresources were not identified during our review and therefore werenot included in our expenditure per pupil calculation for BIA schools.)In addition, Interior stated that our report was unclear about theresources DOD uses to support technology in its schools. In our reportwe provided an estimate for the amount of money the DOD schoolsystems obligated per student for educational technology in fiscal year2000, which was less than the amount BIA schools spent per student

Appendix III: Comments from the Department
of the Interior
Page 71 GAO-01-934 BIA and DOD Schools
based on our survey results. This funding comes from DODappropriations.
13. With respect to housing for teachers and staff, Interior said that wehad assumed that rents collected from teachers living in employeehousing covered the cost of maintaining this housing and had notrealized that schools end up covering these costs out of their facilitiesmaintenance funds. Interior argued that school maintenance fundingdiverted for teacher housing should not have been included in ourcalculation of expenditures per pupil. Interior also stated that staff inDOD schools live in government provided quarters expense free. Earlyin our review, BIA officials informed us that rents paid by teachers andstaff did not cover the full cost of maintaining employee housing.However, when requested, BIA was unable to identify expendituresmade by schools for such purposes. More importantly, Interior notedin its comments that providing housing is necessary for maintaining aqualified teaching staff. Because of this, we believe that expendituresto maintain employee housing are part of the cost of providinginstruction for these schools. An NCES official agreed and stated thatexpenditures from school facilities maintenance funds used tomaintain employee housing should be included in the calculation ofexpenditures per pupil. For the same reason, we included DODschools’ expenditures for housing allowances provided to overseasstaff in our calculation of expenditures per pupil. We have also added afootnote stating that a small number of staff in DOD schools overseaslive in government-provided quarters; most receive housing allowancesintended to cover the cost of housing in the areas where they chooseto live.
14. Interior commented that our report failed to address the adequacy offunding for facilities operations. We were not able to identify a widelyused benchmark to assess the sufficiency of BIA’s facilities operationsfunding. We were only able to compare BIA’s obligations for bothfacilities operations and maintenance with similar expenditures forpublic schools. We found that BIA’s obligations per square foot ofbuilding space were higher than the national median for publicschools. However, it was difficult to draw conclusions from thesecalculations as they do not consider the additional infrastructure BIAschools operate and maintain. Also, this analysis does not examine theadequacy of BIA’s funding for operations and maintenance, it merelycompares the amounts used by BIA and public schools for thesepurposes. Further, we were aware at the time we conducted our workthat BIA had contracted with a private engineering firm to assess the

Appendix III: Comments from the Department
of the Interior
Page 72 GAO-01-934 BIA and DOD Schools
adequacy of BIA’s facilities operations and maintenance funding. Thiswork may provide a clearer picture of BIA’s needs. This report isexpected to be completed in Fall 2001.
15. Interior commented that the cost of operating facilities could bereduced if school replacement construction funding covered the costof demolishing and removing old structures. Currently, BIA providesfor the security of these idle structures out of operations funding untila decision is made on their disposal. This issue may be worthy ofattention, but BIA’s own budget formula for determining operationsand maintenance needs suggests that this is not a major expense.
16. Interior noted that BIA, DOD, and public schools define and accountfor maintenance funds and expenditures differently, and thesedifferences make “a straight across the board comparison” difficult.We determined that it would be challenging to complete such ananalysis within the timeframe of this review. Thus, we did not attemptto compare maintenance budgets or expenditures among these schoolsystems. Rather, we analyzed BIA’s and DOD’s maintenance and repairbacklogs and provided information on the amount of funding allocatedto address them and school construction.
17. Interior commented that our estimates of expenditures per pupil werenot adjusted to reflect differences between students in day schools andin residential schools. We did calculate separate per-pupilexpenditures for day schools and residential schools and did notcombine them. Interior also stated that we did not adjust our per-pupilexpenditure estimates for students with special education needs or forthe costs of small schools in sparsely populated areas. The agencyrecommended that we use an alternative approach for calculatingexpenditures per pupil that takes into account differences in studentand school needs. Interior pointed to funding allocation systems usedby some states where students are weighted differently based on theadditional education resources they may require. For example, astudent requiring special education services may be counted as 1.5students in determining state aid. Interior argued that we should haveused a weighted count of its students to calculate expenditures perpupil, since a high proportion have special needs. Such a calculationmay be useful, but comparisons with public schools would not bepossible since NCES does not calculate the national expenditure perpupil using a weighted student count.

Appendix III: Comments from the Department
of the Interior
Page 73 GAO-01-934 BIA and DOD Schools
18. Interior stated that we should have compared BIA expenditures perpupil with that of school districts with similar student populations.Interior suggested several school districts with similar studentpopulations in South Dakota and New Mexico that could be used forcomparison with BIA’s per-pupil expenditure. We obtained the per-pupil expenditures for these districts from NCES and found theyranged from $4,979 to $8,706 in 1997-98, all below BIA’s estimatedexpenditure per pupil of $9,647.
19. Interior recommended that we should not have includedadministrative cost grants for tribally operated schools in ourexpenditure per pupil calculation. The agency argued that these grantsare for the purpose of administering the schools and carrying outsupport functions that are not part of the basic academic instruction,such as fiscal and personnel activities. According to an NCES official,these expenditures should be included as they fall into the category ofgeneral administration expenditures, which is included in the nationalper pupil expenditure calculation.
Appendix IV: GAO Contacts and Staff
Acknowledgments
Page 74 GAO-01-934 BIA and DOD Schools
Karen A. Whiten, (202) 512-7291Linda Y.A. McIver, (206) 287-4821
In addition to the individuals named above, Mary E. Abdella, Beverly G.Burke, Julianne Hartman Cutts, Eric M. Eliasen, Kopp F. Michelotti, NancyR. Purvine, Joel I. Grossman, Elsie M. Picyk, Stanley G. Stenersen, andJames P. Wright made key contributions to this report.
Appendix IV: GAO Contacts and StaffAcknowledgments
GAO Contacts
StaffAcknowledgments
(102002)

The first copy of each GAO report is free. Additional copies of reports are$2 each. A check or money order should be made out to theSuperintendent of Documents. VISA and MasterCard credit cards are alsoaccepted.
Orders for 100 or more copies to be mailed to a single address arediscounted 25 percent.
Orders by mail:
U.S. General Accounting OfficeP.O. Box 37050Washington, DC 20013
Orders by visiting:
Room 1100700 4th St., NW (corner of 4th and G Sts. NW)Washington, DC 20013
Orders by phone:
(202) 512-6000fax: (202) 512-6061TDD (202) 512-2537
Each day, GAO issues a list of newly available reports and testimony. Toreceive facsimile copies of the daily list or any list from the past 30 days,please call (202) 512-6000 using a touchtone phone. A recorded menu willprovide information on how to obtain these lists.
Orders by Internet
For information on how to access GAO reports on the Internet, send an e-mail message with “info” in the body to:
or visit GAO’s World Wide Web home page at:
http://www.gao.gov
Contact one:
• Web site: http://www.gao.gov/fraudnet/fraudnet.htm• E-mail: [email protected]• 1-800-424-5454 (automated answering system)
Ordering Information
To Report Fraud,Waste, and Abuse inFederal Programs

![[XLS] · Web view2001 2 2003 4 2004 1 2006 1 1995 1 1990 1993 1998 1999 1999 1999 1999 2000 2000 2000 2000 2000 2001 2001 2001 2001 2001 2001 2001 2001 2001 2001 2001 2001 2001 2002](https://img.pdfslide.net/doc/110x75/5bdc2d6f09d3f2bc1c8d6ace/xls-web-view2001-2-2003-4-2004-1-2006-1-1995-1-1990-1993-1998-1999-1999-1999.jpg)