Embed Size (px)
Citation preview

! Partnerships to Promote Student Learning ! “Student Success” Defined ! Context of the work within STEM
Education Literature ! Claims examined ! Research Design ! Key Insights
Prepared by Orange County Department of Education - Dr. Dianne DeMille!

Prepared by Orange County Department of Education - Dr. Dianne DeMille!
University of California, Irvine Programmatic Support – Co-PI &
Research
Orange County Department of Education: Programmatic Support – Co-PI, Cognitive Coaching, &
Adaptive Schools
Santa Ana Community College Programmatic Support – Co-PI, &
STEM Faculty
California State University, Fullerton Programmatic Support – PI, Co-PI, & STEM Faculty
Garden Grove Unified School District Programmatic Support – Co-PI, TOSAs, Intermediate
Schools and High Schools, Administrators, Mathematics Teachers, & Students
! Narrow the achievement gap in algebra for targeted sub-groups
! Increase the numbers of students enrolled in advanced mathematics courses
! Increase student achievement incrementally ! Address equity for ALL student enrollment in
advanced mathematics courses ! Increase number of students meeting College
entrance requirements ! Increase number of students entering STEM fields
after graduation

! 71 STEM Faculty
! 150 Mathematics Teachers
! 5,100 University & Community College Students
! 9,742 High School Students
! 6,642 Intermediate School Students
! 53% Hispanic Students
! 31% Asian
! 14% White (not Hispanic)
! 33% English Learners
! 68% Free and Reduced Lunch Prepared by Orange County Department of Education - Dr. Dianne DeMille!
! How do you involve STEM Faculty in supporting teachers with content and strategies for increased student achievement?
! How do you scale up the use of mathematics coaches to all mathematics departments in a school district?
! How do you scale up implementation of Professional Learning Communities (PLCs) to all secondary school mathematics departments in a school district?

0% 10% 20% 30% 40% 50% 60% 70% 80% 90%
100%
2007 2008 2009 2010
Schl A All
Schl A Hsp
–1 13 –3
2 5 3
0% 10% 20% 30% 40% 50% 60% 70% 80% 90%
100%
2007 2008 2009 2010
Schl B All
Schl B Hsp
–14 8 –3
–13 6 –3
Note the trend lines
1. “How often do you talk to staff to look at results from state, district, or classroom assessments?”
2. “How often do you talk to staff about grading students’ work?”
3. “How often do you talk to staff about ideas for supporting challenging students (behavior problems or academic difficulties)?”
4. “How often do you talk to staff about instructional strategies or designing lessons?”
Ratings for the frequency of interactions with all teachers at their school on a 5-point scale (1=Rarely or never, 2=Every few months, 3=Every few weeks, 4=Weekly, 5=Daily)

Sociogram of 2 different Intermediate mathematics departments
64% “tie density” of all potential connections within the department, almost 2/3 on a weekly or daily basis
27% “tie density” of all potential connections on a weekly basis
Sociogram of all teachers (math teachers in red) in the 2 separate Intermediate schools.
PLC
Student Centered Focus
Office of 7-12 Instructional Services 8JUN10
Focus on Results/Goals Data Director/Aeries
Collaborative Culture of Shared knowledge
Coaching Cycle
Cognitive Coaching
Peer Coaching
Lesson Study
Common Agreements Grading Consult
Common Assessments District Benchmarks
CST
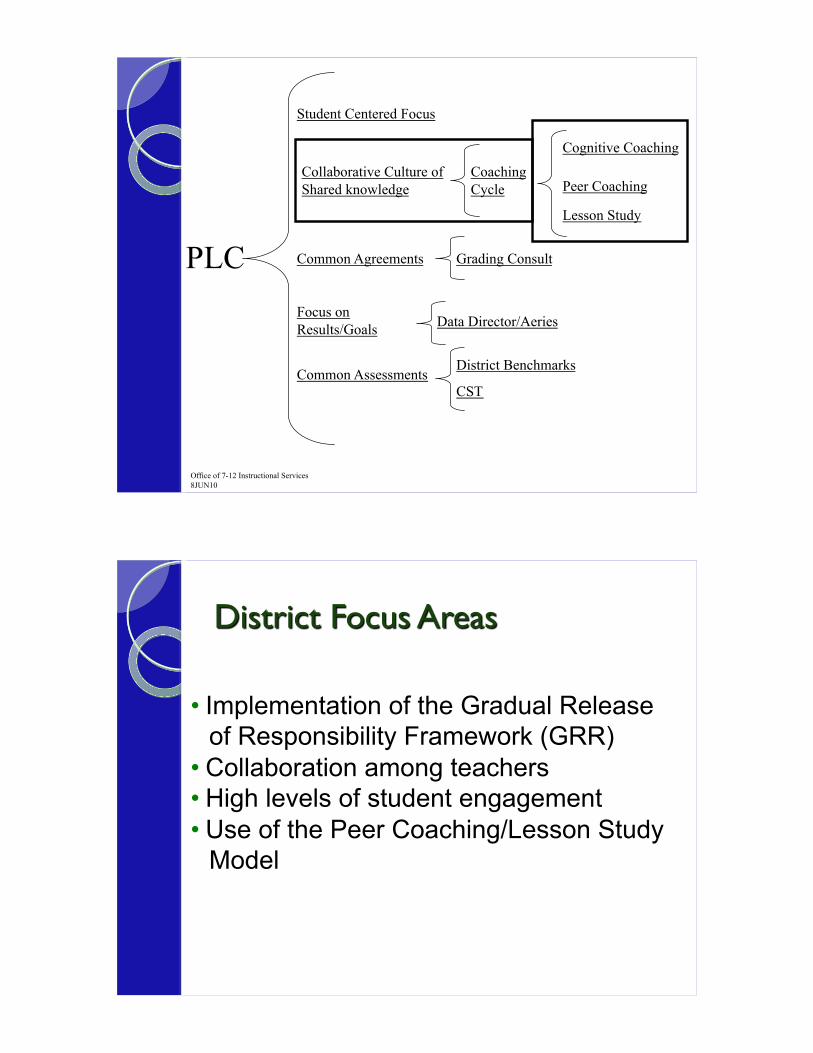
• Implementation of the Gradual Release of Responsibility Framework (GRR)
• Collaboration among teachers • High levels of student engagement • Use of the Peer Coaching/Lesson Study
Model

! Faculty Partners work with TOSAs to define Strategies Workshop content in both Pre-Algebra & Algebra
! Benchmarks
! California Standards
! Comparison of Rigor: Assessment with Instruction
! Course Textbook
Sample Problem: Steve traveled the first 2 hours of his journey at 40 mph and the remaining 3 hours of his journey at 80 mph. What is his average speed for the entire journey?
Typical Response: Average Speed = Total Distance/Total Time
= [(2 hrs x 40 mph)+(3 hrs x 80 mph)]/5 hrs = 320 miles/ 5 hrs = 64 mph

The question is equivalent to asking “what constant speed would yield the same area as Area A and Area B combined over a five-hour period?”

Area under the “Average Speed” graph = Area A + Area B
0
10
20
30
40
50
60
70
80
90
0 1 2 3 4 5 6
Spee
d (M
PH
)
Time (Hrs)
Graph of Steve's Speed
Part 1
Part 2
Average Speed
! STEM Faculty Partners connection with TOSAs
! STEM Faculty Strategic Workshop Presentations
! District-wide Focus – Greater Implementation with support from
! District Office
! Principals
! Peer coaches
! Department chairs
! PLCs at many levels guide the work
Prepared by Orange County Department of Education - Dr. Dianne DeMille!

! How do you involve STEM Faculty in supporting teachers with content and strategies for increased student achievement?
! How do you scale up the use of mathematics coaches to all mathematics departments in a school district?
! How do you scale up implementation of Professional Learning Communities (PLCs) to all secondary school mathematics departments in a school district?
Dr. David Pagni [email protected]
Dr. Dianne DeMille [email protected]
Dr. Patrick Kimani [email protected]
Sahra Tanikawa [email protected]
Hon Shiu Costello [email protected]
AnneMarie Conley [email protected]
http://taselm.fullerton.edu