Embed Size (px)
Citation preview

Volume 10 Number 9 1982 Nucleic Acids Research
Use of the 'Perceptron' algorithm to distinguish transational initiation sites in E. coli
Gary D.Stormo*, Thomas D.Schneider*, Larry Gold* and Andrzej Ehrenfeucht+
*Department of Molecular, Cellular and Developmental Biology, and +Department of ComputerScience, University of Colorado, Boulder, CO 80309, USA
Received 26 October 1981; Revised and Accepted 5 April 1982
ABSTRACTWe have used a "Perceptron" algorithm to find a weighting function which
distinguishes E. coli translational initiation sites from all other sites in alibrary of over 78,000 nucleotides of mRNA sequence. The "Perceptron"examined sequences as linear representations. The "Perceptron" is moresuccessful at finding gene beginnings than our previous searches using "rules"(see previous paper). We note that the weighting function can findtranslational initiation sites within sequences that were not included in thetraining set.
INTRODUCTION
A translational initiation region, or ribosome binding site, may be
defined by rules. In the previous paper we (1) showed that stronger rules can
be built by including information from about 35 bases of mRNA surrounding the
initiation codon. The number of such possible rules, even if one only varies
bases at the positions of information peaks, is very large. Even then, if we
absolutely require any specific feature, we will miss some known genes. For
example, the Shine and Dalgarno region is considerably variable and one gene,
the PRM transcript for cI of lambda, has no nucleotides 5' to the AUG (2).
Even the AUG is not absolutely required; our current library of genes contains
four cases of GUG initiation codons (1), and two occurrences of UUG have been
reported (3, 4). Furthermore, ADA can serve to initiate protein synthesis at
low rates in vivo (5). Essentially any RNA polymer can be made to initiate
translation under appropriate ionic conditions in vitro (6).We imagine that the ribosome scans mRNA, and translational initiation
may occur with some probability at any site. For regions without a proper
initiation codon or Shine and Dalgarno, the probability is essentially zero.
Having an AUG increases the probability and a nearby Shine and Dalgarno
increases the probability further. Other nucleotides in the vicinity can
influence the probability. "Favorable" nucleotides can compensate for a poor
Shine and Dalgarno, and, perhaps, "unfavorable" nucleotides can negate a good
© IRL Pros Umited, 1 Falconberg Court, London W1V 5FG, U.K. 2997
0305-1048/82/1009-2997S 2.00/0

Nucleic Acids Research
Shine and Dalgarno. Secondary structure will influence the probability as
well (7).
We will try here to define a probability function based solely on linear
sequences. The goal will be to find a mathematical function W, for weighting
function, such that applying W to any sequence will give a value, and the
magnitude of that value will determine whether that particular sequence is a
ribosome binding site. Stated more rigorously, we want to find a function W
such that the product W.S is greater than some threshold, T, if and only if
the sequence S is a ribosome binding site.
Researchers in the field of artificial intelligence have for years
investigated methods of automated pattern recognition. In the late 1950's, a
class of parallel feature detection systems with learning capabilities, called
"perceptrons", was developed by Frank Rosenblatt (8). In their book
Perceptrons, Minsky and Papert (9) prove the "Perceptron Convergence Theorem"
which shows that if a solution exists (of the kind the perceptron is capable
of reaching), that solution will be found in a finite number of steps (see
also 10). Though the method has not been particularly successful for the kind
of plane geometry problems initially contemplated, it seemed well suited for
our attempt to find a separation function for linear nucleic acid sequences.
METHODS
Data Base
The data base is the mRNA Library described in the previous paper
(1). It contains 78,612 bases of transcribed RNA on which reside (at least)124 genes. The potential genes of T7, noted by Dunn and Studier (11), are not
included in this set, nor are they included in any of the nongene sets.
Encoding the Sequences
We have chosen to encode the sequences in a matrix of 4 x N elements,
where N is the length of the sequence. All elements are either 1 or 0; 1
represents the presence of a base at a position, and 0 represents the
absence. Any column can have at most a single 1, 80 the matrix is quite
sparse. The seven long sequence ACGGTAC is encoded as:
1 2 3 4 5 6 7
A 1 0 0 0 0 1 0
C 0 1 0 0 0 0 1
G 0 0 1 1 0 0 0
T O 0 0 0 1 0 0
2998

Nucleic Acids Research
We could, of course, have encoded the four bases into only two bits, but
then some combinations of bases at any position would have been ambiguous.
For instance, if we had used the encoding
O 0 1 1A : ; C : ; G: ; T:
0 1 0 1
we could not distinguish (by the algorithm to be described) between classes
where the determining feature was an A or T versus a C or G. So as to not
bias our work against such combinations we used the four bit encoding. (Thisalso allows us to have sequences with no bases at some positions, as occurs
when an mRNA begins close to the initiation codon.)
Perceptron Algorithm
The task is to find a weighting function, W, such that W S > T if and
only if S is a ribosome binding site. (By W.S we mean the multiplication of
each element in S by the corresponding element in W, and then the sum of those
products.) Such a W and T would serve to distinguish ribosome binding sites
(sequences in S+) from all other sites (sequences in S-). The algorithm can
be described by the following three step procedure (9):
test: choose a sequence S from S+ or S-
if S is in S+ and W S > T go to test
if S is in S+ and W S < T go to add
if S is in S and W S < T go to test
if S is in S and W S > T go to subtract
add: replace W by W + S
go to test
subtract: replace W by W - S
go to test
Figure 1 is an example of how this works in detail. The perceptron
convergence theorem (9, 10) guarantees that, if a solution exists, the
solution will be found in a finite number of steps. The number of steps may,
however, be extremely large. We decide whether or not a solution will be
found by examining the number of changes to W that take place during eachround of learning, where a round of learning consists of examining each
sequence. If the number of changes plateaus for many rounds we terminate the
process and assume a solution doesn't exist (see Figure 3).Data Flow and Programs Used
All programs used (Table 1) are written in Pascal and are part of the
Delila system (12). Figure 2 shows the flow of data and the programs used.
2999

Nucleic Acids Research
S+
Sl: AGGCGCAT CT
Sj : ACTCA
S: C6ATT
1 2 3 4 5A 8 4 -8 -3 -1
C -4 -7 -3 2 4G,G 3 2 1 -4 -2
T 5 -4 -6 7 3
e 'W1- 8 +2 +1 +2 -2 = U OKjW'W 8 -7 -6 +2 -1 -4 OK
WI$ = -44 -6 +2+3 - -1 CEwW1 2 3 4 5
A 8 5 -8 -3 -1
Wl + W2C -3 -7 -3 3 4G 3 2 1 -4 -2T 5 4 -5 7 4
92-W2 -3 +2 -8 +7 +4 - 2 Cwo W
1 2 3 4 5A 8 5 -9 -3 -1
73C -7- 34
2-S2 G 3 1 1 -4 -2T 5 -4 -5 63
elW3 = -U OK
S1 '3= -2 OK
W3= 2 OK
S2 W3 -3 OK -
Figure 1. We show an example of the perceptron algorithm applied to somenucleotide sequences. The sequences S+ and S- represent different classes.The threshold is 0. W1 is an arbitrary starting point. The 'PerceptronConvergence Theorem" guarantees that a solution will be found (if one exists)regardless of the starting W.
The m Library and the gene instructions set are made as described in the
previous paper (1). The first nongene set used was those sequences found by
rule 2 of that paper. New nongenes were found, using the program PatSer, from
various sublibraries of the mRNA library, until no new sites were found in the

Nucleic Acids Research
TABLE 1List of Programs Used
entire mNNA library.
RESULTS AND DISCUSSION
Random Sequences
In the example of the perceptron algorithm (Figure 1), it is clear that
many other solutions exist, depending on the choice of W1. Separating two S+sequences from two different S- sequences when the sequences are five long is,
in fact, trivial. At what nmber of sequences, of a given length, does the
ability to find a separating W become significant? An equivalent problem is
determining the probability of finding a hyper-plane that will separate two
sets of points in N dimensions. That remains an open question, but clearly
increasing the nmber of points (different sequences) in either set decreases
3001
Nam Version Purpose
Concat 1.00 Concatenate text files
Delila 1.20 Librarian: extracts libraries
based on Delila instructions
PatAn 1.10 Analyzes a W matrix
PatLrn 2.01 Based on 'Perceptron' algorithm,
generates a W matrix which
distinguishes two sets of
sequences
PatLst 1.10 Listing of a W matrix
PatSer 1.10 Searches a library with a W matrix
and identifies all sites
evaluated above 8soe
threshold; produces Delila
instructions to get those
sites
PatVal 1.10 Evaluates a library of sequences by
a W matrix
Sepa 1.07 Separates Delila instruction sets

Nucleic Acids Research
Figure 2. Flow diagram. Boxes represent data files (described in the text)and dots represent programs (described in Table 1). The arrows indicate thedirection of information flow. If PatLrn does not find a solution in auser-specified number of rounds, that failure is noted and the program isterminated. When the searched library (Box 8) is the entire =RNA library (Box1) and no new nongenes are found (that is, Box 10 is empty), that W matrix(Box 6) serves to distinguish the gene beginnings from all other sites.
the probability of separation, as does decreasing the number of dimensions
(shortening the sequences). We tested for significance using 75 arbitrarily
chosen 101-long sequences (from MS2 and G4) to represent the S+ class. We
then tried to find a W which would separate them from a library of less than
20,000 coliphage bases. The answer is that such a W does not exist (Figure
3). Therefore, if we can separate 124 sites (of 101 nucleotides) from a
library of over 78,000 bases that result is highly significant. If we can
succeed with shorter sequences the answer becomes more significant.Gene Beginnings
i) 101-long sequences
The gene set was all 124 known starts in the mRNA library. The first
set of nongenes was the 167 sites found by rule 2 of the previous paper (1).

Nucleic Acids Research
900
Soo
800
700
600
° 500
c> 400
300
200
100 L4
100 200 300 400 500 600 700 800
Round of training
Figure 3. We show the number of changes to the W matrix per round of trainingfor different data sets. A round of training is the examination of eachsequence in the larger class (S+ or S-) exactly once. Sequences in thesmaller class will be examined at least once. The three experiments are: 75arbitrarily chosen phage sequences versus 1074 other phage sequences, each 101bases long (-); the 124 genes versus 1034 nongenes, each 101 bases long(.... ); the 124 genes versus 1082 nongenes, each 71 bases long (--).
W was initialized as all zeros. 'The program PatLrn changed W until it
separated the input sets. This W was used to search a sublibrary, MS2, (usingthe program PatSer) to find new sites which are wrongly classified as genes.
Those sites were added to the nongene set and PatLrn used to find a new W that
separates the genes from the nougenes. After nine cycles of using PatLrn and
PatSer (on the mNA library and various sublibraries, see Figure 2) a W was
found which finds only the 124 known genes from the entire mRNA library.That matrix, W101, is shown in Figure 4. One would expect that the positions
most important for the separation of S+ from S- would show the largest
3003
Nucleic Acids Research
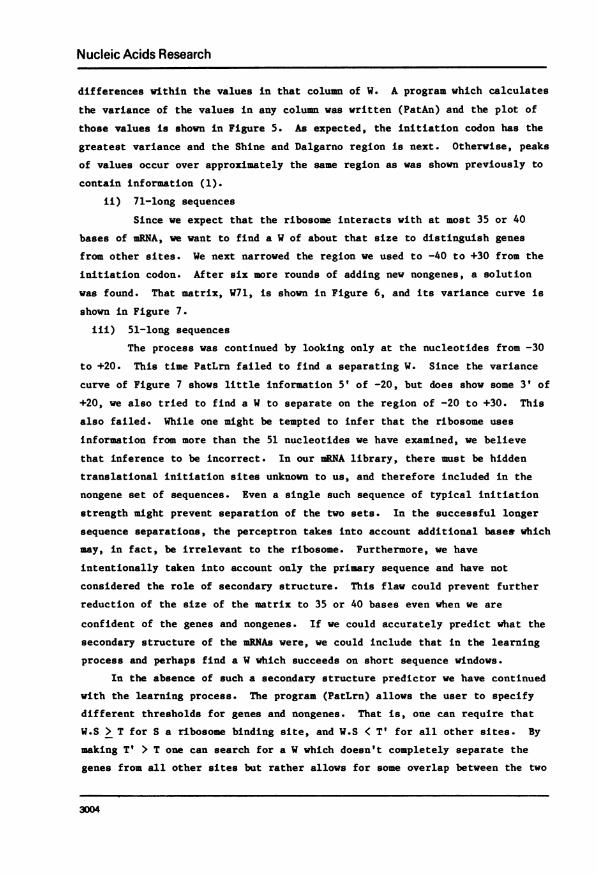
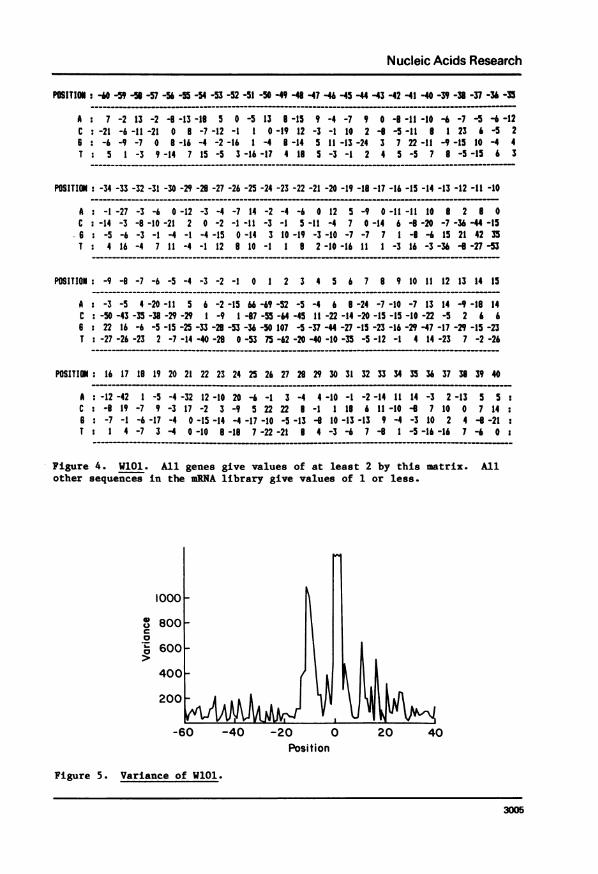
differences within the values in that column of W. A program which calculates
the variance of the values in any column was written (PatAn) and the plot of
those values is shown in Figure 5. As expected, the initiation codon has the
greatest variance and the Shine and Dalgarno region is next. Otherwise, peaks
of values occur over approximately the same region as was shown previously to
contain information (1).
ii) 71-long sequences
Since we expect that the ribosome interacts with at most 35 or 40
bases of mRNA, we want to find a W of about that size to distinguish genes
from other sites. We next narrowed the region we used to -40 to +30 from the
initiation codon. After six more rounds of adding new nongenes, a solution
was found. That matrix, W71, is shown in Figure 6, and its variance curve is
shown in Figure 7.
iii) 51-long sequences
The process was continued by looking only at the nucleotides from -30
to +20. This time PatLrn failed to find a separating W. Since the variance
curve of Figure 7 shows little information 5' of -20, but does show some 3' of
+20, we also tried to find a W to separate on the region of -20 to +30. This
also failed. While one might be tempted to infer that the ribosome uses
information from more than the 51 nucleotides we have examined, we believe
that inference to be incorrect. In our mRNA library, there must be hidden
translational initiation sites unknown to us, and therefore included in the
nongene set of sequences. Even a single such sequence of typical initiation
strength might prevent separation of the two sets. In the successful longer
sequence separations, the perceptron takes into account additional baset which
may, in fact, be irrelevant to the ribosome. Furthermore, we have
intentionally taken into account only the primary sequence and have not
considered the role of secondary structure. This flaw could prevent further
reduction of the size of the matrix to 35 or 40 bases even when we are
confident of the genes and nongenes. If we could accurately predict what the
secondary structure of the mRNAs were, we could include that in the learning
process and perhaps find a W which succeeds on short sequence windows.
In the absence of such a secondary structure predictor we have continued
with the learning process. The program (PatLrn) allows the user to specify
different thresholds for genes and nongenes. That is, one can require that
W.S > T for S a ribosome binding site, and W.S < T' for all other sites. By
making T' > T one can search for a W which doesn't completely separate the
genes from all other sites but rather allows for some overlap between the two
3004
Nucleic Acids Research
PSITION : -40 -9 -5 -57 -56 -55 -54 -53 -52 -51 -50 -49 -4 -47 -4 -45 -44 -43 -42 -41 -40 -39 -38 -37 -36 -35
AC6T
7 -2 13 -2 -9-13-18 5 0 -5 13 8-15 9 -4 -7 9 0 -8-11-10 -6 -7-5 -6-12: -21 -6 -11 -21 0 8 -7 -12 -1 I 0-19 12 -3 -I 10 2 --8-511 8 1 23 6 -5 2: -6 -9 -7 0 8-16 -4 -2-16 1 -4 8-14 5 11-13-24 3 7 22-11 -9-15 10 - 4
5 1 -3 9-14 7 15 -5 3-16-17 4 18 5 -3 -12 4 5 -5 7 8 -5-156 3__- ___ _____---_
POSITION : -34 -33 -32 -31 -30 -29 -29 -27 -26 -25 -24 -23 -22 -21 -20 -19 -18 -17 -16 -15 -14 -13 -12 -11 -10
AC
- 6T
: -1 -27 -3 -6 0 -12 -3 -4 -7 14 -2 -4 -6 0 12 5 -9 0 -1 -I 10 8 2 8 0: -14 -3 -8 -10 -21 2 0 -2 --1- 1 -3 -1 5-11 -4 7 0-14 6 -8 -20 -7 -36 -U -15: -5 -6 -3 -1 -4 -1 -4-15 0-14 3 10-19 -3-10 -7 -7 7 1 -8 -6 15 21 42 35: 4 16 -4 7 11 -4 -1 12 810 -1 1 8 2 -10 -16 11 1 -3 16 -3336-6 -27 -3
_- -_ _--- ___-_ _ _-_ _
------------_ _ _ _ _ _ _ _ _ _ _ _ _ _ ___-
POSITION: -9 - -7 -6 -5 -4 -3 -2 -1 0 1 2 3 4 56 7 9 1011 12 13 14 15
A: -3 -5 4 -20 -11 5 6 -2 -15 66 -69 -S2 -5 -4 6 8 -24 -7 -10 -7 13 14 -9 -18 14C : -50 -43 -35 -38 -29 -29 1 -9 1 -87 -55 -64 -45 11 -22 -14 -20 -15 -15 -10 -22 - 2 6 66 : 22 16 -6 -5 -15 -25 -33 -28 -53 -36 -50 107 -5-37 -44 -27 -15 -23 -16 -29 -47 -17 -29 -15 -23T: -27-26-23 2 -7-14-40 -2 0-53 75-62-20-40-10-35 -5-12 -1 4 14-23 7 -2-26
POSITION: 16 17 19 19 20 21 22 23 24 25 26 27 28 29 30 31 32 33 34 35 36 37 38 39 40
AC6T
: -12 -42 1 -5 -4 -32 12 -10 20 -6 -1 3 -4 4 -10 -1 -2 -14 11 14 -3 2 -13 5 S :: -8 19 -7 9 -3 17 -2 3 -9 5 22 22 8 -1 I 18 6 11-10 -6 7 10 0 7 14:: -7 -1 -6-17 -4 0-15-14 -4-17-10 -5-13 - 10-13-13 9 -4 -3 10 2 4 -8-21:
1 4 -7 3-4 0-10 8-18 7-22-21 8 4 -3 -6 7 -8 1 -5-16-16 7 -6 0
Figure 4. WiOl. All genes give values of at least 2 by thisother sequences in the mRNA library give values of 1 or less.
0
Ca
0
1000
800
600
4001
200
-60 -40 -20
matrix. All
0 20 40Position
Figure 5. Variance of WlOl.
3005

Nucleic Acids Research
POSITIN: -40 -39 -38 -37 -36 -35 -34 -33 -32 -31 -30 -29 -2 -27 -26 -25 -24 -23 -22 -21 -20 -19 -18-17
A :-19-16-21 -8 1 2-12-45-16 -9 9 0 -7 -7 9 30 5 -1-16-12 10 3 -3-11C: 2 2 3 -7-14 -1-17 -1-21 -8-20-13 1 -2 4 -2 8 3 8 -9 4 -2 14 56 :-31 -18 -11 12 -14 -5 -7 -9 -12 -14 -14 0 -9 -4 5 -18 16 29 -6 -1 -5 -1 0 12T : 21 4 1 -25 -4 -2 9 -1 -6 12 6 -9 -4 -1 16 24 2 21 4 2-151 I -10
POSITION:-16-15-14-13-12-11 -10 -9 -8 -7 -6 -5 -4 -3 -2 -1 0 1 2 3 4 5 6 7
A : -9 -1 26 7 4 21 -8 -4-14 -2-17-10 1 25 -6-18 91-103-74-33-16 -2 -1-34C -1 -21 -21 -9 -38 -63 -31 -60 -43 -37 -53 -39 -31 3 -18 -9-129 -91-114 -58 -9 -42 -19 -246 -10 -5 -16 22 32 59 50 31 36 4 -1 -24 -34 -55 -29-65 -53- 142 -17 -38 - -60 -34T 16 22 -5 -37 -16 -35 -73 -42 -54 -0-5 -6 -16 -53 -27 12-105 87 -83 -25 -6 -19 -47 -32
POSITIN: 8 9 10 11 12 13 14 15 16 17 18 19 20 21 22 23 24 25 26 27 28 29 30
A :-25 -29 -18 0 16 -3-18 22-14 -42 3 0 1-23 20 -11 21 4 -13-15 -7 1 -9C :-30-21-14-29 7 14 16 2-19 26-18 16-13 11 -9 2 -5 14 41 33 1 -9 -56 :-28 -12 -41 -52 -19 -37 -24 -36 -3 -7 4-10 - -6-12 -18 4 -21 -7 3-18 1 9T :-23 6 17 25-46 0 0-15 11 14 9 1 75-12 16-30 -7-31-27 22 5 2:
Figure 6. W71. All genes give values of at least 3 by this matrix. Allother sequences in the mRNA library give values of 2 or less.
sets. The program doesn't, however, have a means of finding a "best" W of
this type, either by minimizing the range of overlap or the number of nongenes
in the overlap region. Rather, one must try different cases of T and T' until
one is satisfied with the result.
Figure 8 is the matrix, W51, for which all genes give a value greater
than 0 (T) and all nongenes give a value less than 30 (T'). The variance is
2000
o 1600 -
1200
800X
400-
-40 -20 0 20Position
Figure 7. Variance of W71.

Nucleic Acids Research
POSITION :-30 -29 -28 -27 -26 -25 -24 -23 -22 -21 -20 -19 -18 -17 -16 -15 -14 -13 -12 -11 -10 -9 4 -7 4 -5
A: -6-31 -8 2 39 20 7 15-26 -3 4 15 16 -4 -1 8 42 29 4 23-31-39-24-13-37-30C -51 -33 -26 -1 -38 -6 8 12 13 -36 -20 -13 32 35 13 -17 -2 16 -44 -28- -52 9-6 4456 :-22 -18 -36 -6 -12 -3 4 18 -37 -24 -8 -30 16 30 1 25 -11 29 60 89 52 19 7 -14 -18 -46T -13 -10 -5 12 38 -6 -16 19 8 21 -18 -13 59 -10 37 32 18 -29 24 -0116 -70 -71 -13 -37
POSITION: -4 -3 -2 -10 1 2 3 4 5 6 7 8 9 10 11 12 13 14 IS15 17 18 19 20
A -6 23 -12 -53 98-213-166 -76 -32 -1 -22 -45 -55 -30 -40 9 32 8 -10 39 4-74 9 59 -23C :-59 -33 -55 -26-196-166-147-115 -20 -42 0 -30 -42 -45 -11 -48 27 35 16 18 4 39 13 46 -116: -53 -69 -37 -U 47-124 164 -49 -78-121 -70 -42 -35 -12 -22 -0 -22 -26 -18 -30 -11 23 53 5 -18T -41 -81 -56 7-254 126-184-93-64 -2-74-49-31 11 0 26-40-16 13-26 7 20 42 U -7
Figure 8. W51. All genes give values of at least 0 by this matrix. Allother sequences in the mRNA library give values of 30 or less.
shown in Figure 9 and is quite similar to the gene x2 curve in the previouspaper (1), except for a peak at position 17. While not totally separatingall genes from all other sites, W51 does considerably better than any of the
rules discussed in the previous paper, even the extended rule. This matrix
finds all of the 124 genes, as being evaluated at greater than 0, and finds
only 64 other sites with values as great. This is out of over 78,000 other
sites. Figure 10 shows the range of values for genes and nongenes using this
matrix. The nongenes shown represent the tail of a distribution of all the
other sites, whose average value is about -900. One can generalize for W51
that sites with values greater than 30 are genes, sites with values less than
3000 -
C I.22000 I
o>
-40 -20 0
Position
Figure 9. Variance of W51.
3007

Nucleic Acids Research
X20 \S.-
0
o 10Ez
0 50 100 150 200 250 300 350T T Values
Figure 10. We show the values of genes ( ) and nongenes (....) for W51.All genes give values of at least 0 (T) and all nongenes give values of 30 orless (T'). Most of the sequences in the mRNA library (over 78,000 bases) givevalues less than -5 and are not plotted.
0 are not genes, and sites with values in between are of both classes.
Predictive Value
In order to decide if the resulting Ws have learned distinguishing
features of gene beginnings, as opposed to memorizing the training set,
we tested them on new sequences which became available to us after our last
library update. Table 2 compares the predictive ability of each of the three
Ws and rule 2 of the previous paper. Surprisingly, W101 is by far the best
predictor of gene beginnings. Not only does it find the most genes but it
also finds the fewest other sites. Perhaps this means that the context of the
ribosome binding site is important beyond the region of direct interaction
with the ribosome as measured in an initiation complex (22). W51 and W71 both
find fewer of the genes than rule 2 but also find fewer other sites; the ratio
of genes found to nongenes found is higher using W51 or W71 than using rule 2.
The collection of genes in Table 2 is somewhat atypical for E. coli in
that 3 of the 10 do not start with ATG; tufA begins with GTG while rps20 and
ndh start with TTG. Rule 2 (which requires an ATG) cannot identify these
sites. If Rule 2 were changed to allow GTG and TTG, tufA, rps20, and ndh
would be found, along with approximately 3 times as many nongenes as before.
The W matrices, however, don't require an ATG, though that codon is favored at
the initiation site. They all, in fact, properly classify the four GTG starts
in the set of genes they were trained on. W101 finds the GTG start for tufA,
and even properly identifies the TTG start of rpj20, though there were no TTG
starts included in the training set.
We have already used this method to identify the location of one gene.
3008

Nucleic Acids Research
TABLE 2Prdictive Ability of V Natrices
genes found/nongenes found
8-ns (ref) rule 21 1I101 W71 151
!.pB,tsf (13) 2/2 2/1 1/2 1/2
lexA (14, 15)2 1/0 0/0 0/0 0/0
rpoD (16) 0/3 0/1 0/0 0/1
T4E,IPIII (17) 2/1 2/1 2/2 2/2
tufB (18)3 1/2 1/0 1/0 1/0
tufA (19) 0/2 1/0 0/0 0/0
rps20 (3) 0/0 1/0 0/0 0/0
ndh (4) 0/2 0/2 0/2 0/2
total 10 genes 6/12 7/5 4/6 4/7
lFrom the previous paper (1), rule 2 finds all sequences of (AGG,GGA or GAG) followed by ATG after 6 to 9 unspecified bases.
20nly the first 720 bases were searched since the sequences from thetwo references disagree after than point.
3Only the sequence following the tRNA genes was searched.
We received a preprint describing a 750 base-pair sequence including the T4 e
(lysozyme) gene (17). Beyond the end of the e gene (position 583 in the
sequence) is an ATG which is found by rule 2 and by each of our W matrices.
That ATG is followed by an open reading frame through the end of the
sequence. The T4 map (20) puts ipIII 3' to the lysozyme gene, and the amino
terminal amino acid sequence of ipIII has been determined (21). There is only
one discrepancy between the predicted first U amino acids and those
determined from protein sequencing, a threonine versus a valine. We consider
this proof that this site is the start of ipIII and have included it in Table
2. The one discrepency is probably due to either strain differences or a
sequencing error.
CONCLUSION
There are two advantages to this method of defining a functional site
over the more conventional consensus sequence approach. The first is that we
have specified nothing about the functional sequences except their inclusion
in that class. The algorithm finds a weighting of all the features (bases at
particular positions) that serves to distinguish the classes. No single
3009

Nucleic Acids Research
feature is totally required; only the weighted sum of all the features is
important. This is in complete agreement with the observation that only the
central U of the initiation codon is absolutely conserved in all known in vivo
translational start sites.
The second advantage is that each site is evaluated quantitatively. This
is especially useful in using the method to predict sites, because one can
order the sites found. For example, using W71 to evaluate the T4 e and IPIII
sequence, both genes are found and two nongenes are found, but the genes are
evaluated three to six times higher than the nongenes. W51 finds no sites on
the lexA sequence, but the site which is given the highest value is the
correct gene beginning. We would like to believe that the value given to each
sequence reflects its "strength" as an initiation site, but that is probably
not true. If we examine genes that we know are translated in-large amounts,
such as the ribosomal proteins and phage coat proteins, their values lie in
the upper half of the gene distributions (as in Fig. 10), but are not
clustered at the top end. If we knew the relative translational efficienciesof a large number of the genes, we could include that in the training process
and require that values correlate with "strength". Unfortunately, very few
quantitative comparisons have been made.
This paper is the second report we have made, using a different approach,
that demonstrates information relevant to ribosome initiation besides the
initiation codon and the Shine and Dalgarno sequence (1). Interactions
between the ribosome and specific sequences (other than the Shine and
Dalgarno) have not been demonstrated. We think that these other informationalbases influence the rates at which some of the partial reactions involved in
initiation occur (22).
Finally, we note that the perceptron as constructed here scans linear
sequences. We have reason to be wary of entirely linear investigations of
information in an RNA molecule, although the data we obtained are
interesting. We would be less wary of linear investigations of information
within sequences that represent sites used on double-helical DNA.
Accordingly, we will next use the perceptron on promoters, a complex class of
sequences recognized during transcriptional initiation.
ACKNOWLEDGEMENTS
We wish to thank Dr. Jeffrey Haemer and Dr. Jan Mycielski for thoughtfulconsultation during the course of this work. This project has been supportedby NIH Grant #GM28755.
3010
Nucleic Acids Research
REFERENCES1. Stormo, G.D., Schneider, T.D. and Gold, L. (1982) Nucl. Acid Res., this
issue.2. Ptashne, M., Beckman, K., Humayun, M.Z., Jeffrey, A., Maurer, R.,
Meyer, B. and Sauer, R.T. (1976) Science 194, 156-161.3. Mackie, G.M. (1981) J. Biol. Chem. 256, 8177-8182.4. Young, I.G., Rogers, B.L., Campbell, H.D., Jaworowski, A. and Shaw, D.C.
(1981) Eur. J. Biochem. 116, 165-170.5. Belin, D., Hedgpeth, J., Selzer, G.B. and Epstein, R.H. (1979) Proc.
Natl. Acad. Sci. USA 76, 700-704.6. Nirenberg, M.W., Jones, O.W., Leder, P., Clark, B.F.C., Sly, W.S. and
Pestka, S. (1963) Cold Spring Harbor Sym. on Quantitative Biology, 28,549-557.
7. Hall, M.N., Gabay, J., Debarbouille, M. and Schwartz, M. (1982) Nature295, 616-618.
8. Sampson, J.R. (1976) in Adaptive Information Processing, Springer-Verlag,especially pages 131-135.
9. Minsky, M. and Papert, S. (1969). in Perceptrons, The MIT Press,especially Chapter 11.
10. Mycielski, J. (1979) J. of Approx. Theory, 25, pp. 364-383.11. Dunn, J.J. and Studier, F.W. (1981) J. Mol. Biol. 148, 303-330.12. Schneider, T.D., Stormo, G.D., Haemer, J.S. and Gold, L., (1982) Nucl.
Acid Res., this issue.13. An, G., Bendiak, D.S., Mamelak, L.A. and Friesen, J.D. (1981) Nucl.
Acid Res. 9, 4149-4161.14. Horii, T., Ogawa, T. and Ogawa, H. (1981) Cell 23, 689-697.15. Markham, B.E., Little, J.W. and Mount, D.W. (1981) Nucl. Acid Res.
9, 4149-4161.16. Burton, Z., Burgess, R.R., Lin, J., Moore, D., Holder, S. and Gross,
C.A. (1981) Nucl. Acid Res. 9, 2889-2903.17. Owen, J.E., Schultz, D.W., Taylor, A. and Smith, G.R., submitted.18. An, G.,Friesen, J.D. (1980) Gene 12, 33-39.19. Yokota, T., Sugisaki, H., Takanami, M. and Kaziro, Y. (1980) Gene 12,
25-31.20. Wood, W. and Revel, H. (1976) Bacteriological Reviews 40, 847.21. Isobe, T., Black, L.W. and Tsugita, A. (1976) Proc. Natl. Acad. Sci. USA
73, 4205-4209.22. Gold, L., Pribnow, D., Schneider, T., Shinedling, S., Singer, B.S. and
Stormo, G. (1981) Ann. Rev. Microbiol. 35, 365-403.
3011


![[grobertson@rtconnect.net] 03, 201 0 11 :41 To Subject · Gary Robertson [grobertson@rtconnect.net] Friday, December 03, 201 0 11 :41 AM Donovan, Larry RE: Radiation Safety Plan Larry,](https://img.pdfslide.net/doc/110x75/608951f41966a755c02aac2d/grobertson-03-201-0-11-41-to-subject-gary-robertson-grobertson-friday.jpg)


![Produced by Wally Minko & Gary Grant - Dan · PDF fileTom Evans, Larry Klimas, Sal Lozano, Eric Marienthal, Don Markese 7 24101 24852 8. ... Produced by Wally Minko & Gary Grant [4:02]](https://img.pdfslide.net/doc/110x75/5aa3c50a7f8b9a46238ec6e1/produced-by-wally-minko-gary-grant-dan-evans-larry-klimas-sal-lozano-eric-marienthal.jpg)