Embed Size (px)
Citation preview
Gas Distribution Asset Management Plan Update - 2014
Date: 30 June 2014 Vector Gas Distribution Page 1 of 33
Gas Distribution Asset Management Plan Update
Information Disclosure 2014
Gas Distribution Asset Management Plan Update - 2014
Date: 30 June 2014 Vector Gas Distribution Page 2 of 33
CONTENTS 1. Introduction ............................................................................................... 3 2. Update to Network Development Planning ................................................. 3
2.1 Gross new connections ......................................................................................... 4
2.2 Peak Demand Update .......................................................................................... 6
3. Life-Cycle Asset Management Changes ...................................................... 6 3.1 Pre-1985 PE pipeline replacement strategy ............................................................. 6
3.2 Restoration of cathodic protection on the Hamilton MP4 steel services ......................... 7
4. Asset Management Maturity Changes ......................................................... 8 5. Project Programme Update ........................................................................ 8 6. Capital and Operational Expenditure Forecast Update .............................. 11
6.1 Capital Expenditure ........................................................................................... 11
6.2 Operational Expenditure ..................................................................................... 12
6.3 Explanation of Major Variances ............................................................................ 14
Appendix 1 Report on Forecast Capital Expenditure ................................................... 15
Appendix 2 Report on Forecast Operational Expenditure ............................................. 22
Appendix 3 Report on Asset Condition ..................................................................... 26
Appendix 4 Report on Forecast Utilisation ................................................................ 28
Appendix 5 Report on Forecast Demand ................................................................... 31
LIST OF FIGURES Figure 1 : Total connection numbers, historical and forecast ................................................................ 4
LIST OF TABLES Table 1 : Forecast number of connections under different scenarios .................................................... 4 Table 2 : Total customer connections forecast (medium case) .............................................................. 6 Table 3 : Forecast disclosed connections in Section 5 of the 2013 AMP ................................................ 6 Table 4 : Major variances between 2013 and 2014 connections forecast ............................................. 6 Table 5 : Gas distribution network 10 year capital works programme ................................................ 10 Table 6 : Proposed capital expenditure forecast .................................................................................. 11 Table 7 : Capital expenditure forecast disclosed in Section 9 of the 2013 AMP .................................. 12 Table 8 : Variances between 2013 and 2014 capital expenditure forecast .......................................... 12 Table 9 : Proposed operational expenditure forecast .......................................................................... 13 Table 10 : Operational expenditure forecast disclosed in Section 9 of the 2013 AMP ........................ 13 Table 11 : Major variances between 2013 and 2014 operational expenditure forecast ..................... 13
Gas Distribution Asset Management Plan Update - 2014
Date: 30 June 2014 Vector Gas Distribution Page 3 of 33
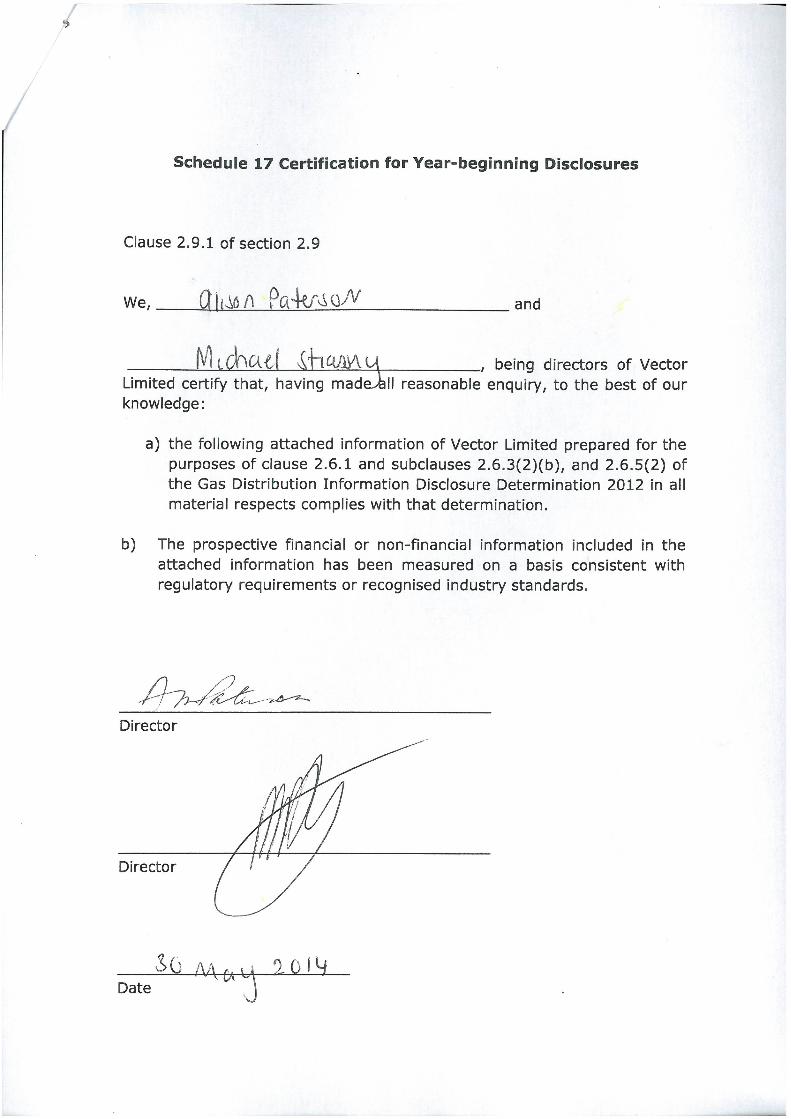
1. INTRODUCTION This Asset Management Plan (AMP) Update (the Update) has been prepared to inform Vector’s customers and other stakeholders of material changes and updates to our asset management planning since 30 June 2013, when the last full Gas Distribution AMP (2013-2023) was published.1 In particular the update contains updated 10-year capital investment and maintenance programmes for the gas distribution network. These have been revised to reflect new improvement programmes initiated over the course of the last year, ongoing analysis of the performance and condition of the network assets, as well as additional information received from third parties, such as Auckland Council’s projections on forecast housing growth across the network over the next 5-10 years.
In addition, this Update fulfils our regulatory disclosure requirements, as set out under Clause 2.6 of the Commerce Commission’s Gas Distribution Information Disclosure Determination 2012 (IDD).
As part of Vector’s ongoing operation, the AMP, and this AMP Update are important components of our network growth, maintenance and investment planning processes. It also forms a key input into the annual capital and direct operating expenditure budget. However, when reading these documents, it is important to note the following:
While the AMP and the Update present Vector’s best view of its asset management and network investment intentions at the time of publication, it does not commit Vector to carrying out any of the individual projects or initiatives described within the document. These may be amended to reflect changes to Vector’s regulatory or operating environment, customer energy demand trends and requirements, customer or network technology, or Vector’s commercial priorities;
Projects and initiatives described in the AMP or the Update are still subject to internal governance procedures, including meeting financial approval requirements before they can proceed. This may lead to changes in the scope of works or the overall programme; and
Uncertainty associated with the regulatory regime that applies to the gas distribution business remains a significant factor weighing on the ability to and appetite for investing in line with the forecasts reflected in this Update. The potential for adverse changes to the regulatory regime, the most imminent being the potential review of the allowed regulatory rate of return on investments, is damaging to incentives to invest. Concerns about housing affordability may also put pressure on the acceptable level of up front customer contributions to the forecast capital expenditure; the potential for Vector to have to carry a larger proportion of the capital expenditure, coupled with potentially adverse regulatory outcomes, therefore represents a disincentive to Vector’s ability to deliver growth to the gas network.
2. UPDATE TO NETWORK DEVELOPMENT PLANNING This section discusses factors that lead to material changes to the network development plan described in section 5 of Vector’s 2013 AMP.
1 A copy of this AMP is available on the Vector website, at http://vector.co.nz/gas‐asset‐management
Gas Distribution Asset Management Plan Update - 2014
Date: 30 June 2014 Vector Gas Distribution Page 4 of 33
2.1 Gross new connections
A number of significant Council and Government documents have been published since planning was completed for Vector’s 2013 AMP, including the Auckland Housing Accord and the draft Auckland Unitary Plan. Although the forecast growth described in these documents is not fully translatable to gas distribution network growth (as gas is an optional commodity in the residential market), we are conscious that there will be some impact on network growth if these Council and Government forecasts come to fruition. In order to understand this impact and the impact of other economic indicators on our new connections growth analysis, Vector commissioned Covec to conduct an independent forecast of connection rates on the gas distribution network.
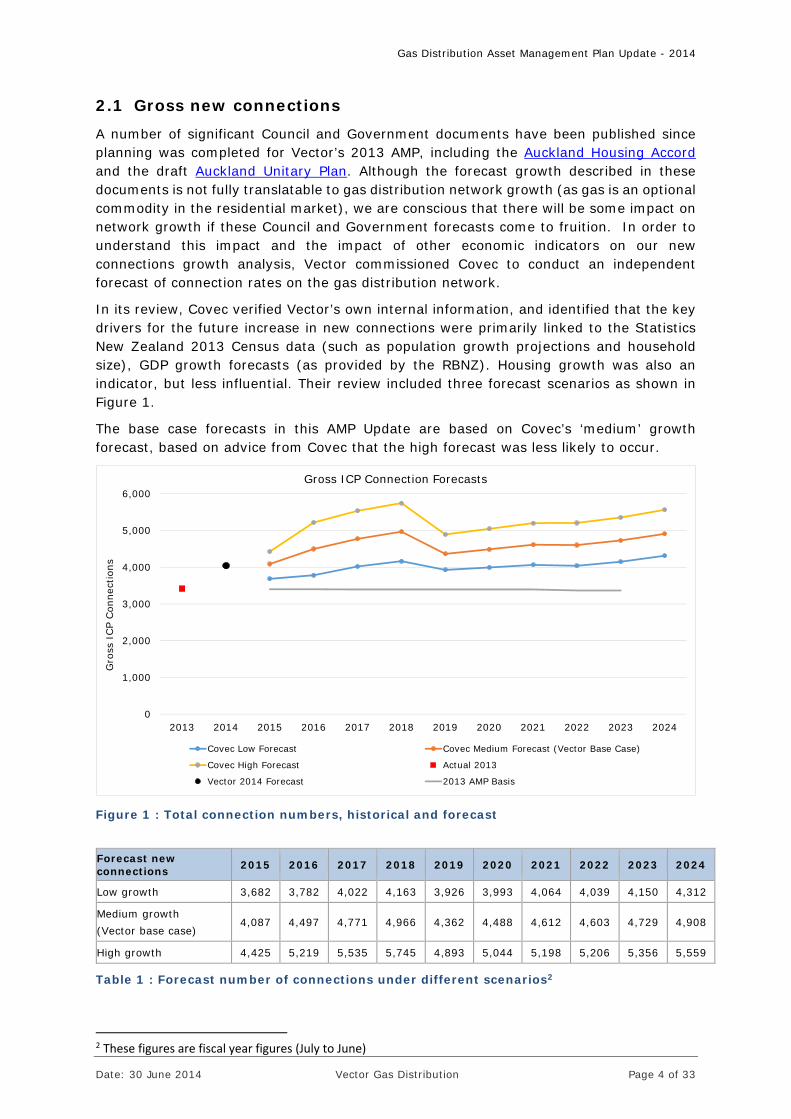
In its review, Covec verified Vector’s own internal information, and identified that the key drivers for the future increase in new connections were primarily linked to the Statistics New Zealand 2013 Census data (such as population growth projections and household size), GDP growth forecasts (as provided by the RBNZ). Housing growth was also an indicator, but less influential. Their review included three forecast scenarios as shown in Figure 1.
The base case forecasts in this AMP Update are based on Covec’s ‘medium’ growth forecast, based on advice from Covec that the high forecast was less likely to occur.
Figure 1 : Total connection numbers, historical and forecast
Forecast new connections 2015 2016 2017 2018 2019 2020 2021 2022 2023 2024
Low growth 3,682 3,782 4,022 4,163 3,926 3,993 4,064 4,039 4,150 4,312
Medium growth (Vector base case)
4,087 4,497 4,771 4,966 4,362 4,488 4,612 4,603 4,729 4,908
High growth 4,425 5,219 5,535 5,745 4,893 5,044 5,198 5,206 5,356 5,559
Table 1 : Forecast number of connections under different scenarios2
2 These figures are fiscal year figures (July to June)
0
1,000
2,000
3,000
4,000
5,000
6,000
2013 2014 2015 2016 2017 2018 2019 2020 2021 2022 2023 2024
Gro
ss I
CP
Con
nect
ions
Gross ICP Connection Forecasts
Covec Low Forecast Covec Medium Forecast (Vector Base Case)
Covec High Forecast Actual 2013
Vector 2014 Forecast 2013 AMP Basis
Gas Distribution Asset Management Plan Update - 2014
Date: 30 June 2014 Vector Gas Distribution Page 5 of 33
Total connections are expected to peak in 2018 and return to levels only slightly greater than Vector’s 2014 forecast (refer Figure 1). This will mostly be driven by increased GDP activity resulting in an increase in conversions of existing homes to gas, although there is some impact from the increase in new housing foreseen in the Auckland plan.
Key assumptions used in the Auckland region (residential) forecast include:
Conversions of existing dwellings to gas (approximately 60% of new gas connections) are driven by economic activity (GDP). GDP trends were simulated with conversions data between 2007 and 2013 and was found to correlate very closely;
Vector expands its gas network at the fringes of its existing coverage only;
Gas connections for new dwellings based on electricity connections forecasts, modified by;
o Propensity of new dwellings in different locations to get gas (varies widely from 0% to 50% across Auckland)
o Propensity of new dwellings to get gas over time (increasing slightly)
o No gas reticulation in the Hobsonville development
Overall sources of new residential connections, approximately;
o Conversions 60%
o Brownfields new dwellings 20%
o Greenfields new dwellings 20%
Small and medium enterprise connections were found to also correlate closely to GDP and are forecast based on GDP growth. Industrial and commercial connections were forecast based on historical trends.
Key assumptions used in the North Island region (residential) forecast include:
Due to the diverse range of regions and limited information available with respect to the North Island gas distribution network, population trends from the 2013 census data were used to forecast connection growth;
Limited information was available to complete the connection forecast with respect to the North Island gas distribution network. Approximately 70% of all new connections on this network are in greenfield locations;
Analysis was conducted in the Census Area Units (CAU), that overlap Vector’s gas distribution network coverage areas.
o Expansion of gas network into edge CAUs over time is provided for
o Total population & dwellings for relevant CAUs were calculated from 2013 Census data
o Statistics NZ CAU population forecasts were modified to reflect 2013 Census results
o Household size trends were calculated from Census data and extrapolated
A new dwellings forecast for each area is generated from population and household size forecasts;
Gas connection propensity from conversions and new dwellings is calculated from 2012 & 2013 connections data for each region. This assumes that conversions are in
Gas Distribution Asset Management Plan Update - 2014
Date: 30 June 2014 Vector Gas Distribution Page 6 of 33
proportion to population growth in a region (using population growth as a proxy for regional economic factors); and
Forecasts were modified slightly to account for recent connections trends.
Small and medium enterprise, and industrial and commercial forecasts are based on trends in employment, business units, and building consents. These trends were forecasted using correlations to GDP.
Total connections for the medium case are summarised below:
2014 AMP Update 2015 2016 2017 2018 2019 2020 2021 2022 2023 2024
Auckland Region 2,676 3,123 3,433 3,665 3,100 3,150 3,201 3,112 3,152 3,240
North Island Regions 1,411 1,374 1,338 1,301 1,262 1,338 1,411 1,491 1,577 1,668
Total Customer Connections 4,087 4,497 4,771 4,966 4,362 4,488 4,612 4,603 4,729 4,908
Table 2 : Total customer connections forecast (medium case)
2013 AMP 2015 2016 2017 2018 2019 2020 2021 2022 2023 2024
Auckland Region 2,079 2,079 2,074 2,074 2,074 2,074 2,074 2,049 2,049
North Island Regions 1,320 1,320 1,320 1,320 1,320 1,320 1,320 1,320 1,320
Total Customer Connections 3,399 3,399 3,394 3,394 3,394 3,394 3,394 3,369 3,369
Table 3 : Forecast disclosed connections in Section 5 of the 2013 AMP
2013/2014 AMP Variances 2015 2016 2017 2018 2019 2020 2021 2022 2023 2024
Auckland Region 597 1,044 1,359 1,591 1,026 1,076 1,127 1,063 1,103
North Island Regions 91 54 18 -19 -58 18 91 171 257
Total Customer Connections 688 1,098 1,377 1,572 968 1,094 1,218 1,234 1,360
Table 4 : Major variances between 2013 and 2014 connections forecast
2.2 Peak Demand Update
Based on the latest connections growth information (section 2.1), the total demand forecast of the Vector gas distribution network at gate station level for the 10 year planning period to 2024 is not anticipated to materially change.
3. LIFE-CYCLE ASSET MANAGEMENT CHANGES This section discusses aspects that have led to material changes to Vector’s asset life-cycle management practices previously described in section 6 of the 2013 AMP.
3.1 Pre-1985 PE pipeline replacement strategy
Polyethylene (PE) pipe manufactured up to the mid-1980s is known to be susceptible to the risk of premature brittle-like fracture due to the resin type that was used at the time of pipe manufacture. As indicated in the last AMP, Vector regularly reviews fault data to monitor the performance of its pre-1985 PE pipelines. The most recent review was completed in early 2014 and covered the July 2011 to June 2013 period; It identified a
Gas Distribution Asset Management Plan Update - 2014
Date: 30 June 2014 Vector Gas Distribution Page 7 of 33
marked increase in the rate of squeeze-off failures (i.e. fractures at the point of previous squeeze-off locations) when compared to the results of a previous review covering the September 2009 to June 2011 period.
The review also included a comparison of the overall performance of pre-1985 PE systems with other parts of Vector's distribution system and showed that the rate of Public Reported Escapes of gas (PRE) for the pre-1985 PE systems was approximately 2.5 times the rate of PRE for the entire distribution network. The comparison however also indicated that the rate of PRE for the pre-1985 PE systems is still significantly lower than the rate of PRE for Auckland LP cast iron systems and the Hamilton LP and MP1 steel systems. Both the latter systems are in the final stages of replacement.
The review also indicated that the PRE rate for MP4 pre-1985 PE (400kPa pressure) was significantly higher than the rates for LP, MP1 and MP2 pre-1985 PE systems (3kPa – 200kPa pressure).
As indicated in the last AMP, Vector's strategy for mitigating the risks associated with pre-1985 PE included targeted leakage survey of pre-1985 PE pipelines, the monitoring and regular analysis of pre-1985 PE faults and targeted pipeline replacement based on the results of the analysis. The results of the latest review indicate that a more proactive strategy is now appropriate. Whilst the review has confirmed that there has been a marked increase in the level of pre-1985 PE failure, it does not suggest that an immediate full-scale replacement of all pre-1985 PE pipelines is required at this time. A ten year programme to target the replacement of higher risk (i.e. based on operating pressure, failure consequence etc.) sections of the pre-1985 PE system has therefore now been included in the 10 year forecast.
The cost of the programme will be $200k per annum for each network (i.e. Auckland and North Island) initially and increase to $1M per annum for the latter part of the programme. The total programme expenditure will be $7.4M for each network (i.e. Auckland and North Island).
This strategy will also be augmented by the adoption of other risk mitigating measures - e.g. the avoidance of applying squeeze-offs on pre-1985 PE pipes where possible, and the use of pipe reinforcement fittings at pre-1985 PE squeeze-off locations. The performance of these pipelines will continue to be closely monitored.
3.2 Restoration of cathodic protection on the Hamilton MP4 steel services
The restoration of cathodic protection (CP) to MP4 steel service pipes is being carried out as part of a larger programme to restore CP to the Hamilton MP4 steel system as disclosed in the last AMP. Field tests indicate that where CP has been restored to the mains pipelines within a given CP upgrade project area, an estimated 50% of connected steel services will still have inadequate levels of CP. This only became evident following the commissioning of the upgraded CP system on the mains pipes.
The primary reason for the lack of CP on the steel service pipes has been found to be the presence of mechanical connections (i.e. as opposed to welded connections) at the mains tie-in connection and at joints along the service pipeline (the use of mechanical joints was prevalent at the time that the Hamilton MP4 steel pipelines were constructed but has since been discontinued). The preferred options to address the lack of adequate CP on the effected steel service pipes include installing a cross-bond over the mechanical joint, or where this is not practical the relaying of the service in PE.
Gas Distribution Asset Management Plan Update - 2014
Date: 30 June 2014 Vector Gas Distribution Page 8 of 33
As the Hamilton MP4 CP upgrade programme has progressed it has become evident that use of cross-bonding to restore CP to steel services is typically not a practical option due to the difficulty in identifying the location of all mechanical joints on a particular service pipe. In addition the average cost of relaying a service in PE is typically significantly more than originally estimated due to the actual costs associated with surface reinstatement, meter relocations and associated customer outlet pipework alterations etc.
As a consequence of this, the timeline and budget for the steel service CP upgrade portion of the overall Hamilton MP4 CP upgrade programme has been reviewed and adjusted. The completion of the steel service CP upgrade programme has been extended from FY15 to FY17, and the estimated cost of the remainder of the steel service CP upgrade programme (i.e. FY15 to FY17) has been increased from $425k to $1M.
4. ASSET MANAGEMENT MATURITY CHANGES Although a number of initiatives to improve overall Asset Management maturity were initiated over the course of the last year, the majority of these initiatives are longer term programmes that will not immediately result in a material change to the overall AMMAT score provided in the previously published AMP. These initiatives will continue to be progressed and tracked over the next reporting period, with the AMP being updated as required during the next review cycle.
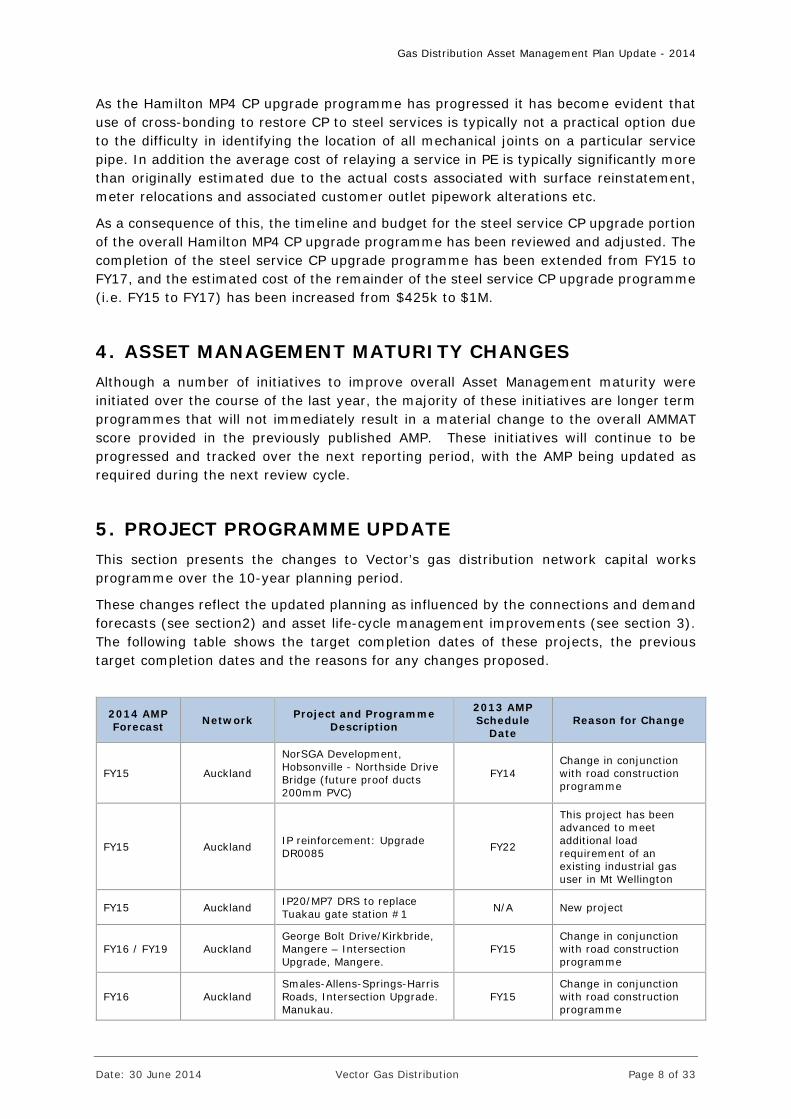
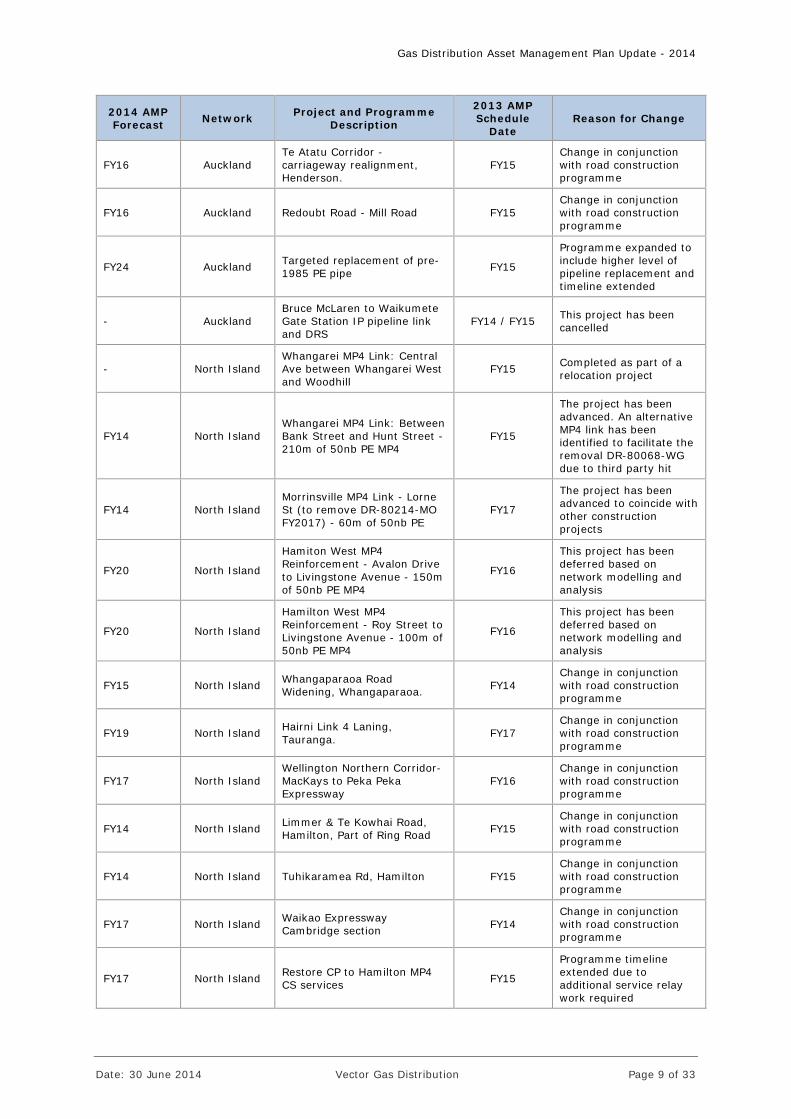
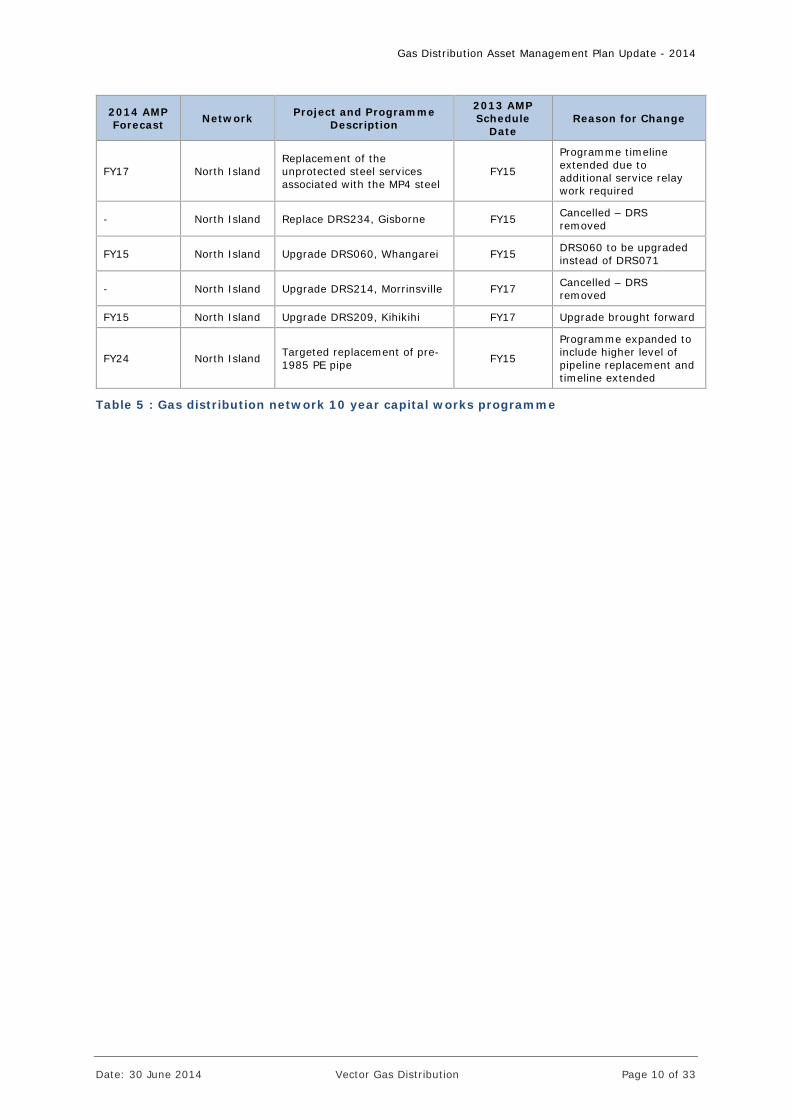
5. PROJECT PROGRAMME UPDATE This section presents the changes to Vector’s gas distribution network capital works programme over the 10-year planning period.
These changes reflect the updated planning as influenced by the connections and demand forecasts (see section2) and asset life-cycle management improvements (see section 3). The following table shows the target completion dates of these projects, the previous target completion dates and the reasons for any changes proposed.
2014 AMP Forecast Network Project and Programme
Description
2013 AMP Schedule
Date Reason for Change
FY15 Auckland
NorSGA Development, Hobsonville - Northside Drive Bridge (future proof ducts 200mm PVC)
FY14 Change in conjunction with road construction programme
FY15 Auckland IP reinforcement: Upgrade DR0085 FY22
This project has been advanced to meet additional load requirement of an existing industrial gas user in Mt Wellington
FY15 Auckland IP20/MP7 DRS to replace Tuakau gate station #1 N/A New project
FY16 / FY19 Auckland George Bolt Drive/Kirkbride, Mangere – Intersection Upgrade, Mangere.
FY15 Change in conjunction with road construction programme
FY16 Auckland Smales-Allens-Springs-Harris Roads, Intersection Upgrade. Manukau.
FY15 Change in conjunction with road construction programme
Gas Distribution Asset Management Plan Update - 2014
Date: 30 June 2014 Vector Gas Distribution Page 9 of 33
2014 AMP Forecast Network Project and Programme
Description
2013 AMP Schedule
Date Reason for Change
FY16 Auckland Te Atatu Corridor - carriageway realignment, Henderson.
FY15 Change in conjunction with road construction programme
FY16 Auckland Redoubt Road - Mill Road FY15 Change in conjunction with road construction programme
FY24 Auckland Targeted replacement of pre-1985 PE pipe FY15
Programme expanded to include higher level of pipeline replacement and timeline extended
- Auckland Bruce McLaren to Waikumete Gate Station IP pipeline link and DRS
FY14 / FY15 This project has been cancelled
- North Island Whangarei MP4 Link: Central Ave between Whangarei West and Woodhill
FY15 Completed as part of a relocation project
FY14 North Island Whangarei MP4 Link: Between Bank Street and Hunt Street - 210m of 50nb PE MP4
FY15
The project has been advanced. An alternative MP4 link has been identified to facilitate the removal DR-80068-WG due to third party hit
FY14 North Island Morrinsville MP4 Link - Lorne St (to remove DR-80214-MO FY2017) - 60m of 50nb PE
FY17
The project has been advanced to coincide with other construction projects
FY20 North Island
Hamiton West MP4 Reinforcement - Avalon Drive to Livingstone Avenue - 150m of 50nb PE MP4
FY16
This project has been deferred based on network modelling and analysis
FY20 North Island
Hamilton West MP4 Reinforcement - Roy Street to Livingstone Avenue - 100m of 50nb PE MP4
FY16
This project has been deferred based on network modelling and analysis
FY15 North Island Whangaparaoa Road Widening, Whangaparaoa. FY14
Change in conjunction with road construction programme
FY19 North Island Hairni Link 4 Laning, Tauranga. FY17
Change in conjunction with road construction programme
FY17 North Island Wellington Northern Corridor-MacKays to Peka Peka Expressway
FY16 Change in conjunction with road construction programme
FY14 North Island Limmer & Te Kowhai Road, Hamilton, Part of Ring Road FY15
Change in conjunction with road construction programme
FY14 North Island Tuhikaramea Rd, Hamilton FY15 Change in conjunction with road construction programme
FY17 North Island Waikao Expressway Cambridge section FY14
Change in conjunction with road construction programme
FY17 North Island Restore CP to Hamilton MP4 CS services FY15
Programme timeline extended due to additional service relay work required
Gas Distribution Asset Management Plan Update - 2014
Date: 30 June 2014 Vector Gas Distribution Page 10 of 33
2014 AMP Forecast Network Project and Programme
Description
2013 AMP Schedule
Date Reason for Change
FY17 North Island Replacement of the unprotected steel services associated with the MP4 steel
FY15
Programme timeline extended due to additional service relay work required
- North Island Replace DRS234, Gisborne FY15 Cancelled – DRS removed
FY15 North Island Upgrade DRS060, Whangarei FY15 DRS060 to be upgraded instead of DRS071
- North Island Upgrade DRS214, Morrinsville FY17 Cancelled – DRS removed
FY15 North Island Upgrade DRS209, Kihikihi FY17 Upgrade brought forward
FY24 North Island Targeted replacement of pre-1985 PE pipe FY15
Programme expanded to include higher level of pipeline replacement and timeline extended
Table 5 : Gas distribution network 10 year capital works programme
Gas Distribution Asset Management Plan Update - 2014
Date: 30 June 2014 Vector Gas Distribution Page 11 of 33
6. CAPITAL AND OPERATIONAL EXPENDITURE FORECAST UPDATE
This section describes the capital and direct operational expenditure forecasts for the gas distribution network assets for the next 10 year period (2014-2024), and provides a comparison with the previous 10 year forecast prepared and disclosed in Section 9 of the 2013 AMP (disclosed in December 2013). These forecasts, are applicable to the development, maintenance, replacement and management of network assets.
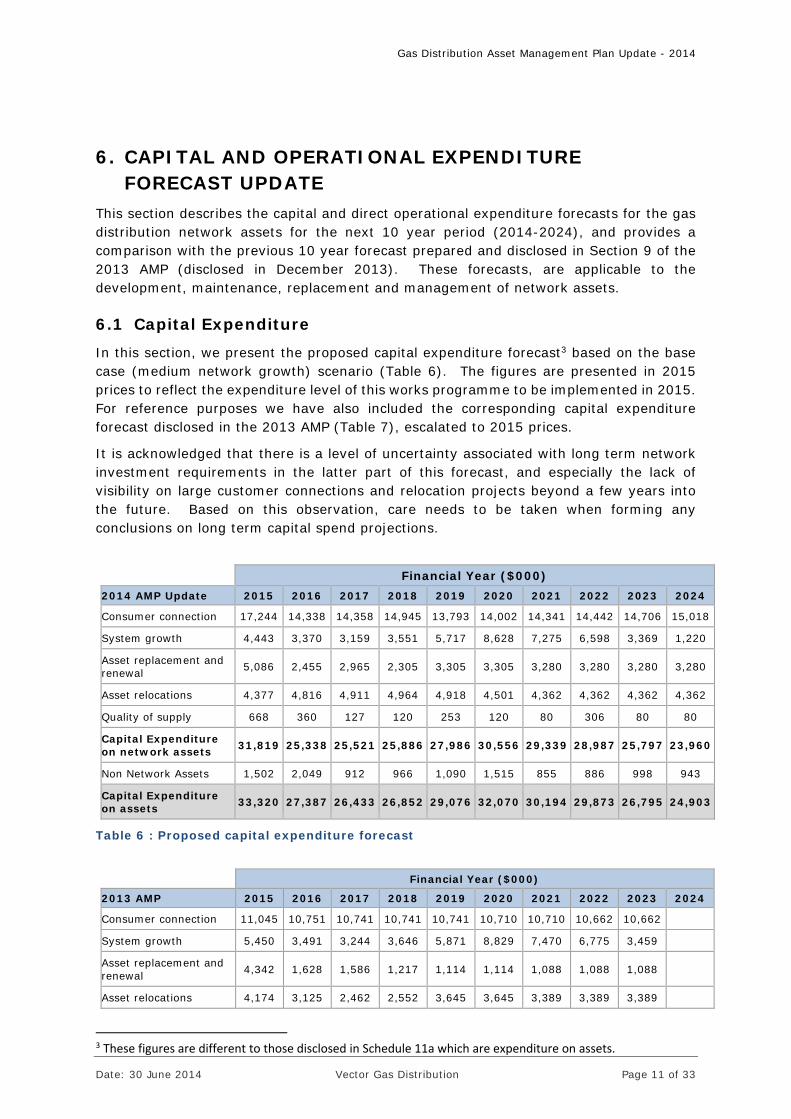
6.1 Capital Expenditure
In this section, we present the proposed capital expenditure forecast3 based on the base case (medium network growth) scenario (Table 6). The figures are presented in 2015 prices to reflect the expenditure level of this works programme to be implemented in 2015. For reference purposes we have also included the corresponding capital expenditure forecast disclosed in the 2013 AMP (Table 7), escalated to 2015 prices.
It is acknowledged that there is a level of uncertainty associated with long term network investment requirements in the latter part of this forecast, and especially the lack of visibility on large customer connections and relocation projects beyond a few years into the future. Based on this observation, care needs to be taken when forming any conclusions on long term capital spend projections.
Financial Year ($000) 2014 AMP Update 2015 2016 2017 2018 2019 2020 2021 2022 2023 2024
Consumer connection 17,244 14,338 14,358 14,945 13,793 14,002 14,341 14,442 14,706 15,018
System growth 4,443 3,370 3,159 3,551 5,717 8,628 7,275 6,598 3,369 1,220
Asset replacement and renewal 5,086 2,455 2,965 2,305 3,305 3,305 3,280 3,280 3,280 3,280
Asset relocations 4,377 4,816 4,911 4,964 4,918 4,501 4,362 4,362 4,362 4,362
Quality of supply 668 360 127 120 253 120 80 306 80 80
Capital Expenditure on network assets 31,819 25,338 25,521 25,886 27,986 30,556 29,339 28,987 25,797 23,960
Non Network Assets 1,502 2,049 912 966 1,090 1,515 855 886 998 943
Capital Expenditure on assets 33,320 27,387 26,433 26,852 29,076 32,070 30,194 29,873 26,795 24,903
Table 6 : Proposed capital expenditure forecast
Financial Year ($000)
2013 AMP 2015 2016 2017 2018 2019 2020 2021 2022 2023 2024
Consumer connection 11,045 10,751 10,741 10,741 10,741 10,710 10,710 10,662 10,662
System growth 5,450 3,491 3,244 3,646 5,871 8,829 7,470 6,775 3,459
Asset replacement and renewal 4,342 1,628 1,586 1,217 1,114 1,114 1,088 1,088 1,088
Asset relocations 4,174 3,125 2,462 2,552 3,645 3,645 3,389 3,389 3,389
3 These figures are different to those disclosed in Schedule 11a which are expenditure on assets.
Gas Distribution Asset Management Plan Update - 2014
Date: 30 June 2014 Vector Gas Distribution Page 12 of 33
Financial Year ($000)
2013 AMP 2015 2016 2017 2018 2019 2020 2021 2022 2023 2024
Quality of supply 779 431 130 123 260 123 82 314 82
Capital Expenditure on network assets 25,789 19,426 18,164 18,279 21,631 24,422 22,740 22,228 18,680
Non Network Assets 1,909 1,763 1,631 1,301 1,344 1,356 1,344 1,247 1,247
Capital Expenditure on assets 27,698 21,189 19,795 19,580 22,975 25,778 24,084 23,475 19,927
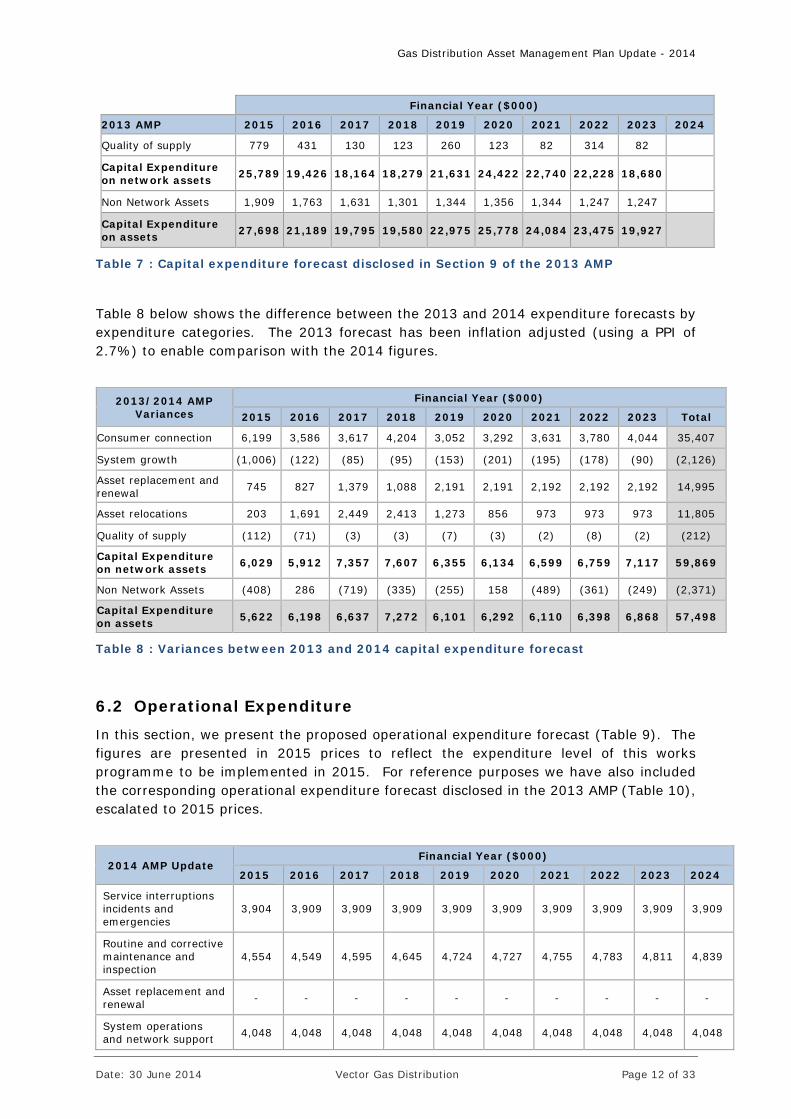
Table 7 : Capital expenditure forecast disclosed in Section 9 of the 2013 AMP
Table 8 below shows the difference between the 2013 and 2014 expenditure forecasts by expenditure categories. The 2013 forecast has been inflation adjusted (using a PPI of 2.7%) to enable comparison with the 2014 figures.
2013/2014 AMP Variances
Financial Year ($000)
2015 2016 2017 2018 2019 2020 2021 2022 2023 Total
Consumer connection 6,199 3,586 3,617 4,204 3,052 3,292 3,631 3,780 4,044 35,407
System growth (1,006) (122) (85) (95) (153) (201) (195) (178) (90) (2,126)
Asset replacement and renewal 745 827 1,379 1,088 2,191 2,191 2,192 2,192 2,192 14,995
Asset relocations 203 1,691 2,449 2,413 1,273 856 973 973 973 11,805
Quality of supply (112) (71) (3) (3) (7) (3) (2) (8) (2) (212)
Capital Expenditure on network assets 6,029 5,912 7,357 7,607 6,355 6,134 6,599 6,759 7,117 59,869
Non Network Assets (408) 286 (719) (335) (255) 158 (489) (361) (249) (2,371)
Capital Expenditure on assets 5,622 6,198 6,637 7,272 6,101 6,292 6,110 6,398 6,868 57,498
Table 8 : Variances between 2013 and 2014 capital expenditure forecast
6.2 Operational Expenditure
In this section, we present the proposed operational expenditure forecast (Table 9). The figures are presented in 2015 prices to reflect the expenditure level of this works programme to be implemented in 2015. For reference purposes we have also included the corresponding operational expenditure forecast disclosed in the 2013 AMP (Table 10), escalated to 2015 prices.
2014 AMP Update Financial Year ($000)
2015 2016 2017 2018 2019 2020 2021 2022 2023 2024
Service interruptions incidents and emergencies
3,904 3,909 3,909 3,909 3,909 3,909 3,909 3,909 3,909 3,909
Routine and corrective maintenance and inspection
4,554 4,549 4,595 4,645 4,724 4,727 4,755 4,783 4,811 4,839
Asset replacement and renewal - - - - - - - - - -
System operations and network support 4,048 4,048 4,048 4,048 4,048 4,048 4,048 4,048 4,048 4,048
Gas Distribution Asset Management Plan Update - 2014
Date: 30 June 2014 Vector Gas Distribution Page 13 of 33
2014 AMP Update Financial Year ($000)
2015 2016 2017 2018 2019 2020 2021 2022 2023 2024
Business support 8,277 8,277 8,277 8,277 8,277 8,277 8,277 8,277 8,277 8,277
Total operational expenditure 20,783 20,783 20,830 20,880 20,959 20,961 20,989 21,017 21,045 21,073
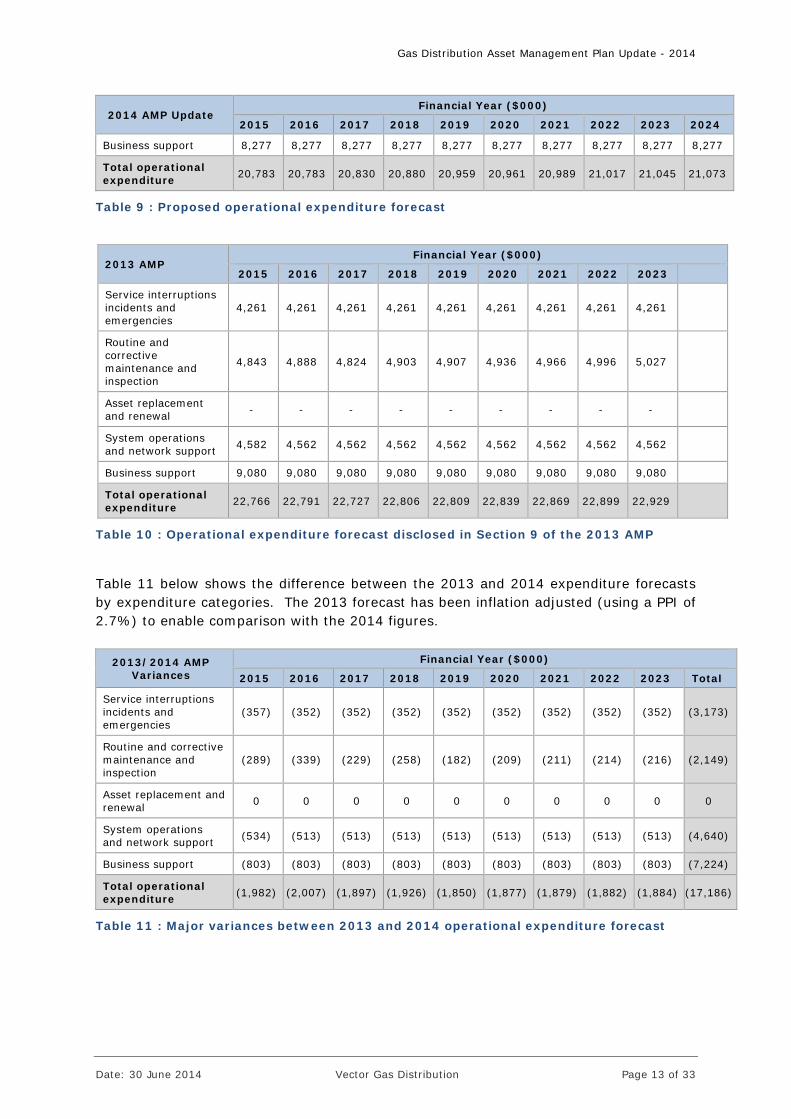
Table 9 : Proposed operational expenditure forecast
2013 AMP Financial Year ($000)
2015 2016 2017 2018 2019 2020 2021 2022 2023
Service interruptions incidents and emergencies
4,261 4,261 4,261 4,261 4,261 4,261 4,261 4,261 4,261
Routine and corrective maintenance and inspection
4,843 4,888 4,824 4,903 4,907 4,936 4,966 4,996 5,027
Asset replacement and renewal - - - - - - - - -
System operations and network support 4,582 4,562 4,562 4,562 4,562 4,562 4,562 4,562 4,562
Business support 9,080 9,080 9,080 9,080 9,080 9,080 9,080 9,080 9,080
Total operational expenditure 22,766 22,791 22,727 22,806 22,809 22,839 22,869 22,899 22,929
Table 10 : Operational expenditure forecast disclosed in Section 9 of the 2013 AMP
Table 11 below shows the difference between the 2013 and 2014 expenditure forecasts by expenditure categories. The 2013 forecast has been inflation adjusted (using a PPI of 2.7%) to enable comparison with the 2014 figures.
2013/2014 AMP Variances
Financial Year ($000)
2015 2016 2017 2018 2019 2020 2021 2022 2023 Total
Service interruptions incidents and emergencies
(357) (352) (352) (352) (352) (352) (352) (352) (352) (3,173)
Routine and corrective maintenance and inspection
(289) (339) (229) (258) (182) (209) (211) (214) (216) (2,149)
Asset replacement and renewal 0 0 0 0 0 0 0 0 0 0
System operations and network support (534) (513) (513) (513) (513) (513) (513) (513) (513) (4,640)
Business support (803) (803) (803) (803) (803) (803) (803) (803) (803) (7,224)
Total operational expenditure (1,982) (2,007) (1,897) (1,926) (1,850) (1,877) (1,879) (1,882) (1,884) (17,186)
Table 11 : Major variances between 2013 and 2014 operational expenditure forecast
Gas Distribution Asset Management Plan Update - 2014
Date: 30 June 2014 Vector Gas Distribution Page 14 of 33
6.3 Explanation of Major Variances
This section highlights the significant changes to the 2013 disclosed expenditure forecasts4. The major changes in capital expenditure over the 9-year period for which the AMP and the AMP Update overlap, reflect:
$35 million increase in consumer connection expenditure forecast due to the expected increase in population and new dwelling construction (as discussed in section 2.1), and to provide supply to a large customer connection in Pokeno, South Auckland.
$15 million increase in asset replacement expenditure associated with the proposed pipeline replacement of parts of Vector’s pre 1985 polyethylene network.
$12 million increase in asset relocation expenditure reflecting the latest estimate of relocation activity including the cost of the civil component within relocation projects.
$2 million decrease from the cancellation of an FY14 project to link the proposed Waikumete and Bruce McLaren gate stations. Gas Transmission has confirmed that modification of the existing installation, to address a number of hazardous area compliance issues, is likely to be feasible and more economical.
The major changes in operational expenditure include:
$12 million reduction in shared cost business support activities and lower professional fees and customer related expenditure.
$3 million reduction in service interruptions, incidents and emergencies costs following a review of our historical incidents risk profile and associated risk management strategy.
$2 million reduction associated with a change in Vector’s approach towards site mark-out and stand-overs process, and additional recoveries associated with third party activities.
4 The figures are inflation adjusted.

Gas Distribution Asset Management Plan Update - 2014
Date: 30 June 2014 Vector Gas Distribution Page 15 of 33
Gas Distribution Asset Management Plan Update
Information Disclosure 2014
Appendix 1 Report on Forecast Capital
Expenditure
Gas Distribution Asset Management Plan Update - 2014
Date: 30 June 2014 Vector Gas Distribution Page 16 of 33
Company NameAMP Planning Period
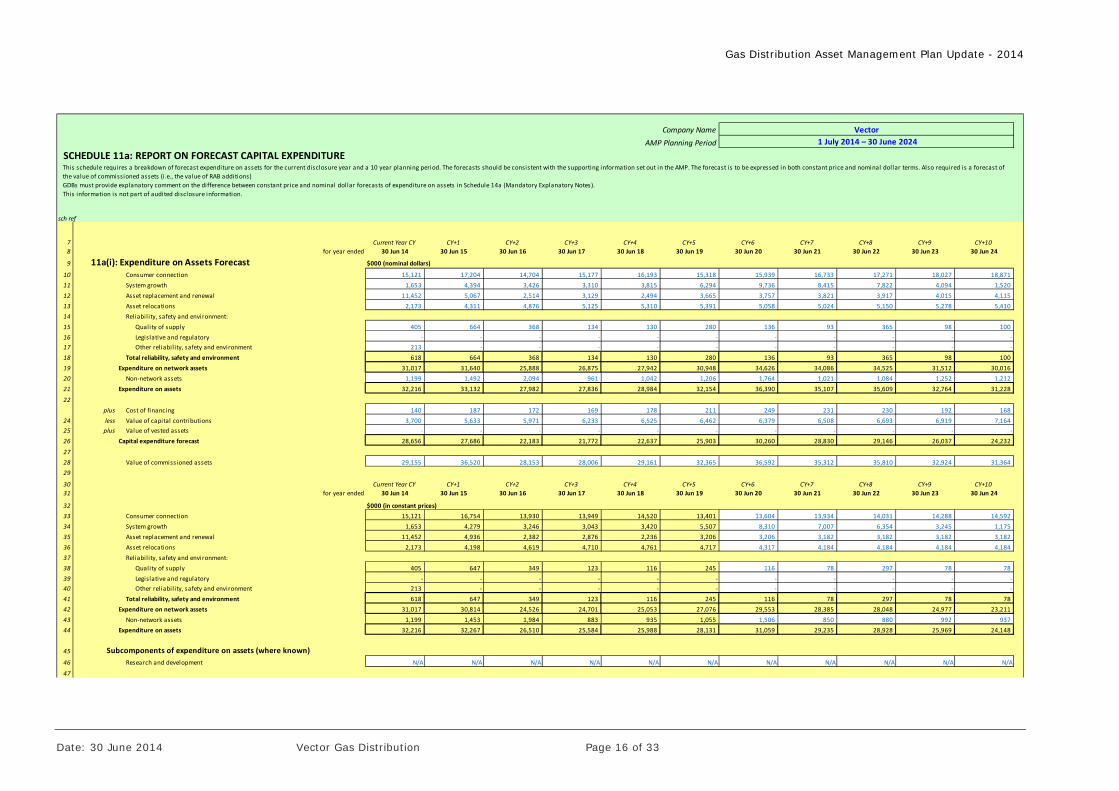
SCHEDULE 11a: REPORT ON FORECAST CAPITAL EXPENDITURE
sch ref
7 Current Year CY CY+1 CY+2 CY+3 CY+4 CY+5 CY+6 CY+7 CY+8 CY+9 CY+108 for year ended 30 Jun 14 30 Jun 15 30 Jun 16 30 Jun 17 30 Jun 18 30 Jun 19 30 Jun 20 30 Jun 21 30 Jun 22 30 Jun 23 30 Jun 24
9 11a(i): Expenditure on Assets Forecast $000 (nominal dollars)
10 Consumer connection 15,121 17,204 14,704 15,177 16,193 15,318 15,939 16,733 17,271 18,027 18,871
11 System growth 1,653 4,394 3,426 3,310 3,815 6,294 9,736 8,415 7,822 4,094 1,520
12 Asset replacement and renewal 11,452 5,067 2,514 3,129 2,494 3,665 3,757 3,821 3,917 4,015 4,115
13 Asset relocations 2,173 4,311 4,876 5,125 5,310 5,391 5,058 5,024 5,150 5,278 5,410
14 Reliability, safety and environment:
15 Quality of supply 405 664 368 134 130 280 136 93 365 98 100
16 Legislative and regulatory ‐ ‐ ‐ ‐ ‐ ‐ ‐ ‐ ‐ ‐ ‐
17 Other reliability, safety and environment 213 ‐ ‐ ‐ ‐ ‐ ‐ ‐ ‐ ‐ ‐
18 Total reliability, safety and environment 618 664 368 134 130 280 136 93 365 98 100
19 Expenditure on network assets 31,017 31,640 25,888 26,875 27,942 30,948 34,626 34,086 34,525 31,512 30,016
20 Non‐network assets 1,199 1,492 2,094 961 1,042 1,206 1,764 1,021 1,084 1,252 1,212
21 Expenditure on assets 32,216 33,132 27,982 27,836 28,984 32,154 36,390 35,107 35,609 32,764 31,228
22plus Cost of financing 140 187 172 169 178 211 249 231 230 192 168
24 less Value of capital contributions 3,700 5,633 5,971 6,233 6,525 6,462 6,379 6,508 6,693 6,919 7,164
25 plus Value of vested assets ‐ ‐ ‐ ‐ ‐ ‐ ‐ ‐ ‐ ‐ ‐
26 Capital expenditure forecast 28,656 27,686 22,183 21,772 22,637 25,903 30,260 28,830 29,146 26,037 24,232
2728 Value of commissioned assets 29,155 36,520 28,153 28,006 29,161 32,365 36,592 35,312 35,810 32,924 31,364
29
30 Current Year CY CY+1 CY+2 CY+3 CY+4 CY+5 CY+6 CY+7 CY+8 CY+9 CY+1031 for year ended 30 Jun 14 30 Jun 15 30 Jun 16 30 Jun 17 30 Jun 18 30 Jun 19 30 Jun 20 30 Jun 21 30 Jun 22 30 Jun 23 30 Jun 24
32 $000 (in constant prices)33 Consumer connection 15,121 16,754 13,930 13,949 14,520 13,401 13,604 13,934 14,031 14,288 14,592
34 System growth 1,653 4,279 3,246 3,043 3,420 5,507 8,310 7,007 6,354 3,245 1,175
35 Asset replacement and renewal 11,452 4,936 2,382 2,876 2,236 3,206 3,206 3,182 3,182 3,182 3,182
36 Asset relocations 2,173 4,198 4,619 4,710 4,761 4,717 4,317 4,184 4,184 4,184 4,184
37 Reliability, safety and environment:
38 Quality of supply 405 647 349 123 116 245 116 78 297 78 78
39 Legislative and regulatory ‐ ‐ ‐ ‐ ‐ ‐ ‐ ‐ ‐ ‐ ‐
40 Other reliability, safety and environment 213 ‐ ‐ ‐ ‐ ‐ ‐ ‐ ‐ ‐ ‐
41 Total reliability, safety and environment 618 647 349 123 116 245 116 78 297 78 78
42 Expenditure on network assets 31,017 30,814 24,526 24,701 25,053 27,076 29,553 28,385 28,048 24,977 23,211
43 Non‐network assets 1,199 1,453 1,984 883 935 1,055 1,506 850 880 992 937
44 Expenditure on assets 32,216 32,267 26,510 25,584 25,988 28,131 31,059 29,235 28,928 25,969 24,148
45 Subcomponents of expenditure on assets (where known)46 Research and development N/A N/A N/A N/A N/A N/A N/A N/A N/A N/A N/A
47
Vector 1 July 2014 – 30 June 2024
This schedule requires a breakdown of forecast expenditure on assets for the current disclosure year and a 10 year planning period. The forecasts should be consistent with the supporting information set out in the AMP. The forecast is to be expressed in both constant price and nominal dollar terms. Also required is a forecast of
the value of commissioned assets (i.e., the value of RAB additions)
GDBs must provide explanatory comment on the difference between constant price and nominal dollar forecasts of expenditure on assets in Schedule 14a (Mandatory Explanatory Notes).
This information is not part of audited disclosure information.
Gas Distribution Asset Management Plan Update - 2014
Date: 30 June 2014 Vector Gas Distribution Page 17 of 33
48 Current Year CY CY+1 CY+2 CY+3 CY+4 CY+5 CY+6 CY+7 CY+8 CY+9 CY+1049 for year ended 30 Jun 14 30 Jun 15 30 Jun 16 30 Jun 17 30 Jun 18 30 Jun 19 30 Jun 20 30 Jun 21 30 Jun 22 30 Jun 23 30 Jun 24
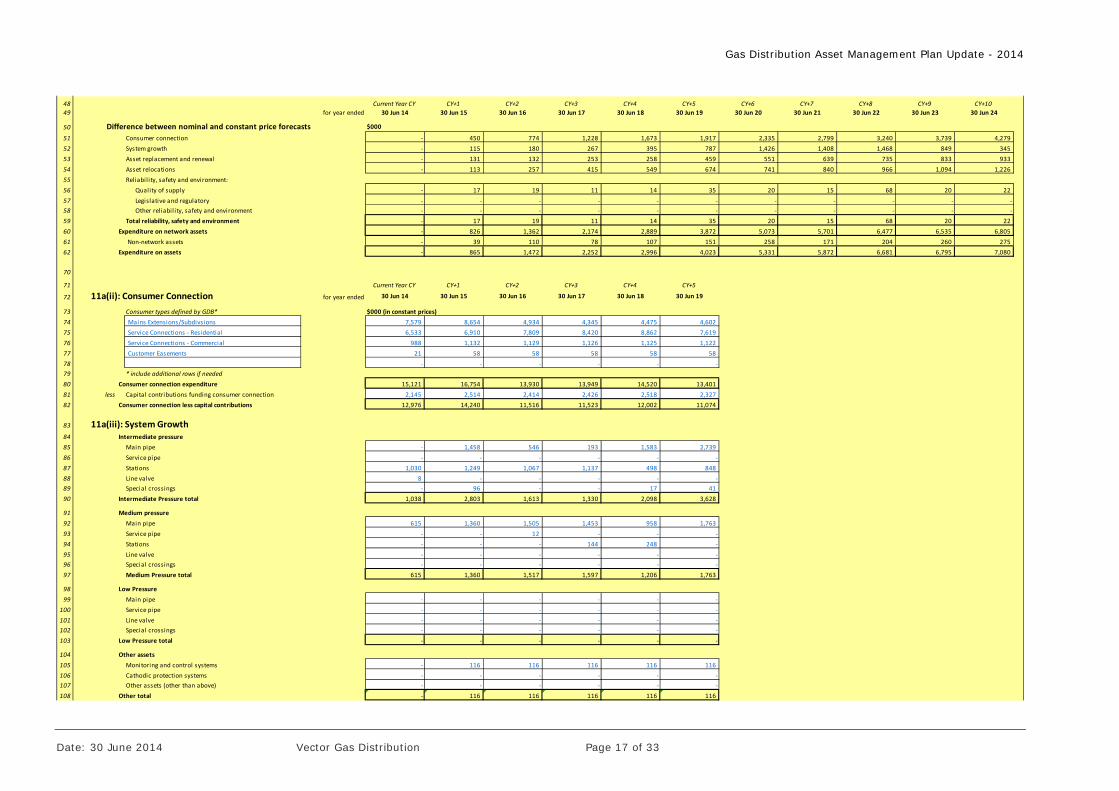
50 Difference between nominal and constant price forecasts $000
51 Consumer connection ‐ 450 774 1,228 1,673 1,917 2,335 2,799 3,240 3,739 4,279
52 System growth ‐ 115 180 267 395 787 1,426 1,408 1,468 849 345
53 Asset replacement and renewal ‐ 131 132 253 258 459 551 639 735 833 933
54 Asset relocations ‐ 113 257 415 549 674 741 840 966 1,094 1,226
55 Reliability, safety and environment:
56 Quality of supply ‐ 17 19 11 14 35 20 15 68 20 22
57 Legislative and regulatory ‐ ‐ ‐ ‐ ‐ ‐ ‐ ‐ ‐ ‐ ‐
58 Other reliabil ity, safety and environment ‐ ‐ ‐ ‐ ‐ ‐ ‐ ‐ ‐ ‐ ‐
59 Total reliability, safety and environment ‐ 17 19 11 14 35 20 15 68 20 22
60 Expenditure on network assets ‐ 826 1,362 2,174 2,889 3,872 5,073 5,701 6,477 6,535 6,805
61 Non‐network assets ‐ 39 110 78 107 151 258 171 204 260 275
62 Expenditure on assets ‐ 865 1,472 2,252 2,996 4,023 5,331 5,872 6,681 6,795 7,080
70
71 CY+1 CY+2 CY+3 CY+4 CY+5
72 11a(ii): Consumer Connection for year ended 30 Jun 14 30 Jun 15 30 Jun 16 30 Jun 17 30 Jun 18 30 Jun 19
73 Consumer types defined by GDB* $000 (in constant prices)74 Mains Extensions/Subdivsions 7,579 8,654 4,934 4,345 4,475 4,602
75 Service Connections ‐ Residential 6,533 6,910 7,809 8,420 8,862 7,619
76 Service Connections ‐ Commercial 988 1,132 1,129 1,126 1,125 1,122
77 Customer Easements 21 58 58 58 58 58
78 ‐ ‐ ‐ ‐ ‐ ‐
79 * include additional rows if needed80 Consumer connection expenditure 15,121 16,754 13,930 13,949 14,520 13,401
81 less Capital contributions funding consumer connection 2,145 2,514 2,414 2,426 2,518 2,327
82 Consumer connection less capital contributions 12,976 14,240 11,516 11,523 12,002 11,074
83 11a(iii): System Growth84 Intermediate pressure85 Main pipe ‐ 1,458 546 193 1,583 2,739
86 Service pipe ‐ ‐ ‐ ‐ ‐ ‐
87 Stations 1,030 1,249 1,067 1,137 498 848
88 Line valve 8 ‐ ‐ ‐ ‐ ‐
89 Special crossings ‐ 96 ‐ ‐ 17 41
90 Intermediate Pressure total 1,038 2,803 1,613 1,330 2,098 3,628
91 Medium pressure 92 Main pipe 615 1,360 1,505 1,453 958 1,763
93 Service pipe ‐ ‐ 12 ‐ ‐ ‐
94 Stations ‐ ‐ ‐ 144 248 ‐
95 Line valve ‐ ‐ ‐ ‐ ‐ ‐
96 Special crossings ‐ ‐ ‐ ‐ ‐ ‐
97 Medium Pressure total 615 1,360 1,517 1,597 1,206 1,763
98 Low Pressure99 Main pipe ‐ ‐ ‐ ‐ ‐ ‐
100 Service pipe ‐ ‐ ‐ ‐ ‐ ‐
101 Line valve ‐ ‐ ‐ ‐ ‐ ‐
102 Special crossings ‐ ‐ ‐ ‐ ‐ ‐
103 Low Pressure total ‐ ‐ ‐ ‐ ‐ ‐
104 Other assets105 Monitoring and control systems ‐ 116 116 116 116 116
106 Cathodic protection systems ‐ ‐ ‐ ‐ ‐ ‐
107 Other assets (other than above) ‐ ‐ ‐ ‐ ‐ ‐
108 Other total ‐ 116 116 116 116 116
Current Year CY
Gas Distribution Asset Management Plan Update - 2014
Date: 30 June 2014 Vector Gas Distribution Page 18 of 33
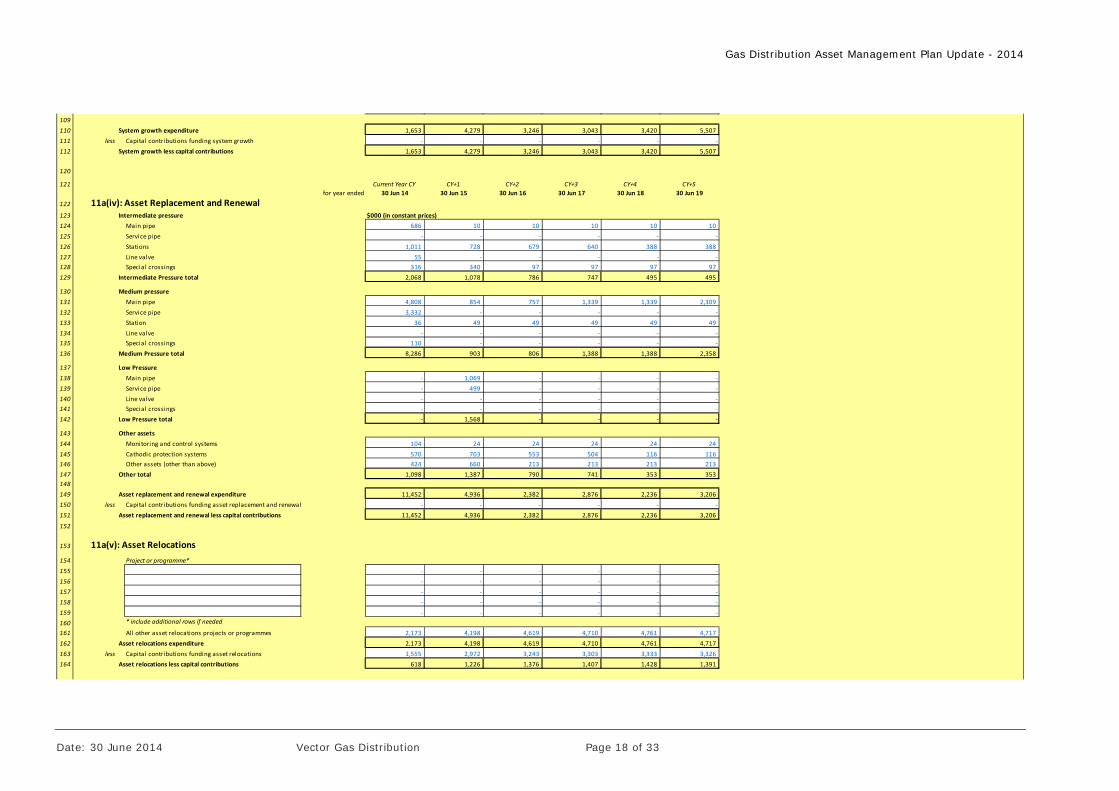
109110 System growth expenditure 1,653 4,279 3,246 3,043 3,420 5,507
111 less Capital contributions funding system growth ‐ ‐ ‐ ‐ ‐ ‐
112 System growth less capital contributions 1,653 4,279 3,246 3,043 3,420 5,507
120
121 CY+1 CY+2 CY+3 CY+4 CY+5
122 11a(iv): Asset Replacement and Renewalfor year ended 30 Jun 14 30 Jun 15 30 Jun 16 30 Jun 17 30 Jun 18 30 Jun 19
123 Intermediate pressure $000 (in constant prices)124 Main pipe 686 10 10 10 10 10
125 Service pipe ‐ ‐ ‐ ‐ ‐ ‐
126 Stations 1,011 728 679 640 388 388
127 Line valve 55 ‐ ‐ ‐ ‐ ‐
128 Special crossings 316 340 97 97 97 97
129 Intermediate Pressure total 2,068 1,078 786 747 495 495
130 Medium pressure 131 Main pipe 4,808 854 757 1,339 1,339 2,309
132 Service pipe 3,332 ‐ ‐ ‐ ‐ ‐
133 Station 36 49 49 49 49 49
134 Line valve ‐ ‐ ‐ ‐ ‐ ‐
135 Special crossings 110 ‐ ‐ ‐ ‐ ‐
136 Medium Pressure total 8,286 903 806 1,388 1,388 2,358
137 Low Pressure138 Main pipe ‐ 1,069 ‐ ‐ ‐ ‐
139 Service pipe ‐ 499 ‐ ‐ ‐ ‐
140 Line valve ‐ ‐ ‐ ‐ ‐ ‐
141 Special crossings ‐ ‐ ‐ ‐ ‐ ‐
142 Low Pressure total ‐ 1,568 ‐ ‐ ‐ ‐
143 Other assets144 Monitoring and control systems 104 24 24 24 24 24
145 Cathodic protection systems 570 703 553 504 116 116
146 Other assets (other than above) 424 660 213 213 213 213
147 Other total 1,098 1,387 790 741 353 353
148149 Asset replacement and renewal expenditure 11,452 4,936 2,382 2,876 2,236 3,206
150 less Capital contributions funding asset replacement and renewal ‐ ‐ ‐ ‐ ‐ ‐
151 Asset replacement and renewal less capital contributions 11,452 4,936 2,382 2,876 2,236 3,206
152
153 11a(v): Asset Relocations154 Project or programme*155 ‐ ‐ ‐ ‐ ‐ ‐
156 ‐ ‐ ‐ ‐ ‐ ‐
157 ‐ ‐ ‐ ‐ ‐ ‐
158 ‐ ‐ ‐ ‐ ‐ ‐
159 ‐ ‐ ‐ ‐ ‐ ‐
160 * include additional rows if needed
161 All other asset relocations projects or programmes 2,173 4,198 4,619 4,710 4,761 4,717
162 Asset relocations expenditure 2,173 4,198 4,619 4,710 4,761 4,717
163 less Capital contributions funding asset relocations 1,555 2,972 3,243 3,303 3,333 3,326
164 Asset relocations less capital contributions 618 1,226 1,376 1,407 1,428 1,391
Current Year CY
Gas Distribution Asset Management Plan Update - 2014
Date: 30 June 2014 Vector Gas Distribution Page 19 of 33
172 Current Year CY CY+1 CY+2 CY+3 CY+4 CY+5
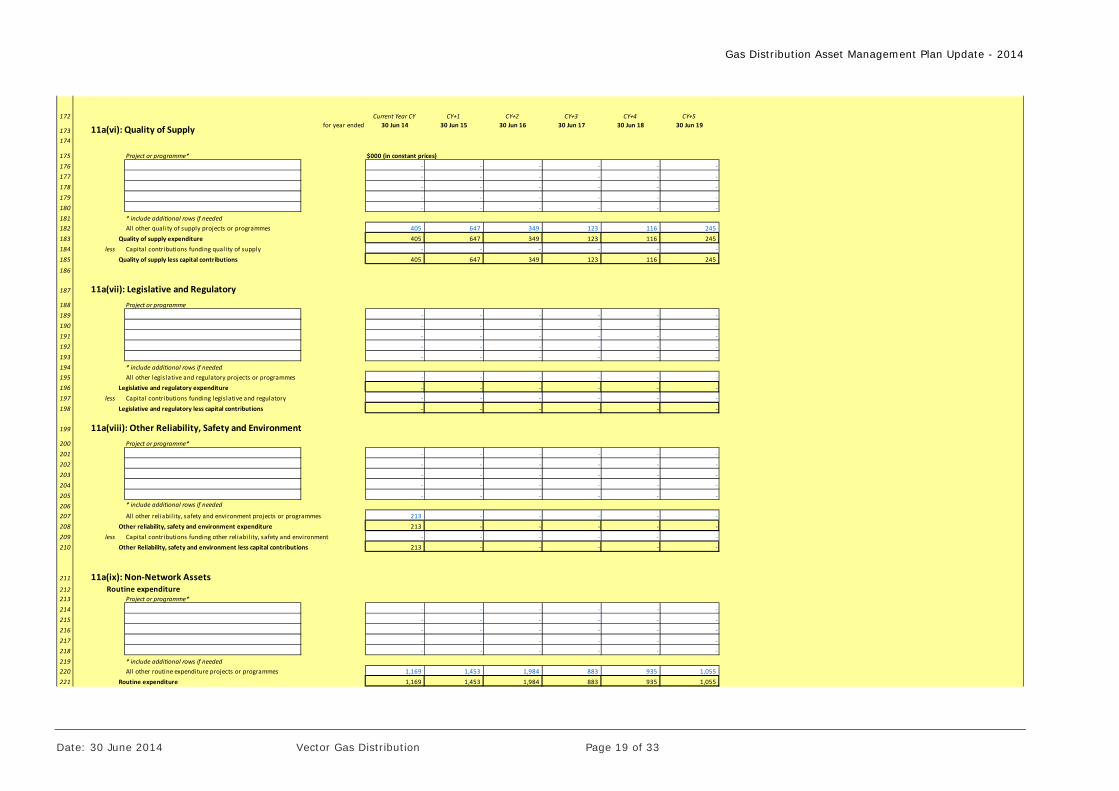
173 11a(vi): Quality of Supply for year ended 30 Jun 14 30 Jun 15 30 Jun 16 30 Jun 17 30 Jun 18 30 Jun 19
174
175 Project or programme* $000 (in constant prices)176 ‐ ‐ ‐ ‐ ‐ ‐
177 ‐ ‐ ‐ ‐ ‐ ‐
178 ‐ ‐ ‐ ‐ ‐ ‐
179 ‐ ‐ ‐ ‐ ‐ ‐
180 ‐ ‐ ‐ ‐ ‐ ‐
181 * include additional rows if needed182 All other quality of supply projects or programmes 405 647 349 123 116 245
183 Quality of supply expenditure 405 647 349 123 116 245
184 less Capital contributions funding quality of supply ‐ ‐ ‐ ‐ ‐ ‐
185 Quality of supply less capital contributions 405 647 349 123 116 245
186
187 11a(vii): Legislative and Regulatory188 Project or programme189 ‐ ‐ ‐ ‐ ‐ ‐
190 ‐ ‐ ‐ ‐ ‐ ‐
191 ‐ ‐ ‐ ‐ ‐ ‐
192 ‐ ‐ ‐ ‐ ‐ ‐
193 ‐ ‐ ‐ ‐ ‐ ‐
194 * include additional rows if needed195 All other legislative and regulatory projects or programmes ‐ ‐ ‐ ‐ ‐ ‐
196 Legislative and regulatory expenditure ‐ ‐ ‐ ‐ ‐ ‐
197 less Capital contributions funding legislative and regulatory ‐ ‐ ‐ ‐ ‐ ‐
198 Legislative and regulatory less capital contributions ‐ ‐ ‐ ‐ ‐ ‐
199 11a(viii): Other Reliability, Safety and Environment200 Project or programme*201 ‐ ‐ ‐ ‐ ‐ ‐
202 ‐ ‐ ‐ ‐ ‐ ‐
203 ‐ ‐ ‐ ‐ ‐ ‐
204 ‐ ‐ ‐ ‐ ‐ ‐
205 ‐ ‐ ‐ ‐ ‐ ‐
206 * include additional rows if needed
207 All other reliabi lity, safety and environment projects or programmes 213 ‐ ‐ ‐ ‐ ‐
208 Other reliability, safety and environment expenditure 213 ‐ ‐ ‐ ‐ ‐
209 less Capital contributions funding other reliability, safety and environment ‐ ‐ ‐ ‐ ‐ ‐
210 Other Reliability, safety and environment less capital contributions 213 ‐ ‐ ‐ ‐ ‐
211 11a(ix): Non‐Network Assets212 Routine expenditure
213 Project or programme*214 ‐ ‐ ‐ ‐ ‐ ‐
215 ‐ ‐ ‐ ‐ ‐ ‐
216 ‐ ‐ ‐ ‐ ‐ ‐
217 ‐ ‐ ‐ ‐ ‐ ‐
218 ‐ ‐ ‐ ‐ ‐ ‐
219 * include additional rows if needed220 All other routine expenditure projects or programmes 1,169 1,453 1,984 883 935 1,055
221 Routine expenditure 1,169 1,453 1,984 883 935 1,055
Gas Distribution Asset Management Plan Update - 2014
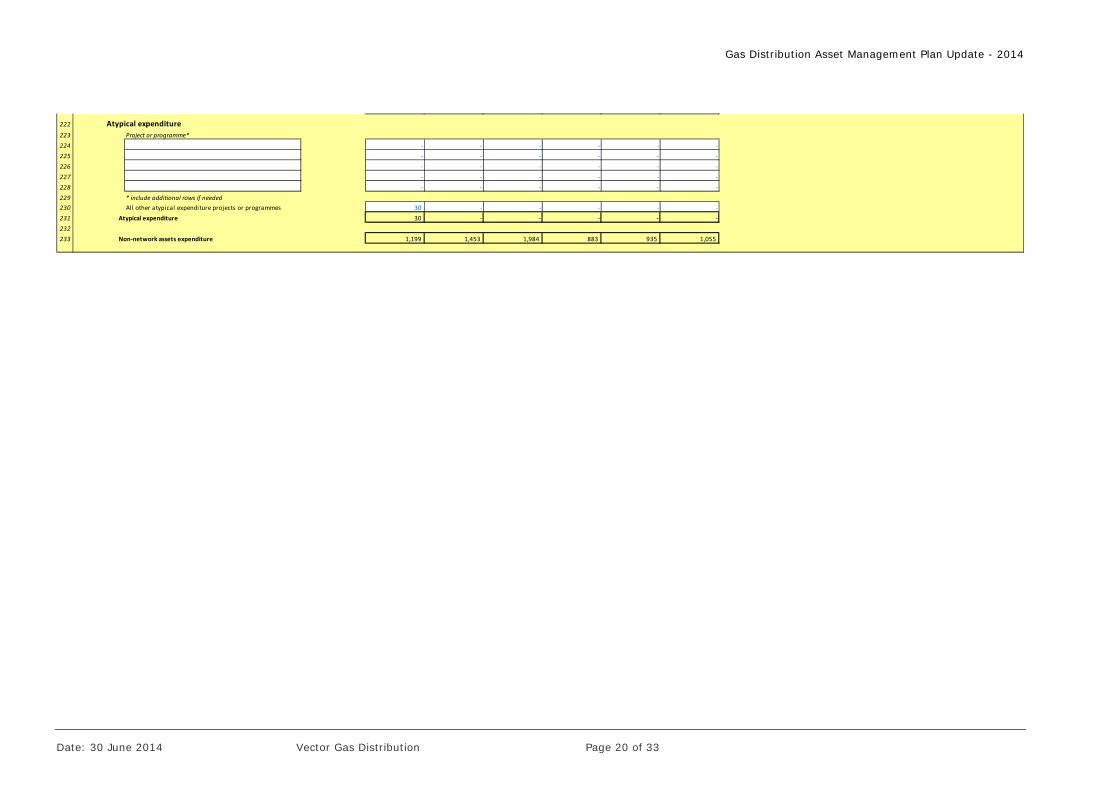
Date: 30 June 2014 Vector Gas Distribution Page 20 of 33
222 Atypical expenditure223 Project or programme*224 ‐ ‐ ‐ ‐ ‐ ‐
225 ‐ ‐ ‐ ‐ ‐ ‐
226 ‐ ‐ ‐ ‐ ‐ ‐
227 ‐ ‐ ‐ ‐ ‐ ‐
228 ‐ ‐ ‐ ‐ ‐ ‐
229 * include additional rows if needed230 All other atypical expenditure projects or programmes 30 ‐ ‐ ‐ ‐ ‐
231 Atypical expenditure 30 ‐ ‐ ‐ ‐ ‐
232233 Non‐network assets expenditure 1,199 1,453 1,984 883 935 1,055

Gas Distribution Asset Management Plan Update - 2014
Date: 30 June 2014 Vector Gas Distribution Page 21 of 33
Schedule 11a Explanatory Notes The box below provides commentary specific to the difference between nominal and constant price capital expenditure forecasts. It is provided in the same format as required for Box 1, Schedule 14a of the Gas Distribution Information Disclosures, which will be fully disclosed within 6 months of the end of the disclosure year.
Commentary on difference between nominal and constant price capital expenditure forecasts
Vector has used the NZIER (New Zealand Institute of Economic Research) March 2014 PPI (Producer Price Index-outputs) forecast from 2014 to 2017. Thereafter we have assumed a long-term PPI rate of 2.5%. The constant price capital expenditure forecast is then inflated by the above mentioned PPI forecast to nominal price capital expenditure forecasts.
Gas Distribution Asset Management Plan Update - 2014
Date: 30 June 2014 Vector Gas Distribution Page 22 of 33
Gas Distribution Asset Management Plan Update
Information Disclosure 2014
Appendix 2 Report on Forecast Operational
Expenditure
Gas Distribution Asset Management Plan Update - 2014
Date: 30 June 2014 Vector Gas Distribution Page 23 of 33
Company NameAMP Planning Period
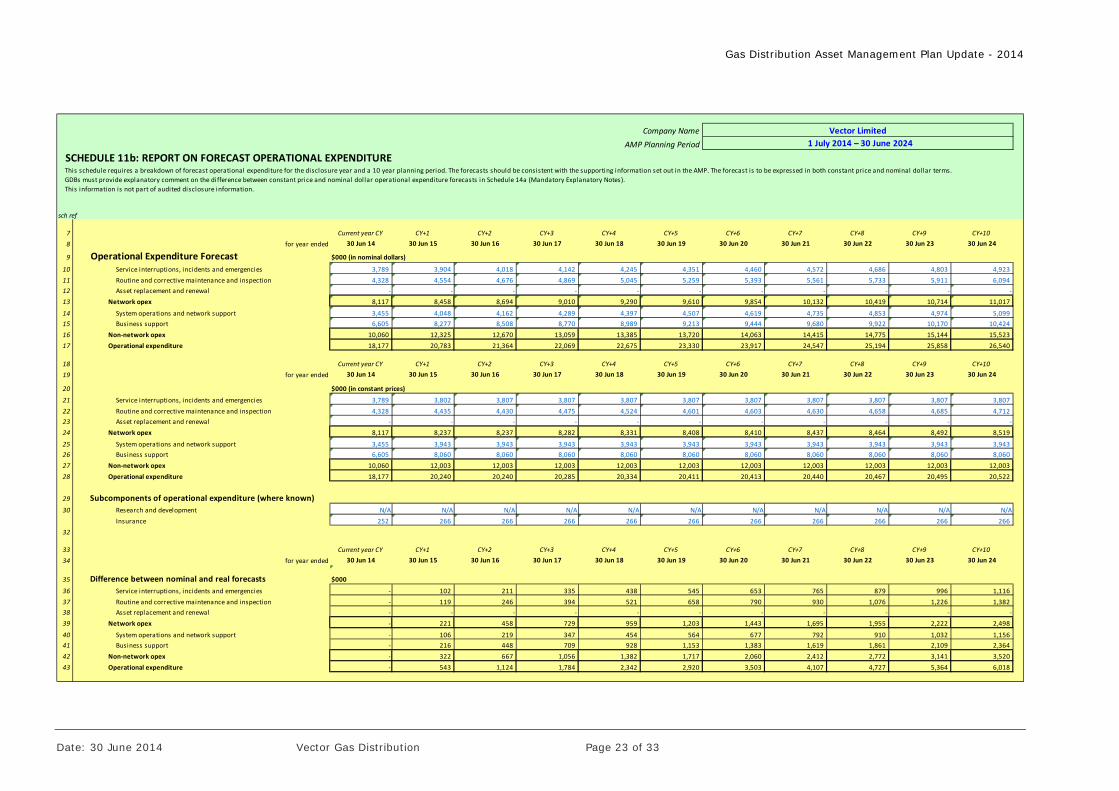
SCHEDULE 11b: REPORT ON FORECAST OPERATIONAL EXPENDITURE
sch ref
7 Current year CY CY+1 CY+2 CY+3 CY+4 CY+5 CY+6 CY+7 CY+8 CY+9 CY+108 for year ended 30 Jun 14 30 Jun 15 30 Jun 16 30 Jun 17 30 Jun 18 30 Jun 19 30 Jun 20 30 Jun 21 30 Jun 22 30 Jun 23 30 Jun 24
9 Operational Expenditure Forecast $000 (in nominal dollars)
10 Service interruptions, incidents and emergencies 3,789 3,904 4,018 4,142 4,245 4,351 4,460 4,572 4,686 4,803 4,923
11 Routine and corrective maintenance and inspection 4,328 4,554 4,676 4,869 5,045 5,259 5,393 5,561 5,733 5,911 6,094
12 Asset replacement and renewal ‐ ‐ ‐ ‐ ‐ ‐ ‐ ‐ ‐ ‐ ‐
13 Network opex 8,117 8,458 8,694 9,010 9,290 9,610 9,854 10,132 10,419 10,714 11,017
14 System operations and network support 3,455 4,048 4,162 4,289 4,397 4,507 4,619 4,735 4,853 4,974 5,099
15 Business support 6,605 8,277 8,508 8,770 8,989 9,213 9,444 9,680 9,922 10,170 10,424
16 Non‐network opex 10,060 12,325 12,670 13,059 13,385 13,720 14,063 14,415 14,775 15,144 15,523
17 Operational expenditure 18,177 20,783 21,364 22,069 22,675 23,330 23,917 24,547 25,194 25,858 26,540
18 Current year CY CY+1 CY+2 CY+3 CY+4 CY+5 CY+6 CY+7 CY+8 CY+9 CY+1019 for year ended 30 Jun 14 30 Jun 15 30 Jun 16 30 Jun 17 30 Jun 18 30 Jun 19 30 Jun 20 30 Jun 21 30 Jun 22 30 Jun 23 30 Jun 24
20 $000 (in constant prices)
21 Service interruptions, incidents and emergencies 3,789 3,802 3,807 3,807 3,807 3,807 3,807 3,807 3,807 3,807 3,807
22 Routine and corrective maintenance and inspection 4,328 4,435 4,430 4,475 4,524 4,601 4,603 4,630 4,658 4,685 4,712
23 Asset replacement and renewal ‐ ‐ ‐ ‐ ‐ ‐ ‐ ‐ ‐ ‐ ‐
24 Network opex 8,117 8,237 8,237 8,282 8,331 8,408 8,410 8,437 8,464 8,492 8,519
25 System operations and network support 3,455 3,943 3,943 3,943 3,943 3,943 3,943 3,943 3,943 3,943 3,943
26 Business support 6,605 8,060 8,060 8,060 8,060 8,060 8,060 8,060 8,060 8,060 8,060
27 Non‐network opex 10,060 12,003 12,003 12,003 12,003 12,003 12,003 12,003 12,003 12,003 12,003
28 Operational expenditure 18,177 20,240 20,240 20,285 20,334 20,411 20,413 20,440 20,467 20,495 20,522
29 Subcomponents of operational expenditure (where known)30 Research and development N/A N/A N/A N/A N/A N/A N/A N/A N/A N/A N/A
Insurance 252 266 266 266 266 266 266 266 266 266 266
32
33 Current year CY CY+1 CY+2 CY+3 CY+4 CY+5 CY+6 CY+7 CY+8 CY+9 CY+1034 for year ended 30 Jun 14 30 Jun 15 30 Jun 16 30 Jun 17 30 Jun 18 30 Jun 19 30 Jun 20 30 Jun 21 30 Jun 22 30 Jun 23 30 Jun 24
35 Difference between nominal and real forecasts $000
36 Service interruptions, incidents and emergencies ‐ 102 211 335 438 545 653 765 879 996 1,116
37 Routine and corrective maintenance and inspection ‐ 119 246 394 521 658 790 930 1,076 1,226 1,382
38 Asset replacement and renewal ‐ ‐ ‐ ‐ ‐ ‐ ‐ ‐ ‐ ‐ ‐
39 Network opex ‐ 221 458 729 959 1,203 1,443 1,695 1,955 2,222 2,498
40 System operations and network support ‐ 106 219 347 454 564 677 792 910 1,032 1,156
41 Business support ‐ 216 448 709 928 1,153 1,383 1,619 1,861 2,109 2,364
42 Non‐network opex ‐ 322 667 1,056 1,382 1,717 2,060 2,412 2,772 3,141 3,520
43 Operational expenditure ‐ 543 1,124 1,784 2,342 2,920 3,503 4,107 4,727 5,364 6,018
Vector Limited 1 July 2014 – 30 June 2024
This schedule requires a breakdown of forecast operational expenditure for the disclosure year and a 10 year planning period. The forecasts should be consistent with the supporting information set out in the AMP. The forecast is to be expressed in both constant price and nominal dollar terms.
GDBs must provide explanatory comment on the difference between constant price and nominal dollar operational expenditure forecasts in Schedule 14a (Mandatory Explanatory Notes).
This information is not part of audited disclosure information.
Gas Distribution Asset Management Plan Update - 2014
Date: 30 June 2014 Vector Gas Distribution Page 24 of 33

Gas Distribution Asset Management Plan Update - 2014
Date: 30 June 2014 Vector Gas Distribution Page 25 of 33
Schedule 11b Explanatory Notes The box below provides commentary specific to the difference between nominal and constant price operational expenditure forecasts. It is provided in the same format as required for Box 2, Schedule 14a of the Gas Distribution Information Disclosures, which will be fully disclosed within 6 months of the end of the disclosure year.
Commentary on difference between nominal and constant price operational expenditure forecasts
Vector has used the NZIER (New Zealand Institute of Economic Research) March 2014 PPI (Producer Price Index-outputs) forecast from 2014 to 2017. Thereafter we have assumed a long-term PPI rate of 2.5%. The constant price operational expenditure forecast is then inflated by the above mentioned PPI forecast to nominal price operational expenditure forecasts.
Gas Distribution Asset Management Plan Update - 2014
Date: 30 June 2014 Vector Gas Distribution Page 26 of 33
Gas Distribution Asset Management Plan Update
Information Disclosure 2014
Appendix 3 Report on Asset Condition
Gas Distribution Asset Management Plan Update - 2014
Date: 30 June 2014 Vector Gas Distribution Page 27 of 33
Company NameAMP Planning Period
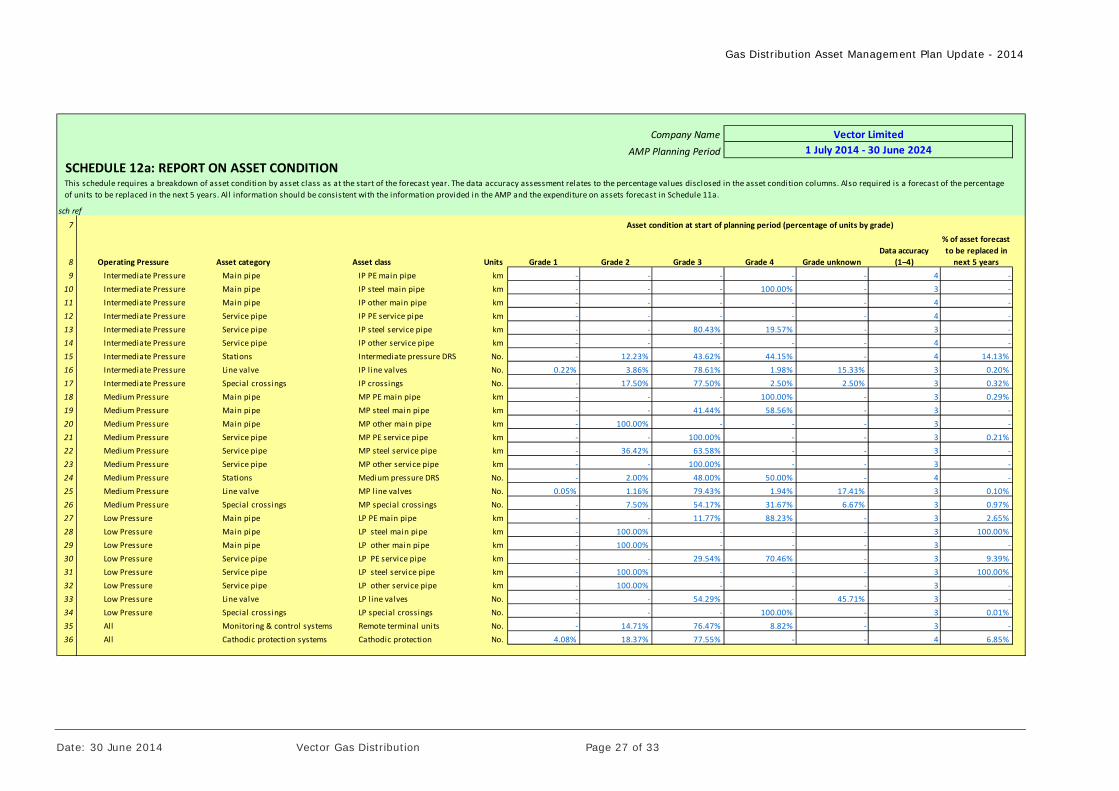
SCHEDULE 12a: REPORT ON ASSET CONDITION
sch ref
7
8 Operating Pressure Asset category Asset class Units Grade 1 Grade 2 Grade 3 Grade 4 Grade unknownData accuracy
(1–4)
% of asset forecast to be replaced in next 5 years
9 Intermediate Pressure Main pipe IP PE main pipe km ‐ ‐ ‐ ‐ ‐ 4 ‐
10 Intermediate Pressure Main pipe IP steel main pipe km ‐ ‐ ‐ 100.00% ‐ 3 ‐
11 Intermediate Pressure Main pipe IP other main pipe km ‐ ‐ ‐ ‐ ‐ 4 ‐
12 Intermediate Pressure Service pipe IP PE service pipe km ‐ ‐ ‐ ‐ ‐ 4 ‐
13 Intermediate Pressure Service pipe IP steel service pipe km ‐ ‐ 80.43% 19.57% ‐ 3 ‐
14 Intermediate Pressure Service pipe IP other service pipe km ‐ ‐ ‐ ‐ ‐ 4 ‐
15 Intermediate Pressure Stations Intermediate pressure DRS No. ‐ 12.23% 43.62% 44.15% ‐ 4 14.13%
16 Intermediate Pressure Line valve IP l ine valves No. 0.22% 3.86% 78.61% 1.98% 15.33% 3 0.20%
17 Intermediate Pressure Special crossings IP crossings No. ‐ 17.50% 77.50% 2.50% 2.50% 3 0.32%
18 Medium Pressure Main pipe MP PE main pipe km ‐ ‐ ‐ 100.00% ‐ 3 0.29%
19 Medium Pressure Main pipe MP steel main pipe km ‐ ‐ 41.44% 58.56% ‐ 3 ‐
20 Medium Pressure Main pipe MP other main pipe km ‐ 100.00% ‐ ‐ ‐ 3 ‐
21 Medium Pressure Service pipe MP PE service pipe km ‐ ‐ 100.00% ‐ ‐ 3 0.21%
22 Medium Pressure Service pipe MP steel service pipe km ‐ 36.42% 63.58% ‐ ‐ 3 ‐
23 Medium Pressure Service pipe MP other service pipe km ‐ ‐ 100.00% ‐ ‐ 3 ‐
24 Medium Pressure Stations Medium pressure DRS No. ‐ 2.00% 48.00% 50.00% ‐ 4 ‐
25 Medium Pressure Line valve MP l ine valves No. 0.05% 1.16% 79.43% 1.94% 17.41% 3 0.10%
26 Medium Pressure Special crossings MP special crossings No. ‐ 7.50% 54.17% 31.67% 6.67% 3 0.97%
27 Low Pressure Main pipe LP PE main pipe km ‐ ‐ 11.77% 88.23% ‐ 3 2.65%
28 Low Pressure Main pipe LP steel main pipe km ‐ 100.00% ‐ ‐ ‐ 3 100.00%
29 Low Pressure Main pipe LP other main pipe km ‐ 100.00% ‐ ‐ ‐ 3 ‐
30 Low Pressure Service pipe LP PE service pipe km ‐ ‐ 29.54% 70.46% ‐ 3 9.39%
31 Low Pressure Service pipe LP steel service pipe km ‐ 100.00% ‐ ‐ ‐ 3 100.00%
32 Low Pressure Service pipe LP other service pipe km ‐ 100.00% ‐ ‐ ‐ 3 ‐
33 Low Pressure Line valve LP l ine valves No. ‐ ‐ 54.29% ‐ 45.71% 3 ‐
34 Low Pressure Special crossings LP special crossings No. ‐ ‐ ‐ 100.00% ‐ 3 0.01%
35 All Monitoring & control systems Remote terminal units No. ‐ 14.71% 76.47% 8.82% ‐ 3 ‐
36 All Cathodic protection systems Cathodic protection No. 4.08% 18.37% 77.55% ‐ ‐ 4 6.85%
Vector Limited1 July 2014 ‐ 30 June 2024
Asset condition at start of planning period (percentage of units by grade)
This schedule requires a breakdown of asset condition by asset class as at the start of the forecast year. The data accuracy assessment relates to the percentage values disclosed in the asset condition columns. Also required is a forecast of the percentage
of units to be replaced in the next 5 years. All information should be consistent with the information provided in the AMP and the expenditure on assets forecast in Schedule 11a.
Gas Distribution Asset Management Plan Update - 2014
Date: 30 June 2014 Vector Gas Distribution Page 28 of 33
Gas Distribution Asset Management Plan Update
Information Disclosure 2014
Appendix 4 Report on Forecast Utilisation
Gas Distribution Asset Management Plan Update - 2014
Date: 30 June 2014 Vector Gas Distribution Page 29 of 33
Company Name
AMP Planning Period
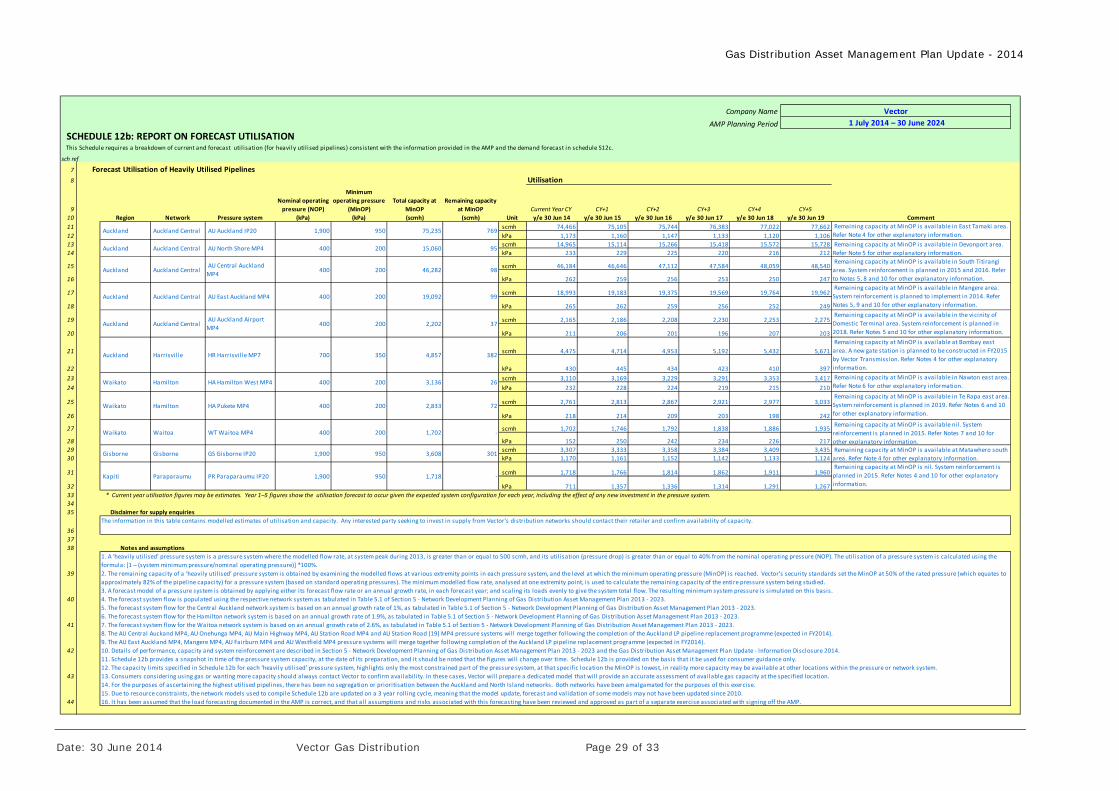
SCHEDULE 12b: REPORT ON FORECAST UTILISATION
sch ref
7 Forecast Utilisation of Heavily Utilised Pipelines8 Utilisation
9Nominal operating pressure (NOP)
Minimum operating pressure
(MinOP)Total capacity at
MinOPRemaining capacity
at MinOP Current Year CY CY+1 CY+2 CY+3 CY+4 CY+510 Region Network Pressure system (kPa) (kPa) (scmh) (scmh) Unit y/e 30 Jun 14 y/e 30 Jun 15 y/e 30 Jun 16 y/e 30 Jun 17 y/e 30 Jun 18 y/e 30 Jun 19 Comment11 scmh 74,466 75,105 75,744 76,383 77,022 77,662
12 kPa 1,173 1,160 1,147 1,133 1,120 1,106
13 scmh 14,965 15,114 15,266 15,418 15,572 15,728
14 kPa 233 229 225 220 216 212
15 scmh 46,184 46,646 47,112 47,584 48,059 48,540
16 kPa 262 259 256 253 250 247
17 scmh 18,993 19,183 19,375 19,569 19,764 19,962
18 kPa 265 262 259 256 252 249
19 scmh 2,165 2,186 2,208 2,230 2,253 2,275
20 kPa 211 206 201 196 207 203
21 scmh 4,475 4,714 4,953 5,192 5,432 5,671
22 kPa 430 445 434 423 410 397
23 scmh 3,110 3,169 3,229 3,291 3,353 3,417
24 kPa 232 228 224 219 215 210
25 scmh 2,761 2,813 2,867 2,921 2,977 3,033
26 kPa 218 214 209 203 198 242
27 scmh 1,702 1,746 1,792 1,838 1,886 1,935
28 kPa 152 250 242 234 226 217
29 scmh 3,307 3,333 3,358 3,384 3,409 3,435
30 kPa 1,170 1,161 1,152 1,142 1,133 1,124
31 scmh 1,718 1,766 1,814 1,862 1,911 1,960
32 kPa 711 1,357 1,336 1,314 1,291 1,267
33 * Current year utilisation figures may be estimates. Year 1–5 figures show the utilisation forecast to occur given the expected system configuration for each year, including the effect of any new investment in the pressure system.3435
363738
39
40
41
42
43
44
3,608 301
Remaining capacity at MinOP is avai lable nil. System
reinforcement is planned in 2015. Refer Notes 7 and 10 for
other explanatory information. Remaining capacity at MinOP is avai lable at Matawhero south
area. Refer Note 4 for other explanatory information. Gisborne Gisborne GS Gisborne IP20 1,900 950
The information in this table contains modelled estimates of utilisation and capacity. Any interested party seeking to invest in supply from Vector’s distribution networks should contact their retai ler and confirm availability of capacity.
Notes and assumptions1. A ‘heavi ly utilised’ pressure system is a pressure system where the modelled flow rate, at system peak during 2013, is greater than or equal to 500 scmh, and its utilisation (pressure drop) is greater than or equal to 40% from the nominal operating pressure (NOP). The util isation of a pressure system is calculated using the
formula: [1 – (system minimum pressure/nominal operating pressure)] *100%.
2. The remaining capacity of a ‘heavily utilised’ pressure system is obtained by examining the modelled flows at various extremity points in each pressure system, and the level at which the minimum operating pressure (MinOP) is reached. Vector’s security standards set the MinOP at 50% of the rated pressure (which equates to
approximately 82% of the pipeline capacity) for a pressure system (based on standard operating pressures). The minimum modelled flow rate, analysed at one extremity point, is used to calculate the remaining capacity of the entire pressure system being studied.
3. A forecast model of a pressure system is obtained by applying either its forecast flow rate or an annual growth rate, in each forecast year; and scal ing its loads evenly to give the system total flow. The resulting minimum system pressure is simulated on this basis.
4. The forecast system flow is populated using the respective network system as tabulated in Table 5.1 of Section 5 ‐ Network Development Planning of Gas Distribution Asset Management Plan 2013 ‐ 2023.
5. The forecast system flow for the Central Auckland network system is based on an annual growth rate of 1%, as tabulated in Table 5.1 of Section 5 ‐ Network Development Planning of Gas Distribution Asset Management Plan 2013 ‐ 2023.
6. The forecast system flow for the Hamilton network system is based on an annual growth rate of 1.9%, as tabulated in Table 5.1 of Section 5 ‐ Network Development Planning of Gas Distribution Asset Management Plan 2013 ‐ 2023.
7. The forecast system flow for the Waitoa network system is based on an annual growth rate of 2.6%, as tabulated in Table 5.1 of Section 5 ‐ Network Development Planning of Gas Distribution Asset Management Plan 2013 ‐ 2023.
8. The AU Central Auckand MP4, AU Onehunga MP4, AU Main Highway MP4, AU Station Road MP4 and AU Station Road (19) MP4 pressure systems will merge together following the completion of the Auckland LP pipeline replacement programme (expected in FY2014).
9. The AU East Auckland MP4, Mangere MP4, AU Fairburn MP4 and AU Westfield MP4 pressure systems will merge together following completion of the Auckland LP pipel ine replacement programme (expected in FY2014).
10. Details of performance, capacity and system reinforcement are described in Section 5 ‐ Network Development Planning of Gas Distribution Asset Management Plan 2013 ‐ 2023 and the Gas Distribution Asset Management Plan Update ‐ Information Disclosure 2014.
11. Schedule 12b provides a snapshot in time of the pressure system capacity, at the date of its preparation, and it should be noted that the figures will change over time. Schedule 12b is provided on the basis that it be used for consumer guidance only.
12. The capacity l imits specified in Schedule 12b for each ‘heavily utilised’ pressure system, highlights only the most constrained part of the pressure system, at that specific location the MinOP is lowest, in reality more capacity may be available at other locations within the pressure or network system.
13. Consumers considering using gas or wanting more capacity should always contact Vector to confirm availabi lity. In these cases, Vector wil l prepare a dedicated model that will provide an accurate assessment of available gas capacity at the specified location.
14. For the purposes of ascertaining the highest utilised pipelines, there has been no segregation or prioritisation between the Auckland and North Island networks. Both networks have been amalgamated for the purposes of this exercise.
15. Due to resource constraints, the network models used to compile Schedule 12b are updated on a 3 year rolling cycle, meaning that the model update, forecast and val idation of some models may not have been updated since 2010.
16. It has been assumed that the load forecasting documented in the AMP is correct, and that all assumptions and risks associated with this forecasting have been reviewed and approved as part of a separate exercise associated with signing off the AMP.
Remaining capacity at MinOP is avai lable in Te Rapa east area.
System reinforcement is planned in 2019. Refer Notes 6 and 10
for other explanatory information.
Remaining capacity at MinOP is nil. System reinforcement is
planned in 2015. Refer Notes 4 and 10 for other explanatory
information.
Disclaimer for supply enquiries
2,833 Waikato Hamilton 200
Kapiti Paraparaumu 1,718 ‐
Remaining capacity at MinOP is avai lable in Nawton east area.
Refer Note 6 for other explanatory information.
Remaining capacity at MinOP is avai lable at Bombay east
area. A new gate station is planned to be constructed in FY2015
by Vector Transmission. Refer Notes 4 for other explanatory
information.
Remaining capacity at MinOP is avai lable in the vicinity of
Domestic Terminal area. System reinforcement is planned in
2018. Refer Notes 5 and 10 for other explanatory information.
AU Central Auckland
MP4
Auckland Harrisville
Auckland Auckland Central AU East Auckland MP4 400
Auckland Auckland Central AU Auckland Airport
MP4 400 200 2,202
Vector 1 July 2014 – 30 June 2024
Remaining capacity at MinOP is avai lable in Devonport area.
Refer Note 5 for other explanatory information.
Remaining capacity at MinOP is avai lable in East Tamaki area.
Refer Note 4 for other explanatory information.
Remaining capacity at MinOP is avai lable in Mangere area.
System reinforcement is planned to implement in 2014. Refer
Notes 5, 9 and 10 for other explanatory information.
Remaining capacity at MinOP is avai lable in South Titirangi
area. System reinforcement is planned in 2015 and 2016. Refer
to Notes 5, 8 and 10 for other explanatory information.
This Schedule requires a breakdown of current and forecast utilisation (for heavily utilised pipelines) consistent with the information provided in the AMP and the demand forecast in schedule S12c.
Auckland Auckland Central
1,900 769
Auckland Auckland Central AU North Shore MP4
Auckland Auckland Central AU Auckland IP20 950 75,235
99
400 200 15,060
400 200 46,282
95
98
200 19,092
950
Waikato Hamilton
37
4,857
200 HA Hamilton West MP4 400
700
Waikato Waitoa WT Waitoa MP4 400 200 1,702 ‐
382
3,136 26
HA Pukete MP4 400 72
350 HR Harrisville MP7
PR Paraparaumu IP20 1,900

Gas Distribution Asset Management Plan Update - 2014
Date: 30 June 2014 Vector Gas Distribution Page 30 of 33
Schedule 12b Explanatory Notes Explanatory notes pertaining to Schedule 12b are provided in the box below, in the format required for Schedule 15 of the Gas Distribution Information Disclosures:
Additional explanatory comment on disclosed information
Gas Distribution Asset Management Plan Update - 2014
Date: 30 June 2014 Vector Gas Distribution Page 31 of 33
Gas Distribution Asset Management Plan Update
Information Disclosure 2014
Appendix 5 Report on Forecast Demand
Gas Distribution Asset Management Plan Update - 2014
Date: 30 June 2014 Vector Gas Distribution Page 32 of 33
Company NameAMP Planning Period
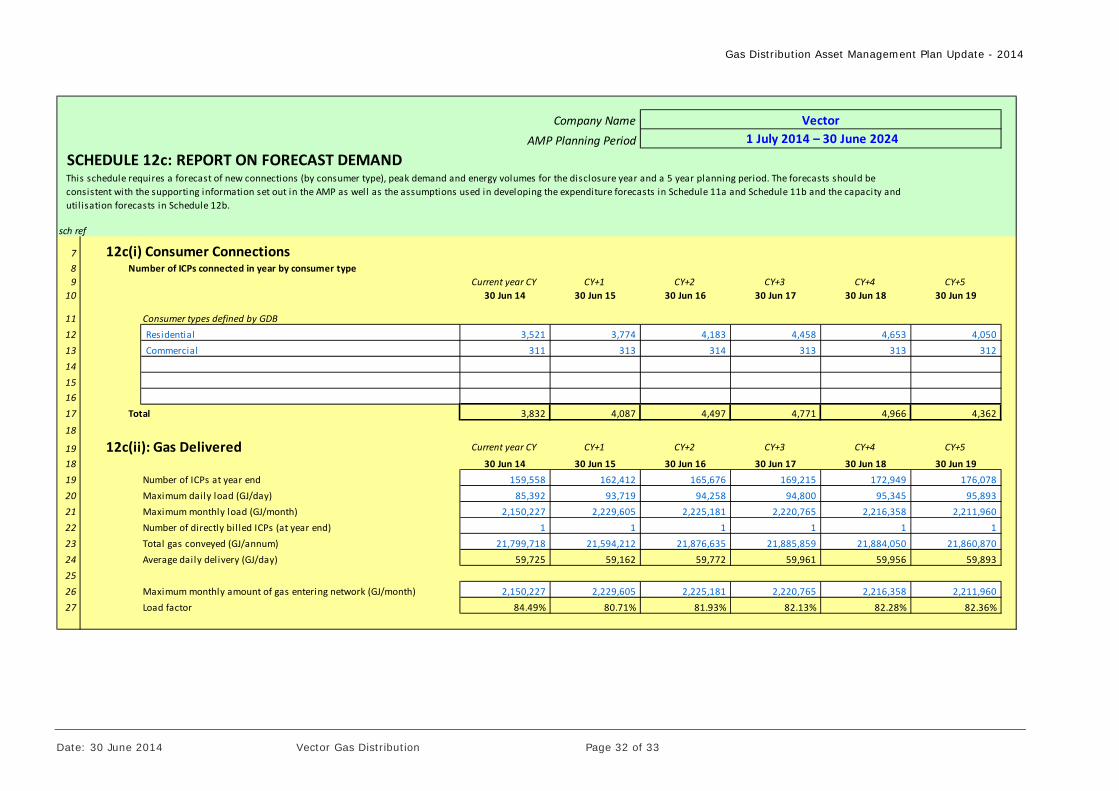
SCHEDULE 12c: REPORT ON FORECAST DEMAND
sch ref
7 12c(i) Consumer Connections8 Number of ICPs connected in year by consumer type9 Current year CY CY+1 CY+2 CY+3 CY+4 CY+5
10 30 Jun 14 30 Jun 15 30 Jun 16 30 Jun 17 30 Jun 18 30 Jun 19
11 Consumer types defined by GDB12 Residential 3,521 3,774 4,183 4,458 4,653 4,050
13 Commercial 311 313 314 313 313 312
14151617 Total 3,832 4,087 4,497 4,771 4,966 4,362
18
19 12c(ii): Gas Delivered Current year CY CY+1 CY+2 CY+3 CY+4 CY+5
18 30 Jun 14 30 Jun 15 30 Jun 16 30 Jun 17 30 Jun 18 30 Jun 1919 Number of ICPs at year end 159,558 162,412 165,676 169,215 172,949 176,078
20 Maximum daily load (GJ/day) 85,392 93,719 94,258 94,800 95,345 95,893
21 Maximum monthly load (GJ/month) 2,150,227 2,229,605 2,225,181 2,220,765 2,216,358 2,211,960
22 Number of directly billed ICPs (at year end) 1 1 1 1 1 1
23 Total gas conveyed (GJ/annum) 21,799,718 21,594,212 21,876,635 21,885,859 21,884,050 21,860,870
24 Average daily delivery (GJ/day) 59,725 59,162 59,772 59,961 59,956 59,893
2526 Maximum monthly amount of gas entering network (GJ/month) 2,150,227 2,229,605 2,225,181 2,220,765 2,216,358 2,211,960
27 Load factor 84.49% 80.71% 81.93% 82.13% 82.28% 82.36%
Vector 1 July 2014 – 30 June 2024
This schedule requires a forecast of new connections (by consumer type), peak demand and energy volumes for the disclosure year and a 5 year planning period. The forecasts should be
consistent with the supporting information set out in the AMP as well as the assumptions used in developing the expenditure forecasts in Schedule 11a and Schedule 11b and the capacity and
util isation forecasts in Schedule 12b.

Gas Distribution Asset Management Plan Update - 2014
Date: 30 June 2014 Vector Gas Distribution Page 33 of 33
Schedule 12c Explanatory Notes Explanatory notes pertaining to Schedule 12c are provided in the box below, in the format required for Schedule 15 of the Gas Distribution Information Disclosures:
Additional explanatory comment on disclosed information