Embed Size (px)
Citation preview

GasLog Ltd. Reports Financial Results for the Quarter and the Year Ended December 31, 2018
Monaco, February 14, 2019, GasLog Ltd. and its subsidiaries (“GasLog”, “Group” or “Company”) (NYSE: GLOG), an international owner,
operator and manager of liquefied natural gas (“LNG”) carriers, today reported its financial results for the quarter and the year ended December 31,
2018.
Highlights of the Quarter and the Year
• Record quarterly Revenues, Profit, Earnings per share(1), record EBITDA(2), record Adjusted EBITDA(2), record Adjusted Profit(2) and record
Adjusted Earnings per share(1)(2) of $188.6 million, $30.4 million, $0.14, $145.0 million, $145.0 million, $62.5 million and $0.54,
respectively.
• Record annual Revenues, record Profit, Earnings per share(1), record EBITDA(2), record Adjusted EBITDA(2), record Adjusted Profit(2) and
Adjusted Earnings per share(1)(2) of $618.3 million, $126.4 million, $0.47, $447.5 million, $447.7 million, $134.8 million and $0.57,
respectively.
• Highest ever quarterly net pool performance from our vessels trading in the spot market under the LNG carrier pooling agreement (the “Cool
Pool”) following a significant increase in LNG shipping spot rates and utilization.
• Signed two seven-year charter parties with a wholly-owned subsidiary of Cheniere Energy, Inc. (“Cheniere”), for two newbuild LNG carriers.
The vessels, 180,000 cubic meter (“cbm”) LNG carriers with dual fuel two stroke engine propulsion (“LP-2S”) and GTT Mark III Flex Plus
containment systems, were ordered from Samsung Heavy Industries Co., Ltd. (“Samsung”) and are scheduled for delivery in the second and
third quarters of 2021.
• Completed the sale of the Methane Becki Anne to GasLog Partners LP (“GasLog Partners” or the “Partnership”) for $207.4 million on
November 14, 2018 with attached multi-year charter to a subsidiary of Royal Dutch Shell plc (“Shell”).
• GasLog Partners completed a public offering of 8.500% Series C Cumulative Redeemable Perpetual Fixed to Floating Rate Preference Units
(the “Partnership’s Series C Preference Units”), raising gross proceeds of $100.0 million and net proceeds of $96.3 million.
• Modified the Partnership Agreement with GasLog Partners to reduce GasLog’s incentive distribution rights (“IDRs”) on quarterly
distributions above $0.5625 per unit from 48% to 23% and waive IDRs on assets or businesses acquired by the Partnership from third parties
in exchange for a cash consideration of $25.0 million.
• Special dividend of $0.40 per common share paid on December 17, 2018.
• Quarterly dividend of $0.15 per common share payable on March 14, 2019, an increase of 7.1% over the fourth quarter of 2017.
• Announced share repurchase programme of up to $50.0 million.
(1) Earnings/(loss) per share (“EPS”) and Adjusted EPS are net of the profit attributable to the non-controlling interests of $16.6 million and the dividend on preferred
stock of $2.5 million for the quarter ended December 31, 2018 ($20.8 million and $2.5 million, respectively, for the quarter ended December 31, 2017) and net of
the profit attributable to the non-controlling interests of $78.7 million and the dividend on preferred stock of $10.1 million for the year ended December 31, 2018 ($68.7 million and $10.1 million, respectively, for the year ended December 31, 2017).
(2) EBITDA, Adjusted EBITDA, Adjusted Profit and Adjusted EPS are non-GAAP financial measures and should not be used in isolation or as a substitute for GasLog’s financial results presented in accordance with International Financial Reporting Standards (“IFRS”). For the definitions and reconciliations of these
measures to the most directly comparable financial measures calculated and presented in accordance with IFRS, please refer to Exhibit II at the end of this press
release.
CEO Statement
Paul Wogan, Chief Executive Officer, stated: “GasLog delivered another set of record results in the fourth quarter of 2018 driven in large part by
very strong earnings from our spot vessels against a backdrop of extreme tightness in the LNG shipping market. These spot earnings, combined with
our fleet growth during the year, our strong operational performance and strict cost control, delivered record annual results for Revenues, EBITDA
and Profit and allowed us both to increase our common dividend by 7.1% and to declare our first special dividend in November.
During 2018, we continued to execute our growth strategy. We announced seven newbuild orders, six of which are committed to long-term charters,
four with Cheniere and two with a wholly owned subsidiary of Centrica plc (“Centrica”). We are very pleased to continue to develop and strengthen
our relationship with these two important customers.
GasLog Partners issued over $320.0 million of new equity in 2018, of which over $200.0 million was recycled to GasLog as consideration for the
two dropdowns and the modification of the IDRs which will permanently reduce the Partnership’s expected cost of capital. The equity recycled to
GasLog and our declining leverage mean that we are well placed to fund our newbuild vessels under construction.
The continued growth of our fleet, the improvement in spot earnings and our cost control measures mean we have made significant progress
towards meeting our target of more than doubling consolidated annualized EBITDA over the 2017-2022 period.
While spot rates have recently moderated from fourth quarter peaks, in line with historical seasonal trends, we expect tightness in LNG shipping
markets to return given forecast LNG supply growth through 2020 and relatively few uncommitted newbuild vessels delivering in that period.
As we look beyond 2020, additional shipping capacity will be required if consensus LNG demand and supply forecasts are realized. However,
whilst we now believe that the LNG shipping market is heading towards a balanced state early next decade, the long-term secular growth of LNG
supply and demand mean that, over the medium and long-term, GasLog will continue to serve a dynamic and growing industry.
LNG Market Update and Outlook
LNG demand, as estimated by Wood Mackenzie, is expected to have increased by 9%, from 288 million tonnes per annum (“mtpa”) in 2017 to 313
mtpa in 2018. According to China’s General Administration of Customs, China’s LNG imports increased by approximately 16 mtpa, or 41%, to 54
mtpa in 2018, driven mainly by continued coal-to-gas switching in the industrial, commercial and residential sectors. South Korea, Pakistan,
Thailand and Mexico also experienced strong growth in LNG imports during 2018. The outlook remains robust, with Wood Mackenzie forecasting
compound annual growth in global LNG demand of 6% between 2018 and 2025. This growth is expected to be broad-based, with Wood Mackenzie
forecasting that South East Asia and Europe will account for approximately 70% of the 148 mtpa net increase in demand between 2018 and 2025.
According to Wood Mackenzie, global LNG supply in 2018 totaled 326 million tonnes (“mt”), or a 9% increase on 2017. Several new LNG supply
projects and the ramp-up of existing facilities contributed to the increase in LNG production in 2018. During the year, new production started in the
United States (Cove Point, Corpus Christi Train 1 and Sabine Pass Train 5), Australia (Wheatstone Train 2, Ichthys), Russia (Yamal Trains 2 & 3)
and Cameroon Floating LNG. Supply from existing liquefaction facilities in Egypt, Trinidad and Tobago and Oman also increased following
successful efforts to raise domestic gas production. Downtime at existing facilities in Malaysia and Russia partially offset these gains.
Based on Wood Mackenzie’s current forecasts, 2019 is anticipated to be the strongest year ever for supply growth in the LNG market, with supply
expected to increase by 40 mtpa to 366 mtpa, a 12% increase on 2018. This includes new LNG production from Elba Island, Cameron, Freeport and
Corpus Christi Train 2 in the United States, the Prelude floating LNG project offshore Australia, further increases in Russia’s output and the
continued ramp-up of projects which were brought onstream in 2018.
During 2018, three new LNG liquefaction projects reached Final Investment Decision (“FID”), underpinning further LNG supply growth during the
next decade. LNG Canada (14 mtpa) in western Canada, Corpus Christi Train 3 (4.5 mtpa) in the United States and the Greater Tortue Ahmeyim
project offshore Mauritania and Senegal (2.5 mtpa) were all approved during the year. In February 2019, the Golden Pass (16 mtpa) project in the
United States also reached FID. According to Wood Mackenzie, proposed projects (including Golden Pass) in the United States with a combined
capacity of approximately 35 mtpa are expected to gain investment approval in 2019. Outside the United States, Qatar is aiming to take FID on an
expansion of existing facilities from 77 to 110 mtpa. New projects offshore Mozambique (28 mtpa) and the Arctic LNG-2 project (20 mtpa) in
Russia are also expected by Wood Mackenzie to be approved in 2019.
In parallel with the progress on new supply FIDs, in 2018 there was a significant increase in the number of announced long-term LNG off-take
contracts. According to Wood Mackenzie and company disclosures, 95 mtpa of long-term (defined as greater than 5 years’ duration) off-take
commitments have been agreed since the beginning of 2018, compared to 25 mtpa in 2017. The nature of the LNG marketplace also continued to
evolve. According to the Financial Times, the top three independent commodity traders increased their delivered LNG volumes by almost 40% to
31 mt in 2018, taking market share from traditional participants such as national oil companies and major integrated oil and gas companies.
In the LNG shipping spot market, tri-fuel diesel electric (“TFDE”) headline rates, as reported by Clarksons, averaged $89,000 per day in 2018, a
93% increase on 2017 levels. Headline TFDE rates rose significantly in the fourth quarter of 2018 and reached all-time highs of $190,000 per day in
November 2018 following a marked decrease in spot ship availability. Average headline TFDE rates in the fourth quarter of 2018 were $150,000
per day. Headline rates for steam propulsion (“Steam”) vessels also reached multi-year highs of $98,000 per day in late 2018. In recent weeks
however, relatively mild winter weather and ample inventory levels in key Asian markets have resulted in falling Asian LNG prices, reducing the
incentive to move LNG cargoes from the Atlantic to the Pacific Basin and resulting in a seasonal rise in prompt vessel availability and falling spot
rates. Headline TFDE spot rates are currently assessed at $60,000 per day. Notwithstanding this recent fall and the likelihood of continued
seasonality in the spring shoulder months, we continue to believe that the medium-term outlook for spot rates through 2019 and 2020 is positive
given supportive LNG commodity fundamentals and LNG shipping supply and demand. However, spot rates may be prone to further periods of
seasonality and volatility similar to that seen in 2018.
During 2018 there was a significant increase in term chartering activity. Based on Poten data, charters between 181 days to seven years duration
increased to 19% of total fixtures in 2018, from 5% in 2017. Our expectation of structural tightness in the LNG carrier market, combined with
increasing spot vessel availability, could result in this trend continuing in 2019 and beyond.
According to Poten, there were 61 orders for dedicated LNG carrier newbuilds in 2018, an all-time high. The orderbook now totals 105 dedicated
LNG carriers (>100,000 cbm), of which 63% are backed by long-term contracts. The positive outlook for LNG commodity and LNG shipping
markets, as well as historically low newbuild prices, resulted in both existing LNG carrier owners and new entrants ordering new vessels. Based on
2018 newbuilding orders and current forecasts of LNG supply growth, we now believe that the LNG shipping market is heading towards a balanced
state early next decade. As such, the requirement for additional shipping capacity in this period has now been largely addressed. This implies that
newbuilding order activity in 2019 needs to slow relative to 2018 levels in order to reduce the risk of vessel oversupply.
Completion of the Sale of the Methane Becki Anne
On November 14, 2018, GasLog completed the sale of 100% of the ownership interest in GAS-twenty seven Ltd., the entity which owns the
Methane Becki Anne, to GasLog Partners for an aggregate purchase price of $207.4 million, which includes $1.0 million for positive net working
capital.
GasLog Partners’ Issuance of Series C Preference Units
On November 15, 2018, GasLog Partners completed a public offering of 4,000,000 8.500% Series C Preference Units, liquidation preference $25.00
per unit, at a price to the public of $25.00 per preference unit. The net proceeds from the offering after deducting underwriting discounts,
commissions and other offering expenses were $96.3 million. The Partnership’s Series C Preference Units are listed on the New York Stock
Exchange under the symbol “GLOP PR C”. The initial distribution on the Partnership’s Series C Preference Units will be payable on March 15,
2019.

IDRs Modification
On November 27, 2018, GasLog and GasLog Partners entered into an agreement to modify the partnership agreement with respect to GasLog’s
IDRs. The modification reduces GasLog’s IDRs on quarterly distributions above $0.5625 per unit from 48% to 23%. GasLog has further agreed to
waive IDR payments resulting from any asset or business acquired by GasLog Partners from a third party. In exchange for these modifications, the
Partnership paid $25.0 million to GasLog which was sourced from available cash.
Share Repurchase Programme
On November 28, 2018, the board of directors of GasLog authorized a share repurchase programme of up to $50.0 million covering the period from
January 1, 2019 to December 31, 2021. Under the terms of the repurchase programme, we may repurchase common shares from time to time, at our
discretion, on the open market or in privately negotiated transactions. Any repurchases are subject to market conditions, applicable legal
requirements and other considerations. We are not obligated under the repurchase programme to repurchase any specific dollar amount or number
of common shares and the repurchase programme may be modified, suspended or discontinued at any time or never utilized. Any common shares
repurchased by us under the programme will be held in treasury. As of February 14, 2019, GasLog has not purchased any shares.
Additional Vessels and New Charter Agreements
On December 26, 2018, GasLog announced the order of two 180,000 cbm LNG carriers (Hull Nos. 2311 and 2312) with LP-2S propulsion and
GTT Mark III Flex Plus containment systems from Samsung that are scheduled to be delivered in the second and third quarters of 2021. The vessels
will be chartered to Cheniere for a firm period of seven years pursuant to an option for the charter of one or two additional newbuild vessels
negotiated in 2018.
GasLog Partners’ ATM Programme
On May 16, 2017, GasLog Partners commenced an ATM Programme under which the Partnership may, from time to time, raise equity through the
issuance and sale of new common units having an aggregate offering value of up to $100.0 million in accordance with the terms of an equity
distribution agreement entered into on the same date. Citigroup Global Markets Inc., Merrill Lynch, Pierce, Fenner & Smith Incorporated, Credit
Suisse Securities (USA) LLC and Morgan Stanley & Co. LLC agreed to act as sales agents. On November 3, 2017, the size of the ATM Programme
was increased to $144.0 million and UBS Securities LLC was included as a sales agent.
In the fourth quarter of 2018, GasLog Partners issued and received payment for an additional 259,104 common units at a weighted average price of
$24.06 per common unit for total gross proceeds of $6.2 million and net proceeds of $6.0 million.
Since the commencement of the ATM Programme through December 31, 2018, GasLog Partners has issued and received payment for a total of
5,291,304 common units, with cumulative gross proceeds of $123.4 million at a weighted average price of $23.33 per unit. As of December 31,
2018, the cumulative net proceeds were $121.2 million.
Alexandroupolis Project Update
In early January 2019, Gastrade S.A. (“Gastrade”) announced the successful completion of the first phase of the solicitation of commitments to take
capacity in the project (the “Market Test”), with 20 companies submitting a non-binding Expression of Interest for a total of up to 12.2 billion cubic
metres (“bcm”) a year of regasification capacity from the Alexandroupolis FSRU. The non-binding phase of the Market Test surpassed the 5.5
bcm/year technical capacity of the project. Planning for the binding phase of the Market Test is well advanced.
Gastrade also announced in January 2019 that the deadline for the initial phase of the procurement of the Alexandroupolis FSRU had been extended
to February 15, 2019. Gastrade is targeting FID in mid-2019; however, this timetable assumes significant near-term progress on critical path items,
including decisions by various regulatory bodies.
DEPA, the Greek state natural gas utility, and Bulgartransgaz, the Bulgarian national gas transmission system operator, continue to work towards
the formalisation of their respective shareholdings in Gastrade.
Dividend Declarations
On November 15, 2018, the board of directors declared a dividend on the Series A Preference Shares of $0.546875 per share, or $2.5 million in
aggregate, payable on January 2, 2019 to holders of record as of December 31, 2018. GasLog paid the declared dividend to the transfer agent on
December 31, 2018.
On November 28, 2018, the board of directors declared a special dividend of $0.40 per common share, or $32.3 million in aggregate, which was
paid on December 17, 2018.
On February 13, 2019, the board of directors declared a quarterly cash dividend of $0.15 per common share, or $12.1 million in aggregate, payable
on March 14, 2019 to shareholders of record as of March 4, 2019.

Financial Summary
Amounts in thousands of U.S. dollars
For the three months ended For the year ended
December 31,
2017
December 31,
2018
December 31,
2017
December 31,
2018
Revenues $ 135,772 $ 188,644 $ 525,229 $ 618,344
EBITDA(1) $ 89,655 $ 144,982 $ 355,902 $ 447,511
Adjusted EBITDA(1) $ 89,666 $ 145,026 $ 356,048 $ 447,747
Profit $ 29,685 $ 30,384 $ 84,209 $ 126,398
Adjusted Profit(1) $ 21,438 $ 62,517 $ 78,724 $ 134,845
Profit attributable to the owners of GasLog $ 8,934 $ 13,785 $ 15,506 $ 47,683
EPS, basic $ 0.08 $ 0.14 $ 0.07 $ 0.47
Adjusted EPS(1) $ (0.02 ) $ 0.54 $ (0.00 ) $ 0.57
(1) EBITDA, Adjusted EBITDA, Adjusted Profit and Adjusted EPS are non-GAAP financial measures and should not be used in isolation or as a substitute for
GasLog’s financial results presented in accordance with IFRS. For definitions and reconciliations of these measurements to the most directly comparable financial
measures calculated and presented in accordance with IFRS, please refer to Exhibit II at the end of this press release.
There were 2,317 and 9,030 operating days for the quarter and the year ended December 31, 2018, respectively, as compared to 2,050 and 8,317
operating days for the quarter and the year ended December 31, 2017, respectively. The increase in operating days resulted mainly from the
deliveries of the GasLog Houston, the GasLog Hong Kong and the GasLog Genoa on January 8, 2018, March 20, 2018 and March 29, 2018,
respectively, partially offset by certain non-operating days for the vessels not operating under a long-term time charter and the off-hire days for four
dry-dockings in 2018 (the GasLog Santiago, the GasLog Sydney, the GasLog Skagen and the GasLog Seattle), as opposed to only one dry-docking
in 2017 (the GasLog Shanghai).
Revenues were $188.6 million and $618.3 million for the quarter and the year ended December 31, 2018, respectively ($135.8 million and $525.2
million for the quarter and the year ended December 31, 2017, respectively). The increase was mainly driven by the new deliveries in our fleet (the
GasLog Houston, the GasLog Hong Kong and the GasLog Genoa) and the increased revenues from vessels operating in the spot market due to the
significant increase in LNG shipping spot rates during the year as a whole and the fourth quarter in particular, partially offset by a decrease due to
the expiration of the initial time charters of the GasLog Shanghai, the GasLog Santiago and the GasLog Sydney and the increase in off-hire days
due to dry-dockings in 2018.
GasLog recognized gross revenues and gross voyage expenses and commissions of $57.9 million and $2.4 million, respectively, from the operation
of its vessels in the Cool Pool during the quarter ended December 31, 2018 ($14.5 million and $3.6 million for the quarter ended December 31,
2017, respectively) and $102.3 million and $10.2 million, respectively, from the operations of its vessels in the Cool Pool during the year ended
December 31, 2018 ($38.0 million and $9.1 million for the year ended December 31, 2017, respectively). Net pool allocation was negative $1.7
million and positive $17.8 million for the quarter and the year ended December 31, 2018, respectively (positive $3.9 million and $7.3 million for the
quarter and the year ended December 31, 2017, respectively). The variances were attributable to the movement in the adjustment of the net pool
results generated by the GasLog vessels in accordance with the pool distribution formula for the total fleet of the pool. The increase in GasLog’s
total net pool performance during the quarter and year ended December 31, 2018 compared to the quarter and year ended December 31, 2017 was
driven by higher spot rates and higher utilization achieved by all vessels trading in the Cool Pool. GasLog’s total net pool performance is presented
below:
Amounts in thousands of U.S. dollars
For the three months ended For the year ended
December 31,
2017
December 31,
2018
December 31,
2017
December 31,
2018
Pool gross revenues (included in Revenues) $ 14,522 $ 57,854 $ 38,046 $ 102,253
Pool gross voyage expenses and commissions (included in
Voyage expenses and commissions) (3,580 ) (2,385 ) (9,122 ) (10,154 )
GasLog’s adjustment for net pool allocation (included in Net
pool allocation) 3,893 (1,675 ) 7,254 17,818
GasLog’s total net pool performance $ 14,835 $ 53,794 $ 36,178 $ 109,917
Voyage expenses and commissions were $3.6 million and $20.4 million for the quarter and the year ended December 31, 2018, respectively ($5.2
million and $15.4 million for the quarter and the year ended December 31, 2017, respectively). The decrease for the quarter ended December 31,
2018 as compared to the quarter ended December 31, 2017 was mainly attributable to a decrease in bunkers consumed due to the increased
utilization of our vessels in the spot market. The year-on-year increase resulted mainly from the increased bunkers consumed during certain off-
charter and off-hire days.
Vessel operating and supervision costs were $29.1 million and $128.1 million for the quarter and the year ended December 31, 2018, respectively
($35.6 million and $122.5 million for the quarter and the year ended December 31, 2017, respectively). The decrease for the quarter ended
December 31, 2018 as compared to the quarter ended December 31, 2017 was mainly attributable to a decrease in technical and maintenance
expenses, as well as a decrease in tonnage tax and insurance costs. The year-on-year increase was mainly attributable to the deliveries of the
GasLog Houston, the GasLog Hong Kong and the GasLog Genoa earlier in 2018, resulting in increased crew costs, partially offset by a decrease in
tonnage tax.

General and administrative expenses were $9.7 million and $42.0 million for the quarter and the year ended December 31, 2018, respectively ($9.6
million and $39.9 million for the quarter and the year ended December 31, 2017, respectively). The year-on-year increase was mainly attributable
to an increase in employee costs due to the unfavorable movement of the USD against the EUR and the British Pound (we have entered into forward
foreign exchange contracts to hedge economically part of this exposure and the associated realized (losses)/gains are recorded in Gain/(loss) on the
derivatives line, which is discussed below).
Depreciation was $39.5 million and $153.2 million for the quarter and the year ended December 31, 2018, respectively ($34.6 million and $137.2
million for the quarter and the year ended December 31, 2017, respectively). The increase resulted from the deliveries of the GasLog Houston, the
GasLog Hong Kong and the GasLog Genoa on January 8, 2018, March 20, 2018 and March 29, 2018, respectively.
Financial costs were $44.1 million and $166.6 million for the quarter and the year ended December 31, 2018, respectively ($34.9 million and $139.2
million for the quarter and the year ended December 31, 2017, respectively). The increase was attributable to the increased weighted average debt
outstanding as a result of the debt drawdowns for the vessels delivered in 2018 and the increased weighted average interest rate deriving from the
upward movement of the USD London Interbank Offered Rate (“LIBOR”) rates. An analysis of the financial costs is set out below.
(All amounts expressed in thousands of U.S. dollars)
For the three months ended For the year ended
December 31,
2017
December 31,
2018
December 31,
2017
December 31,
2018
Financial costs
Amortization of deferred loan/ bond issuance costs $ (3,063 ) $ (3,210 ) $ (12,398 ) $ (12,593 )
Interest expense on loans (21,132 ) (30,269 ) (85,813 ) (111,600 )
Interest expense on bonds and realized loss on cross-
currency swaps (“CCS”) (7,588 ) (7,588 ) (27,085 ) (30,029 )
Finance lease charge (2,708 ) (2,617 ) (10,875 ) (10,520 )
Loss arising on bond repurchase at a premium — — (1,459 ) —
Other financial costs (379 ) (438 ) (1,551 ) (1,885 )
Total $ (34,870 ) $ (44,122 ) $ (139,181 ) $ (166,627 )
Loss on derivatives was $32.4 million and $6.1 million for the quarter and the year ended December 31, 2018, respectively ($8.6 million and $2.0
million gain for the quarter and the year ended December 31, 2017, respectively). The decrease in gain on derivatives in the fourth quarter of 2018,
as compared to the fourth quarter of 2017, is mainly attributable to a decrease of $40.7 million in gain from mark-to-market valuation of our
derivative financial instruments carried at fair value through profit or loss, derived mainly from changes in the LIBOR curve as well as
modifications of the Group’s interest rate swap portfolio that includes interest rate swap agreements with maturities out to 2028, and a net decrease
of $0.4 million in realized gain on derivatives. The year-on-year decrease in gain on derivatives is mainly attributable to a decrease of $18.5 million
in gain from mark-to-market valuation of our derivative financial instruments carried at fair value through profit or loss, partially offset by a
decrease of $6.2 million in realized loss on derivatives and the decrease of $4.4 million in recycled loss of cash flow hedges reclassified to profit or
loss. An analysis of gain on derivatives is set out below:
(All amounts expressed in thousands of U.S. dollars)
For the three months ended For the year ended
December 31,
2017
December 31,
2018
December 31,
2017
December 31,
2018
Gain/(loss) on derivatives
Realized gain/(loss) on derivatives held for trading $ (1,650 ) $ 828 $ (7,842 ) $ 1,893
Realized (loss)/gain on forward foreign exchange contracts
held for trading 1,789 (1,122 ) 3,730 241
Unrealized gain/(loss) on derivative financial instruments
held for trading 8,536 (32,132 ) 10,570 (7,922 )
Recycled loss of cash flow hedges reclassified to profit or
loss — — (4,368 ) —
Ineffective portion of cash flow hedges (65 ) 43 (65 ) (289 )
Total $ 8,610 $ (32,383 ) $ 2,025 $ (6,077 )
There was a profit of $30.4 million and $126.4 million for the quarter and the year ended December 31, 2018, respectively ($29.7 million and $84.2
million profit for the quarter and the year ended December 31, 2017, respectively). The increase in profit was mainly attributable to the increase in
profit from operations due to the factors mentioned above, partially offset by the decrease in gain on derivatives and the increase in financial costs.
Adjusted Profit(1) was $62.5 million and $134.8 million for the quarter and the year ended December 31, 2018, respectively ($21.4 million and
$78.7 million for the quarter and the year ended December 31, 2017, respectively) adjusted for the effects of the non-cash losses on derivatives and
the net foreign exchange losses/(gains).
Profit attributable to the owners of GasLog was $13.8 million and $47.7 million for the quarter and the year ended December 31, 2018, respectively
($8.9 million and $15.5 million profit for the quarter and the year ended December 31, 2017, respectively). The increase in profit attributable to the
owners of GasLog in the fourth quarter of 2018, as compared to the fourth quarter of 2017, resulted mainly from the respective movements in profit
mentioned above and the decreased amount allocated to third parties following the decreased Partnership’s profit. The year-on-year increase in
profit attributable to the owners of GasLog resulted mainly from the respective movements in profit mentioned above, partially offset by the
increased amount allocated to third parties as a result of the issuances under the GasLog Partners’ ATM Programme, the preference unit issuances
in January 2018 and November 2018 and the sale of three vessels to GasLog Partners.
EBITDA(1) was $145.0 million and $447.5 million for the quarter and the year ended December 31, 2018, respectively ($89.7 million and $355.9
million for the quarter and the year ended December 31, 2017, respectively). The increase in EBITDA(1) in the fourth quarter of 2018 as compared
to the same quarter of 2017 was driven by the increase in revenues and improved net pool performance reflecting the significant increase in LNG
shipping spot rates, as well as the decrease in vessels operating and supervision costs and voyages expenses. The year-on-year increase in
EBITDA(1) was driven by the increase in revenues and net pool performance, partially offset by the increase in vessel operating expenses and
voyage expenses and commissions as discussed above.
Adjusted EBITDA(1) was $145.0 million and $447.7 million for the quarter and the year ended December 31, 2018, respectively ($89.7 million and
$356.0 million for the quarter and the year ended December 31, 2017, respectively).
Earnings per share was $0.14 and $0.47 for the quarter and the year ended December 31, 2018, respectively (earnings per share of $0.08 and $0.07
for the quarter and the year ended December 31, 2017, respectively). The increase in earnings per share is mainly attributable to the respective
movements in profit attributable to the owners of GasLog discussed above.
Adjusted Earnings per share(1) was $0.54 and $0.57 for the quarter and the year ended December 31, 2018, respectively (a loss of $0.02 and $0.00
for the quarter and the year ended December 31, 2017, respectively), adjusted for the effects of the non-cash (gains)/losses on derivative financial
instruments and the net foreign exchange losses/(gains).
(1) Adjusted Profit, EBITDA, Adjusted EBITDA and Adjusted EPS are non-GAAP financial measures and should not be used in isolation or as a substitute for
GasLog’s financial results presented in accordance with IFRS. For definitions and reconciliations of these measurements to the most directly comparable financial
measures calculated and presented in accordance with IFRS, please refer to Exhibit II at the end of this press release.
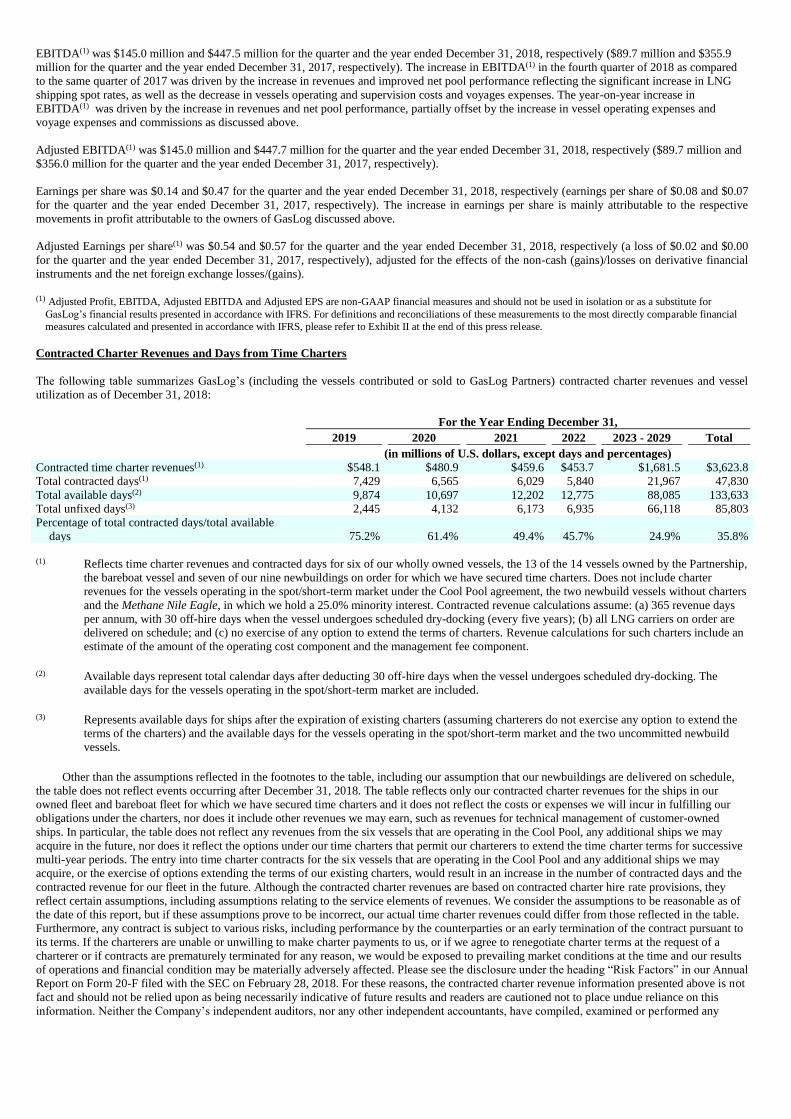
Contracted Charter Revenues and Days from Time Charters
The following table summarizes GasLog’s (including the vessels contributed or sold to GasLog Partners) contracted charter revenues and vessel
utilization as of December 31, 2018:
For the Year Ending December 31,
2019 2020 2021 2022 2023 - 2029 Total
(in millions of U.S. dollars, except days and percentages)
Contracted time charter revenues(1) $548.1 $480.9 $459.6 $453.7 $1,681.5 $3,623.8
Total contracted days(1) 7,429 6,565 6,029 5,840 21,967 47,830
Total available days(2) 9,874 10,697 12,202 12,775 88,085 133,633
Total unfixed days(3) 2,445 4,132 6,173 6,935 66,118 85,803
Percentage of total contracted days/total available
days 75.2% 61.4% 49.4% 45.7% 24.9% 35.8%
(1) Reflects time charter revenues and contracted days for six of our wholly owned vessels, the 13 of the 14 vessels owned by the Partnership,
the bareboat vessel and seven of our nine newbuildings on order for which we have secured time charters. Does not include charter
revenues for the vessels operating in the spot/short-term market under the Cool Pool agreement, the two newbuild vessels without charters
and the Methane Nile Eagle, in which we hold a 25.0% minority interest. Contracted revenue calculations assume: (a) 365 revenue days
per annum, with 30 off-hire days when the vessel undergoes scheduled dry-docking (every five years); (b) all LNG carriers on order are
delivered on schedule; and (c) no exercise of any option to extend the terms of charters. Revenue calculations for such charters include an
estimate of the amount of the operating cost component and the management fee component.
(2) Available days represent total calendar days after deducting 30 off-hire days when the vessel undergoes scheduled dry-docking. The
available days for the vessels operating in the spot/short-term market are included.
(3) Represents available days for ships after the expiration of existing charters (assuming charterers do not exercise any option to extend the
terms of the charters) and the available days for the vessels operating in the spot/short-term market and the two uncommitted newbuild
vessels.
Other than the assumptions reflected in the footnotes to the table, including our assumption that our newbuildings are delivered on schedule,
the table does not reflect events occurring after December 31, 2018. The table reflects only our contracted charter revenues for the ships in our
owned fleet and bareboat fleet for which we have secured time charters and it does not reflect the costs or expenses we will incur in fulfilling our
obligations under the charters, nor does it include other revenues we may earn, such as revenues for technical management of customer-owned
ships. In particular, the table does not reflect any revenues from the six vessels that are operating in the Cool Pool, any additional ships we may
acquire in the future, nor does it reflect the options under our time charters that permit our charterers to extend the time charter terms for successive
multi-year periods. The entry into time charter contracts for the six vessels that are operating in the Cool Pool and any additional ships we may
acquire, or the exercise of options extending the terms of our existing charters, would result in an increase in the number of contracted days and the
contracted revenue for our fleet in the future. Although the contracted charter revenues are based on contracted charter hire rate provisions, they
reflect certain assumptions, including assumptions relating to the service elements of revenues. We consider the assumptions to be reasonable as of
the date of this report, but if these assumptions prove to be incorrect, our actual time charter revenues could differ from those reflected in the table.
Furthermore, any contract is subject to various risks, including performance by the counterparties or an early termination of the contract pursuant to
its terms. If the charterers are unable or unwilling to make charter payments to us, or if we agree to renegotiate charter terms at the request of a
charterer or if contracts are prematurely terminated for any reason, we would be exposed to prevailing market conditions at the time and our results
of operations and financial condition may be materially adversely affected. Please see the disclosure under the heading “Risk Factors” in our Annual
Report on Form 20-F filed with the SEC on February 28, 2018. For these reasons, the contracted charter revenue information presented above is not
fact and should not be relied upon as being necessarily indicative of future results and readers are cautioned not to place undue reliance on this
information. Neither the Company’s independent auditors, nor any other independent accountants, have compiled, examined or performed any
procedures with respect to the information presented in the table, nor have they expressed any opinion or any other form of assurance on such
information or its achievability and assume no responsibility for, and disclaim any association with, the information in the table.
Liquidity and Capital Resources
As of December 31, 2018, GasLog had $342.6 million of cash and cash equivalents, of which $121.9 million was held in time deposits and the
remaining balance in current accounts. Moreover, as of December 31, 2018, GasLog had $25.0 million held in time deposits with an initial duration
of more than three months but less than a year that have been classified as short-term investments.
As of December 31, 2018, GasLog had an aggregate of $2.8 billion of indebtedness outstanding under its credit facilities and bond agreements, of
which $520.6 million was repayable within one year, and a $206.1 million finance lease liability related to the sale and leaseback of the Methane
Julia Louise, of which $6.7 million was repayable within one year.
As of December 31, 2018, there was undrawn available capacity of $100.0 million under the revolving credit facility of the credit agreement of up
to $1.1 billion entered into on July 19, 2016 (the “Legacy Facility Refinancing”).
As of December 31, 2018, the total remaining balance of the contract prices of the nine LNG carriers on order was $1.6 billion which GasLog
expects to be funded with the $165.8 million undrawn capacity under the financing agreement entered into on October 16, 2015, as well as cash
balances, cash from operations, borrowings under new debt agreements and proceeds from the issuance of new equity, if any.
As of December 31, 2018, GasLog’s current assets totaled $438.9 million, while current liabilities totaled $669.4 million, resulting in a negative
working capital position of $230.5 million. Current liabilities include $360.0 million from the outstanding indebtedness of GAS-three Ltd., GAS-
four Ltd., GAS-five Ltd., GAS-sixteen Ltd. and GAS-seventeen Ltd., due in November 2019. GasLog Partners is currently in active discussions
with a number of banks for this refinancing, which are expected to be completed during the first half of 2019.
As of December 31, 2018, GasLog maintains a total interest rate swap notional amount at $1.2 billion. GasLog has hedged 47.9% of its expected
floating interest rate exposure on its outstanding debt (excluding the finance lease liability) as of December 31, 2018.
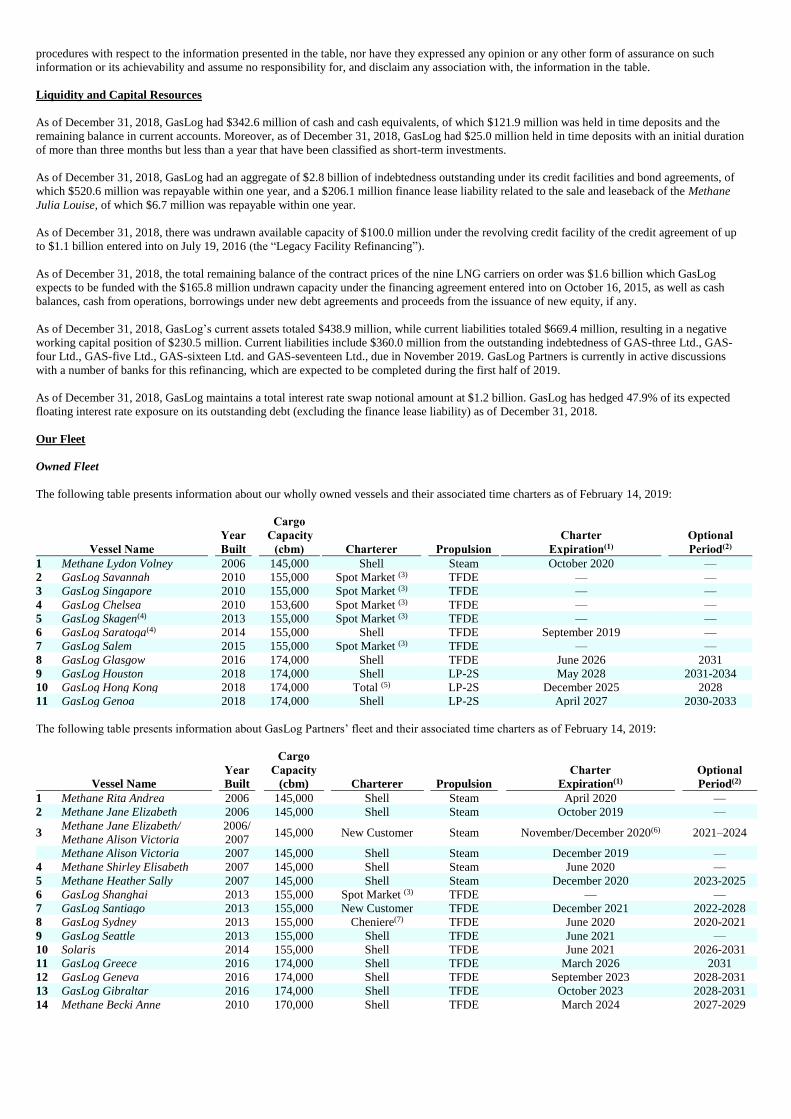
Our Fleet
Owned Fleet
The following table presents information about our wholly owned vessels and their associated time charters as of February 14, 2019:
Cargo
Year Capacity Charter Optional
Vessel Name Built (cbm) Charterer Propulsion Expiration(1) Period(2)
1 Methane Lydon Volney 2006 145,000 Shell Steam October 2020 —
2 GasLog Savannah 2010 155,000 Spot Market (3) TFDE — —
3 GasLog Singapore 2010 155,000 Spot Market (3) TFDE — —
4 GasLog Chelsea 2010 153,600 Spot Market (3) TFDE — —
5 GasLog Skagen(4) 2013 155,000 Spot Market (3) TFDE — —
6 GasLog Saratoga(4) 2014 155,000 Shell TFDE September 2019 —
7 GasLog Salem 2015 155,000 Spot Market (3) TFDE — —
8 GasLog Glasgow 2016 174,000 Shell TFDE June 2026 2031
9 GasLog Houston 2018 174,000 Shell LP-2S May 2028 2031-2034
10 GasLog Hong Kong 2018 174,000 Total (5) LP-2S December 2025 2028
11 GasLog Genoa 2018 174,000 Shell LP-2S April 2027 2030-2033
The following table presents information about GasLog Partners’ fleet and their associated time charters as of February 14, 2019:
Cargo
Year Capacity Charter Optional
Vessel Name Built (cbm) Charterer Propulsion Expiration(1) Period(2)
1 Methane Rita Andrea 2006 145,000 Shell Steam April 2020 —
2 Methane Jane Elizabeth 2006 145,000 Shell Steam October 2019 —
3 Methane Jane Elizabeth/
Methane Alison Victoria
2006/
2007 145,000 New Customer Steam November/December 2020(6) 2021–2024
Methane Alison Victoria 2007 145,000 Shell Steam December 2019 —
4 Methane Shirley Elisabeth 2007 145,000 Shell Steam June 2020 —
5 Methane Heather Sally 2007 145,000 Shell Steam December 2020 2023-2025
6 GasLog Shanghai 2013 155,000 Spot Market (3) TFDE — —
7 GasLog Santiago 2013 155,000 New Customer TFDE December 2021 2022-2028
8 GasLog Sydney 2013 155,000 Cheniere(7) TFDE June 2020 2020-2021
9 GasLog Seattle 2013 155,000 Shell TFDE June 2021 —
10 Solaris 2014 155,000 Shell TFDE June 2021 2026-2031
11 GasLog Greece 2016 174,000 Shell TFDE March 2026 2031
12 GasLog Geneva 2016 174,000 Shell TFDE September 2023 2028-2031
13 GasLog Gibraltar 2016 174,000 Shell TFDE October 2023 2028-2031
14 Methane Becki Anne 2010 170,000 Shell TFDE March 2024 2027-2029

Bareboat Vessel
Cargo
Year Capacity Charter Optional
Vessel Name Built (cbm) Charterer Propulsion Expiration(1) Period(2)
1 Methane Julia Louise (8) 2010 170,000 Shell TFDE March 2026 2029-2031
(1) Indicates the expiration of the initial term. (2) The period shown reflects the expiration of the minimum optional period and the maximum optional period. The charterer of the GasLog Santiago may extend the
term of this time charter for a period ranging from one to seven years, provided that the charterer provides us with advance notice of declaration. The charterer of the GasLog Sydney may extend the term of this time charter for a period ranging from six to twelve months, provided that the charterer provides us with advance
notice of declaration. The charterer of the Solaris has a unilateral option to extend the term of the time charter for a period ranging from five to ten years, provided
that the charterer provides us with advance notice of declaration of any option in accordance with the terms of the charter. The charterer of the Methane Heather Sally, the Methane Becki Anne and the Methane Julia Louise has unilateral options to extend the term of the related time charters for a period of either three or five
years at their election, provided that the charterer provides us with advance notice of declaration of any option in accordance with the terms of the applicable
charter. The charterer of the GasLog Greece and the GasLog Glasgow has the right to extend the charters for a period of five years at the charterer’s option. The charterer of the GasLog Geneva and the GasLog Gibraltar has the right to extend the charter by two additional periods of five and three years, respectively,
provided that the charterer provides us with advance notice of declaration. The charterer of the GasLog Houston and the GasLog Genoa has the right to extend the charters by two additional periods of three years, provided that the charterer provides us with advance notice of declaration. The charterer of the GasLog Hong
Kong has the right to extend the charter for a period of three years, provided that the charterer provides us with advance notice of declaration. (3) Vessels currently operating in the spot market under the Cool Pool. (4) Shell and GasLog have agreed to substitute the GasLog Saratoga for the GasLog Skagen. The substitution took effect subsequent to the end of the GasLog
Skagen’s dry-docking in September 2018. (5) “Total” refers to Total Gas & Power Chartering Limited, a wholly owned subsidiary of Total S.A. (6) On March 22, 2018, a new charter party agreement was signed with a new customer for either the Methane Jane Elizabeth or the Methane Alison Victoria (as
nominated by the Partnership) commencing in either November or December 2019, at the Partnership’s option, until November or December 2020, with the
charterer having the option to extend the charter from one to four years. (7) The vessel began her 18-month charter with Cheniere in December 2018. (8) On February 24, 2016, GasLog’s subsidiary, GAS-twenty six Ltd., completed the sale and leaseback of the Methane Julia Louise with Lepta Shipping Co., Ltd.
(“Lepta Shipping”). Lepta Shipping has the right to on-sell and lease back the vessel. The vessel was sold to Lepta Shipping for a total consideration approximately equivalent to its current book value. GasLog has leased back the vessel under a bareboat charter from Lepta Shipping for a period of up to 20 years. GasLog has the
option to re-purchase the vessel on pre-agreed terms no earlier than the end of year ten and no later than the end of year 17 of the bareboat charter. The vessel
remains on its eleven-year-charter with Methane Services Limited, a subsidiary of Shell.
Future Deliveries
GasLog has nine newbuildings on order at Samsung which are on schedule and within budget:
LNG Carrier Year Built(1)
Shipyard
Cargo
Capacity
(cbm) Charterer
Propulsion
Estimated Charter
Expiration(2)
Hull No. 2131 Q1 2019 Samsung 174,000 Shell LP-2S 2029
Hull No. 2212 Q3 2019 Samsung 180,000 — LP-2S —
Hull No. 2213 Q2 2020 Samsung 180,000 Centrica LP-2S 2027
Hull No. 2274 Q2 2020 Samsung 180,000 — LP-2S —
Hull No. 2262 Q3 2020 Samsung 180,000 Centrica LP-2S 2027
Hull No. 2300 Q4 2020 Samsung 174,000 Cheniere LP-2S 2027
Hull No. 2301 Q4 2020 Samsung 174,000 Cheniere LP-2S 2027
Hull No. 2311 Q2 2021 Samsung 180,000 Cheniere LP-2S 2028
Hull No. 2312 Q3 2021 Samsung 180,000 Cheniere LP-2S 2028
____________ (1) Expected delivery quarters are presented.
(2) Charter expiration to be determined based upon actual date of delivery.
Conference Call
GasLog will host a conference call to discuss its results for the fourth quarter of 2018 at 8:30 a.m. EDT (1:30 p.m. GMT) on Thursday, February 14,
2019. Paul Wogan, Chief Executive Officer, and Alastair Maxwell, Chief Financial Officer, will review the Company’s operational and financial
performance for the period. Management's presentation will be followed by a Q&A session.
The dial-in numbers for the conference call are as follows:
+1 855 253 8928 (USA)
+44 20 3107 0289 (United Kingdom)
+33 1 70 80 71 53 (France)
+852 3011 4522 (Hong Kong)
Conference ID: 6870419

A live webcast of the conference call will also be available on the Investor Relations page of the Company's website at
http://www.gaslogltd.com/investor-relations.
For those unable to participate in the conference call, a replay of the webcast will be available on the Investor Relations page of the Company’s
website at http://www.gaslogltd.com/investor-relations.
About GasLog
GasLog is an international owner, operator and manager of LNG carriers providing support to international energy companies as part of their LNG
logistics chain. GasLog’s consolidated owned fleet consists of 34 LNG carriers (25 ships on the water and nine on order). GasLog also has an
additional LNG carrier which was sold to a subsidiary of Mitsui & Co. Ltd. and leased back under a long-term bareboat charter. GasLog’s
consolidated fleet currently includes 14 LNG carriers in operation owned by GasLog Partners. GasLog’s principal executive offices are at Gildo
Pastor Center, 7 Rue du Gabian, MC 98000, Monaco. Visit GasLog’s website at http://www.gaslogltd.com.
Forward-Looking Statements
All statements in this press release that are not statements of historical fact are “forward-looking statements” within the meaning of the U.S. Private
Securities Litigation Reform Act of 1995. Forward-looking statements include statements that address activities, events or developments that the
Company expects, projects, believes or anticipates will or may occur in the future, particularly in relation to our operations, cash flows, financial
position, liquidity and cash available for dividends or distributions, plans, strategies, business prospects and changes and trends in our business and
the markets in which we operate. We caution that these forward-looking statements represent our estimates and assumptions only as of the date of
this press release, about factors that are beyond our ability to control or predict, and are not intended to give any assurance as to future results. Any
of these factors or a combination of these factors could materially affect future results of operations and the ultimate accuracy of the forward-
looking statements. Accordingly, you should not unduly rely on any forward-looking statements.
Factors that might cause future results and outcomes to differ include, but are not limited to, the following:
• general LNG shipping market conditions and trends, including spot and multi-year charter rates, ship values, factors affecting supply and
demand of LNG and LNG shipping, technological advancements and opportunities for the profitable operations of LNG carriers;
• fluctuations in spot and long-term charter hire rates and vessel values;
• increased exposure to the spot market and fluctuations in spot charter rates;
• our ability to maximize the use of our vessels, including the re-deployment or disposition of vessels which are not under multi-year charters,
including the risk that certain of our vessels may no longer have the latest technology at such time which may impact the rate at which we
can charter such vessels;
• changes in our operating expenses, including crew wages, maintenance, dry-docking and insurance costs and bunker prices;
• number of off-hire days and dry-docking requirements including our ability to complete scheduled dry-dockings on time and within budget;
• planned capital expenditures and availability of capital resources to fund capital expenditures;
• our ability to maintain long term relationships and enter into time charters with new and existing customers;
• fluctuations in prices for crude oil, petroleum products and natural gas, including LNG;
• changes in the ownership of our charterers;
• our customers’ performance of their obligations under our time charters and other contracts;
• our future operating performance and expenses, financial condition, liquidity and cash available for dividends and distributions;
• our ability to obtain financing to fund capital expenditures, acquisitions and other corporate activities, funding by banks of their financial
commitments, and our ability to meet our restrictive covenants and other obligations under our credit facilities;
• future, pending or recent acquisitions of or orders for ships or other assets, business strategy, areas of possible expansion and expected
capital spending;
• the time that it may take to construct and deliver newbuildings and the useful lives of our ships;
• fluctuations in currencies and interest rates;
• the expected cost of and our ability to comply with environmental and regulatory conditions, including changes in laws and regulations or
actions taken by regulatory authorities, governmental organizations, classification societies and standards imposed by our charterers
applicable to our business;
• risks inherent in ship operation, including the discharge of pollutants;
• our ability to retain key employees and the availability of skilled labour, ship crews and management;
• potential disruption of shipping routes due to accidents, political events, piracy or acts by terrorists;
• potential liability from future litigation;
• any malfunction or disruption of information technology systems and networks that our operations rely on or any impact of a possible
cybersecurity breach; and
• other risks and uncertainties described in the Company’s Annual Report on Form 20-F filed with the SEC on February 28, 2018 and
available at http://www.sec.gov.
We undertake no obligation to update or revise any forward-looking statements contained in this press release, whether as a result of new
information, future events, a change in our views or expectations or otherwise, except as required by applicable law. New factors emerge from time
to time, and it is not possible for us to predict all of these factors. Further, we cannot assess the impact of each such factor on our business or the
extent to which any factor, or combination of factors, may cause actual results to be materially different from those contained in any forward-
looking statement.

The declaration and payment of dividends are at all times subject to the discretion of our board of directors and will depend on, amongst other
things, risks and uncertainties described above, restrictions in our credit facilities, the provisions of Bermuda law and such other factors as our board
of directors may deem relevant.
Contacts:
Alastair Maxwell
Chief Financial Officer
Phone: +44-203-388-3100
Phil Corbett
Head of Investor Relations
Phone: +44-203-388-3116
Joseph Nelson
Deputy Head of Investor Relations
Phone: +1-212-223-0643
Email: [email protected]
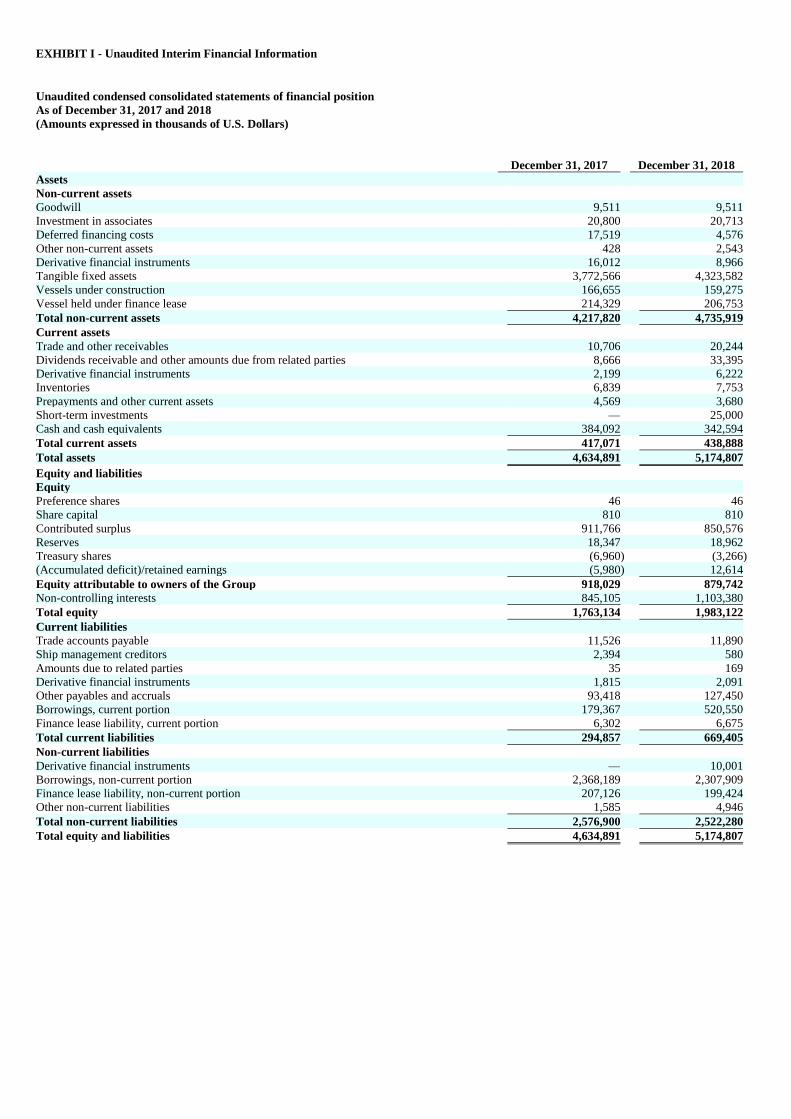
EXHIBIT I - Unaudited Interim Financial Information
Unaudited condensed consolidated statements of financial position
As of December 31, 2017 and 2018
(Amounts expressed in thousands of U.S. Dollars)
December 31, 2017 December 31, 2018
Assets
Non-current assets
Goodwill 9,511 9,511
Investment in associates 20,800 20,713
Deferred financing costs 17,519 4,576
Other non-current assets 428 2,543
Derivative financial instruments 16,012 8,966
Tangible fixed assets 3,772,566 4,323,582
Vessels under construction 166,655 159,275
Vessel held under finance lease 214,329 206,753
Total non-current assets 4,217,820 4,735,919
Current assets
Trade and other receivables 10,706 20,244
Dividends receivable and other amounts due from related parties 8,666 33,395
Derivative financial instruments 2,199 6,222
Inventories 6,839 7,753
Prepayments and other current assets 4,569 3,680
Short-term investments — 25,000
Cash and cash equivalents 384,092 342,594
Total current assets 417,071 438,888
Total assets 4,634,891 5,174,807
Equity and liabilities
Equity
Preference shares 46 46
Share capital 810 810
Contributed surplus 911,766 850,576
Reserves 18,347 18,962
Treasury shares (6,960 ) (3,266 )
(Accumulated deficit)/retained earnings (5,980 ) 12,614
Equity attributable to owners of the Group 918,029 879,742
Non-controlling interests 845,105 1,103,380
Total equity 1,763,134 1,983,122
Current liabilities
Trade accounts payable 11,526 11,890
Ship management creditors 2,394 580
Amounts due to related parties 35 169
Derivative financial instruments 1,815 2,091
Other payables and accruals 93,418 127,450
Borrowings, current portion 179,367 520,550
Finance lease liability, current portion 6,302 6,675
Total current liabilities 294,857 669,405
Non-current liabilities
Derivative financial instruments — 10,001
Borrowings, non-current portion 2,368,189 2,307,909
Finance lease liability, non-current portion 207,126 199,424
Other non-current liabilities 1,585 4,946
Total non-current liabilities 2,576,900 2,522,280
Total equity and liabilities 4,634,891 5,174,807
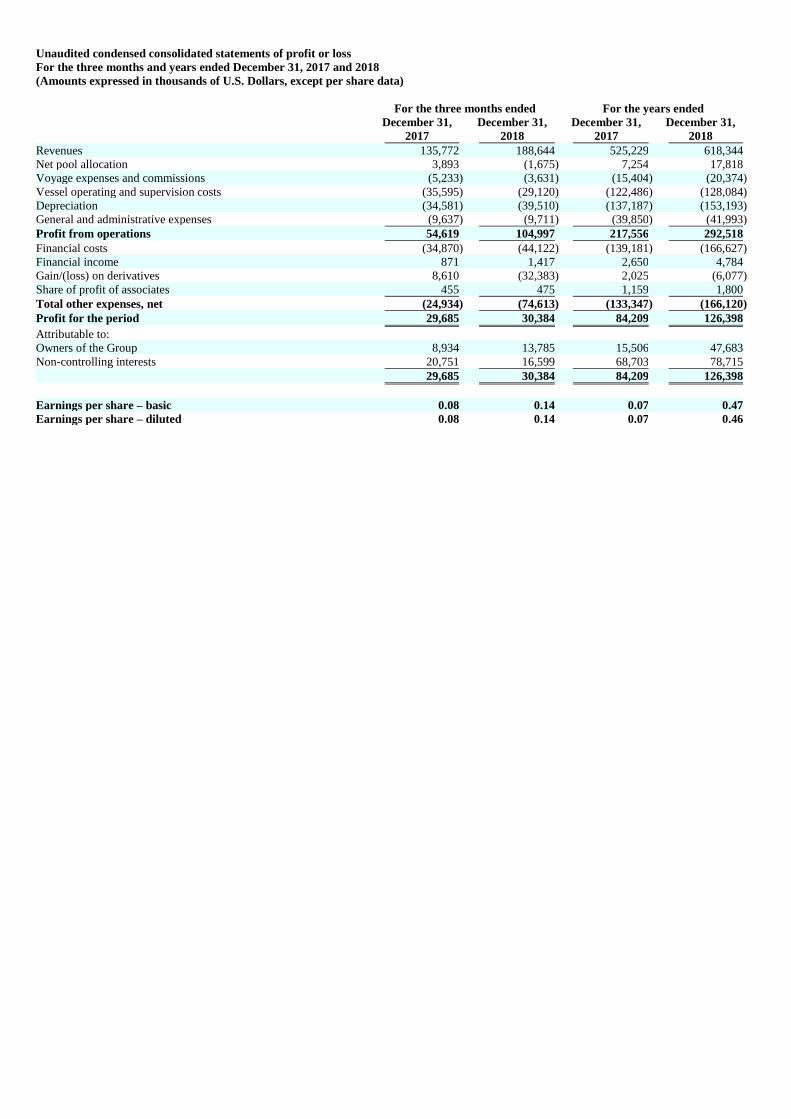
Unaudited condensed consolidated statements of profit or loss
For the three months and years ended December 31, 2017 and 2018
(Amounts expressed in thousands of U.S. Dollars, except per share data)
For the three months ended For the years ended
December 31,
2017
December 31,
2018
December 31,
2017
December 31,
2018
Revenues 135,772 188,644 525,229 618,344
Net pool allocation 3,893 (1,675 ) 7,254 17,818
Voyage expenses and commissions (5,233 ) (3,631 ) (15,404 ) (20,374 )
Vessel operating and supervision costs (35,595 ) (29,120 ) (122,486 ) (128,084 )
Depreciation (34,581 ) (39,510 ) (137,187 ) (153,193 )
General and administrative expenses (9,637 ) (9,711 ) (39,850 ) (41,993 )
Profit from operations 54,619 104,997 217,556 292,518
Financial costs (34,870 ) (44,122 ) (139,181 ) (166,627 )
Financial income 871 1,417 2,650 4,784
Gain/(loss) on derivatives 8,610 (32,383 ) 2,025 (6,077 )
Share of profit of associates 455 475 1,159 1,800
Total other expenses, net (24,934 ) (74,613 ) (133,347 ) (166,120 )
Profit for the period 29,685 30,384 84,209 126,398
Attributable to:
Owners of the Group 8,934 13,785 15,506 47,683
Non-controlling interests 20,751 16,599 68,703 78,715
29,685 30,384 84,209 126,398
Earnings per share – basic 0.08 0.14 0.07 0.47
Earnings per share – diluted 0.08 0.14 0.07 0.46

Unaudited condensed consolidated statements of cash flows
For the years ended December 31, 2017 and 2018
(Amounts expressed in thousands of U.S. Dollars)
For the years ended
December 31, 2017 December 31, 2018
Cash flows from operating activities:
Profit for the year 84,209 126,398
Adjustments for:
Depreciation 137,187 153,193
Share of profit of associates (1,159 ) (1,800 )
Financial income (2,650 ) (4,784 )
Financial costs 139,181 166,627
Unrealized foreign exchange (gain)/loss on cash and cash equivalents (772 ) 329
Unrealized (gain)/loss on derivative financial instruments held for trading, including ineffective
portion of cash flow hedges (10,505 ) 8,211
Recycled loss of cash flow hedges reclassified to profit or loss 4,368 —
Non-cash defined benefit obligations — (51 )
Share-based compensation 4,565 5,216
354,424 453,339
Movements in working capital (4,163 ) (27,708 )
Cash provided by operations 350,261 425,631
Interest paid (126,631 ) (141,921 )
Net cash provided by operating activities 223,630 283,710
Cash flows from investing activities:
Payments for tangible fixed assets, vessels under construction and vessel held under finance
lease (82,352 ) (673,823 )
Dividends received from associate 1,315 1,263
Return of contributed capital from associate 59 —
Other investments (14,125 ) (136 )
Purchase of short-term investments (37,244 ) (71,000 )
Maturity of short-term investments 55,244 46,000
Financial income received 2,504 4,697
Net cash used in investing activities (74,599 ) (692,999 )
Cash flows from financing activities:
Proceeds from bank loans and bonds 280,000 524,165
Bank loans and bonds repayments (397,008 ) (231,753 )
Payment of loan issuance costs (8,830 ) (7,449 )
Proceeds from GasLog Partners' public common unit offerings (net of underwriting discounts
and commissions) 141,395 60,345
Proceeds from GasLog Partners' preference unit offering (net of underwriting discounts and
commissions) 139,222 208,394
Payment of equity raising costs (2,032 ) (917 )
Payment for NOK bond repurchase at a premium (1,459 ) —
Payment for cross currency swaps’ termination (20,603 ) —
Purchase of treasury shares — (62 )
Proceeds from stock options’ exercise 1,223 754
Dividends paid (121,071 ) (178,028 )
Payments for finance lease liability (3,572 ) (7,329 )
Net cash provided by financing activities 7,265 368,120
Effects of exchange rate changes on cash and cash equivalents 772 (329 )
Increase/(decrease) in cash and cash equivalents 157,068 (41,498 )
Cash and cash equivalents, beginning of the year 227,024 384,092
Cash and cash equivalents, end of the year 384,092 342,594
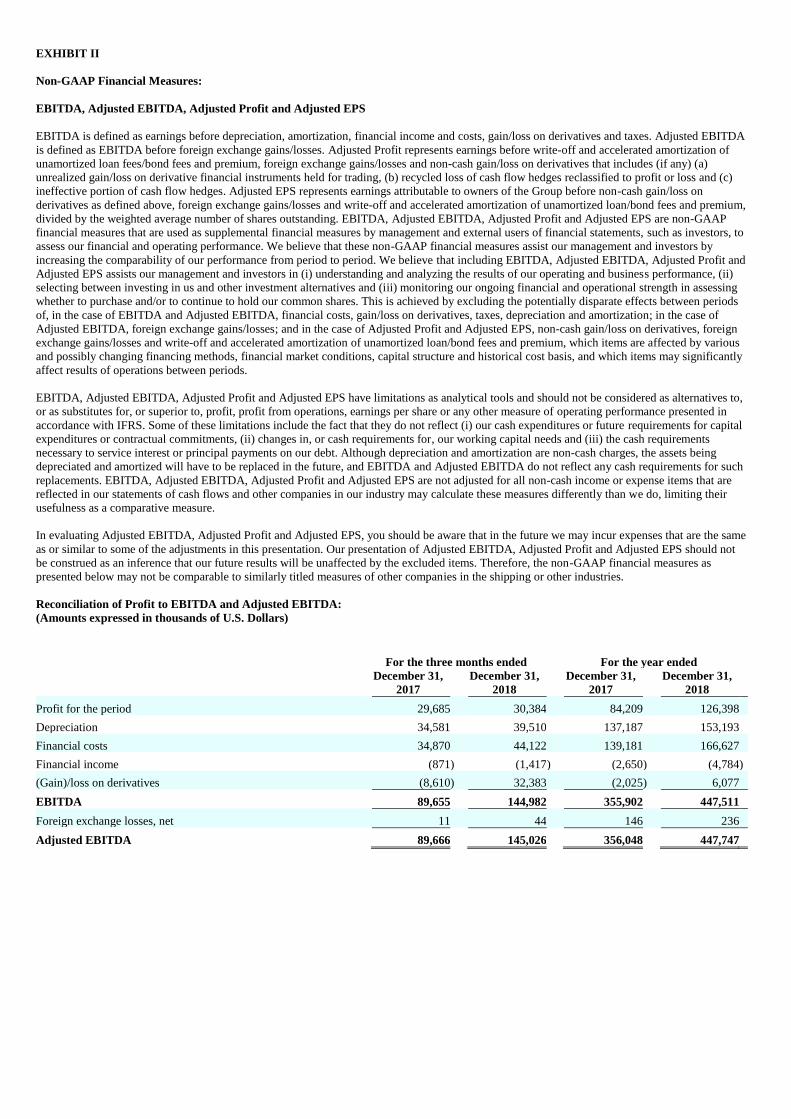
EXHIBIT II
Non-GAAP Financial Measures:
EBITDA, Adjusted EBITDA, Adjusted Profit and Adjusted EPS
EBITDA is defined as earnings before depreciation, amortization, financial income and costs, gain/loss on derivatives and taxes. Adjusted EBITDA
is defined as EBITDA before foreign exchange gains/losses. Adjusted Profit represents earnings before write-off and accelerated amortization of
unamortized loan fees/bond fees and premium, foreign exchange gains/losses and non-cash gain/loss on derivatives that includes (if any) (a)
unrealized gain/loss on derivative financial instruments held for trading, (b) recycled loss of cash flow hedges reclassified to profit or loss and (c)
ineffective portion of cash flow hedges. Adjusted EPS represents earnings attributable to owners of the Group before non-cash gain/loss on
derivatives as defined above, foreign exchange gains/losses and write-off and accelerated amortization of unamortized loan/bond fees and premium,
divided by the weighted average number of shares outstanding. EBITDA, Adjusted EBITDA, Adjusted Profit and Adjusted EPS are non-GAAP
financial measures that are used as supplemental financial measures by management and external users of financial statements, such as investors, to
assess our financial and operating performance. We believe that these non-GAAP financial measures assist our management and investors by
increasing the comparability of our performance from period to period. We believe that including EBITDA, Adjusted EBITDA, Adjusted Profit and
Adjusted EPS assists our management and investors in (i) understanding and analyzing the results of our operating and business performance, (ii)
selecting between investing in us and other investment alternatives and (iii) monitoring our ongoing financial and operational strength in assessing
whether to purchase and/or to continue to hold our common shares. This is achieved by excluding the potentially disparate effects between periods
of, in the case of EBITDA and Adjusted EBITDA, financial costs, gain/loss on derivatives, taxes, depreciation and amortization; in the case of
Adjusted EBITDA, foreign exchange gains/losses; and in the case of Adjusted Profit and Adjusted EPS, non-cash gain/loss on derivatives, foreign
exchange gains/losses and write-off and accelerated amortization of unamortized loan/bond fees and premium, which items are affected by various
and possibly changing financing methods, financial market conditions, capital structure and historical cost basis, and which items may significantly
affect results of operations between periods.
EBITDA, Adjusted EBITDA, Adjusted Profit and Adjusted EPS have limitations as analytical tools and should not be considered as alternatives to,
or as substitutes for, or superior to, profit, profit from operations, earnings per share or any other measure of operating performance presented in
accordance with IFRS. Some of these limitations include the fact that they do not reflect (i) our cash expenditures or future requirements for capital
expenditures or contractual commitments, (ii) changes in, or cash requirements for, our working capital needs and (iii) the cash requirements
necessary to service interest or principal payments on our debt. Although depreciation and amortization are non-cash charges, the assets being
depreciated and amortized will have to be replaced in the future, and EBITDA and Adjusted EBITDA do not reflect any cash requirements for such
replacements. EBITDA, Adjusted EBITDA, Adjusted Profit and Adjusted EPS are not adjusted for all non-cash income or expense items that are
reflected in our statements of cash flows and other companies in our industry may calculate these measures differently than we do, limiting their
usefulness as a comparative measure.
In evaluating Adjusted EBITDA, Adjusted Profit and Adjusted EPS, you should be aware that in the future we may incur expenses that are the same
as or similar to some of the adjustments in this presentation. Our presentation of Adjusted EBITDA, Adjusted Profit and Adjusted EPS should not
be construed as an inference that our future results will be unaffected by the excluded items. Therefore, the non-GAAP financial measures as
presented below may not be comparable to similarly titled measures of other companies in the shipping or other industries.
Reconciliation of Profit to EBITDA and Adjusted EBITDA:
(Amounts expressed in thousands of U.S. Dollars)
For the three months ended For the year ended
December 31,
2017
December 31,
2018
December 31,
2017
December 31,
2018
Profit for the period 29,685 30,384 84,209 126,398
Depreciation 34,581 39,510 137,187 153,193
Financial costs 34,870 44,122 139,181 166,627
Financial income (871 ) (1,417 ) (2,650 ) (4,784 )
(Gain)/loss on derivatives (8,610 ) 32,383 (2,025 ) 6,077
EBITDA 89,655 144,982 355,902 447,511
Foreign exchange losses, net 11 44 146 236
Adjusted EBITDA 89,666 145,026 356,048 447,747

Reconciliation of Profit to Adjusted Profit:
(Amounts expressed in thousands of U.S. Dollars)
For the three months ended For the year ended
December 31,
2017
December 31,
2018
December 31,
2017
December 31,
2018
Profit for the period 29,685 30,384 84,209 126,398
Non-cash (gain)/loss on derivatives (8,471 ) 32,089 (6,137 ) 8,211
Write-off of unamortized loan/bond fees and premium 213 — 506 —
Foreign exchange losses, net 11 44 146 236
Adjusted Profit 21,438 62,517 78,724 134,845
Reconciliation of Earnings/(Loss) Per Share to Adjusted (Loss)/Earnings Per Share:
(Amounts expressed in thousands of U.S. Dollars, except shares and per share data)
For the three months ended For the year ended
December 31,
2017
December 31,
2018
December 31,
2017
December 31,
2018
Profit for the period attributable to owners of the Group 8,934 13,785 15,506 47,683
Plus:
Dividend on preference shares (2,516 ) (2,516 ) (10,064 ) (10,063 )
Profit for the period available to owners of the Group used in EPS
calculation 6,418 11,269 5,442 37,620
Weighted average number of shares outstanding, basic 80,673,054 80,838,686 80,622,788 80,792,837
Earnings per share 0.08 0.14 0.07 0.47
Profit for the period available to owners of the Group used in EPS
calculation 6,418 11,269 5,442 37,620
Plus:
Non-cash (gain)/loss on derivatives (8,471 ) 32,089 (6,137 ) 8,211
Write-off of unamortized loan/bond fees and premium 213 — 506 —
Foreign exchange losses, net 11 44 146 236
Adjusted (loss)/profit attributable to owners of the Group (1,829 ) 43,402 (43 ) 46,067
Weighted average number of shares outstanding, basic 80,673,054 80,838,686 80,622,788 80,792,837
Adjusted (loss)/earnings per share (0.02 ) 0.54 (0.00 ) 0.57