Embed Size (px)
Citation preview
04HEALTH RISK ASSESSMENT GUIDANCE FOR METALS
HERAGGASTROINTESTINAL UPTAKE AND ABSORPTION, AND CATALOGUE OF TOXICOKINETIC MODELS
August 2007Check you have the most recent fact sheet by visiting www.metalsriskassessment.org
FACT SHEET
HERAG FACT SHEET Page 2 of 46 Gastrointestinal uptake and absorption & catalogue of toxicokinetic models
Table of contents 1. Introduction.......................................................................................................................................................... 3 2. Gastrointestinal uptake and absorption of metals and metal compounds............................................................ 4
2.1. Compilation of metal- or metal compound-specific data on oral bioavailability ............................................. 4 2.2. Conclusions on GI absorption factors in human health risk assessment of metals ...................................... 5
3. Toxicokinetic models for metals........................................................................................................................... 7 3.1. Catalogue of PBTK and PBDK models for metals ........................................................................................ 7 3.2. Conclusions for the use of toxicokinetic models in human health risk assessment of metals....................... 7
Appendix A 1: Review of existing information on GI uptake of metals................................................................................... 10
A 1.1: Oral absorption data on metals from previous EU risk assessments ...................................................... 10 A 1.1.1: Nickel .............................................................................................................................................10 A 1.1.2: Zinc ................................................................................................................................................11 A 1.1.3: Cadmium........................................................................................................................................11 A 1.1.4: Lead...............................................................................................................................................11 A 1.1.5: Copper ...........................................................................................................................................13
A 1.2: Oral absorption data on metals in peer-reviewed summary assessment reports .................................... 14 A 1.2.1: Arsenic ...........................................................................................................................................14 A 1.2.2: Barium............................................................................................................................................16 A 1.2.3: Beryllium ........................................................................................................................................16 A 1.2.4: Manganese ....................................................................................................................................16 A 1.2.5: Mercury ..........................................................................................................................................19 A 1.2.6: Selenium........................................................................................................................................20 A 1.2.7: Titanium .........................................................................................................................................21 A 1.2.8: Vanadium.......................................................................................................................................21
A 1.3: Oral absorption data on metals made available by metal industry associations...................................... 23 A 1.3.1: Cobalt.............................................................................................................................................23 A 1.3.2: Aluminium ......................................................................................................................................23 A 1.3.3: Iron.................................................................................................................................................24 A 1.3.4: Chromium ......................................................................................................................................24
A 2: Detailed description of metal-specific toxicokinetic and toxicodynamic models ............................................. 26 A 2.1: Lead ........................................................................................................................................................ 26
A 2.1.1: Introduction ....................................................................................................................................26 A 2.1.2: The O’Flaherty Model ....................................................................................................................26 A 2.1.3: The IEUBK Model ..........................................................................................................................27 A 2.1.4: All Ages Lead Model (AALM) .........................................................................................................28 A 2.1.5: The Leggett Model .........................................................................................................................29
A 2.2: Nickel ...................................................................................................................................................... 29 A 2.3: Cadmium................................................................................................................................................. 30
A 2.3.1: Introduction ....................................................................................................................................30 A 2.3.2: The Nordberg-Kjellström model .....................................................................................................30 A 2.3.3: The Shank Model...........................................................................................................................31 A 2.3.4: The Matsubara-Khan Model...........................................................................................................31
A 2.4: Aluminium ............................................................................................................................................... 31 A 2.4.1: The ICRP model for Aluminium......................................................................................................31 A 2.4.2: The model by Day et al. .................................................................................................................32 A 2.4.3: The Middlesex University biokinetic model ....................................................................................32 A 2.4.4: The model by Nolte et al. ...............................................................................................................33
A 2.5: Copper .................................................................................................................................................... 34 A 2.6: Tin ........................................................................................................................................................... 35
A 2.6.1: Introduction ....................................................................................................................................35 A 2.6.2: The ICRP model for Tin .................................................................................................................35
A 2.7: Zinc ......................................................................................................................................................... 35 A 3: Short summaries of metal-specific toxicokinetic and toxicodynamic models.................................................. 36
A 3.1: Arsenic .................................................................................................................................................... 36 A 3.2: Barium..................................................................................................................................................... 36 A 3.3: Beryllium ................................................................................................................................................. 36 A 3.4: Manganese ............................................................................................................................................. 36 A 3.5: Mercury ................................................................................................................................................... 37 A 3.6: Selenium ................................................................................................................................................. 40 A 3.7: Titanium .................................................................................................................................................. 41 A 3.8: Vanadium................................................................................................................................................ 41
Abbreviations and References A 4: Abbreviations and References ....................................................................................................................... 42
HERAG FACT SHEET Page 3 of 46 Gastrointestinal uptake and absorption & catalogue of toxicokinetic models
1. Introduction This fact sheet focuses on knowledge gained in previous metals risk assessments on gastrointestinal (GI) uptake and absorption. In addition, since ingestion as a major route of uptake for metals has been considered in several toxicokinetic models for metals, it has been attempted to summarise conclusions that may be drawn for future risk assessments. The issue of gastrointestinal (GI) uptake and absorption is considered to be particularly relevant within the context of human health risk assessment of metals and metal compounds for the following reasons:
1) The Technical Guidance Document (TGD1) in its current form states that ingestion exposure is
not considered further in the assessment of workplace exposure (largely because of a lack of suitable assessment methods). However, for most metals, the correct assessment of GI uptake is in fact highly relevant:
• Hand-to-mouth transfer has been established as a key source of lead intake, so that there is reason to assume that this may also be the case for other metals/compounds.
• Translocation of inhaled material to the GI tract is highly relevant for metals, depending on particle-size dependant deposition in the extrathoracic and tracheobronchial regions of the respiratory tract. Thus, overall systemic availability will depend largely on the GI uptake of this translocated material.
2) Non-linear kinetics usually govern the absorption of metals from the GI tract. Thus, for metals
it is relevant to distinguish between (i) usually low intakes of the general population via food, ambient air, drinking water, or consumer articles/products, and (ii) usually considerably higher intakes from occupational exposure.
In order to develop this issue further, metal- or metal compound-specific information on oral bioavailability was collected to derive general conclusions on GI uptake as well as information on modifying factors, such as speciation, particle size, solubility etc., as summarised in chapter 2. The second focus of this fact sheet lies on physiologically based toxicokinetic and toxicodynamic models, which are in most cases intrinsically linked to the aspect of GI uptake. Such models use mathematical descriptions of the uptake and distribution of chemical substances to quantitatively describe the relationships among critical biological processes. A catalogue of such toxicokinetic models for metals was collected from the industries participating in the HERAG project in order to extract any aspects of such models available for a particular metal that are perhaps of a more general nature and perhaps useful for other metals, and whether basic input parameters of any of these models could perhaps be used for future human health risk assessments for other metals. Therefore, summaries of such models and where available or feasible, the underlying principles together with advantages and disadvantages are discussed metal-by-metal in appendices to this fact sheet, and common aspects and parameters applicable to other metals are summarised in chapter 3.
1 TGD, Part I (HH), sub-chapter 2.2.2.3 states: (i) there are no accepted methods for quantifying exposure by ingestion, (ii) it is
usually controlled by straightforward good hygiene practices, and (iii) ingestion exposure is therefore not considered further in the assessment of workplace exposure.
HERAG FACT SHEET Page 4 of 46 Gastrointestinal uptake and absorption & catalogue of toxicokinetic models
2. Gastrointestinal uptake and absorption of metals and metal compounds Uptake from the gastrointestinal tract varies widely between metals. In some cases, metal specific uptake pathways exist (e.g., for essential elements such as Zinc and Copper) with potentially high uptake rates, which can vary as a function of homeostatic control mechanisms. Thus, under conditions of excess intake, down-modulation of uptake mechanisms can occur and uptake will be reduced. Further, since such essential metals can share uptake pathways and mechanisms, interactions between essential metals can occur (examples: copper and zinc, copper and iron). Since the uptake of non-essential metals can, at least in part, be mediated by mechanisms for essential metals, nutritional status can also affect the uptake of these metals as well (for example, cadmium and cobalt uptake may be enhanced in situations of iron deficiency). In other cases, uptake rates may be low for lack of any physiological function of a particular metal (such as Antimony, for example). Finally, there are also cases where a particular metal “utilises” a transport mechanism that is intended for another metal (such as lead, which partly enters the body through Calcium transport mechanisms). Absorption can be modified by the chemical speciation of the ingested compound, if dissolution of such compounds in the gastrointestinal tract is limited. For some metals, this renders poorly soluble forms less bioavailable (example: zinc), whereas for others this property alone may have little impact (example: lead). Finally, matrix effects may also occur, such as when metals are ingested while incorporated into a certain form (e.g. encapsulated in soil particles) that limits dissolution. As a background document, a summary of data available on gastrointestinal absorption factors for metals is presented in the appendix to this fact sheet. In this chapter, the focus is on general aspects influencing such uptake factors, and general conclusions for risk assessment as summarised from the discussions within the HERAG project group.
2.1. Compilation of metal- or metal compound-specific data on oral bioavailability As a background document, a collection of information available on gastro-intestinal uptake of metals is presented in appendix A1. It was the objective of this fact sheet to summarise experience from previous and current risk assessments. In addition, for comparative purposes, extracts from other sources are given. As a consequence, the nature of this background document is heterogeneous, and this information has therefore been structured in the following way: (A 1.1) At first, those metals that have either undergone a full risk assessment under the ESR regulation, or have been the subject of a Voluntary Risk Assessment were considered, since the conclusions on this topic may be considered to represent the results of extensive discussion and revision at EU Member State and at TCNES level. In this section, the focus is not only on the oral absorption data itself, but also on the way it was dealt with throughout the human health risk assessment in the existing RARs. (A 1.2) Data on other key metals which were extracted from other summary assessment reports (WHO etc.) are given here for comparative purposes. Considering that these have undergone a different peer-review process, they are treated separately. (A 1.3) Data on other metals is presented as provided by their metal industry associations participating in the HERAG project. It should be recognised that this data has not been subject to a similar form of review as in the above two cases. It is noted that during the SRP review process it was suggested to include a tabular summary of the collected oral availability data especially for "data poor” substances. However, considering the extent and heterogeneity of the data, this was not considered a practical option.
HERAG FACT SHEET Page 5 of 46 Gastrointestinal uptake and absorption & catalogue of toxicokinetic models
2.2. Conclusions on GI absorption factors in human health risk assessment of metals From the experience of various metals risk assessments, the following general conclusions can be drawn that have a direct impact on human health risk assessment: • Where available, oral absorption data generated in humans should be considered first; animal data
can however be useful to supplement information on relative bioavailability for different chemical species and saturation mechanisms (see below).
• For most metals, the exact transport mechanisms are not known. However, for various metals a
“saturation” of uptake is seen at intakes relevant for human health risk assessment, which may justify differentiating between low absorption under situations of “excess” (i.e. occupational) exposure, in contrast to comparatively higher absorption rates under “normal” dietary intakes for the purpose of risk characterisation. This “non-linearity” has been well studied for lead compounds, and also for copper.
• Where possible, a differentiation should be made between apparent and true absorption: the
highest relevance should be attributed to data where the uptake and excretion mechanisms are well-known and have yielded values for true absorption (example: VRA Copper). Apparent absorption is merely measured as the difference between oral intake and faecal excretion, and as such does not distinguish between the unabsorbed substance and a possible fraction that is absorbed and then returned to the gut via quick biliary excretion and intestinal cells sloughing off. The apparent absorption might therefore be an underestimate of the true absorption. It is recommended to consider this aspect in the design of new studies.
Occupational exposure: • For the majority of workplaces in the metals industry, gastrointestinal uptake is the most relevant
route of exposure at the workplace. This is concluded from the observation that dermal absorption has been shown to be minimal for a large number of metals, and that in most occupational settings, the particle size distribution of aerosols will cause the bulk of the inhaled material to be deposited in the upper respiratory tract, with rapid subsequent translocation to the GI tract.
• For this reason, the exact assessment of gastrointestinal absorption factors is pivotal for correct
health risk assessment. The assessment of the fraction of inhaled material that is translocated to the GI tract is discussed in the separate HERAG fact sheet on inhalation.
• Ingestion of metals in the workplace can be a relevant route of uptake: despite that personal
hygiene and training can influence uptake by hand-to-mouth transfer, inadvertent facial and peri-oral exposure by deposition may lead to additional and variable ingestion. However, scientific procedures for the quantitative assessment of this route to overall oral exposure do not yet exist. Nevertheless, this issue is noted here for further consideration.
• The gastro-intestinal environment may modify the toxicity of a substance: some metals such as
arsenic and mercury are already metabolised in the GI tract. However, this is difficult to address as a general metal aspect and needs to be considered on a case-by-case basis.
Indirect exposure: • A common finding is that systemic absorption of a metal from the GI tract is lower when taken in
with food or water than when taken in by a fasted subject. It may therefore be questioned whether the use of uptake factors derived under the latter circumstances are appropriate to assess absorption of the general population or at the workplace.
• More specifically, individual matrix components of food themselves have been well established to
impair absorption, for example in areas with zinc deficient populations.
HERAG FACT SHEET Page 6 of 46 Gastrointestinal uptake and absorption & catalogue of toxicokinetic models
• Soil ingestion is an important uptake route, especially for children: for the uptake of metals from contaminated soils, the total metal content in soils is not essentially fully bioavailable metal, in view of the binding to the soil matrix. In-vitro bioaccessibility testing is available to allow for a refinement of an assessment, should this be required.
• For the assessment of uptake from soil, toxicokinetic models (e.g. IEUBK) have been developed for
lead; cross-reference to chapter 3 below is recommended for the use of default values. Extrapolation between different metal compounds: Whereas absorption factors may have been investigated for a particular metal compound, the question arises whether and under which circumstances such a value may be extrapolated to assess other compounds of this metal. For this, the following approaches can be summarised that have been used in previous risk assessments: • Concerning the differentiation between soluble vs. poorly soluble or insoluble forms and chemical
speciation, water solubility is often used as a surrogate for bioavailability. As examples, in the assessment of nickel and zinc, it has been experimentally verified (in vivo) that large variations exist between soluble salts of a metal, and the metal itself, or the oxides or other very poorly soluble substances. This principle has also been established for cobalt, based on in-vitro data.
• However, as a warning, it has also been shown that this concept is not applicable to all metals: for
example, the VRA lead has shown that these differences in solubility do not necessarily impact bioavailability under physiological circumstances. In consequence, extrapolation based on solubility alone can not be assumed a priori, but should be demonstrated to exist as a phenomenon for a particular metal in question, on a case-by-case basis. If in doubt, in-vitro “bioaccessibility
2” testing
may be performed for verification purposes (example: cobalt).
2 For further information on “bioaccessibility”, reference should be made to the separate HERAG fact sheet on read across.
HERAG FACT SHEET Page 7 of 46 Gastrointestinal uptake and absorption & catalogue of toxicokinetic models
3. Toxicokinetic models for metals This chapter summarises available knowledge on toxicokinetic models for metals with an emphasis on those used in previous and current risk assessments, and gives conclusions on common issues with relevance for future metal risk assessments. These models refine our understanding of complex quantitative dose behaviours by helping to delineate and characterise the relationships between (i) the external/exposure concentration and target tissue dose of the toxic moiety, and (ii) the target tissue dose and observed responses. These models are biologically and mechanistically based and can be used to extrapolate the toxicokinetic behaviour of chemical substances from high to low dose, from route to route, between species, and between subpopulations. The use of the otherwise frequently used terms pharmacokinetic/dynamic may be considered inappropriate in a context with metals and toxicity, which is why preference is given to the terms toxicokinetic/dynamic.
3.1. Catalogue of PBTK and PBDK models for metals A catalogue of PBTK
3 and PBDK
4 models for metals was collected from the industries participating in
the HERAG project with the aim to extract aspects from any of these models which are of a more general nature and perhaps useful for other metals in future human health risk assessments. The model summaries have been attached to this fact sheet in appendix A 2, to enhance the readability of this document. Their presentation varies in the level of detail largely for the following reasons:
- numerous and sophisticated models for gastrointestinal uptake have been developed for lead, which is why these are presented in detail;
- in contrast, for other metals (such as zinc), despite a wealth of toxicokinetic information, such models have not yet been developed.
Where available and relevant, a brief critique on their reliability and/or usefulness is also given.
3.2. Conclusions for the use of toxicokinetic models in human health risk assessment of metals After a detailed exchange of previous industry experience on the use of toxicokinetic models, it was not unexpectedly concluded within the HERAG project group that with very few exceptions, most models are intrinsically restricted to one specific metal. However, there are two exceptions: The ICRP models: • The International Commission on Radiological Protection (ICRP) has published biokinetic models
including inhalation and ingestion dose coefficients for a wide range of metals, a compilation of which can be found in ICRP (1996)
5.
• Examples of these models are given for Aluminium (section A 2.4.1) and Tin (section A 2.6.2).
Other metals have not reported use of these models in their risk assessments.
3 Physiologically based toxicokinetic (PBTK) models use mathematical descriptions of the uptake and distribution of chemical
substances to describe quantitatively the relationships among critical biological processes. 4 Physiologically based toxicodynamic (PBTD) models use mathematical descriptions of the dose-effect function to quantitatively
describe the relationship between target tissue dose and toxic endpoints 5 Age-dependant dose to members of the public from intake of radionuclides: Part 5, compilation of ingestion and inhalation
dose coefficients, ICRP publication 71, 1996.
HERAG FACT SHEET Page 8 of 46 Gastrointestinal uptake and absorption & catalogue of toxicokinetic models
• In this context it is relevant to note that as the basis for the above, the ICRP has of course also put
forward a comprehensive model for the prediction of particle-size dependant deposition behaviour of metals and their inorganic compounds (ICRP, 1994)
6 in the human respiratory tract.
• Extensive use of the latter has been made in the EU RAR on Zinc and Zinc compounds and in the
VRA on Lead for the derivation of inhalation absorption factors for a large number of inorganic compounds of these two metals. Reference to this is made in the separate HERAG fact sheet on inhalation (No. 2). The ICRP model was not considered in the EU RAR on Nickel and its compounds, and also not in the VRA on Copper and its compounds.
The IEUBK model (for a detailed description see Appendix 2.1.3): • Despite the fact that this model was originally developed for Lead uptake of children, the default
uptake rates of a metal from exposure via air, diet, dust, soil and water may be useful for other metals as well. As an example, young children may be exposed through ingestion of dust by hand to mouth contact, resulting in fact from a mixture of house dust and garden dust, and ingestion rates for children in the age range 0-7 years vary considerably.
• As such, the VRA on Lead has successfully used the defaults of this model in preference to those
of the current TGD, since the comparison of the use of these defaults with blood Lead value in children has shown better agreement between observed and predicted exposure levels. The comparison exercise suggests that further revision of default exposure assumptions (e.g. in the TGD) might still be needed.
• For any metals that are similar in metabolism to Calcium (i.e., “bone-seekers” such as Lead), the
possibility of employing the same set of models and the underlying assumptions with appropriate modifications should be considered.
• It is also noted that the VRA on Copper also used the IEUBK default soil ingestion rates in their
assessment of indirect exposure of children via the environment. Recommendations for further risk assessments: In the case of the IEUBK model, the discussion within HERAG lead to the conclusion that certain input parameters could be extracted, which would be useful also for other metals provided that due recognition is given to potential sources of site-specific variation: • For example, Bowers and Mattuck (2001) have suggested that IEUBK estimates of soil ingestion
may overestimate actual exposure in urban environments where little bare soil may in fact be present. The model further makes default assumptions regarding transfer of contaminants from external soil to internal household dust. While these transfer assumptions may be valid for a variety of the specific exposure scenarios in the United States that served to validate the model, they may not be applicable to other exposure environments. The use of measured site specific data is recommended to confirm or correct model assumptions regarding the transfer of contaminants between different exposure compartments.
• Especially for the exposure assessment of children, the IEUBK model provides a set of age-
dependant default parameters that is more detailed than the set of default parameters given by the current TGD. For this reason, the following table summarises these defaults, the use of which is recommended for subsequent metals risk assessments.
6 Human respiratory tract model for radiological protection, ICRP publication 66, Annals of the ICRP 24 (1-3), 1994
HERAG FACT SHEET Page 9 of 46 Gastrointestinal uptake and absorption & catalogue of toxicokinetic models
Table: default IEUBK input parameters useful in assessing exposure of children
Time spent outdoors hours / day
Age = 0-1 year (0-11 month) 1 1-2 years (12-23 month) 2
2-3 years (24-35 month) 3 3-7 years (36-83 month) 4
Ventilation rate (given in m³/day) m³ / day
Age = 0-1 year (0-11 month) 2
1-2 years (12-23 month) 3 2-3 years (24-35 month) 5
3-4 years (36-47 month) 5 4-5 years (48-59 month) 5 5-6 years (60-71 month) 7
6-7 years (72-84 month) 7
Drinking water ingestion rate liters / day
Age = 0-1 year (0-11 month) 0.20 1-2 years (12-23 month) 0.50
2-3 years (24-35 month) 0.52 3-4 years (36-47 month) 0.53
4-5 years (48-59 month) 0.55 5-6 years (60-71 month) 0.58 6-7 years (72-84 month) 0.59
Percentage of total water intake * %
first draw water 50 flushed water 100 minus first
draw and fountain
fountain water 15
Soil/dust ingestion g / day
Age = 0-1 year (0-11 month) 0.085 1-2 years (12-23 month) 0.135
2-3 years (24-35 month) 0.135 3-4 years (36-47 month) 0.135
4-5 years (48-59 month) 0.100 5-6 years (60-71 month) 0.090 6-7 years (72-84 month) 0.085 * Applicable for metals present in water pipe material. First draw water, i.e. water standing in the pipe over night, might exhibit higher concentrations due to release of the metal by the pipe.
3.3. Future research needs (hand-to-mouth transfer)
The discussions during peer review of this fact sheet noted that the following two areas needed future attention to refine exposure assessments in general:
- in some settings, hand-to-mouth transfer has been recognised as the perhaps most relevant route of entry into the body. However, to date no methods or models exist that allow a reasonably precise estimation of such exposure; this is further complicated because this kind of transfer is considered to be heavily influenced by personal habits and hygiene behaviour, and thus is subject to considerable inter-individual variation.
-on the other hand, particularly in the occupational setting, inadvertent exposure will occur additionally by facial deposition and subsequent transfer from the peri-oral region to the mouth. It would appear that a development of model approaches based on ambient air and deposition measurements should be possible.
HERAG FACT SHEET Page 10 of 46 Gastrointestinal uptake and absorption & catalogue of toxicokinetic models
Appendix A 1: Review of existing information on GI uptake of metals A 1.1: Oral absorption data on metals from previous EU risk assessments The data available from the five metals that have undergone either an EU or a voluntary risk assessment process (i.e, Ni, Zn, Cd, Pb and Cu) are summarised briefly below. For more details, and the original references please refer to the EU RAR documents. A 1.1.1: Nickel GI uptake rates for a soluble nickel compound (nickel sulphate) were derived from studies with human volunteers. A stable radioisotope was given in water or food and Nickel in blood and urine was measured. For other nickel substances, e.g. nickel chloride and nickel nitrate, studies were done in animals. Studies with human volunteers indicate that the oral absorption varies from 1-30% depending on the fasting state of the individual. Nickel ingested with food is absorbed to a lesser extent. Studies of absorption as a function of exposure level have not been done for Nickel. Linearity of uptake with intake level is assumed. In the EU RA documents the rapporteur used 30% absorption for fasting, and 5% for ingestion with food. These values were applied to all water soluble Nickel compounds: sulphate, chloride, and nitrate, but also to Nickel carbonate (soluble in acid). Neither human nor animal studies of oral Nickel absorption have taken nutritional status into account. For Nickel metal there is no data from human volunteers. A couple of studies in rats suggest that the oral absorption of Nickel metal powder is 100-fold lower than that of water soluble Nickel compounds. Therefore, the EU RA document states 0.3% as an oral absorption rate of Nickel from metallic Nickel for fasting individuals, and 0.05% for ingestion with food (Source: EU RARs on Nickel and Nickel compounds).
HERAG FACT SHEET Page 11 of 46 Gastrointestinal uptake and absorption & catalogue of toxicokinetic models
A 1.1.2: Zinc In the EU RAR on Zinc and Zinc compounds, the oral uptake of Zinc was recognised to vary as a function of chemical speciation: soluble Zinc compounds (Zinc chloride, Zinc sulphate) have been reported to have a gastrointestinal uptake rate of 40% based upon human uptake studies. In contrast, less soluble forms of Zinc (Zinc metal and Zinc oxide) were assigned lower default uptake rates of 20% (also based upon human observational studies). Observational data indicated that homeostatic controls would further reduce uptake (to less than 10%) under conditions of exposure excess. However, this reduction of uptake was not incorporated into the risk characterisation, perhaps due to the complexity of calculating uptake under changing exposure conditions. Uptake was acknowledged to be potentially inhibited by excess Copper and Iron in the diet, but this effect was not considered as relevant to risk characterisation. Increased Zinc intake was further recognised to potentially inhibit the uptake of Copper – this effect was in turn considered to be a potentially adverse effect in risk characterisation. Ingestion of Zinc within matrices such as soil was not considered to be quantitatively significant pathways of exposure. Matrix effects, and limitations in bioaccessibility were thus not considered in risk characterisation (Source: EU RARs on Zinc and Zinc compounds). A 1.1.3: Cadmium Oral uptake of Cadmium from the gastrointestinal tract was recognised in animal studies to be low (approximately 5%) and this value was used for risk characterisation. Uptake was further noted to be enhanced by nutritional deficiency for Iron and minerals such as Zinc – this observation was used to define an “at risk” subpopulation of young women with a presumed uptake rate of 10%. Most ingestion of Cadmium was noted to occur after incorporation into foods and that this might, particularly in mineral rich foods, result in reduction of uptake below default levels. However, this observation was not used in Risk Characterisation. Nonlinearities of uptake as a function of intake level were also not assumed, although experimental data documenting such nonlinearities were limited (Source: EU RAR Cadmium and Cadmium oxide). A 1.1.4: Lead The level of investigation on the oral uptake of Lead has been more extensive, which is why the available data is presented in more detail than in the subchapters above: The bioavailability of Lead was recognised to vary as a function of multiple factors such as chemical speciation, age of the exposed individual, level of exposure, the matrix within which the Lead was contained and nutritional status. Some, but not all, of these effects were used for Risk Characterisation, but speciation effects were not incorporated into Risk Characterisation. Children were recognised to have higher rates of uptake than adults – default uptake rates of 50% and 5 – 10% were assumed for children and adults, respectively. The higher uptake rates observed in children compared to adults was acknowledged to be related to uptake pathways for essential minerals (e.g. calcium and Iron) which are more active in children than in adults. Matrix effects were also acknowledged – Lead ingestion by fasting individuals was assumed to be higher than Lead ingested with food, but estimates for fed individuals were deemed to be of greatest utility to Risk Characterisation. The bioavailability of ingested Lead was further recognised to be reduced when ingested in a soil matrix – uptake of soil Lead was 30% for children and 6% for adults.
HERAG FACT SHEET Page 12 of 46 Gastrointestinal uptake and absorption & catalogue of toxicokinetic models
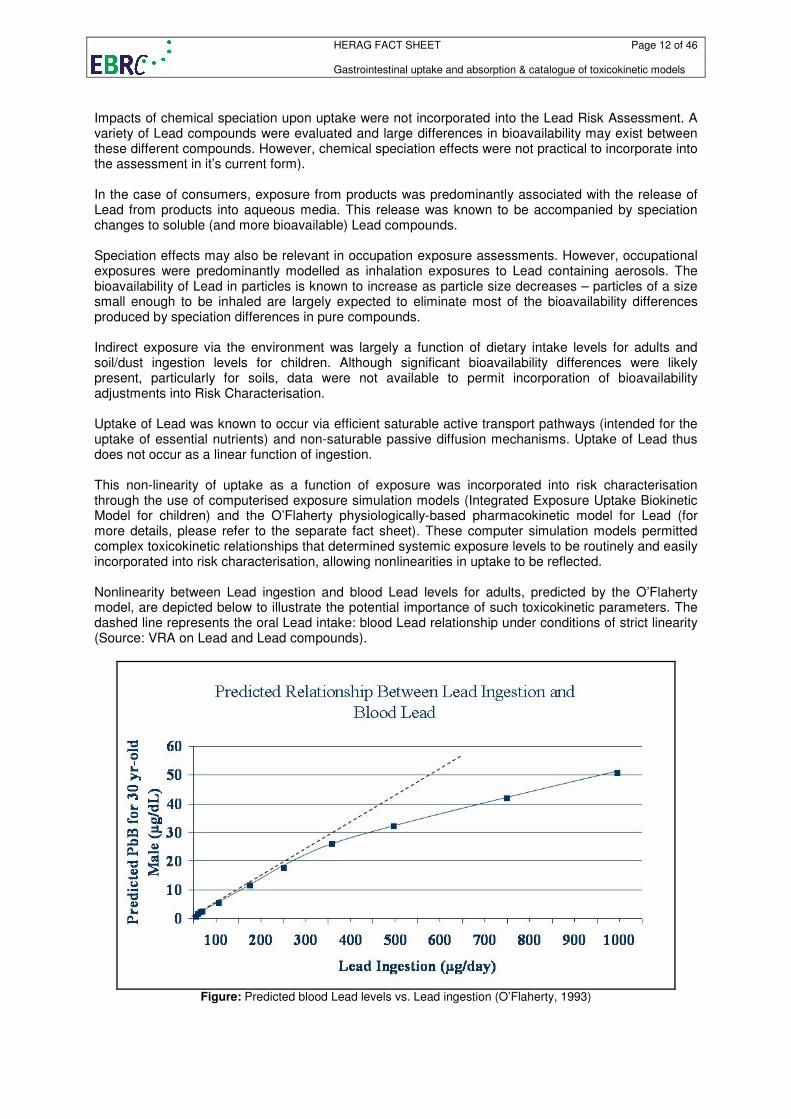
Impacts of chemical speciation upon uptake were not incorporated into the Lead Risk Assessment. A variety of Lead compounds were evaluated and large differences in bioavailability may exist between these different compounds. However, chemical speciation effects were not practical to incorporate into the assessment in it’s current form). In the case of consumers, exposure from products was predominantly associated with the release of Lead from products into aqueous media. This release was known to be accompanied by speciation changes to soluble (and more bioavailable) Lead compounds. Speciation effects may also be relevant in occupation exposure assessments. However, occupational exposures were predominantly modelled as inhalation exposures to Lead containing aerosols. The bioavailability of Lead in particles is known to increase as particle size decreases – particles of a size small enough to be inhaled are largely expected to eliminate most of the bioavailability differences produced by speciation differences in pure compounds. Indirect exposure via the environment was largely a function of dietary intake levels for adults and soil/dust ingestion levels for children. Although significant bioavailability differences were likely present, particularly for soils, data were not available to permit incorporation of bioavailability adjustments into Risk Characterisation. Uptake of Lead was known to occur via efficient saturable active transport pathways (intended for the uptake of essential nutrients) and non-saturable passive diffusion mechanisms. Uptake of Lead thus does not occur as a linear function of ingestion. This non-linearity of uptake as a function of exposure was incorporated into risk characterisation through the use of computerised exposure simulation models (Integrated Exposure Uptake Biokinetic Model for children) and the O’Flaherty physiologically-based pharmacokinetic model for Lead (for more details, please refer to the separate fact sheet). These computer simulation models permitted complex toxicokinetic relationships that determined systemic exposure levels to be routinely and easily incorporated into risk characterisation, allowing nonlinearities in uptake to be reflected. Nonlinearity between Lead ingestion and blood Lead levels for adults, predicted by the O’Flaherty model, are depicted below to illustrate the potential importance of such toxicokinetic parameters. The dashed line represents the oral Lead intake: blood Lead relationship under conditions of strict linearity (Source: VRA on Lead and Lead compounds).
Figure: Predicted blood Lead levels vs. Lead ingestion (O’Flaherty, 1993)
HERAG FACT SHEET Page 13 of 46 Gastrointestinal uptake and absorption & catalogue of toxicokinetic models
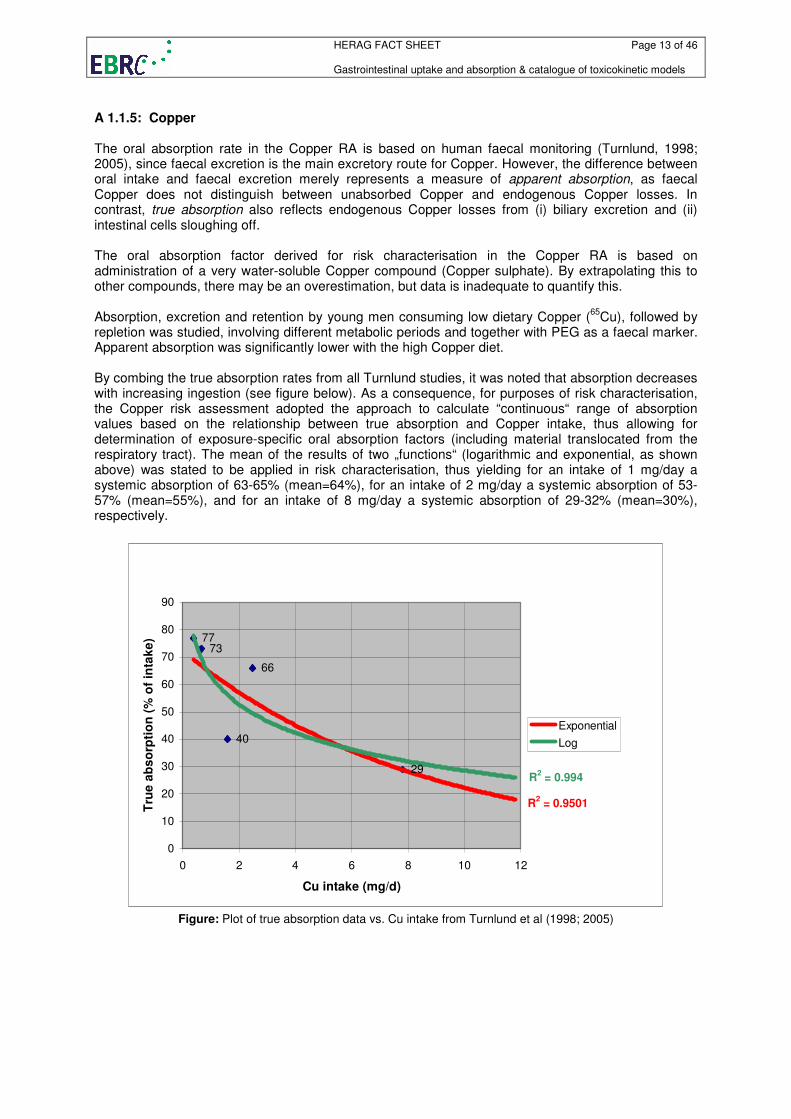
A 1.1.5: Copper The oral absorption rate in the Copper RA is based on human faecal monitoring (Turnlund, 1998; 2005), since faecal excretion is the main excretory route for Copper. However, the difference between oral intake and faecal excretion merely represents a measure of apparent absorption, as faecal Copper does not distinguish between unabsorbed Copper and endogenous Copper losses. In contrast, true absorption also reflects endogenous Copper losses from (i) biliary excretion and (ii) intestinal cells sloughing off. The oral absorption factor derived for risk characterisation in the Copper RA is based on administration of a very water-soluble Copper compound (Copper sulphate). By extrapolating this to other compounds, there may be an overestimation, but data is inadequate to quantify this. Absorption, excretion and retention by young men consuming low dietary Copper (
65Cu), followed by
repletion was studied, involving different metabolic periods and together with PEG as a faecal marker. Apparent absorption was significantly lower with the high Copper diet. By combing the true absorption rates from all Turnlund studies, it was noted that absorption decreases with increasing ingestion (see figure below). As a consequence, for purposes of risk characterisation, the Copper risk assessment adopted the approach to calculate “continuous“ range of absorption values based on the relationship between true absorption and Copper intake, thus allowing for determination of exposure-specific oral absorption factors (including material translocated from the respiratory tract). The mean of the results of two „functions“ (logarithmic and exponential, as shown above) was stated to be applied in risk characterisation, thus yielding for an intake of 1 mg/day a systemic absorption of 63-65% (mean=64%), for an intake of 2 mg/day a systemic absorption of 53-57% (mean=55%), and for an intake of 8 mg/day a systemic absorption of 29-32% (mean=30%), respectively.
7377
66
40
29
R2 = 0.9501
R2 = 0.994
0
10
20
30
40
50
60
70
80
90
0 2 4 6 8 10 12
Cu intake (mg/d)
Tru
e a
bs
orp
tio
n (
% o
f in
tak
e)
Exponential
Log
Figure: Plot of true absorption data vs. Cu intake from Turnlund et al (1998; 2005)
HERAG FACT SHEET Page 14 of 46 Gastrointestinal uptake and absorption & catalogue of toxicokinetic models
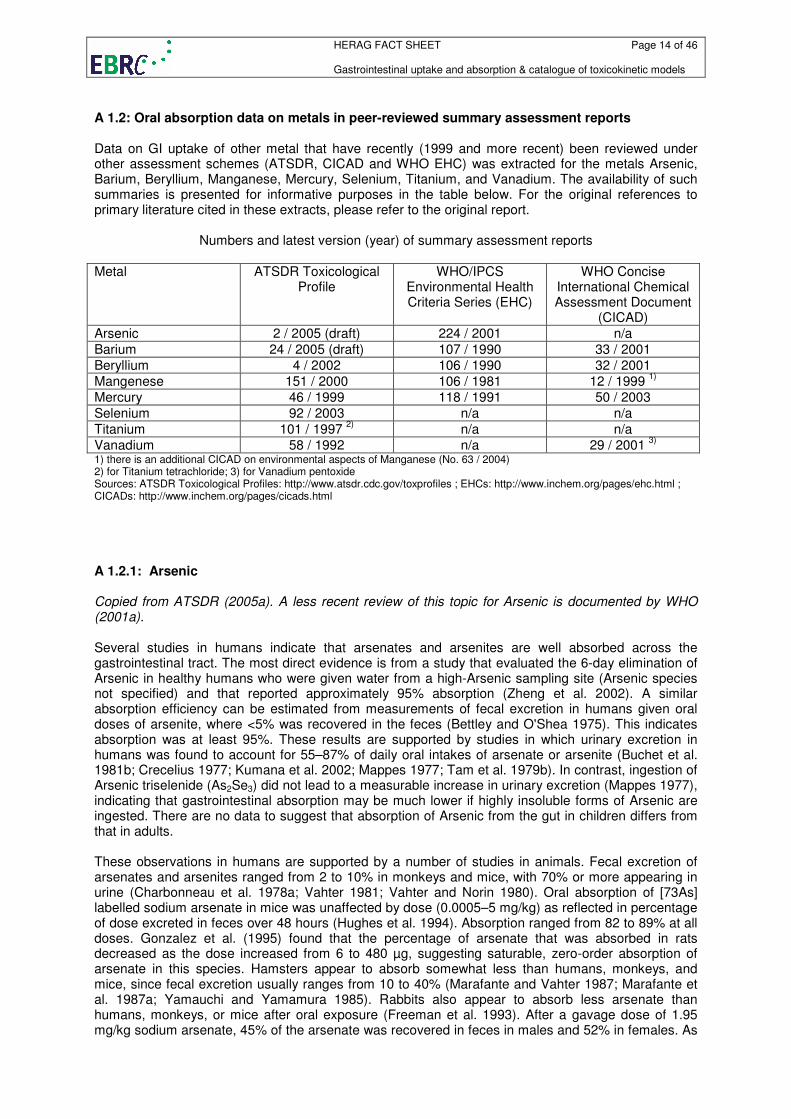
A 1.2: Oral absorption data on metals in peer-reviewed summary assessment reports Data on GI uptake of other metal that have recently (1999 and more recent) been reviewed under other assessment schemes (ATSDR, CICAD and WHO EHC) was extracted for the metals Arsenic, Barium, Beryllium, Manganese, Mercury, Selenium, Titanium, and Vanadium. The availability of such summaries is presented for informative purposes in the table below. For the original references to primary literature cited in these extracts, please refer to the original report.
Numbers and latest version (year) of summary assessment reports
Metal ATSDR Toxicological Profile
WHO/IPCS Environmental Health Criteria Series (EHC)
WHO Concise International Chemical Assessment Document
(CICAD)
Arsenic 2 / 2005 (draft) 224 / 2001 n/a
Barium 24 / 2005 (draft) 107 / 1990 33 / 2001
Beryllium 4 / 2002 106 / 1990 32 / 2001
Mangenese 151 / 2000 106 / 1981 12 / 1999 1)
Mercury 46 / 1999 118 / 1991 50 / 2003
Selenium 92 / 2003 n/a n/a
Titanium 101 / 1997 2)
n/a n/a
Vanadium 58 / 1992 n/a 29 / 2001 3)
1) there is an additional CICAD on environmental aspects of Manganese (No. 63 / 2004) 2) for Titanium tetrachloride; 3) for Vanadium pentoxide Sources: ATSDR Toxicological Profiles: http://www.atsdr.cdc.gov/toxprofiles ; EHCs: http://www.inchem.org/pages/ehc.html ; CICADs: http://www.inchem.org/pages/cicads.html
A 1.2.1: Arsenic Copied from ATSDR (2005a). A less recent review of this topic for Arsenic is documented by WHO (2001a). Several studies in humans indicate that arsenates and arsenites are well absorbed across the gastrointestinal tract. The most direct evidence is from a study that evaluated the 6-day elimination of Arsenic in healthy humans who were given water from a high-Arsenic sampling site (Arsenic species not specified) and that reported approximately 95% absorption (Zheng et al. 2002). A similar absorption efficiency can be estimated from measurements of fecal excretion in humans given oral doses of arsenite, where <5% was recovered in the feces (Bettley and O'Shea 1975). This indicates absorption was at least 95%. These results are supported by studies in which urinary excretion in humans was found to account for 55–87% of daily oral intakes of arsenate or arsenite (Buchet et al. 1981b; Crecelius 1977; Kumana et al. 2002; Mappes 1977; Tam et al. 1979b). In contrast, ingestion of Arsenic triselenide (As2Se3) did not lead to a measurable increase in urinary excretion (Mappes 1977), indicating that gastrointestinal absorption may be much lower if highly insoluble forms of Arsenic are ingested. There are no data to suggest that absorption of Arsenic from the gut in children differs from that in adults. These observations in humans are supported by a number of studies in animals. Fecal excretion of arsenates and arsenites ranged from 2 to 10% in monkeys and mice, with 70% or more appearing in urine (Charbonneau et al. 1978a; Vahter 1981; Vahter and Norin 1980). Oral absorption of [73As] labelled sodium arsenate in mice was unaffected by dose (0.0005–5 mg/kg) as reflected in percentage of dose excreted in feces over 48 hours (Hughes et al. 1994). Absorption ranged from 82 to 89% at all doses. Gonzalez et al. (1995) found that the percentage of arsenate that was absorbed in rats decreased as the dose increased from 6 to 480 µg, suggesting saturable, zero-order absorption of arsenate in this species. Hamsters appear to absorb somewhat less than humans, monkeys, and mice, since fecal excretion usually ranges from 10 to 40% (Marafante and Vahter 1987; Marafante et al. 1987a; Yamauchi and Yamamura 1985). Rabbits also appear to absorb less arsenate than humans, monkeys, or mice after oral exposure (Freeman et al. 1993). After a gavage dose of 1.95 mg/kg sodium arsenate, 45% of the arsenate was recovered in feces in males and 52% in females. As
HERAG FACT SHEET Page 15 of 46 Gastrointestinal uptake and absorption & catalogue of toxicokinetic models
in humans, when highly insoluble Arsenic compounds are administered (Arsenic trisulfide, Lead arsenate), gastrointestinal absorption is reduced 20–30% (Marafante and Vahter 1987). Bioavailability of Arsenic was measured in rabbits ingesting doses of smelting soils that contained Arsenic primarily in the form of sulfides (Freeman et al. 1993). Bioavailability was assessed by comparing the amounts of Arsenic that was excreted after ingestion of the soil to that excreted after an intravenous dose of sodium arsenate. The bioavailability of the Arsenic in the ingested soil was 24±3.2% and that of sodium arsenate in the gavage dose was 50±5.7%. Approximately 80% of the Arsenic from ingested soil was eliminated in the feces compared with 50% of the soluble oral dose and 10% of the injected dose. In another study, rabbits dosed with sodium arsenite (0.8 mg As/kg) had 5 times greater blood Arsenic concentrations than rabbits dosed with Arsenic-containing soil (2.8 mg As/kg), suggesting a lower bioavailability of the Arsenic in soil (Davis et al. 1992). Studies of the bioavailability of Arsenic suggest that absorption of Arsenic in ingested dust or soil is likely to be considerably less than absorption of Arsenic from ingested salts (Davis et al. 1992, 1996; EPA 1997g; Freeman et al. 1993, 1995; Pascoe et al. 1994; Rodriguez et al. 1999). Oral absorption of Arsenic in a group of three female Cynomolgus monkeys from a soluble salt, soil, and household dust was compared with absorption of an intravenous dose of sodium arsenate (Freeman et al. 1995). Mean absolute percentage bioavailability based on urine Arsenic excretion was reported at 67.6±2.6% (gavage), 19.2±1.5% (oral dust), and 13.8±3.3% (oral soil). Mean absolute percentage bioavailability based on blood Arsenic levels was reported at 91.3±12.4% (gavage), 9.8±4.3% (oral dust), and 10.9±5.2% (oral soil). The Arsenic in the dust and soil was approximately 3.5–5-fold (based on levels in the urine) and 8–9-fold (based on levels in the blood) less bioavailable than Arsenic in solution. A study in beagle dogs fed with soil containing As2O5 or treated with intravenous soluble Arsenic found that compared to injection the bioavailability of Arsenic from ingested soil was 8.3±2.0% (Groen et al. 1993). The bioavailability of Arsenic in soil has been studied in juvenile swine that received daily oral doses of soil or sodium arsenate (in food or by gavage) for 15 days (EPA 1997g). The soils were obtained from various mining and smelting sites and contained, in addition to Arsenic at concentrations of 100–300 µg/g, Lead at concentrations of 3,000–14,000 µg/g. The Arsenic doses ranged from 1 to 65.4 µg/kg/day. The fraction of the Arsenic dose excreted in urine was measured on days 7 and 14 and the relative bioavailability of the soil-borne Arsenic was estimated as the ratio of urinary excretion fractions, soil Arsenic:sodium arsenate. The mean relative bioavailability of soil-borne Arsenic ranged from 0 to 98% in soils from seven different sites (mean±SD, 45%±32). Estimates for relative bioavailability of Arsenic in samples of smelter slag and mine tailings ranged from 7 to 51% (mean±SD, 35%±27). Rodriguez et al. (1999) used a similar approach to estimate the relative bioavailability of Arsenic in mine and smelter wastes (soils and solid materials) in juvenile swine. Samples included Iron slag deposits and calcine deposits and had Arsenic concentrations that ranged from 330 to 17,500 µg/g. Relative bioavailability (waste:sodium arsenate) ranged from 3 to 43% for 13 samples (mean, 21%) and was higher in Iron slag wastes (mean, 25%) than in calcine wastes (mean, 13%). Bioavailability of Arsenic from soil is reduced by low solubility and inaccessibility due to the presence of secondary reaction products or insoluble matrix components (Davis et al. 1992). This is supported by studies conducted with in vitro simulations of the gastric and/or intestinal fluids (Hamel et al. 1998; Rodriguez et al. 1999; Ruby et al. 1996, 1999; Williams et al. 1998). When soils containing Arsenic are incubated in simulated gastrointestinal fluids, only a fraction of the Arsenic becomes soluble. Estimates of the soluble, or bioaccessible, Arsenic fraction have ranged from 3 to 50% for various soils and mining and smelter waste materials (Rodriguez et al. 1999; Ruby et al. 1996); these estimates are similar to in vivo estimates of the relative bioavailability of Arsenic in these same materials (Ruby et al. 1999). Based on urinary excretion studies in volunteers, it appears that both MMA (monomethylarsonate) and DMA (dimethylarsinate) are well absorbed (at least 75–85%) across the gastrointestinal tract (Buchet et al. 1981a; Marafante et al. 1987b). This is supported by studies in animals, where at least 75% absorption has been observed for DMA (Marafante et al. 1987b; Stevens et al. 1977b; Yamauchi and Yamamura 1984) and MMA (Yamauchi et al. 1988).
HERAG FACT SHEET Page 16 of 46 Gastrointestinal uptake and absorption & catalogue of toxicokinetic models
A 1.2.2: Barium Copied from ATSDR (2005b). Less recent reviews on Barium also addressing this topic are available from WHO (2001b and 1990a). The absorption of barium from the gastrointestinal tract is compound dependent. Barium sulfate is extremely insoluble and very little, if any, ingested barium sulfate is absorbed. Acid-soluble barium compounds, such as barium chloride and barium carbonate, are absorbed through the gastrointestinal tract, although the amount of barium absorbed is highly variable. Older human studies estimated that barium was poorly absorbed; approximately 1–15% of the ingested dose was estimated to be absorbed (Harrision et al. 1956; LeRoy et al. 1966; Schroeder et al. 1972; Tipton et al. 1969). A re-examination of the methods used in these studies found a number of flaws; Leggett (1992) estimated that barium absorption in these studies was approximately 3–60%. Studies in adult rats and dogs estimated fractional absorption at 7% (Cuddihy and Griffith 1972; Taylor et al. 1962). Several unpublished animal studies discussed by Leggett (1992) found absorption rates of 1–50%. Experiments in rats have shown that younger animals (22 days old or less) absorb about 10 times more barium chloride from the gastrointestinal tract (63–84%) than do older animals (about 7%) (Taylor et al. 1962). Absorption was higher in fasted adult rats (20%) as compared to fed rats (7%). The International Commission for Radiation Protection (ICRP) estimates that the gastrointestinal absorption of barium is 20% in adults, 30% for children aged 1–15 years, and 60% in infants (ICRP 1993). A 1.2.3: Beryllium Copied from ATSDR (2002). Less recent reviews on Beryllium also addressing this topic are available from WHO (2001c and 1990b). No studies were located regarding absorption in humans after oral exposure to beryllium or its compounds. Beryllium and its compounds are poorly absorbed from the gastrointestinal tract in animals. Urinary excretion data from rats treated by gavage with radioactive beryllium chloride indicate that the cumulative excretion of beryllium in the urine and feces was 0.11 and 104.7% of the total dose, respectively (Furchner et al. 1973). In mice, dogs, and monkeys similarly exposed, the urinary output was 0.24, 0.38, and 3.71% of the total dose, respectively, while most of the radiolabel was excreted in the feces. Therefore, although intestinal absorption of beryllium varies somewhat among species, beryllium was poorly absorbed in these animals. Mice exposed to radioactive beryllium retained beryllium in the gastrointestinal tract (LeFevre and Joel 1986). The amount found in the tissues other than intestinal was <0.1%. Urinary excretion accounted for 0.5% of the total dose of beryllium sulfate administered to rats as 0.019 and 0.190 mg beryllium/kg/day in drinking water for 24 weeks (Reeves 1965). The percent absorption, determined as the percentage of the dose that could be recovered from the total body load and excreta, was 0.9% in the 0.019 mg beryllium/kg/day group and 0.2% in the 0.190 mg beryllium/kg/day group. Rats exposed to 31 mg beryllium/kg/day as beryllium sulfate in drinking water for 2 years excreted very little beryllium via the urine (Morgareidge et al. 1975). Oral absorption of beryllium and its compounds may be reduced by the formation of beryllium phosphate precipitates in the alkaline environment of the intestine (Reeves 1965). A 1.2.4: Manganese Copied from ATSDR (2000). Less recent reviews on Manganese also addressing this topic are available from WHO (1999 and 1981). Inorganic Manganese: The amount of manganese absorbed across the gastrointestinal tract in humans is variable but typically averages about 3–5% (Davidsson et al. 1988, 1989; Mena et al. 1969). Data were not located on the relative absorption fraction for different manganese compounds, but there does not appear to be a marked difference between retention of manganese ingested in food (5% at day 10) or water (2.9% at day 10) (Davidsson et al. 1988, 1989a; Ruoff 1995). In humans,
HERAG FACT SHEET Page 17 of 46 Gastrointestinal uptake and absorption & catalogue of toxicokinetic models
manganese absorption tends to be greater from MnCl2 (in demineralized water) than from foods (labeled intrinsically or extrinsically with 54Mn); however, the biological half-life of manganese from either MnCl2 or food is the same (EPA 1995b; Johnson et al. 1991). In human adults, supplementation of the diet with MnSO4 for 12–35 weeks at a level approximately 2 times the normal dietary intake caused a 30–50% decrease in absorption of a tracer dose of 54MnCl2 (Sandstrom et al. 1990). Roels et al. (1997) noted that in 3-month-old male rats, gavage administered MnCl2 (24.3 mg manganese/kg) reached a maximal level in blood, 7.05 µg/100 mL, within the first 30 minutes post-dosing (first time point measured), whereas manganese from MnO2, administered in the same fashion, did not reach a maximal level in blood of 900 ng/100 mL until 144 hours (6 days) post-dosing. Following 4 weekly gavage doses of MnCl2 at 24.3 mg manganese/kg per dose, significant increases in manganese concentration were observed in blood and the cerebral cortex, but not cerebellum or striatum, as compared to controls; for identical doses of MnO2, manganese levels were significantly increased only in blood. The lack of significant increase in manganese levels in any brain region following administration of the dioxide is likely due to the delayed uptake of manganese in the blood. One study showed that, in full-term infants, manganese is absorbed from breast milk and cow’s milk formulas that were either unsupplemented or supplemented with Iron, Copper, Zinc, and iodine (Dorner et al. 1989). Manganese intake was greater in the formula-fed infants than in the breast-fed infants due to the higher manganese content of the formula. However, breast-fed infants retained more of their daily intake of manganese (40%) than did the formula-fed infants (20%). It must be noted that the full-term infants evaluated in this study were 2–18 weeks old, and the data did not stratify intake and retention amounts by age. Further, the data did not indicate if there were similar proportions of manganese taken up from breast milk as compared to the formulas. A study by Davidson and Lönnerdal (1989) demonstrated the in vitro receptor-mediated uptake of manganese from lactoferrin; the authors speculated that this may lead to the absorption of manganese from breast milk in human infants. There is some evidence to suggest that manganese absorption is age-dependent. Dorner et al. (1989) have shown that infants, especially premature infants, retain a higher proportion of manganese than adults. Animal studies also support this finding. For example, Rehnberg et al. (1980, 1981, 1982) dosed 1 day-old rat pups with up to 214 mg manganese/kg/day (as Mn3O4) for up to 224 days, then measured manganese concentrations in tissues. The authors noted that intermediate and chronic exposure of rats to Mn3O4 in water or food resulted in much larger increases in tissue levels in young rats (1–15 days in intermediate studies, 24–40 days in chronic study) than in older rats. These increases in neonates were judged to be due to the neonates' greater absorption of manganese as a result of a slower rate of transport through the gut (Rehnberg et al. 1985). Similar results have been reported in rats exposed to MnCl2 (Kostial et al. 1978). However, such age-dependent differences in tissue retention of manganese could also be due to differences in excretory ability (Cotzias et al. 1976; Miller et al. 1975) or to age-related changes in dietary intake levels of Iron and manganese (Ballatori et al. 1987). Dorner et al. (1989) found that both pre-term and full-term infants had active excretion of manganese; in fact, some infants had negative manganese balances. Animal studies show that absorption and/or retention of manganese is higher in neonates, but returns to the level of older animals at approximately post-gestational day 17–18 (Kostial et al. 1978; Lönnerdal et al. 1987; Miller et al. 1975; Rehnberg et al. 1981). Available studies (Dorner et al. 1989) do not provide adequate data to determine when this transition takes place in human infants. One of the key determinants of absorption appears to be dietary Iron intake, with low Iron levels leading to increased manganese absorption. Mena et al. (1969) administered oral 54Mn and 39Fe to subjects with irondeficiency anemia (ranging in age from 13 to 44 years old) and measured Mn and Fe uptake with wholebody autoradiography. The uptake of manganese by anemic subjects was 7.5% while in non-anemic subjects, it was 3.0%. This is probably because both Iron and manganese are absorbed by the same transport system in the gut. The activity of this system is inversely regulated by dietary Iron and manganese intake levels (Chandra and Tandon 1973; Diez-Ewald et al. 1968; Rehnberg et al. 1982; Thomson et al. 1971). Interaction between Iron and manganese occurs only between nonheme Iron and manganese. Davis et al. (1992a) demonstrated that increasing dietary intakes of nonheme Iron, but not heme Iron, depressed biomarkers of manganese status, i.e., serum manganese concentrations and lymphocyte manganesedependent superoxide dismutase activity. Studies of oral absorption of manganese in animals have yielded results that are generally similar to those in humans. Manganese uptake in pigs, which have similar gastrointestinal tracts to humans, has been measured using labeled manganese administered orally (Finley et al. 1997). The mean
HERAG FACT SHEET Page 18 of 46 Gastrointestinal uptake and absorption & catalogue of toxicokinetic models
absorption rates for different times post-dosing were 5% 1–6 hours post-dosing, 7% 6–12 hours post-dosing, and 3.8% 12–24 hours post-dosing. Gastrointestinal uptake of MnCl2 in rats has been estimated to be 2.5–8.2% (Davis et al. 1993; Pollack et al. 1965). Uptake is increased by Iron deficiency (Pollack et al. 1965) and decreased by preexposure to high dietary levels of manganese (Abrams et al. 1976a; Davis et al 1992b). In a rat study, the intestinal transfer of the calcium ion and manganese ion was found to be competitive, and the authors suggested that there is a common mechanism for their transfer in the intestines (Dupuis et al. 1992). High dietary intakes of phosphorus (Wedekind et al. 1991) and calcium (Wilgus and Patton 1939) have also been demonstrated to depress manganese uptake in chicks. Manganese absorption has also been found to vary according to manganese intake; in rats whose diet was manganese deficient, absorption was at least two-fold higher than in rats whose diets contained an adequate amount of manganese (as manganese carbonate) (Davis et al. 1992b). Two studies in suckling rat pups found differing absorptions of manganese from different milks and formulas. The first study (Lönnerdal et al. 1987) found that the percent of 54Mn (added to the food source as an extrinsic label) retained (measured as whole-body retention) in 14-day-old pups fed breast milk, cow milk, cow milk formula, and soy formula, was 82, 90, 77, and 65%, respectively. The latter study (Lönnerdal et al. 1994)found that 13-day-old rat pups fed 54Mn (from MnCl2 that was incubated with the food for at least 24 hours prior to feeding) in breast milk, cow milk, and several different manufacturer’s cow milk formulas, had similar absorption values. These pups absorbed (measured as whole-body retention) 80% of the label from breast milk, 83% from cow milk, and 63–90% from the cow milk formulas, with the 2 lowest retention values being significantly lower than the others. In this latter study, manganese absorption from soy formulas was significantly lower than the other milks and formulas tested, ranging from 63–72%. The inherent concentration of manganese in each of these food sources from the first study was 0.01, 0.04, 0.05, and 0.30 µg/mL, respectively. Therefore, when the retention of the label was multiplied by the actual manganese concentration of the food, the total amounts of absorbed manganese were 4, 18, 19, and 96.8 ng/dose fed, respectively. These data indicate that infants fed cow milk formula may retain 5 times more manganese, and infants fed soy formula may retain 25 times more manganese than breast-fed infants. Although the latter results differ significantly from those observed earlier, the researchers report that the similar relative values for manganese absorption were indicative of significant efforts made to optimize both the relative concentrations and the bioavailability of minerals and trace elements in the manufactured formulas. Organic Manganese: Methylcyclopentadienyl manganese tricarbonyl (MMT, a gasoline additive): No studies were located regarding absorption of manganese following oral exposure to MMT in either humans or animals. The available studies (Hanzlik et al. 1980; Hinderer 1979; Hysell et al. 1974; Komura and Sakamoto 1992) indicate absorption is occurring because toxicity is observed following MMT exposure; however, no absorption rates or relative amounts were provided in these studies. Maneb or mancozeb. No studies were located regarding absorption of manganese in humans following oral exposure to maneb or mancozeb. Two studies discuss the acute absorption of radiolabeled maneb in rodents. The first study (Brocker and Schlatter 1979) used unfasted adult female rats dosed with [54Mn]maneb at a dose of 4–10 mg/kg. The rats were kept in metabolism cages which allowed the collection of respired air, urine, and feces for several hours post-dosing. The maneb was given alone or in conjunction with different metal compounds. Radioanalysis of excreta and selected tissues revealed that at 72 hours post-dosing, only 4–6% of the radioactivity was retained in the body with the majority of the label located within the liver and kidney. For 2 different chemical preparations of maneb, the recovery of label in feces was 94–96%, with the remainder in the urine. The respired air of two rats contained only 0.24 and 0.60% of the label, respectively. When molar excesses of the chloride salts of Zinc, Copper, Iron, and mercury were added with the maneb, absorption was decreased to 0–5%, with residual levels in the liver reduced from a high value of 4.46±1.04×10⁻³ (as a fraction of the labeled dose/g wet tissue) with maneb alone, to a low of 0.97±0.5×10⁻³ with an 8-fold molar excess of CuCl2. Rats dosed with 100 mg/kg of [14C] mancozeb for 7 days via gavage were sacrificed 24 hours after the last dose to determine the amount of label retained in the tissues. Analyses on material balance revealed that 0.96% of the label was retained in the carcass, 0.31% in the tissues, with the remainder collected in the faeces and urine (Lyman 1971).
HERAG FACT SHEET Page 19 of 46 Gastrointestinal uptake and absorption & catalogue of toxicokinetic models
A 1.2.5: Mercury Copied from WHO 2003. Less recent reviews on Mercury also addressing this topic are available from ATSDR (1999) and WHO (1991). Inhalation is the primary route of entry into the body for elemental mercury, while oral exposure is the primary route for inorganic mercury salts. Dermal penetration is usually not a significant route of exposure to inorganic mercury. Elemental mercury: Approximately 80% of inhaled elemental mercury is absorbed through the lungs by rapid diffusion. In contrast, only 0.01% of elemental mercury is absorbed through the gastrointestinal tract, possibly because of its enterogastric conversion to divalent mercury and subsequent binding to sulfhydryl groups. Dermal absorption of elemental mercury is limited. Hursh et al. (1989) estimated that dermal absorption contributes approximately 2.6% of the absorbed mercury following exposure to elemental mercury vapour in the air; the other 97.4% occurs through inhalation. Absorption of mercury vapour via olfactory nerves has also been proposed; however, Maas et al. (1996) has demonstrated that there is no relationship between mercury concentrations in lower parts of the brain and the amount of amalgam fillings in the mouth. Sandborgh-Englund et al. (1998) evaluated the absorption, blood levels, and excretion of mercury in nine healthy volunteers (two males, seven females) exposed to mercury vapour in air at 400 µg/m3 for 15 min. This exposure corresponded to a dose of 5.5 nmol mercury/kg body weight. Samples of exhaled air, blood, and urine were collected for 30 days after exposure. The median retention of elemental mercury after 30 days was 69% of the inhaled dose. This corresponds to the estimated half-life of approximately 60 days for elemental mercury. Inorganic mercury compounds: For inorganic mercuric compounds, absorption via the lungs is low, probably due to deposition of particles in the upper respiratory system and subsequent clearance by the mucociliary escalator (Friberg & Nordberg, 1973). The extent of transport of inorganic mercury across the intestinal tract may depend on its solubility (Friberg & Nordberg, 1973) and/or how easily the compound dissociates in the lumen to become available for absorption (Endo et al., 1990). Absorption of mercurous compounds is less likely than absorption of mercuric forms, probably because of solubility (Friberg & Nordberg, 1973). Using whole-body retention data, estimated mercuric chloride absorptions of 3–4%, 8.5%, and 6.5% were calculated for single oral doses of 0.2–12.5 mg/kg body weight, 17.5 mg/kg body weight, and 20 mg/kg body weight, respectively, in rats (Piotrowski et al., 1992). However, also using whole-body retention data to indicate absorption, an estimated absorption of 20–25% was calculated from single oral doses of 0.2–20.0 mg mercury/kg body weight as mercuric chloride in mice by comparing retention data after oral and intraperitoneal dosing and taking excretion and intestinal reabsorption into account (Nielsen & Andersen, 1990). The rate of oral absorption of mercuric mercury compounds in laboratory rodents has been shown to be dependent on intestinal pH (Endo et al., 1990), age, and diet (Kostial et al., 1978). One-week-old suckling mice absorbed 38% of the orally administered mercuric chloride, whereas adult mice absorbed only 1% of the dose on standard diets. Nutritional status might also contribute to the intestinal absorption of Hg2+, through competition with nutritionally essential divalent cations (e.g., Cu2+, Zn2+) that might have insufficient body stores. Mercurous and mercuric salts have also been reported to be absorbed through the skin of animals (Schamberg et al., 1918; Silberberg et al., 1969), but no quantitative data are available. Indirect evidence of dermal absorption in humans is provided by clinical case-studies in which mercury intoxication was reported in individuals following dermal application of ointments that contained inorganic mercury salts (Bourgeois et al., 1986; De Bont et al., 1986; Kang-Yum & Oransky, 1992). Urine samples from young women using skinlightening creams containing 5–10% mercuric ammonium chloride had a mean mercury concentration of 109 µg/litre, compared with 6 µg/litre for urine samples from women who had discontinued use and 2 µg/litre for women who had never used the creams (Barr et al., 1973). Mercurous chloride laxative (calomel) ingested over a long period may produce toxic effects on the kidneys, gastrointestinal tract, and central nervous system (Wands et al., 1974). While insoluble
HERAG FACT SHEET Page 20 of 46 Gastrointestinal uptake and absorption & catalogue of toxicokinetic models
mercurous chloride is not normally that readily absorbed, small amounts may be converted to mercuric ion, which is more likely to be absorbed, in the lumen of the intestine. In addition, the mercurous ion that is absorbed is subsequently oxidized to mercuric ion, which may induce cellular toxicity by binding to intracellular sulfhydryl groups. A 1.2.6: Selenium Copied from ATSDR (2003). EHC or CICAD documents are not available on Selenium. Selenium compounds are generally readily absorbed from the human gastrointestinal tract. The bioavailability of ingested Selenium can be affected by the physical state of the compound (e.g., solid or solution), the chemical form of Selenium (e.g., organic, inorganic), and the dosing regimen. However, in general, it appears that the degree of Selenium absorption (i.e., percent of administered dose absorbed) in humans is independent of the exposure level, but that in some cases, absorption is greater when Selenium deficiency exists. In humans, absorption of sodium selenite or selenomethionine can exceed 80% for both small and relatively large doses (Griffiths et al. 1976; Thomson 1974; Thomson and Stewart 1974; Thomson et al. 1977). A total of 90–95% of a small amount of sodium selenite (0.010 mg Selenium/person) administered in aqueous solution was absorbed (Thomson 1974). Absorption of a large dose (1.0 mg/person) of either sodium selenite or selenomethionine was 90–95 and 97% of the administered dose, respectively (Thomson et al. 1977). These data indicate a lack of homeostatic control over the dose range tested. Martin et al. (1989a) found no clear evidence of increased gastrointestinal absorption of Selenium as sodium selenite in aqueous solution by healthy male volunteers kept on a Selenium-deficient diet. Griffiths et al. (1976) reported 96–97% absorption of a single dose of 0.002 mg Selenium administered as selenomethionine in solution. Similarly, Thomson et al. (1977) reported 97% absorption of a single large dose of 1.0 mg Selenium administered as selenomethionine in solution to one subject. The subjects in these studies were New Zealand women. Other studies have indicated that humans might absorb selenomethionine more efficiently than sodium selenite (Moser-Veillon et al. 1992; Swanson et al. 1991). Young et al. (1982) studied human absorption of dietary Selenium in young men in the United States. The men ate either 75Se-labeled chicken alone (0.013 mg Selenium/person) or the chicken plus supplemental labeled sodium selenite (0.071 mg Selenium/person in a solution mixed with the meal). Eighty percent of the Selenium in the chicken meat was absorbed, but less than 30% of the Selenium administered as sodium selenite was absorbed. Similarly, Robinson et al. (1978) found that 75% of selenomethionine, but only 46% of selenite, was absorbed during a 10–11-week administration of solutions providing 0.0013–0.0023 mg Selenium/kg/day to New Zealand women. It is not clear why the estimated absorption of sodium selenite varied between 46 and 30% in these trials. Experimental animals also efficiently absorb Selenium compounds from the gut independent of the level of Selenium exposure. Several studies have reported absorption of 80–100% in rats given dietary Selenium administered as sodium selenite, sodium selenate, selenomethionine, or selenocystine (Furchner et al. 1975; Thomson and Stewart 1973). Other animal species also readily absorb orally administered Selenium compounds. Furchner et al. (1975) estimated that over 90% of an oral dose of selenious acid was absorbed in mice and dogs, although monkeys absorbed less of the administered dose (amount unspecified). Using an in vivo perfusion method in which selenite was added directly to the duodenal end of the small intestine, the absorption of selenite was linearly related to concentration (slope=0.0386) in the range of 1–200 µM (Chen et al. 1993). In one study of rats, absorption of selenite or selenomethionine into the blood stream following oral exposure occurred primarily in the duodenum and, to a lesser extent, in the jejunum and ileum (Whanger et al. 1976). Compared to the small intestine, little Selenium was absorbed from the stomach (Whanger et al. 1976), and it was not determined whether absorption occurred in the large intestine. In an in vitro study using everted intestinal sacs from hamsters, Spencer and Blau (1962) found that selenomethionine was transported against a concentration gradient with the same characteristics as methionine. Selenomethionine was not found to be degraded during transport. This study suggests that in the intestines, methionine and selenomethionine share the same transport mechanism.
HERAG FACT SHEET Page 21 of 46 Gastrointestinal uptake and absorption & catalogue of toxicokinetic models
A comparison of absorption of Selenium by Selenium-depleted rats after oral administration of sodium selenate, selenomethionine, or methyl selenocysteine (from high-Selenium broccoli) found that gross absorption of Selenium from methyl selenocysteine was significantly lower (85%) than from sodium selenate or selenomethionine (91%); further, true Selenium absorption adjusted for urinary excretion was significantly different for methyl selenocysteine, sodium selenate, and selenomethionine, with the lowest absorption for methyl selenocysteine and the highest for selenomethionine (Finley 1998). Absorption of Selenium from selenomethionine was not significantly lower than from sodium selenate. In vivo experiments with ligated rat intestines have shown that there is significantly higher absorption and transfer to the body of Selenium as selenocystine or selenodiglutathione than Selenium as selenite from ligated loops of ileum, but that absorption of the three forms of Selenium in the jejunum was approximately similar (Vendeland et al. 1992). In vitro experiments with brush border membrane vesicles derived from rat intestines have shown dramatic differences in the uptake and binding of Selenium depending on the form in which it is presented, with absorption of organic forms being much more efficient than absorption from selenite or selenate (Vendeland et al. 1992, 1994). Selenium from selenocystine or selenodiglutathione was absorbed 10 times more quickly than Selenium from sodium selenite (Vendeland et al. 1992). Similarly, Selenium was much more efficiently absorbed from selenomethionine than from selenite or selenate (Vendeland et al. 1994). Binding also varied between selenomethionine, selenite, and selenate, with selenite binding exceeding that of selenate by 37-fold and selenomethionine exceeding selenite by 14-fold (Vendeland et al. 1994). These studies indicate that absorption of Selenium from the gastrointestinal tract of animals is pH-dependent and influenced by the presence of sulfhydral-containing compounds, and that the increased absorption of Selenium with sulfhydral compounds is likely due to complex formation with these compounds. A 1.2.7: Titanium Not further addressed here since the only available summary assessment report is the ATSDR Toxicological Profile on Titanium Tetrachloride from 1997 which reads:” No studies were located regarding absorption in humans or animals after oral exposure to Titanium tetrachloride.“ During the finalisation stage of this document, the authors were made aware of a more recent article (in German language): Lahl H, Eckert T, Unterhalt B: Blood titanium levels before and after oral administration of titanium dioxide (Pharmazie 55:140-143, 2000). However, in view of the fragmentary nature of this piece of information, it is not considered further. A 1.2.8: Vanadium Copied from WHO (2001d). Another summary assessment report is available from ATSDR (1992). Human exposure data suggest that Vanadium (chemical form unknown) is absorbed following inhalation exposure to 0.03–0.77 mg Vanadium/m3 and is subsequently excreted via the urine with an initial rapid phase of elimination, followed by a slower phase, which presumably reflects the gradual release of Vanadium from body tissues (Kiviluoto et al., 1981a). Following oral administration of 50–125 mg/day, ammonium vanadyl tartrate (tetravalent Vanadium) is poorly absorbed from the gastrointestinal tract in humans (Dimond et al., 1963). Less than 1% of the administered dose was eliminated in the urine within the first 24 h post-administration. No other information is available in humans. Groups of two rats were exposed to ammonium metavanadate (pentavalent Vanadium, median mass aerodynamic diameter [MMAD] 0.32 µm) at a concentration of 2 mg/m3 for 8 h/day for 4 days (Cohen et al., 1996b). There was a tendency for Vanadium to accumulate in the lung; lung levels increased by around 44% over the first 2 days, followed by an additional 10% on each of days 3 and 4. Twenty-four hours after the final exposure, lung Vanadium levels decreased by about 39% (from 27 to 17 µg/g lung). Intratracheal studies in animals (Oberg et al., 1978; Conklin et al., 1982; Rhoads & Sanders, 1985; Sharma et al., 1987) indicate that Vanadium, from either Vanadium pentoxide or other pentavalent and tetravalent Vanadium compounds, is absorbed to a significant extent from the lungs. Following intratracheal instillation of 40 µg Vanadium pentoxide, 72% of the administered dose was absorbed from the lungs within 11 min (Rhoads & Sanders, 1985). The remaining 28% was absorbed over 2
HERAG FACT SHEET Page 22 of 46 Gastrointestinal uptake and absorption & catalogue of toxicokinetic models
days. Forty per cent of the administered dose was retained within the carcass after 14 days (12% in bones), and 40% was eliminated via urine and faeces. Similar results were obtained by the other authors. Oral studies (Parker & Sharma, 1978; Conklin et al., 1982; Ramanadham et al., 1991; summarized by HSE, in press) indicate that Vanadium compounds are poorly absorbed from the gastrointestinal tract (approximately 3% of the administered dose). No dermal studies are available. Absorbed Vanadium in either pentavalent or tetravalent states is distributed mainly to the bone (around 10–25% of the administered dose 3 days after administration) and to a lesser extent to the liver (about 5%), kidney (about 4%), and spleen (about 0.1%), while small amounts are also detected in the testes (about 0.2%) (Sabbioni et al., 1978; Ramanadham et al., 1991; Sanchez et al., 1998; HSE, in press). Distribution studies in which rats received a total of approximately 224 and 415 mg Vanadium pentoxide/kg in drinking-water over a period of 1 and 2 months indicated that the Vanadium content (assessed in 13 specific tissues) was greatest in the kidneys, spleen, tibia, and testes (Kucera et al., 1990). Similar distribution was seen in a study conducted using vanadyl sulfate (tetravalent Vanadium) (Kucera et al., 1990). Further evidence for the distribution of Vanadium to testes comes from genotoxicity studies in germ cells (section 8.7) and reproductive studies (section 8.8). The main route of Vanadium excretion is via the urine (HSE, in press). Following oral (drinking-water) administration of vanadyl sulfate (tetravalent Vanadium), the half-time for elimination via urine in rats was calculated to be around 12 days (this is in contrast to the initial short half-time seen in humans, presumably reflecting post-exposure clearance from the bloodstream, followed by a more gradual release from other body compartments). The pattern of Vanadium distribution and excretion indicates that there is potential for accumulation and retention of absorbed Vanadium, particularly in the bone. One oral study in which groups of 22 pregnant mice received vanadyl sulphate pentahydrate at doses of 0, 38, 75, or 150 mg/kg body weight per day by oral gavage (Paternain et al., 1990) indicates that tetravalent Vanadium has the ability to cross the placental barrier to the fetus.
HERAG FACT SHEET Page 23 of 46 Gastrointestinal uptake and absorption & catalogue of toxicokinetic models
A 1.3: Oral absorption data on metals made available by metal industry associations A 1.3.1: Cobalt GI absorption of Cobalt in humans has been found to vary from 18-97% of the administered dose depending on the type and dose of the Cobalt compound, and the nutritional status of the individual (Harp & Scoular, 1952; Smith et al., 1972; Sorbie et al., 1971; Valberg et al., 1969). Cobalt absorption was increased among individuals who were Iron deficient (31-71% absorption in Iron deficient subjects, 18-44% in controls) (Sorbie et al., 1971; Valberg et al., 1969). Cobalt is contained in vitamin B12, a cobalt complex with a pentadentate amine ligand and a cyano ligand. The absorption of vitamin B12 occurs by a complex yet specific pathway that involves the interaction of the molecule with factors in the stomach and intestine that facilitate absorption (Russel-Jones & Alpers, 1999). Several rat studies have found that soluble Cobalt chloride was 13-34% absorbed, whereas insoluble Cobalt oxides are only 1-3% absorbed (Ayala-Fierro et al., 1999; Barnaby et al., 1968; Hollins & McCullough, 1971; Kirchgessner et al., 1994; Schade et al., 1970; Taylor, 1962; Bailey et al., 1989; Collier et al., 1989; Patrick et al., 1989). Particle size did not affect GI absorption. Cobalt chloride (with 58Co tracer) that was complexed with histidine, lysine, glycylglycine, EDTA, casein, or glycine was absorbed less than free Cobalt chloride. Cobalt chloride administered in conjunction with cow’s milk resulted in significantly greater GI absorption (~40%) (Taylor, 1962). Water-soluble Cobalt compounds have been found to exhibit greater absorption than non-water soluble forms (Deka et al., 1981; Firriolo et al., 1999; Inaba et al., 1980; Kinoshita & Fujita, 1972). As in humans, Iron deficiency increased Cobalt absorption while simultaneous administration of Cobalt and Iron resulted in less Cobalt absorption (Reuber et al., 1994; Schade et al., 1970). As oral Cobalt doses increase, fractional absorption decreases (Houk et al., 1946; Kirchgessner et al., 1994; Taylor, 1962). Similar to humans, water soluble forms of Cobalt are better absorbed than less soluble forms (Kreyling et al., 1986). Rats and guinea pigs aged 1-60 days have 3-15 fold greater absorption than adult animals aged 200 days or more (Naylor & Harrison, 1995). Species differences in absorption rates have not been observed, however, absorption of soluble Cobalt compounds is greater in rats (13-34%) than in cows (1-2%) and guinea pigs (4-5%) (Bailey et al., 1989; Ayala-Fierro et al., 1999; Barnaby et al., 1968; Hollins & McCullough, 1971; Kirchgessner et al., 1994; Naylor & Harrison, 1995; Schade et al., 1970; Taylor, 1962; van Bruwaene et al., 1984). A 1.3.2: Aluminium Data submitted by industry originates from ingestion studies using Al-26 labelled compounds (Priest et al. 1996 and 1998). Aluminium citrate and aluminium hydroxide were selected as test compounds in the first study, since experience with a wide range of other metals and the availability of literature for aluminium suggested that the soluble aluminium citrate complex would be amongst the most bioavailable aluminium compounds, while the hydroxide, as a relatively insoluble substance, would be amongst the least bioavailable. Aluminium hydroxide was also tested with simultaneous application of citrate. The fractional absorption in the gastro-intestinal tract was estimated using orally administered doses of the Al-26 labelled compounds, and quantifying the tracer in the urine of two volunteers. A correction was applied using a urinary excretion factor obtained from previously undertaken injection studies. The following fractional absorption rates in the gastro-intestinal tract were reported: Aluminium citrate: 5.2 · 10
-3 (0.5 %)
Aluminium hydroxide: 1.0 · 10-4
(0.01 %) Aluminium hydroxide with citrate: 1.4 · 10
-3 (0.1 %)
The co-administration of citrate with aluminium hydroxide clearly enhanced GI uptake. Priest assessed these fractional absorption factors as being consistent with other published data, obtained in studies with stable aluminium or calculations based on biokinetic measurements. In a further study involving drinking water supplemented with Al-26, the fractional absorption in the GI tract was also determined using the recovery in urine and adjusting with a urinary excretion factor obtained from injection studies:
HERAG FACT SHEET Page 24 of 46 Gastrointestinal uptake and absorption & catalogue of toxicokinetic models
Aluminium in drinking water: 2.2 · 10
-3 (0.22 %)
The results of this second study, particularly since it was undertaken under fasted conditions (when absorption may be higher) show that drinking water is unlikely to be a major source of aluminium uptake into the body. These studies have also been summarised recently in a landmark review on the biological behaviour and the bioavailability of aluminium in man (Priest 2004). A 1.3.3: Iron Iron has not been previously evaluated by the Joint FAO/WHO Expert Committee on Food Additives. WHO reports on Nutritional Requirements are available for Iron (WHO, 1970, 1973 and 1974), and Iron oxides have been evaluated for an acceptable daily intake for man (based on use as colours), by the Joint FAO/WHO Expert Committee on Food Additives in 1974, 1978 and 1979. An ADI of 0.5 mg/kg bw was established. No toxicological monograph was issued. On the absorption of Iron upon ingestion, the most recent IPCS (2006) document states: The amount of dietary iron absorbed depends on many factors including dietary ingredients, source of dietary iron, iron content of the diet and the body needs for iron. Studies in which a single foodstuff biosynthetically labelled with Fe-55 (vegetables grown in hydroponic media containing Fe-55, and meat from animals injected i.v. with Fe-55) was fed to normal human subjects showed that food iron of animal origin was better absorbed than that of vegetable origin (5-20% for meats, as opposed to 1-10% for vegetable iron) (Layrisse et al., 1973). A number of inhibitors and enhancers of non-haeme iron absorption have been identified, including carbonates, oxalates, phosphates and tannates, whereas other substances can increase absorption, such as ascorbic acid, tricarboxylic acids, amino-acids and sugars (Conrad, 1970). A 1.3.4: Chromium The authors have been made aware (by Eurofer) of an on-going risk assessment on “trivalent” Chromium. However, the outcome of this was not made available prior to finalisation of this fact sheet version. Therefore, the following extract from the WHO IPCS (1988) document is cited here: The absorption of ingested chromium compounds can be estimated by measuring the amount of chromium excreted in the urine, as almost all of intravenously injected chromium is excreted via the urine and only 2% is found in the faeces. Many trivalent chromium compounds are so poorly absorbed that they have been used as faecal markers in man and animals. In rats, trivalent chromium compounds are less well absorbed than chromates, with reported efficiencies ranging from less than 0.5% (Visek et al., 1953) to 3% (Mertz et al., 1965a). Within the category of trivalent compounds, there are moderate differences in absorption, depending on the chemical form. Binding of the chromium ion to suitable ligands, such as certain organic acids, stabilizes the metal against precipitation in the alkaline milieu of the intestines and increases absorption efficiency by a factor of 3 - 5 times, compared with that for chromium chloride. The absorption of trivalent Chromium in humans is reported by Donaldson & Barreras (1966) with a mean absorption efficiency of only 0.5 ± 0.3% for trivalent chromium, administered as CrCl3 x 6H2O, with a range of 0.1 - 1.2%. On the basis of the chromium content in diets (60 µg) and chromium excretion (0.22 µg) in healthy subjects, Anderson et al. (1983) calculated a minimum chromium absorption of about 0.4%. Increasing intake by supplementation with chromium (chromic chloride tablets, furnishing 200 µg chromium/day) led to an excretion of 0.99 µg, equivalent to 0.4% of the intake. In a recent study, the minimum chromium absorption calculated on the basis of urinary-chromium excretion was about 0.4%. Increasing intake 5-fold, by chromium supplementation, led to a nearly 5-

HERAG FACT SHEET Page 25 of 46 Gastrointestinal uptake and absorption & catalogue of toxicokinetic models
fold increase in chromium excretion, suggesting that the extent of absorption of supplemental inorganic chromium was similar to that from normal dietary sources (Anderson et al., 1983a). A similar absorption for trivalent chromium of 0.69% was reported by Doisy et al. (1968) in healthy human subjects, regardless of age. However, a group of 14 insulin-requiring diabetic patients absorbed 4 times as much of the chromium dose as the non-diabetic or maturity-onset diabetic subjects, as shown by elevated levels of 51chromium in blood plasma and urine (Doisy et al., 1971).
HERAG FACT SHEET Page 26 of 46 Gastrointestinal uptake and absorption & catalogue of toxicokinetic models
A 2: Detailed description of metal-specific toxicokinetic and toxicodynamic models
The model summaries given in subchapter A 2.1 originate largely from previous or current experience in EU ESR or Voluntary Risk Assessments, and are therefore presented in some detail including a brief critique on their reliability and/or usefulness. In contrast, subchapter A 2.2 below contains short descriptions on toxicokinetic models extracted from peer-reviewed experts summaries such as WHO EHC, ATSDR etc.
A 2.1: Lead A 2.1.1: Introduction Very advanced models for gastrointestinal uptake as a function of intake level, chemical speciation, matrix effects etc. are available for Lead and Lead compounds. Sophisticated modelling of Lead uptake, including through the use of toxicokinetic models, has thus been conducted in multiple EU and non-EU national jurisdictions. For Lead this has further extended to the development and validation of in vitro test systems for the prediction of Lead bioavailability in matrices such as soils. Uptake assumptions similar to those employed in EU Risk Assessments have been used by agencies such as IPCS, IARC, and US EPA. Recent developments within the US are beginning to promote the use of more sophisticated modelling assumption and toxicokinetic models for Risk Assessment of Cadmium. This is being paralleled by the development/validation of in vitro tools for in vitro bioavailability assessment. Classical toxicokinetic models are similar to physiologically based models since both models employ mass balance equations with rate constants that have dimensions of flow rate. However, the fundamental distinction between these two models is that the PBPK models have a rate constant that is a physiologically based parameter whereas in the classical models precise physiological correlates to model parameters may not exist. Both the PBPK and classical toxicokinetic models have valid applications in Lead risk assessment. Both approaches can incorporate capacity-limited or non-linear kinetic behaviour in parameter estimates. An advantage of classical toxicokinetic models is that because the kinetic characteristics of the compartments of which they are composed are not constrained, a best possible fit to empirical data can be arrived at by varying the values of the parameters. However, such models are not readily extrapolated to other species because the parameters do not have physiological correlates and they also do not simulate changes in bone metabolism, tissue volumes, blood flow rates, and enzyme activities associated with pregnancy, adverse nutritional states, aging, or osteoporotic disease. Therefore, extrapolation of classical compartmental model simulations outside the age and exposure ranges for which they have been calibrated is assumed to be less reliable than for PBPK model simulations. Three toxicokinetic models are currently being considered for broad application in Lead risk assessment. (1) The O’Flaherty Model is a physiologically based toxicokinetic (PBPK) model for children and adults (O’Flaherty 1993, 1995a/b); (2) the Integrated Exposure Uptake Biokinetic (IEUBK) Model for Lead in children developed by EPA (1994a, 1994b); and (3) the Leggett Model for children and adults (Leggett 1993). Of the three approaches only the O’Flaherty Model uses physiologically based parameters to describe the volume, composition, and metabolic activity of blood and tissues that determine the disposition of Lead in the human body. Both the IEUBK Model and the Leggett Model are classic multi-compartmental models; the values of the age-specific transfer rate constants are based on kinetic data from studies in animals and humans, and may not have precise physiological correlates. From a toxicological perspective, the O’Flaherty model should provide the more robust predictions of Lead uptake and metabolism for the greatest range of ages and under the broadest spectrum of exposure conditions (Lakind, 1998). A 2.1.2: The O’Flaherty Model The O’Flaherty model is a physiologically based toxicokinetic (PBPK) model of Lead uptake and disposition in children and adults. The model includes the movement of Lead from exposure media (i.e., intake via ingestion or inhalation) to the lungs and gastrointestinal tract, followed by the
HERAG FACT SHEET Page 27 of 46 Gastrointestinal uptake and absorption & catalogue of toxicokinetic models
subsequent exchanges between blood plasma, liver, kidney, richly-perfused tissues, poorly-perfused tissues, bone compartments, and excretion from liver and/or kidney. The model does not contain a detailed exposure module; however, Lead exposure estimates are incorporated into the model as age-specific point estimates of average daily intake (µg/day) from inhalation, or total ingestion via diet, dust, Lead-based paint, soil, and water. Since many of the toxicokinetic functions are based on body weight and age, the model can be used to estimate blood and bone Lead concentrations across a broad age range, including infants, children, adolescents, and adults. As a consequence of the model’s incorporation of multiple body compartments and into it’s predictions of exposure impacts, in particular bone Lead deposition and mobilization, deviations from the simplistic uptake assumptions noted earlier are adopted. Uptake of Lead from the gastrointestinal tract in adults is assumed to be 8%. High uptake rates (58%) are assumed for children at birth but decline to adult uptake rates by eight years of age. The model uses physiologically based parameters to describe the volume, composition, and metabolic activity of blood, soft tissues, and bone that determine the disposition of Lead in the human body. The model may be modified to simulate the toxicokinetics of Lead in potentially sensitive subpopulations, including pregnant women and foetuses, as well as older adults. It can also be used to predict Lead concentrations in bone and other tissue compartments, in order to evaluate correspondence between predicted tissue concentrations and observed concentrations in different populations of children and adults. The O’Flaherty model has not been validated under the same wide range of exposure conditions in which the IEUBK model has been applied. However, it would be anticipated that conditions which modulate the uptake of Lead from environmental media (e.g. variations of Lead in soil bioavailability) would require the model to be adjusted for site-specific conditions if accurate predictions are to be made for the impact of environmental Lead in these compartments. This will be particularly true for young age groups whose blood Lead levels are heavily influenced by Lead in soil and dust. Model performance for exposure assessment will exhibit greater accuracy when applied to older age groups whose blood Lead levels are primarily influenced by Lead in air, water and food and internal remobilisation of Lead from bone. Variations in bioavailability will be far less extensive and would not have a significant impact upon estimation of Lead uptake. The accuracy of model predictions has been examined and validated under conditions of occupational exposure (Fleming et al., 1999), general population exposure conditions (O’Flaherty, 1995a,b), and under altered physiological states such as pregnancy and osteoporosis (O’Flaherty, 2000; Inskip et al., 1997). Variations of the model adapted for rodents have further been used to back-calculate bioavailability of environmental Lead based upon observed blood Lead levels (Polak et al., 1996). As a consequence of non-linearity’s in toxicokinetics, blood Lead does not increase as a linear function of Lead dose. Similar non-linearities are predicted by all of the exposure assessment models described here. In addition, the relationship between Lead exposure and blood Lead will vary as a function of variables already discussed such as age (children will have higher Lead uptake rates than adults) and exposure media (Lead in soil and dust is not as available for uptake as dietary Lead). The ability to factor all such variables into predictions of blood Lead from multi-media exposure is one of the strengths of modern computer exposure assessment models. A 2.1.3: The IEUBK Model
7
The Integrated Exposure Uptake and Biokinetic (IEUBK) Model for Lead in Children is a classical multi-compartmental toxicokinetic model linked to an exposure and probabilistic model of blood Lead distributions in populations of children 0-7 years. The model has four distinct components: 1) exposure component, in which average daily intake of Lead (µg/day) is determined from exposure to Lead in air, diet, dust, Lead-based paint, soil and water; 2) uptake component, which converts media-specific Lead intake rates produced by the exposure component into media-specific uptake rates (µg/day) for the blood plasma; 3) biokinetic component, which simulates the transfer of absorbed Lead between blood and other body tissues, or elimination of Lead from the body via urine, faeces, skin, hair, nails; and 4) probability distribution component, which applies a geometric standard deviation to estimate the lognormal distribution of blood Lead concentrations in the exposed population.
7 This model has recently (September 2005) been made available for download as a Windows
® version (IEUBKwin v1.0 build
262, 32-bit version) at the following link: www.epa.gov/superfund/programs/lead/products.htm
HERAG FACT SHEET Page 28 of 46 Gastrointestinal uptake and absorption & catalogue of toxicokinetic models
The IEUBK Model was developed to predict the probability of elevated blood Lead concentrations in children. The model addresses three components of human health risk assessment: 1) the multimedia nature of exposures to Lead; 2) Lead toxicokinetics; and 3) significant variability in exposure and risk. However, the model lacks the capacity to model the complex interactions that occur with the deposition and remobilisation of Lead in bone as a function of growth through adulthood. Thus, the IEUBK model can only be used to predict the probability that children aged 6 months to 7 years exposed to Lead in multiple environmental media will have Lead concentrations exceeding a health-based level of concern (i.e., 10 µg/dL). These risk estimates can be useful in assessing the possible consequences of alternative Lead exposure scenarios following intervention, abatement, or other remedial actions. Application of the model to adult exposures is not recommended since the model lacks the ability to model important features of bone Lead deposition and mobilisation that can be major determinants of adult blood Lead levels. Although restricted in its application to children, the IEUBK is the most widely validated exposure assessment model and has been applied under a variety of exposure conditions. The model accurately predicts the mean blood Lead level of a population in situations where soil Lead has high bioavailability (Biesiada and Hubicki, 1999; U.S EPA, 1994 a&b). The model further estimates the variability of blood Lead levels in a population through application of a geometric standard deviation (GSD) to the estimated population average. Selection of an appropriate GSD can be problematic in that use of a GSD assumes homogeneity in exposure sources that may not exist (Griffin et al., 1999a). As a result, although the model may accurately estimate the average blood Lead in a population of children, significant overestimation of the number of children with elevated blood Lead levels (the upper tail of the distribution) may result (Bowers and Mattuck, 2001). IEUBK can significantly overestimate general population blood Lead averages for children. The relative bioavailability of Lead in soil can range from 1% to 100% of that assumed by the model (U.S. EPA, 2004), with lower relative bioavailability being characteristic of mining sites (Bowers and Mattuck, 2001; U.S. EPA, 2004) or sites of historical contamination (Cotter-Howells and Thornton, 1991). The IEUBK also calculates a relationship between the concentration of Lead in soil and the concentration of Lead in dust. In the absence of site specific dust concentration data, the default dust Lead concentrations calculated can be overly conservative and result in significant overestimation of exposure risk (Griffin et al., 1999b). Accurate prediction of general population blood Lead levels can thus require adjustment of assumptions regarding soil Lead bioavailability and dust Lead concentrations. Finally, IEUBK predictions are highly sensitive to amounts of soil ingestion that are presumed to occur. Combined soil and dust ingestion amounts assumed are age-specific and range up to 135 mg per day for very young children. This assumed level of soil intake will be a source of inaccuracy in urban environments where access to bare soils will be far more limited than in rural environments (Bowers and Mattuck, 2001) and result in overestimation of average blood Lead levels. IEUBK predictions resulting from default assumptions of high soil Lead bioavailability, soil to dust transfer and soil ingestion rates will provide a conservative (protective) estimate of the impact of environmental Lead upon the blood Lead levels of children. Initial model predictions are thus often used as “screening levels” that trigger more in depth site investigations that generate data which permit the model to be calibrated to the exposure conditions under study. A 2.1.4: All Ages Lead Model (AALM) Since the IEUBK model lacks a biokinetic core that adequately predicts bone Lead deposition and remobilisation, IEUBK is restricted in application to children of an age of up to seven years. US EPA has recently attempted to remedy this situation through the development of the All Ages Lead Model (AALM), and released a “beta version” of the AALM for public comment and review by its external Science Advisory Board (SAB) in October, 2005 (US EPA, 2005b). The model essentially consists of an exposure module similar to that of IEUBK coupled to one of two biokinetic cores based upon the O’Flaherty PBPK model (discussed in the preceding section) and the Legget model (to be discussed next). Both biokinetic cores model human bone Lead metabolism and are used in an effort to impart the AALM with the ability to comprehensively model multi-pathway Lead exposure in both children and adults.
HERAG FACT SHEET Page 29 of 46 Gastrointestinal uptake and absorption & catalogue of toxicokinetic models
Subsequent review of the AALM beta version by SAB and the public has indicated that the computer model is not yet ready for use as a tool in Lead exposure assessment (Risk Policy Report Daily News, 2005). Problems cited include inadequate documentation, inadequately defined default exposure values and biokinetic parameters, a less than ideal user interface, apparently erroneous model predictions and potential coding errors. A formal report will be issued by SAB in April of 2006 and is expected to encouraging further model development. EPA will then undertake revision of the model with the next prototype version expected to be available for external review in late 2006. Satisfactory review would then presumably be followed by validation exercises – actual availability of an AALM for Lead exposure assessment studies and standard setting would not be expected, at the earliest, until 2007. A 2.1.5: The Leggett Model The Leggett Model is a classical multi-compartmental toxicokinetic model of Lead uptake and disposition in children and adults (Leggett 1993). The model includes the movement of Lead from exposure media (i.e., intake via inhalation or ingestion) to the lungs and gastrointestinal tract, followed by the subsequent exchanges between diffusible blood plasma, soft tissues, bone compartments, and excretion from liver, kidneys, and sweat. As a classical compartment model, tissue compartments, kinetic constants, and model parameters may not all have physiological correlates. Unlike the IEUBK Model, the Leggett Model is not linked to a detailed exposure model. Instead, Lead exposure estimates are incorporated into the model as age-specific point estimates of average daily intake (µg/day) from inhalation and ingestion. The Leggett Model can be used to predict blood Lead concentrations in both children and adults. The model allows the simulation of lifetime exposures, including assumptions of blood Lead concentrations at birth (from which the levels in other tissues directly after birth are calculated). Thus, exposures and absorption of Lead prior to any given period of time during the lifetime can be simulated with the Leggett model. The model does require assumptions regarding total Lead intake from multiple exposure media and it does not contain a probabilistic modelling component and cannot, therefore, be used to predict blood Lead distributions in exposed populations. Since it lacks a detailed exposure input module, the Legget model has had minimal application in estimating exposure resulting from environmental Lead. Model utility could, in theory, be similar to that of the O’Flaherty model. Like the O’Flaherty model it can be applied to predict Lead metabolism in individuals of all ages. However, since an exposure input component has not been successfully added to the model, it will not be used in this assessment. A 2.2: Nickel Several models have been published that characterize both the lung deposition and clearance (Edelman and Roggli 1989, Oberdörster 1989; Hsieh et al. 1999a, b, c; Yu et al. 2001), the systemic disposition of inhaled Nickel particles (Menzel 1988; Menzel et al. 1987) and the kinetics of systemic elimination using a two compartment model (IPCS, 1991 and references herein). A conceptual intracellular dosimetry model that could be used to estimate the delivered dose of Nickel ion to the nucleus of target cells was developed by K.S. Crump (1999, 2001). This model includes parameters for the differences in cellular uptake and intracellular kinetics for the different forms of Nickel. Moreover, published data have been identified for estimating all but two of the model parameters. However, the work on the intracellular model has not been completed. Specifically, the model needs to be parameterized using the identified data and validated using other data available in the literature. In addition, a sensitivity analysis must be conducted in order to determine which parameters most influence the model predictions. Finally, the intracellular dosimetry model must be integrated with the published deposition (Oberdörster 1989; Hsieh et al. 1999a, b, c) and systemic models (Menzel 1988) and the integrated model must be validated.
HERAG FACT SHEET Page 30 of 46 Gastrointestinal uptake and absorption & catalogue of toxicokinetic models
A 2.3: Cadmium A 2.3.1: Introduction Several models have been reported to describe the kinetics of Cadmium in mammalian systems. Of these models, the most widely used for Cadmium risk assessment has been the Nordberg-Kjellström model (Kjellström and Nordberg 1978; Nordberg and Kjellström 1979). Modified versions of this model have been used to interconvert external/exposure concentrations (e.g. dietary intake) and internal Cadmium dose estimates (e.g. Cadmium in urine), allowing a direct comparison of dose-response relationships across studies that may otherwise be incomparable (Choudhury et al. 2001; Diamond et al., 2003; RAR CdO/Cd metal 2003). The Shank (Shank et al., 1977) and Matsubara-Khan (Matsubara-Khan, 1974) models are not as useful for human risk assessment applications, but provide useful insights into the absorption, distribution, and compartmentalisation of Cadmium in laboratory animals (ATSDR, 1999a). A 2.3.2: The Nordberg-Kjellström model The Nordberg-Kjellström model (Kjellström and Nordberg, 1978; Kjellström and Nordberg, 1985) is a linear eight-compartment kinetic model, largely based on human data, which can be divided into four parts with different functions: absorption and uptake, transport and distribution, excretion, and retention and accumulation. The model assumes that Cadmium absorption occurs almost exclusively by the inhalation or the gastro-intestinal route, and describes the disposition of Cadmium via these exposure routes followed by the subsequent exchanges between blood, liver, kidney and other tissues compartments, and its excretion via faeces or in the urine. Dermal exposure and subsequent absorption of Cadmium through the skin are thus considered as being negligible. For inhalation exposures, the model accounts for different deposition patterns for different size particles in nasopharyngeal, tracheo-bronchial, and alveolar regions of the respiratory tract and takes mucociliary clearance processes into account. Cadmium intake via the gastro-intestinal tract consists of the Cadmium present in contaminated food or water contaminated by Cadmium, and the Cadmium embedded in mucus from the respiratory tract. By either route of exposure, the model assumes that Cadmium enters into any of three blood compartments (the plasma compartment where Cadmium binds to albumin or other organic constituents; the red blood cell compartment and the binding of Cadmium to metallothionein). From the blood, Cadmium is calculated to distribute to the liver, kidney, or “other tissues” (particularly muscles, skin and bone). Half lives in those target tissues can be estimated. Almost all Cadmium is excreted via faeces and urine. The transport of Cadmium between the compartments is assumed to follow first-order exponential functions and is driven on concentration-dependent gradients (Kjellström and Nordberg, 1985; ATSDR, 1999). The Nordberg-Kjellström model has been validated using several independent sets of human data, from both Sweden and Japan (Friberg et al., 1974, Elinder et al., 1978; Piscator 1972, Piscator 1974 cited in Kjellström and Nordberg, 1978). The strengths of the model are its development based on data collected from humans intended for human risk assessment applications. It has been shown to adequately predict fluid and tissue concentrations via the oral and inhalation routes of exposure for humans exposed to low doses of Cadmium. The model accounts for the loss of renal tubular epithelial cells (leading to a loss of tubular reabsorptive capacity) and also corrects for differences in tissue weights with relation to age and ethnicity. However, the model has difficulty in adequately predicting fluid and tissue concentrations in humans exposed to high concentrations of Cadmium, especially for those individuals highly exposed by inhalation (e.g. workers). Two other limitations to this model have also been noted by Frazier (1994): a) the linear nature of the model that may not adequately allow a good description of known nonlinearities in biological responses to Cadmium dosing, and b) the phenomenological approach taken with this model that does not provide a foundation for incorporating biological variability into the model parameters (ATSDR, 1999). A modified version of the Nordberg-Kjellström model has been reported by Choudhury et al. (2001). Dietary Cadmium intakes in the U.S. population were estimated, based on food Cadmium
HERAG FACT SHEET Page 31 of 46 Gastrointestinal uptake and absorption & catalogue of toxicokinetic models
concentrations and consumption patterns data, and those estimates were subsequently used in the Cadmium Dietary Exposure Model (CDEM) to derive predictions of kidney and urinary Cadmium that would reflect both US intake and related variability. Diamond et al. (2003) used the same modifications to the model to estimate health risks from dietary Cadmium exposure in the US population. As the model allows inter-converting external and internal Cadmium dose estimates, dose-response functions relating low-molecular weight proteinuria in exposed populations to Cadmium dose and reported in 15 epidemiological studies could directly be compared. Estimates of the dose (dietary Cadmium intake or urinary Cadmium excretion or tissue Cadmium burden) corresponding to a defined probability of occurrence of low-molecular weight proteinuria (10, 15 or 20%) were extrapolated from the reported dose units into corresponding estimates of target organ dose (µg Cd/g renal cortex), and the risk of attaining this target dose was predicted (Diamond et al., 2003). In the EU CdO/Cd Metals Risk Assessment (2003), a one-compartment model derived from the model of Nordberg-Kjellström was used to convert Cadmium dietary intakes into Cadmium concentrations in urine. The assumptions behind this modified model are similar to those on which the Nordberg-Kjellström relies, and its validity could be verified to some extent by comparing by the model calculated- and measured Cadmium in urine data in exposed populations. Two independent data sets were used for this purpose and chosen because of the quality and the quantity of the data. The derived urinary values were compared with the LOAEL. A 2.3.3: The Shank Model The Shank model represents the dynamic transport of Cadmium between compartments in a mammalian biological system based on male adult mice as the test animal species. The intent of this 9-compartment model was to predict the retention of Cadmium in other animal species (including humans) without requiring an adjustment of species-specific rate constants from within the model. Cadmium kinetics between compartments is described by first-order kinetics, and three data sets were used to validate it. The model appears to adequately predict the amount of Cadmium retention in the target organs of laboratory animals (liver, kidney, pancreas, spleen, gastro-intestinal tract, testes, and carcass). However, the model is of limited use for a human Cadmium risk assessment because it only displays the short-term situation after acute/short-term exposure (intravenous or subcutaneous injection), and as no human data were presented to validate the model’s effectiveness in predicting Cadmium retention in human target tissues (ATSDR, 1999; Shank et al., 1977). A 2.3.4: The Matsubara-Khan Model This model attempted to fit Cadmium elimination kinetic parameters into either a 1- or 2-compartment model. Data were obtained using male and female mice exposed to Cadmium chloride, either administered subcutaneously (single injection) or by gavage. Rate of uptake, rate constants, and biological half-lives in several tissues were determined. However, no independent data sets were used to validate the findings. This model has not been used as a tool in risk assessment in humans but demonstrates that Cadmium kinetics (and half-lives) varies by tissue (Matsubara-Khan 1974, ATSDR 1999). A 2.4: Aluminium A 2.4.1: The ICRP model for Aluminium Until about 1990, the only comprehensive physiological-data-based toxicokinetic model for Aluminium was that of the International Commission on Radiological Protection (ICRP 1981). In this simple model it was assumed that of the entire Aluminium leaving the blood (the transfer compartment), a fraction of 0.3 is translocated to mineral bone and a fraction of 0.7 is uniformly distributed throughout all other organs and tissues of the body. The biological half-life of all Aluminium deposited in any organ or tissue was assumed to be 100 days, a value compatible with the daily intake and total body content of Aluminium given for the ICRP Reference Man (ICRP 1975). The ICRP model was briefly included in a recent review report (Priest 2004) and found to be at variance with data generated by studies using 26
Al. This is not surprising due to the limited data availability at the time of the development of this model. For the fractional absorption of the radionuclide
26Al in the gastrointestinal tract (f1 factor), the
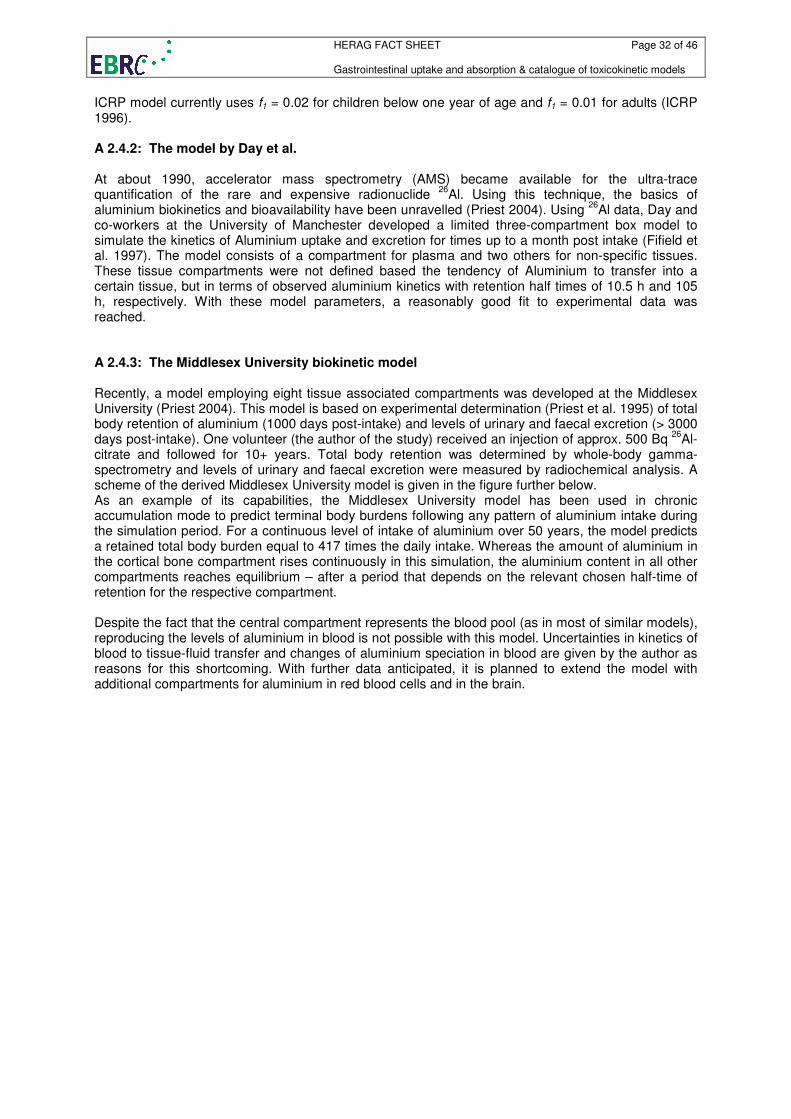
HERAG FACT SHEET Page 32 of 46 Gastrointestinal uptake and absorption & catalogue of toxicokinetic models
ICRP model currently uses f1 = 0.02 for children below one year of age and f1 = 0.01 for adults (ICRP 1996). A 2.4.2: The model by Day et al. At about 1990, accelerator mass spectrometry (AMS) became available for the ultra-trace quantification of the rare and expensive radionuclide
26Al. Using this technique, the basics of
aluminium biokinetics and bioavailability have been unravelled (Priest 2004). Using 26
Al data, Day and co-workers at the University of Manchester developed a limited three-compartment box model to simulate the kinetics of Aluminium uptake and excretion for times up to a month post intake (Fifield et al. 1997). The model consists of a compartment for plasma and two others for non-specific tissues. These tissue compartments were not defined based the tendency of Aluminium to transfer into a certain tissue, but in terms of observed aluminium kinetics with retention half times of 10.5 h and 105 h, respectively. With these model parameters, a reasonably good fit to experimental data was reached. A 2.4.3: The Middlesex University biokinetic model Recently, a model employing eight tissue associated compartments was developed at the Middlesex University (Priest 2004). This model is based on experimental determination (Priest et al. 1995) of total body retention of aluminium (1000 days post-intake) and levels of urinary and faecal excretion (> 3000 days post-intake). One volunteer (the author of the study) received an injection of approx. 500 Bq
26Al-
citrate and followed for 10+ years. Total body retention was determined by whole-body gamma-spectrometry and levels of urinary and faecal excretion were measured by radiochemical analysis. A scheme of the derived Middlesex University model is given in the figure further below. As an example of its capabilities, the Middlesex University model has been used in chronic accumulation mode to predict terminal body burdens following any pattern of aluminium intake during the simulation period. For a continuous level of intake of aluminium over 50 years, the model predicts a retained total body burden equal to 417 times the daily intake. Whereas the amount of aluminium in the cortical bone compartment rises continuously in this simulation, the aluminium content in all other compartments reaches equilibrium – after a period that depends on the relevant chosen half-time of retention for the respective compartment. Despite the fact that the central compartment represents the blood pool (as in most of similar models), reproducing the levels of aluminium in blood is not possible with this model. Uncertainties in kinetics of blood to tissue-fluid transfer and changes of aluminium speciation in blood are given by the author as reasons for this shortcoming. With further data anticipated, it is planned to extend the model with additional compartments for aluminium in red blood cells and in the brain.
HERAG FACT SHEET Page 33 of 46 Gastrointestinal uptake and absorption & catalogue of toxicokinetic models
Note: since no data for the distribution of the tracer within the body exists, the box descriptors are considered indicative – although they are consistent with a bone-seeking nuclide. A 2.4.4: The model by Nolte et al. An open compartment model for aluminium biokinetics in man and rat has been presented by Nolte et al. (2001). The two central compartments of this model are blood plasma and the interstitial fluid with transferrin- and citrate-bound aluminium considered in both compartments. Peripheral compartments for organs, muscles, bones and the gastrointestinal tract complete the model (see figure below). The transport of Aluminium between the compartments is described with rate constants, which are normalised to an estimated plasma volume (= normalised compartment size). This results in the model being applicable to aluminium biokinetics of both humans and rats with a rather similar set of parameters. The model was applied to biokinetics studies with
26Al in man and rats. Very good compliance of the
predicted time-dependant concentrations of Al with the experimental data from a human volunteer study (Priest et al. 1995) was reached for blood plasma, urine and faeces. This was the same data set used for the Middlesex University model (Priest 2004, see above). In the study with rats, which were sacrificed 24h post oral administration of
26Al, static concentrations were measured in plasma, liver
and spleen, bones and urine. Rats with a different physiological status were studied: normal Iron status, Iron overload, Iron deficiency and nephrectomised rats. The experimental data was matched well by the model predictions for each physiological status.
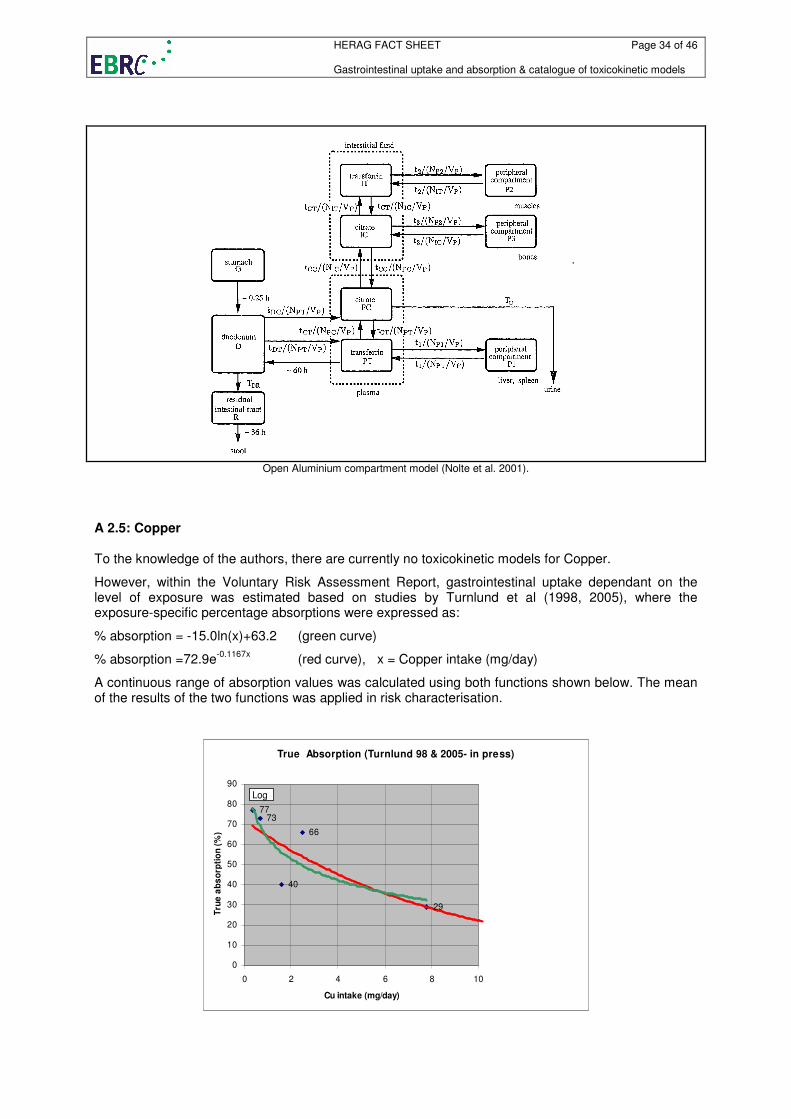
HERAG FACT SHEET Page 34 of 46 Gastrointestinal uptake and absorption & catalogue of toxicokinetic models
Open Aluminium compartment model (Nolte et al. 2001).
A 2.5: Copper To the knowledge of the authors, there are currently no toxicokinetic models for Copper.
However, within the Voluntary Risk Assessment Report, gastrointestinal uptake dependant on the level of exposure was estimated based on studies by Turnlund et al (1998, 2005), where the exposure-specific percentage absorptions were expressed as:
% absorption = -15.0ln(x)+63.2 (green curve)
% absorption =72.9e-0.1167x
(red curve), x = Copper intake (mg/day)
A continuous range of absorption values was calculated using both functions shown below. The mean of the results of the two functions was applied in risk characterisation.
True Absorption (Turnlund 98 & 2005- in press)
7377
66
40
29
0
10
20
30
40
50
60
70
80
90
0 2 4 6 8 10
Cu intake (mg/day)
Tru
e a
bs
orp
tio
n (
%)
Log
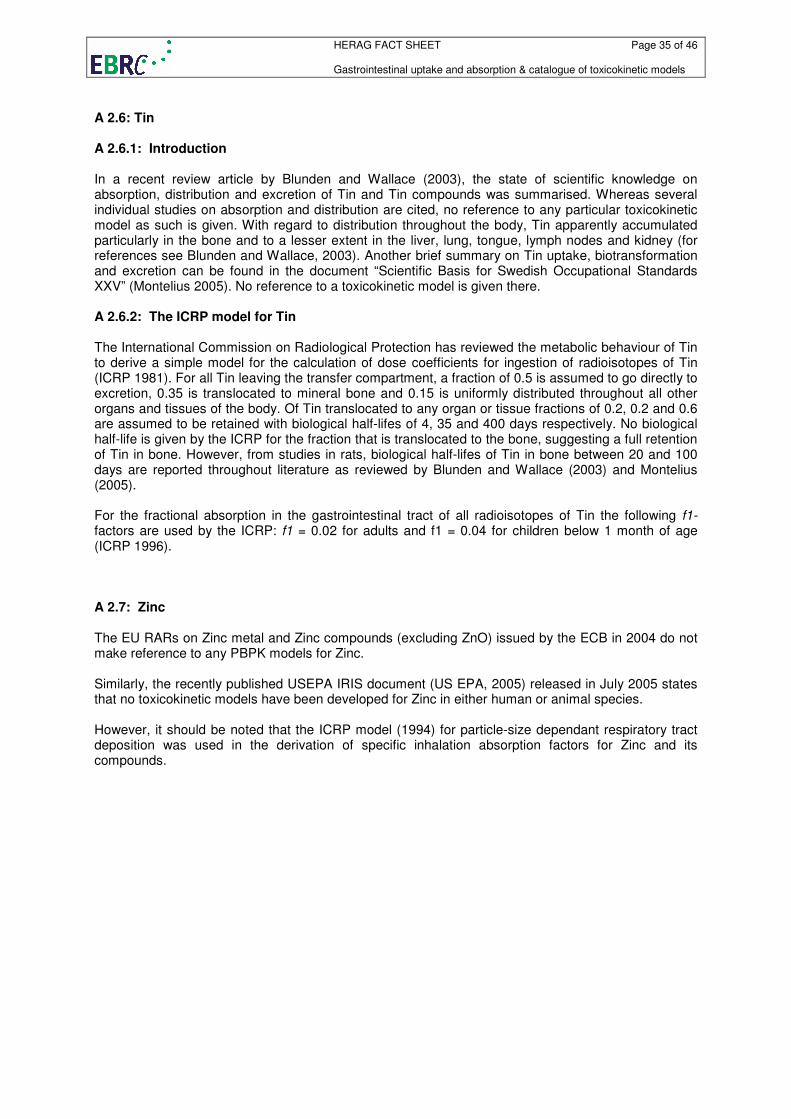
HERAG FACT SHEET Page 35 of 46 Gastrointestinal uptake and absorption & catalogue of toxicokinetic models
A 2.6: Tin A 2.6.1: Introduction In a recent review article by Blunden and Wallace (2003), the state of scientific knowledge on absorption, distribution and excretion of Tin and Tin compounds was summarised. Whereas several individual studies on absorption and distribution are cited, no reference to any particular toxicokinetic model as such is given. With regard to distribution throughout the body, Tin apparently accumulated particularly in the bone and to a lesser extent in the liver, lung, tongue, lymph nodes and kidney (for references see Blunden and Wallace, 2003). Another brief summary on Tin uptake, biotransformation and excretion can be found in the document “Scientific Basis for Swedish Occupational Standards XXV” (Montelius 2005). No reference to a toxicokinetic model is given there. A 2.6.2: The ICRP model for Tin The International Commission on Radiological Protection has reviewed the metabolic behaviour of Tin to derive a simple model for the calculation of dose coefficients for ingestion of radioisotopes of Tin (ICRP 1981). For all Tin leaving the transfer compartment, a fraction of 0.5 is assumed to go directly to excretion, 0.35 is translocated to mineral bone and 0.15 is uniformly distributed throughout all other organs and tissues of the body. Of Tin translocated to any organ or tissue fractions of 0.2, 0.2 and 0.6 are assumed to be retained with biological half-lifes of 4, 35 and 400 days respectively. No biological half-life is given by the ICRP for the fraction that is translocated to the bone, suggesting a full retention of Tin in bone. However, from studies in rats, biological half-lifes of Tin in bone between 20 and 100 days are reported throughout literature as reviewed by Blunden and Wallace (2003) and Montelius (2005). For the fractional absorption in the gastrointestinal tract of all radioisotopes of Tin the following f1-factors are used by the ICRP: f1 = 0.02 for adults and f1 = 0.04 for children below 1 month of age (ICRP 1996). A 2.7: Zinc The EU RARs on Zinc metal and Zinc compounds (excluding ZnO) issued by the ECB in 2004 do not make reference to any PBPK models for Zinc. Similarly, the recently published USEPA IRIS document (US EPA, 2005) released in July 2005 states that no toxicokinetic models have been developed for Zinc in either human or animal species. However, it should be noted that the ICRP model (1994) for particle-size dependant respiratory tract deposition was used in the derivation of specific inhalation absorption factors for Zinc and its compounds.
HERAG FACT SHEET Page 36 of 46 Gastrointestinal uptake and absorption & catalogue of toxicokinetic models
A 3: Short summaries of metal-specific toxicokinetic and toxicodynamic models
This chapter contains short descriptions on toxicokinetic models extracted from peer-reviewed experts summaries such as WHO EHC, ATSDR and CICAD (in contrast, A 2 presents model descriptions originating largely from previous or current experience in EU ESR or Voluntary Risk Assessments, and are therefore presented in some detail including a brief critique on their reliability and/or usefulness). Note that extracts were only taken from “recent” review documents (1999 and more recent), whereas for “older” reviews merely a citation is provided.
A 3.1: Arsenic Copied from ATSDR (2005a). A less recent review of this topic for Arsenic is also documented by WHO (2001a). The Mann model (Gentry et al. 2004; Mann et al. 1996a, 1996b), Yu model (Yu 1998a, 1998b; Yu 1999a, 1999b), and Menzel model (Menzel et al. 1994) are the PBPK models for Arsenic currently available. The Mann model simulates the absorption, distribution, metabolism, elimination, and excretion of As(+3), As(+5), MMA, and DMA after oral and inhalation exposure in mice, hamsters, rabbits, and humans. The Yu model simulates the absorption, distribution, metabolism, elimination, and excretion of As(+3), As(+5), MMA, and DMA after oral exposure to inorganic Arsenic in mice, rats, or humans. The Menzel model is a preliminary model that predicts internal organ burden of Arsenic during specific oral exposures, simulating the metabolism, distribution to organs and binding to organs in mice, rats, and humans (ATSDR, 2005). A 3.2: Barium Copied from ATSDR (2005b). Less recent reviews on Barium also addressing this topic are available from WHO (2001b and 1990a). No information on available PBPK models for barium has been identified. Instead, ATSDR (2005b) gives a Conceptual Representation of a Physiologically Based Pharmacokinetic (PBPK) Model for a Hypothetical Chemical Substance. The chemical substance is shown to be absorbed via the skin, by inhalation, or by ingestion, metabolized in the liver, and excreted in the urine or by exhalation. A 3.3: Beryllium Copied from ATSDR (2002). Less recent reviews on Beryllium also addressing this topic are available from WHO (2001c and 1990b). No information on available PBPK models for beryllium has been identified. Instead, ATSDR (2002) gives a Conceptual Representation of a Physiologically Based Pharmacokinetic (PBPK) Model for a Hypothetical Chemical Substance. The chemical substance is shown to be absorbed via the skin, by inhalation, or by ingestion, metabolized in the liver, and excreted in the urine or by exhalation. A 3.4: Manganese Copied from ATSDR (2000). Less recent reviews on Manganese also addressing this topic are available from WHO (1999 and 1981). A qualitative PBPK model for manganese disposition in humans and animals has recently been developed by Andersen et al. (1999). This model represents the current understanding of manganese nutrition and toxicology; because several data gaps exist concerning manganese toxicokinetics, this
HERAG FACT SHEET Page 37 of 46 Gastrointestinal uptake and absorption & catalogue of toxicokinetic models
model is anticipated to change with time (Andersen et al. 1999). The model, shown in Figure 2-6, is currently not designed to be quantitative in nature. The authors indicate that several data gaps prevent such an evaluation of manganese uptake, distribution, and excretion. For instance, there are inadequate data concerning oxidation rates for manganese in blood, uptake rates of protein-bound forms by the liver, neuronal transfer rates within the central nervous system, and quantitative data on systems controlling manganese uptake via the intestines and liver (such as transport mechanism in the intestines) (Andersen et al. 1999). Based on available information about the distribution of manganese in brain tissues, this model might also include a separate compartment for the brain or brain regions versus a general CNS compartment. Differences in transport of different oxidation states of manganese into the brain have been reported ( Murphy et al. 1991; Rabin et al. 1993). These differences may also be important parameters to consider in a PBPK model for manganese disposition. A 3.5: Mercury Copied from ATSDR (1999). Other reviews on Mercury are available (WHO 2003 and 1991) but do not address PBPK Models in similar detail. Note: both models discussed here are for methylmercury only. Summary of Mercury PBPK Models Two physiologically based toxicokinetic models have been developed recently that model the kinetics of methylmercury in rats. Farris et al. (1993) developed a PBPK model that simulates the long-term disposition of methylmercury and its primary biotransformation product, mercuric mercury, in the male Sprague-Dawley rat following a single oral nontoxic exposure. Gray (1995) developed a PBPK model that simulates the kinetics of methylmercury in the pregnant rat and fetus. The Gray model was developed to provide fetal and maternal organ methylmercury concentration-time profiles for any maternal dosing regimen. These model provide useful insight into the key physiological processes that determine the distribution and fate of mercury in the body, but neither model is currently being used in human risk assessment. Comparison Mercury PBPK Model Comparison Both the Farris et al. (1993) and the Gray (1995) PBPK models address the kinetics of methylmercury in rats. Both models provide useful insights into important physiological processes determining methylmercury distribution and changes in tissue concentrations. Also, both studies suggest further work to enhance the utility and accuracy of the models The Farris et al. model dealt more effectively with the conversion of methylmercury to mercuric mercury, while the Gray model specifically addressed fetal tissue concentrations as a function of maternal exposures and the extrapolation from short-term to continuous dosing. The latter is of direct relevance to methylmercury risk assessments currently based on human studies of short-term exposures, while the general public exposure is more typically continuous. Neither model ran simulations nor validated against data for other species (including human). Nor did the models address high-to-low dose extrapolations or different routes of exposure. Discussion of Models The Farris et al. Model for Methylmercury: The Farris et al. (1993) model is a physiologically based model that simulates the long-term disposition of methylmercury and its primary biotransformation product, mercuric mercury, in growing mammals following a single nontoxic oral dose of the parent compound. The test animal used to develop and validate the model was the male Sprague-Dawley rat. A tracer dose was used in the validation studies to preclude the possibility that the results would be biased by toxic or saturation effects. The model incorporates a number of features, including a time-dependent compartment for volume changes (i.e., the rats grew from 300 to 500 g in body weight over the 98-day time course of the validation study), compartment volume-dependent clearances, and the recycling of mercury from ingestion of hair by rats during grooming.
HERAG FACT SHEET Page 38 of 46 Gastrointestinal uptake and absorption & catalogue of toxicokinetic models
The Farris et al. model has not been used in human risk assessment. The authors, however, suggest that the model would be useful in developing a better understanding of species differences and in predicting the affects of altered biochemical or physiological states on methylmercury toxicokinetics. Description of the model: The Farris et al. model consists of nine lumped compartments, each of which represent a major site of mercury accumulation, elimination, or effect in mammals. The compartment labelled “carcass” is a residual compartment and consists of all tissues and organs not specifically represented by the other eight compartments in the model. Methylmercury transport between all compartments except brain and hair is modelled as plasma flow limited (i.e., plasma levels rapidly equilibrate with erythrocytes). Transport of both organic and inorganic mercury to brain and hair compartments is assumed to be limited by the blood-brain barrier and the rate of hair growth. Recycled mercury from ingested hair during grooming was assumed available for reabsorption from the gut lumen at 100% for methylmercury and 10% for inorganic mercury. The authors make the assumption that all of the inorganic mercury resulting from the demethylation of methylmercury is mercuric mercury. Farris et al. (1993) note that the precise site of demethylation is unknown, although the body’s tissues and the lumen of the gastrointestinal tract seem most likely. For convenience, however, they modeled demethylation entirely in the liver compartment. Bidirectional and symmetric transport of methylmercury between the gut tissue and lumen is assumed and modeled accordingly. Biliary secretion of both methylmercury and inorganic mercury are modeled as undergoing low-molecular weight nonprotein sulfhydryl (NPSH) secretion d-dependent transport. Methylmercury secreted into the gut lumen, either from biliary secretion or from the gut tissue, is modeled as being readily reabsorbed. In line with previous studies, the model sets a value of 10% for resorption of inorganic mercury secreted into the lumen from bile or from exfoliation of the gastrointestinal mucosal cells. The assumptions in the model were incorporated into a series of mass-balance differential equations that account for the changes in the amount of methylmercury and mercuric mercury in each compartment. The entire equation set was solved numerically using Gear’s method for stiff differential equations (Gear 1971). The initial mercury dose was administered at 100% methylmercury, administered as a bolus to the gut lumen compartment. The mass transport parameters listed in Table 2-6 were multiplied by the timedependent compartment volumes to give the mass transport parameters used in the model equations. Validation of the model: The Farris et al. model simulations were compared to an extensive set of data collected by the authors on the metabolism and distribution of an orally dosed bolus of radiolabeled methylmercury in male Sprague-Dawley rats. In a distribution study, tissue samples were collected on days 3, 7, 14, 21, 28, 35, 42, 49, 56, 63, 70, 77, 84, 91, and 98 post-dosing. In a metabolism study with the same dosing regimen, whole body counts and 24-hour feces and urine samples were collected daily for 15 days post-dosing, and then twice weekly. The model simulations were in close agreement with the observed results from the distribution and metabolism studies. Physiological processes that were highlighted by the results and the discrepancies that did occur include the probable active transport into the brain (versus passive diffusion) of a methylmercurycysteine complex, the bidirectional transport of methylmercury between the gut lumen and gut tissue as a more important determinant of methylmercury fecal excretion than biliary secretion, the importance for the determination of methylmercury half-life in rats of the recycling of mercury from ingested hair, and the need for better estimates of the rate constants for the demethylation of methylmercury in order to adapt the model to other species. No human data were presented to validate the model, and validation was not performed for other routes or duration of mercury exposure. Target tissues: The target tissues for this model included the blood, liver, gut, kidneys, and brain. Species extrapolation: The model was developed and validated using the male Sprague-Dawley rat. No other species were tested and data from other species were not used to validate the model. The authors, however, suggest that this model would prove useful in developing better rate constants or other important determinants of species differences (for example, demethylation rates, which differ based on differences in gut flora and tissue enzyme levels). The Gray Model for Methylmercury: The Gray (1995) PBPK model simulates the kinetics of methylmercury in the pregnant rat and fetus. The Gray model was developed to provide fetal and maternal organ methylmercury concentration-time profiles for any maternal dosing regimen.
HERAG FACT SHEET Page 39 of 46 Gastrointestinal uptake and absorption & catalogue of toxicokinetic models
The Gray model has not been used in human risk assessment. The author, however, suggests that the model would be useful to incorporate rat developmental toxicity data into the assessment of methylmercury risk. Specifically, the author suggests the model be used to convert the short-term exposure data from studies presently being used in risk assessments into continuous-exposure scenarios, which are more typical of the general public’s likely exposure pattern. Description of the model: The Gray model is a membrane-limited PBPK model for methylmercury developed using experimental data from the literature. The model parameters include constants for linear binding, membrane transfer, biliary transport, and gut reabsorption; and physiological parameters for tissue cellular and extracellular volumes and plasma flow rates. Mass balance equations were developed that describe the transport to all organ systems important to the distribution or toxicity of methylmercury to the pregnant rat or fetus. Mass balance equations were solved using an Advanced Continuous Simulation Language (ACSL) program developed by Mitchell and Gauthier Associates. The cell membrane is assumed to be the barrier for methylmercury transport for all tissues except the brain and placenta. The barrier to methylmercury transport to the brain is the endothelial cell wall of the cerebral vascular system (the blood-brain barrier). The placenta is modelled as four compartments, with separate transfer constants for placental barrier and placental tissue transport. There is a tissue compartment for both the maternal and fetal sides of the placenta. The linear binding constants were estimated directly from in vivo tissue distribution studies using the ratio of tissue to plasma concentrations at pseudoequilibrium. They represent the degree to which methylmercury binds to intracellular sites. Because the skin (which includes the outer layers of hair and the pelt) contained excreted methylmercury that does not exchange with plasma, the linear binding constant for a typical organ (in this case the liver) was used as the constant for skin. No experimental data were available for fetal red blood cell (RBC) binding, so the author made the assumption that the fetal RBC binding constant would be equal to the maternal RBC binding constant. The conversion of methylmercury into mercuric mercury in the gut is not explicitly calculated in the Gray model; instead, the calculated reabsorption rate of secreted or shed methylmercury in the gut implicitly accounts for the amount converted (i.e., the amount of demethylated mercury that subsequently would not be reabsorbed). Published data were used directly or to estimate values for the maternal and fetal extracellular space, maternal plasma volume and flow expansion during pregnancy, and maternal and fetal organ volumes and plasma flow. The model was run with a single intravenous bolus dose of 1 mg/kg at various times during a 22-day rat gestation period and compared with previously published (different author) maternal and fetal organ concentrations. The model was also run with a daily dosing for 98 days, ending on Gd 20, to simulate a typical human dietary exposure pattern for a frequent consumer of methylmercury-contaminated food. Validation of the model: The Gray model simulations were validated against published values in the literature for mercury concentrations in maternal and fetal rat tissue from a variety of dosing patterns over the 22-day rat gestation period. Model-derived estimates of methylmercury half-life in red blood cells of 14.8 days for the rat were consistent with published values from 14 to 16 days. Consistent values were also obtained for the timing of the peak mercury concentration in the brain. Model estimates were in agreement with published values for most tissue mercury concentrations for dosing at various times, with percent differences generally <25%. Model estimates of maternal kidney methylmercury concentrations were consistently below published values, possibly due to an underestimate of the inorganic fraction of mercuric mercury in the kidneys. The model results for a total fetal methylmercury concentration of 0.79% 24 hours after maternal methylmercury dosing on Gd 19 compare favourably with published values of 0.6 and 0.88% for administered doses on Gd 19 and 20, respectively. No human data were presented to validate the model, and validation was not performed for other routes of mercury exposure. Target tissues: The target tissues for this model included the blood, liver, gut, kidneys, and brain. Species extrapolation: The model validated the use of published data for the rat. No other species were tested, and data from other species were not used to validate the model. The author, however, suggests that generally good agreement between the model simulated results and the published values indicate that the model accurately reflects the underlying biological processes and that scaling factors for species-to-species extrapolations should be considered.
HERAG FACT SHEET Page 40 of 46 Gastrointestinal uptake and absorption & catalogue of toxicokinetic models
A 3.6: Selenium Copied from ATSDR (2003). EHC or CICAD documents are not available for Selenium. Two models for Selenium were located in the literature. Patterson and coworkers (Patterson and Zech 1992; Patterson et al. 1989, 1993) have developed compartmental models of the kinetics of Selenium orally administered as selenite or selenomethionine in adult humans. Patterson et al. (1989) Selenite Model: Patterson and coworkers (Patterson and Zech 1992; Patterson et al. 1989, 1993) developed a compartmental model of the kinetics of ingested selenite in adult humans based on data from human subjects who consumed a single oral dose of 200 µg 74Se as selenite. The model assumes that 84% of the administered Selenium is absorbed and that absorption is rapid. Absorbed selenite is assumed to distribute to six compartments: gastrointestinal tract, plasma, hepatopancreatic/lymphatic system, liver/pancreas, bile, and tissues (Figure 3-8). Unabsorbed Selenium is excreted in the feces. Absorption occurs from the gastrointestinal compartment (probably the small intestine, but also possibly the stomach) into a rapidly turning-over pool (the intestinal cells or enterocytes) from which it leaves by two pathways. The central compartment is represented as four kinetically distinct plasma pools, P1 (the portal circulation), P2 (before passage through the liver), P3 (after passage through the liver), and P4 (after passage through the tissues). In the first pathway, Selenium enters P1. The second pathway is to a liver/pancreatic compartment. Transport into and out of P1 is very rapid (T1/2 approximately 0.36 hours) and this may represent Selenium in the portal circulation passing through the liver before appearing in P3, but not removed in the first pass. The second pathway is via the hepatopancreatic/lymphatic system compartment to a second plasma pool (P2). Appearance of Selenium in P2 is delayed (T1/2 approximately 0.55 hours), representing the time needed to move through the hepatopancreatic/ lymphatic system compartment. From the two plasma pools (P1 and P2), Selenium can be excreted in the urine (T1/2 approximately 3.94 and 1.96 hours, respectively) or it can move into the liver/pancreas compartment. After a delay of 4–6 hours, the Selenium leaves the liver/pancreas either to a bile compartment (T1/2 approximately 0.13 hours) and thence to the gut (G1) for excretion in feces or to a third plasma pool (P3) (T1/2 approximately 0.19 hours). From P3, Selenium can be excreted in the urine (T1/2 approximately 4.15 hours) or can move into a large, slowly turning-over tissue compartment. Finally, Selenium is transferred very slowly (T1/2 approximately 1.27 hours) from the tissues (probably final metabolic products) to a fourth plasma pool (P4) and hence to the urine (T1/2 approximately 6.54 hours). Validation of the model: The extent to which this model has been validated is not described in Patterson and coworkers (Patterson and Zech 1992; Patterson et al. 1991, 1993). The model was designed to simulate the toxicokinetics of Selenium orally administered as selenite to humans as a preparation for a larger anticancer supplementation study jointly undertaken by the National Cancer Institute (NCI) and the U.S. Department of Agriculture (USDA) (Patterson and Zech 1992; Patterson et al. 1991, 1993). Target tissues: The model is designed to simultaneously account for the appearance and disappearance of Selenium in plasma, urine, and feces after administration of a single oral dose of 74Se as selenite (Patterson and Zech 1992; Patterson et al. 1991, 1993). Extrapolation to other forms of Selenium: The model is designed to simulate oral exposures to selenite and cannot be applied to other forms of Selenium without modification. Swanson et al. (1991) Selenomethionine Model: Swanson and coworkers (Patterson et al. 1993; Swanson et al. 1991) produced a model for ingested selenomethionine in adult humans based on data from human subjects who consumed a single oral dose of 200 µg 74Se as selenomethionine and the model of the kinetics of ingested selenite described above. Four major changes (indicated by bold lines in Figure 3-9) were made to the selenite model to achieve an adequate fit to the selenomethionine data: (1) the amount of label absorbed into the enterocyte was increased (the absorption of 74Se was 98% for selenomethionine compared with 84% for selenite), (2) the amount of label removed from the plasma in the first pass through the liver was increased, (3) a pathway from P4 back to the liver was added, providing for conservation and reutilization of amino acids (estimated 95% of material from P4 is recycled), and (4) a second tissue subgroup was added to the model and
HERAG FACT SHEET Page 41 of 46 Gastrointestinal uptake and absorption & catalogue of toxicokinetic models
rate constants were adjusted so that the subgroups had different turnover times. The most important differences between the selenite and selenomethionine models lie in the turnover times. The estimated turnover times in the plasma, liver/pancreas, and tissues are shorter for selenomethionine than for selenite, but the estimated turnover time for the whole body is more than twice as long for selenomethionine as for selenite. This is probably because selenite is not recirculated, whereas selenomethionine is extensively recycled, passing through the individual organs and tissues many times before being excreted. Validation of the model: The extent to which this model has been validated is not described by the authors (Patterson et al. 1993; Swanson et al. 1991). The model was designed to simulate the toxicokinetics of Selenium orally administered as selenomethionine to humans as a preparation for a larger anti-cancer supplementation study jointly undertaken by the NCI and the USDA (Patterson et al. 1993; Swanson et al. 1991). Target tissues: The model is designed to simultaneously account for the appearance and disappearance of Selenium in plasma, urine, and feces after administration of a single oral dose of 74Se as selenomethionine (Patterson et al. 1993; Swanson et al. 1991). Extrapolation to other forms of Selenium: The model is designed to simulate oral exposures to selenomethionine and cannot be applied to other forms of Selenium without modification. A 3.7: Titanium Not further addressed here since the only available summary assessment report is the ATSDR Toxicological Profile on Titanium Tetrachloride from 1997 in which no reference to existing PBPK models is made. A 3.8: Vanadium Not further addressed here since PBPK models are not dealt with in the reviewed summary assessments reports.
HERAG FACT SHEET Page 42 of 46 Gastrointestinal uptake and absorption & catalogue of toxicokinetic models
A 4: Abbreviations and References Abbreviations
ATSDR Agency for Toxic Substances and Disease Registry (of the US Department of Health and Human Services)
DK Denmark
ECB European Chemical Bureau
EHC Environmental Health Criteria. A document series published by the WHO.
ESR Existing Substances Regulation, Commission Regulation (EC) No 1488/94 on Risk Assessment for existing substances.
EU European Union
GI gastro-intestinal
GSD geometric standard deviation
HSE United Kingdom Health and Safety Executive
IARC International Agency for Research on Cancer
ICRP International Commission on Radiological Protection
IEUBK Integrated Exposure Uptake Biokinetic Model for Lead in Children
IPCS International Program on Chemical Safety
IRIS Integrated Risk Information System
NiPERA Nickel Producers Environmental Research Association, USA
PBPK physiologically based pharmacokinetic (model)
PBTK physiologically based toxicokinetic (model)
PEG polyethylene glycol
RA Risk Assessment
RA(R) Risk Assessment Report
TCNES The European Union's Technical Committee on New and Existing Substances
TGD Technical Guidance Document in support of Commission Directive 93/67/EEC on Risk Assessment for new notified substances, Commission Regulation (EC) No 1488/94 on Risk Assessment for existing substances and Directive 98/8/EC of the European Parliament and of the Council concerning the placing of biocidal products on the market.
US EPA United States Environmental Protection Agency
VRA(R) Voluntary Risk Assessment (Report)
WHO World Health Organisation
IEUBK Integrated Exposure Uptake and Biokinetic (model)
References
ATSDR 1992 Toxicological Profile for Vanadium and compounds. U.S. Department of Health and Human Services. Public Health Service. Agency for Toxic Substances and Disease Registry, July 1992
ATSDR 1999 Toxicological Profile for Mercury. U.S. Department of Health and Human Services. Public Health Service. Agency for Toxic Substances and Disease Registry, March 1999
ATSDR 1999a Toxicological profile for Cadmium, US Department of Health and human Services, Public Health Service, Agency for Toxic Substances and Disease Registry, Atlanta, Georgia, 1999.
ATSDR 2000 Toxicological Profile for Manganese. U.S. Department of Health and Human Services. Public Health Service. Agency for Toxic Substances and Disease Registry 2000
ATSDR 2002 Toxicological Profile for Beryllium. U.S. Department of Health and Human Services. Public Health Service. Agency for Toxic Substances and Disease Registry, 2002
HERAG FACT SHEET Page 43 of 46 Gastrointestinal uptake and absorption & catalogue of toxicokinetic models
ATSDR 2003 Toxicological Profile for Selenium. U.S. Department of Health and Human Services. Public Health Service. Agency for Toxic Substances and Disease Registry, 2003
ATSDR 2005a Draft Toxicological Profile for Arsenic. U.S. Department of Health and Human Services. Public Health Service. Agency for Toxic Substances and Disease Registry, September 2005
ATSDR 2005b Draft Toxicological Profile for Barium and Barium Compounds. U.S. Department of Health and Human Services. Public Health Service. Agency for Toxic Substances and Disease Registry, September 2005
Ayala-Fierro, F., et. al. 1999 Disposition, toxicity, and intestinal absorption of cobaltous chloride in male Fischer 344 rats. Journal of Toxicology and Environmental Health, Part A, 56:571-591.
Bailey, M.R., et. al. 1989 An interspecies comparison of the lung clearance of inhaled monodisperse Cobalt oxide particles- Part 1: Objectives and summary of results. Journal of Aerosol Science, 20(2):169-188.
Barnaby, C.F., et. al. 1968 Dosimetry of the radioisotopes of Cobalt. Physics in Medicine and Biology, 13(3):421-433.
Biesiada and Hubicki 1999 Biesiada, M. and Hubicki, L.: Blood Lead Levels in Children: Epidemiology vs. Simulations. Euro J Epidemiol 15, 485-491, 1999.
Blunden and Wallace 2003 Blunden, S. and Wallace, T.: Tin in canned food: a review and understanding of occurrence and effect. Food and Chemical Toxicology 41, 1651-1662, 2003.
Bowers and Mattuck 2001 Bowers, T.S. and Mattuck, R.L.: Further Comparisons of Empirical and Epidemiological Data with Predictions of the Integrated Exposure Uptake Biokinetic Model for Lead in Children. Hum Ecol Risk Assess 7, 1699-1713, 2001.
Choudhury et al. 2001 Choudhury H. et al.: Urinary Cadmium elimination as a biomarker of exposure for evaluating a Cadmium dietary exposure-biokinetics model. J Toxicol Environ Health A 63(5), 321-50, 2001.
Collier, C.G., et. al. 1989 An interspecies comparison of the lung clearance of inhaled monodisperse Cobalt oxide particles- part V: Lung clearance of inhaled Cobalt oxide particles in hamsters, rats and guinea-pigs. Journal of Aerosol Science, 20(2):233-247.
Cotter-Howells and Thornton 1991 Cotter-Howells, J. and Thornton, I.: Sources and Pathways of Environmental Lead to Children in a Derbyshire Mining Village. Environ Geochem Health 13(2), 127-135, 1991.
Deka, N.C., et. Al. 1981 Absorption and transport of radioactive 57cobalt vitamin B12 in experimental giardiasis in rats. Indian Journal of Medical Research, 74:675-679.
Diamond et al. 2003 Diamond, G.L. et al.: Toxicokinetics/Toxicodynamics (PK/PD) Modelling of Risks of Kidney Toxicity from Exposure to Cadmium: Estimates of Dietary Risks in the U.S. Population. J Toxicol Environ Health Part A 66(22), 2141-2164, 2003.
Edelman and Roggli 1989 Edelman, D.A. and Roggli, V.L.: The accumulation of Nickel in human lungs. Environ Health Perspect 81:221-224, 1989.
Elinder et al. 1978 Elinder, C.G. et al.: Cadmium concentrations in human liver, blood, and bile: comparison with a metabolic model. Environ Res17, 236-241, 1978.
Farzier 1994 Frazier, J.: Need for physiologically based toxicokinetic models in estimating target organ dosage following oral ingestion of Cadmium. In: Water contamination and health, R.G.M. Wang (Ed.), Marcel Dekker, New York, 1994. pp 281-304.
Fifield et al. 1997 Fifield et al.: Study of the kinetics of aluminium absorption and excretion in humans (with Day, Oldham and Carling, Univ. of Manchester). In: Department of Nuclear Physics, Annual Report 1997. Australian National University, Canberra, 1997, p. 91-101.
Firriolo, J.M., et. al. 1999 Absorption and disposition of Cobalt naphthenate in rats after a single oral dose. Journal of Toxicology and Environmental Health, Part A, 58:383-395.
Fleming et al. 1999 Fleming, D.E.B. et al.: The O’Flaherty Model of Lead Kinetics: An Evaluation Using Data from a Lead Smelter Population. Toxicol Appl Toxicol 161, 100-109, 1999.
Friberg et al. 1974 Friberg, L. et al. (Eds.): Cadmium in the environment, 2nd edition, CRC Press, Boca Raton, Florida, 1974.
Griffin et al. 1999a Griffin, S. et al.: Calculating the Interindividual Geometric Standard Deviation for Use in the Integrated Exposure Uptake Biokinetic Model for Lead in Children. Environ Health Perspect 107, 481-487, 1999.
Griffin et al. 1999b Griffin, S. et al.: Application of a Probabilistic Risk Assessment Methodology to a Lead Smelter Site. Hum Ecol Risk Assess 5, 845-868, 1999.
Harp, M.J. and Scoular, F.I. 1952 Cobalt metabolism of young college women on self-selected diets. Journal of Nutrition, 47:67-72.
HERAG FACT SHEET Page 44 of 46 Gastrointestinal uptake and absorption & catalogue of toxicokinetic models
Hollins, J.G. and McCullough, R.S. 1971
Radiation dosimetry of internal contamination by inorganic compounds of Cobalt: An analysis of Cobalt metabolism in rats. Health Physics, 21:233-246.
Houk, A.E.H., et. al. 1946 Thomas AW, Sherman HC Some interrelationships of dietary Iron, Copper and Cobalt in metabolism. Journal of Nutrition, 31:609-620.
Hsieh et al. 1999a Hsieh, T.H. et al.: A dosimetry model of Ni compounds in the rat lung. Inhalation Toxicol. 11, 229-248, 1999.
Hsieh et al. 1999b Hsieh, T.H. et al.: Deposition and clearance models of Ni compounds in the mouse lung and comparisons with the rat models. Aerosol Sci Technol. 31, 359-372, 1999.
Hsieh et al. 1999c Hsieh, T.H. et al.: Modeling of deposition and clearance of inhaled Ni compounds in the human lung. Reg Toxicol Pharm. 30, 18-28, 1999.
ICRP 1975 Report of the Task Group on Reference Man, ICRP Publication 23, Pergamon Press, Oxford, 1975.
ICRP 1981 Limits for Intakes of Radionuclides by Workers, ICRP Publication 30, Part 3. Annals of the ICRP, Volume 6, No. 2/3, 1981.
ICRP 1994 Human respiratory tract model for radiological protection, ICRP publication 66. Annals of the ICRP 24 (1-3), 1994.
ICRP 1996 Age-dependent Doses to Members of the Public from Intake of Radionuclides: Part 5 – Compilation of Ingestion and Inhalation Dose Coefficients. ICRP Publication 72. Annals of the ICRP, Volume 26, No. 1, 1996.
Inaba, J., et. Al. 1980 Comparative metabolism of 54Mn, 59Fe, 60Co and 65Zn incorporated into Chlorella and in inorganic form in rats. Health Physics, 39:611-617.
Inskip et al. 1997 Inskip, M.J. et al.: Measurements Of Blood Lead And Stable Lead Isotopes During Pregnancy In A Non-human Primate (Macaca Fascicularis). In: Conference Proceedings: Trace Elements in Man and Animals - 9, Fischer et al. (Eds.), Ottawa, Canada, 1997. Published by NRC Press (ISBN 0-660-16404-3). pp 74-76.
IPCS 1991 IPCS Environmental Health Criteria 108: Nickel. 1991. WHO, pp 135-139.
IPCS 1991 Environmental Health Criteria 108: Nickel. IPCS/WHO 1991. pp 135-139.
IPCS 2006 571. Iron, WHO Food Additives Series 18, JECFA - Monographs & Evaluations (available on IPCS website)
Kinoshita, K. and Fujita, T. 1972 Metabolism of 57Co-methylcobalamin in rat and guinea pig. Chemical and Pharmaceutical Bulletin, 20(12):2561-2569.
Kirchgessner, M., et. al. 1994 Endogenous excretion and true absorption of Cobalt as affected by the oral supply of Cobalt. Biological Trace Element Research, 41:175-189.
Kjellström and Nordberg 1978 Kjellström, T. and Nordberg, G.F.: A kinetic model of Cadmium metabolism in the human being. Environ Res 16, 248-269, 1978.
Kjellström and Nordberg 1985 Kjellström, T. and Nordberg, G.F.: Kinetic model of Cadmium metabolism. In: Cadmium and health: a toxicological and epidemiological appraisal, Volume I: Exposure, Dose and Metabolism. L. Friberg et al. (Eds.), CRC Press, Boca Raton, Florida, 1985, pp 180-197.
Kreyling, W.G., et. al. 1986 Metabolic fate of inhaled Co aerosols in beagle dogs. Health Physics, 51(6):773-795.
KS Crump 1999 KS Crump Group, Inc: Comparative Carcinogenicity of Nickel Compounds. A Review of Nickel Toxicity, Toxicokinetics, and Mode of Action. TR-113883. Final report. Prepared for Electric Power Research Institute, Palo Alto, CA, 1999.
KS Crump 2001 KS Crump Group, Inc: A Toxicokinetic Model for Nickel: Intracellular and Intranuclear Dosimetry. Final report. Prepared for Electric Power Research Institute, Palo Alto, CA, 2001.
Lakind 1998 Lakind, J.S.: Comparison of Three Models for Predicting Blood Lead Levels in Children: Episodic Exposures to Lead. J Expo Ana Environ Epidemiol 8, 399-406, 1998.
Leggett 1993 Legett, R.W.: An Age-Specific Kinetic Model of Lead Metabolism in Humans. Environ Health Perspect 101, 598-616, 1993.
Matsubara-Khan 1974 Matsubara-Khan, J.: Compartmental analysis for the evaluation of biological half-lives of Cadmium and mercury in mouse organs. Environ Res 7, 54-67, 1974.
Menzel 1988 Menzel, D.B.: Planning and using PB-PK models: an integrated inhalation and distribution model for Nickel. Toxicol Lett 43, 67-83, 1988.
Menzel et al. 1987 Menzel, D.B. et al.: Toxicokinetic modelling of the lung burden from repeated inhalation of Nickel aerosols. Toxicol Lett 38, 33-43, 1987.
HERAG FACT SHEET Page 45 of 46 Gastrointestinal uptake and absorption & catalogue of toxicokinetic models
Montelius 2005 Montelius, J.:Scientific Basis for Swedish Occupational Standards XXV. Johan Montelius (Ed.). Arbete och Hälsa, Volume 2005:7, Number XXV. Available via http://www.arbetslivsinstitutet.se
Naylor and Harrison 1995 Gastrointestinal Iron and Cobalt absorption and Iron status in young rats and guinea pigs. Human and Experimental Toxicology, 14:949-954.
Nolte et al. 2001 Nolte, E. et al: Compartment model for aluminium biokinetics. Human & Experimental Toxicology 20, 111-117, 2001.
O’Flaherty 1993 O’Flaherty, E.J.: Physiologically based models for bone-seeking elements, IV: Kinetics of Lead Disposition in humans. Toxicol. Appl. Toxicol 118, 16-29, 1993.
O’Flaherty 1995a O’Flaherty, E.J.: Physiologically based models for Bone-seeking Elements, V: Lead Absorption and Disposition in Childhood. Toxicol Appl. Toxicol. 131, 297-308, 1995.
O’Flaherty 1995b O’Flaherty, E.J.: PBK Modelling for Metals. Examples with Lead, Uranium, and Chromium. Toxicol Lett 82/83, 367-372, 1995.
O’Flaherty 2000 O’Flaherty, E.J.: Modeling Normal Aging Bone Loss, with Consideration of Bone Loss in Osteoporosis. Toxicol Sci 55, 171-188, 2000.
Oberdörster 1989 Oberdörster, G.: Dosimetric principles for extrapolating results of rat inhalation studies to humans, using an inhaled Ni compound as an example. Health Phys 57, 213-220, 1989.
Patrick, G., et. al. 1989 An interspecies comparison of the lung clearance of inhaled monodisperse Cobalt oxide particles- part VI: Lung clearance of inhaled Cobalt oxide particles in SPF Fischer rats. Journal of Aerosol Science, 20(2):249-255.
Piscator 1984 Piscator, M.: Long-term observations on tubular and glomerular function in Cadmium-exposed persons. Environ Health Perspect 54, 175-179, 1984.
Piscator and Lind 1972 Piscator, M. and Lind, B.: Cadmium, Zinc, Copper, and Lead in human renal cortex. Arch Environ Health 24(6), 426-431, 1972.
Polak et al. 1996 Polak, J. et al.: Evaluating Lead Bioavailability Data by Means of a Physiologically Based Lead Kinetic Model. Fund Appl Toxicol 29, 63-70, 1996.
Priest 2004 Priest, N.D.: The biological behaviour and bioavailability of aluminium in man, with special reference to studies employing aluminium-26 as a tracer: review and study update. J. Environ. Monit. 6, 375-403, 2004.
Priest et al. 1995 Priest, N.D. et al.: Human metabolism of Aluminium-26 and Gallium-67 injected as citrates. Human Exp. Toxicol. 14, 287-293, 1995.
Priest et al. 1996 The bioavailability of aluminium-26 labelled aluminium citrate and aluminium hydroxide in volunteers. Biometals 9, 221-228, 1996.
Priest et al. 1998 Uptake by man of aluminium in a public water supply. Human Exp. Toxicol. 17, 296-301, 1998.
Reuber, S., et. al. 1994 Interactions of Cobalt and Iron in absorption and retention. Journal of Trace Elements and Electrolytes in Health and Disease, 8:151-158.
Risk Policy Report Daily News 2005
Risk Policy Report Daily News (2005). Advisory Panel Criticizes EPA Lead Model but Shows Signs of Approval. November 1, 2005.
Russell-Jones and Alpers 1999 Vitamin B12 transporters. In: Amidon GL, Sadee W, eds. Pharmaceutical biotechnology. New York, NY: Kluwer Academic/Plenum Publishers, 493-520.
Schade, S.G., et. al. 1970 Interrelationship of Cobalt and Iron absorption. Journal of Laboratory and Clinical Medicine, 75:435-441.
Shank et al. 1977 Shank, K.E. et al.: A mathematical model of Cadmium transport in a biological system. Environ Res 13, 209-214, 1977.
Smith, T., et. al. 1972 Absorption and retention of Cobalt in man by whole-body counting. Health Physics, 22:359-367
Sorbie, J., et al. 1971 Cobalt excretion test for the assessment of body Iron stores. Canadian Medical Association Journal, 104(9):777-782.
Taylor, D.M. 1962 The absorption of Cobalt from the gastro-intestinal tract of the rat. Physics in Medicine and Biology, 6:445-451.
Turnlund J.R. et al. 1998 Copper absorption, excretion and retention by young men consuming low dietary Copper determined by using the stable isotope 65Cu. Am. J. Clin. Nutr. 67:1219-1225.
Turnlund J.R. et al. 2005 Long-term high Copper intake: effects on Copper absorption, retention, and homeostas is in men. In press.
US EPA 1994a Guidance Manual for the Integrated Exposure Uptake Biokinetic Model for Lead in Children. Office of Emergence and Remedial Response. Washington, DC. Publication No. 9285.7-15-1. EPA/540/R-93/081. PB 93-963510. February 1994.
HERAG FACT SHEET Page 46 of 46 Gastrointestinal uptake and absorption & catalogue of toxicokinetic models
US EPA 1994b Technical Support Document: Parameters and Equations Used in Integrated Exposure Uptake Biokinetic Model for Lead in Children (v0.99d). EPA /540/R-94/040, PB94-963505. 1994.
US EPA 2004 Estimation of Relative Bioavaiilability of Lead in Soil and Soil-Like Material using In Vivo and In Vitro Methods. Office of Solid Waste and Emergency Response, OSWER 9285.7-77.
US EPA 2005 Zinc and compounds (CAS No. 7440-66-6). In Support of Summary Information on the Integrated Risk Information System (IRIS), July 2005, EPA/635/R-05/002, U.S. Environmental Protection Agency Washington D.C., USA.
US EPA 2005b Guidance Manual for the All Ages Lead Model, Draft version 1.05. National Center for Environmental Assessment, U.S. Environmental Protection Agency. 2005.
Valberg, L.S., et. al. 1969 Alteration in Cobalt absorption in patients with disorders of Iron metabolism. Gastroenterology, 56(2):241-251.
Van Bruwaene, R., et. al. 1984 Metabolism of 51Cr, 54Mn, 59Fe and 60Co in lactating dairy cows. Health Physics, 46(5):1069-1082.
WHO 1981 WHO/IPCS: Environmental Health Criteria 17. Manganese. 1981
WHO 1981 WHO/IPCS: Environmental Health Criteria 17. Manganese. 1981
WHO 1988 WHO/IPCS: Environmental Health Criteria 61. Chromium. 1988
WHO 1990a WHO/IPCS: Environmental Health Criteria 107. Barium. 1990.
WHO 1990b WHO/IPCS: Environmental Health Criteria 106. Beryllium. 1990.
WHO 1991 WHO/IPCS: Environmental Health Criteria 118. Inorganic Mercury. 1991.
WHO 1999 WHO: Concise International Chemical Assessment Document 12. Manganese and its compounds. 1999
WHO 2001a WHO/IPCS. Environmental Health Criteria 224. Arsenic and Arsenic compounds. 2001.
WHO 2001b WHO: Concise International Chemical Assessment Document 33. Barium and Barium Compounds. 2001.
WHO 2001c WHO: Concise International Chemical Assessment Document 32. Beryllium and Beryllium Compounds. 2001
WHO 2001d WHO: Concise International Chemical Assessment Document 29. Vanadium Pentoxide and other inorganic Vanadium compounds. 2001.
WHO 2003 WHO: Concise International Chemical Assessment Document 50. Elemental Mercury and inorganic mercury compounds: Human Health Effects. 2003.
Yu et al. 2001 Yu, C.P. et al.: Evaluation of the human Ni retention model with workplace data. Reg Toxicol Pharm. 33, 165-172, 2001.