Embed Size (px)
Citation preview

GCT535- Sound Technology for MultimediaDigital Audio
Graduate School of Culture TechnologyKAIST
Juhan Nam
1
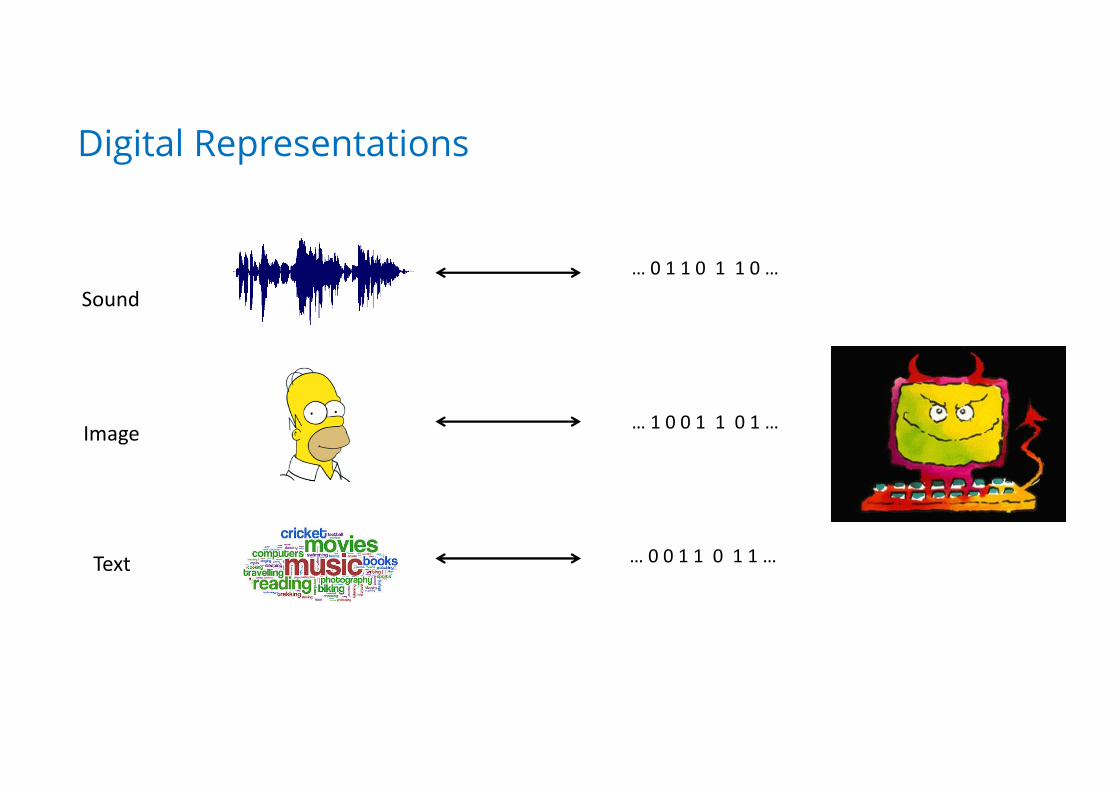
Digital Representations
Sound
Image
Text
…0110110…
…1001101…
…0011011…

Digital Representations
§ Sampling and Quantization– Sound (samples) – Image (pixels)
§ Trade-off – Resolution (quality) and data size

Digital Representations
§ Encoding and Decoding (compression or de-compression)– Lossless : redundancy removal (e.g. zip)– Lossy: drop bits (quantize data more) such that they are perceptually not noticeable
Reducedata(i.e.bits)withnolossofinformation

Outlines
§ Digital Representation of Sound
§ Sampling
§ Quantization
§ Compression
5
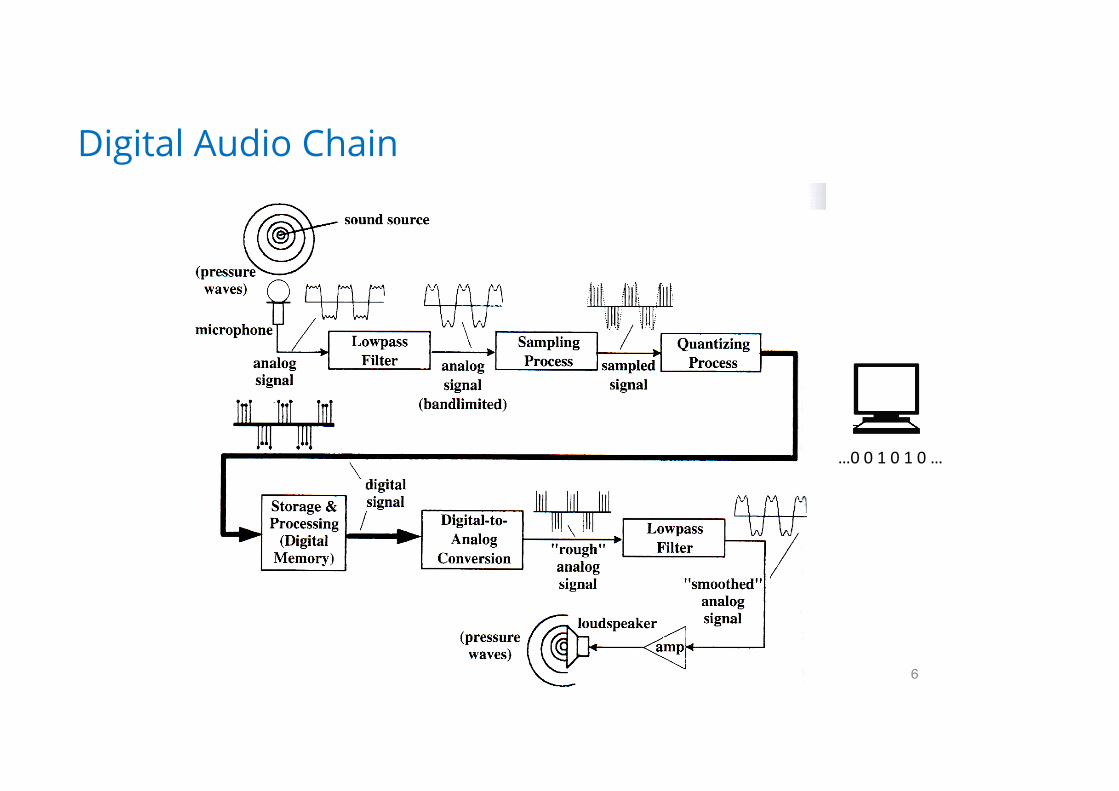
Digital Audio Chain
6
…001010…

Transducers
§ Microphones– Air vibration to electrical signal– Dynamic / condenser microphones– The signal is very weak: use of pre-amp
§ Speakers– Electrical signal to air vibration– Generate some distortion (by diaphragm)– Crossover networks: woofer / tweeter
7

Sampling
§ Convert continuous-time signal to discrete-time signal by periodically picking up the instantaneous values– Represented as a sequence of numbers; pulse code modulation (PCM)– Sampling period (Ts): the amount of time between samples– Sampling rate ( fs =1/Ts )
8
Ts x(t)→ x(nTs )Signalnotation

Sampling Theorem
§ What is an appropriate sampling rate?– Too high: increase data rate– Too low: become hard to reconstruct the original signal
§ Sampling Theorem– In order for a band-limited signal to be reconstructed fully, the sampling rate must
be greater than twice the maximum frequency in the signal
– Half the sampling rate is called Nyquist frequency ( )
9
fs > 2 ⋅ fmfs2

Sampling in Frequency Domain
§ Sampling in time creates imaginary content of the original at every fsfrequency
§ Why?
10
fm-fm fm-fm fs+fmfs-fm fs-fs
𝑥 𝑡 = sin 2𝜋𝑓*𝑡𝑥 𝑛 = sin 2𝜋𝑓*𝑛𝑇- = sin 2𝜋𝑓*𝑛/𝑓-
= sin 2𝜋𝑓*𝑛/𝑓- ± 2𝜋𝑘𝑛 = sin 2𝜋𝑛(𝑓* ± 𝑘𝑓-)/𝑓-
Nyquist Frequency
-fs +fm
Audible range Audible range

Aliasing
§ If the sampling rate is less than twice the maximum frequency, the high-frequency content is folded over to lower frequency range
11
0 0.2 0.4 0.6 0.8 1 1.2 1.4 1.6 1.8 2x 10⁴
−0.8
−0.6
−0.4
−0.2
0
0.2
0.4
0.6
0.8
1

Aliasing in Frequency Domain
§ Sampling in time creates imaginary content of the original at every fsfrequency
§ The frequency that we hear is 𝑓- − 𝑓*
12
fm-fm fm-fm fs+fmfs-fm fs-fs -fs +fm
Audible range Audible range
fm < fs − fmIn order to avoid aliasing

Aliasing in Frequency Domain
§ For general signals, high-frequency content is folded over to lower frequency range
13
fm-fm fs+fmfs-fm fs-fs
Audible range

Avoid Aliasing
§ Increase sampling rate
§ Use lowpass filters before sampling
14fs/2 fs-fs -fs/2
fs > 2 ⋅ fm
fm-fm fs+fmfs-fm fs-fs
Lowpass Filter

Examples of Aliasing
15Frequencysweepofthetrivialsawtooth wave
Time (s)
Freq
uenc
y (H
z)
1 1.5 2 2.5 3 3.5 4 4.50
0.5
1
1.5
2
x 104
Bandlimited sawtooth wave spectrum
5 10 15 20−60
−40
−20
0
Frequency (kHz)
Mag
nitu
de (d
B)
5 10 15 20−60
−40
−20
0
Frequency (kHz)
Mag
nitu
de (d
B)
Trivial sawtooth wave spectrum

Examples of Aliasing
§ Aliasing in Video– https://www.youtube.com/watch?v=QOqtdl2sJk0– https://www.youtube.com/watch?v=jHS9JGkEOmA
16
(Notethatvideoframeratecorrespondstothesamplingrate)

Sampling Rates
§ Determined by the bandwidth of signals or hearing limits– Consumer audio product: 44.1 kHz (CD)– Professional audio gears: 48/96/192 kHz – Speech communication: 8/16 kHz
17

Reconstruction in Frequency Domain
§ The sampled signal can be reconstructed by applying a low-pass filter in the frequency domain view
18
fm-fm fm-fm fs-fs
fs/2

Reconstruction in Time Domain
§ The reconstruction corresponds to convolution with a sinc function in the time domain– The ideal low-pass corresponds to the sinc function– In practice, DACs are composed of sample-and-hold and low-pass filtering circuitry
19sinc functions!
sinc(x) = sin(π x)π x
Beforesampling
Aftersampling
Reconstruction
Timedomain
Frequencydomain

Quantization
§ Discretizing the amplitude of real-valued signals– Round the amplitude to the nearest discrete steps– The discrete steps are determined by the number of bit bits
• Audio CD: 16 bits (-215 ~ 215-1) ß B bits (-2B-1 ~ 2B-1-1)
20

Quick Review: Number Representations on Computer
§ Fixed-point number – Unsigned: 0 ~ 2^B-1
• 8 bits: 0 (0x00000000) ~ 255 (0x11111111) – Signed: -2^(B-1) ~ 2^(B-1)-1
• 8 bits: -128 (0x10000000) ~ 127 (0x01111111)• Audio signals are usually represented with signed numbers
– 8 or 16 bits are popular choices– WAV file format
§ Floating-point number – Composed of sign, exponent and mantissa– The represented number is (-1)s x m x 2e (base 2) or (-1)s x m x 10e (base 10)– Examples
• 1.653 à 1653 x 10-3 (s = 0, e=-3, m = 1653)• -1329.6 à (-1) x 13296 x 10-1 (s = -1, e=-1, m = 13296)
– The floating point can represent a much wider range of numbers– 32 or 64 bits are popular choices– Internal processing in DAW
21
…
Bbits
Sine MantissaExponent
e ms

Quantization Error
§ Quantization causes noise– Average power of quantization noise: obtained from the probability density function
(PDF) of the error
§ Signal to Noise Ratio (SNR)– Based on RMS
– Based on the max levels
22
1/2-1/2
P(e)
1
x2p(e)dx−1/2
1/2∫ = 1
12
Rootmeansquare(RMS)ofnoise
20 log10SrmsNrms
= 20 log102B−1 / 2112
= 6.02B+1.76 dB (With16bits,SNR=98.08dB)
20 log10SmaxNmax
= 20 log102B−1
12= 6.02B dB (With16bits,SNR=96.32dB)
RMSoffull-scalesinewave

Dynamic Range
§ Dynamic range – The ratio between the loudest and softest levels
§ Human ear’s dynamic range– Depending on frequency band
23
20 log10Srms,maxSrms,min
= 20 log102B−1 / 21 / 2
= 6.02B− 6 (With16bits,DR=90.31dB)
EqualLoudnessCurve
Again,RMSoffull-scalesinewavefor bothloudestandsoftest

Clipping and Headroom
§ Clipping– Non-linear distortion that occurs when a signal is above the max level
§ Headroom– Margin between the peak level and the max level
24
0dB
-98.08dBNoisefloor(Byquantization)
Maxlevel
Headroom
Clipping
Minlevel -90.31dB
B=16bits
Indigitalaudio,0dBisregardedasthemaximumlevel

Dithering
§ Note that the SNR for the quantization noise depends on signal levels– As the signal level goes down, SNR decreases– Low-level signals can have colored noise
§ Dithering– Adding a small white noise to the signal before sampling (or high to low bit conversion)
– This adds white noise but coloration is prevented– The amount is the order of 3dB
25
Nodithering
Withdithering
X(ω)
!X (ω)
Seetheaddedwhitenoise.Thisislessannoyingthanthecolorednoisebyquantization
!x (t) = x(t)+ ndithering (t)

Compression
§ Lossy compression– Perceptual audio coding: leverage human perception of tones– E.g. MP3 (.mp3), AAC (.mp4, m4a, ..), AC3 (Dolby DVD, …)
§ Lossless compression– Redundancy reduction: Huffman coding, arithmetic coding – E.g. FLAC
26

Perceptual Coding
§ Leverage the auditory masking phenomenon– Decrease the dynamic range in cochlea – The masked threshold depend on the tone frequency and critical bands– Allocate bits according to the signal-to-masking ratio
27
E4896 Music Signal Processing (Dan Ellis) 2012-01-30 - /24
• Limited dynamic range in cochleaeffect within frequency“critical bands”
basis of MPEG Audio
• Forward/backward temporal effects
13
masked threshold
log freq
absolute threshold
masking tone
Inte
nsity
/ dB
0 50 100 150 200 2500
5
10
15
20
0
2
4
6
8
10
12
14
16
18
20
Masking tone
Elevated masking threshold “skirt”
time / ms
freq / Bark
level
/ dB
tracks 23-25
BorrowedfromD.Ellis’E4896slides

Huffman Coding
§ Assigning bits according to the statistics of each source
28
0(0.4)
1(0.35)
2(0.2)
3(0.05)
Probability
110
111
10
11
1
0
0.25
0.6
1
0.4
1*0.4+2*0.35+3*0.2+3*0.05=1.85bitsà Save0.15bits