Embed Size (px)
Citation preview
1
PRESS RELEASE
GE ANNOUNCES FIRST QUARTER 2018 RESULTS
• 1Q’18 continuing operations EPS (GAAP) of $0.04
• 1Q’18 adjusted EPS (non-GAAP) of $0.16
• GE CFOA (GAAP) of $(1.0) billion; Adjusted GE Industrial free cash flows (non-GAAP) of $(1.7) billion-a), in line with our plan and $1.1 billion better than prior year
• Strong performance in Aviation, Healthcare, Renewables, and Transportation; Power and Oil & Gas industries continue to be challenging
• Strong cost performance in the quarter with reduction of $805 million in Industrial structural cost (non-GAAP) b)
• Recorded reserve of $1.5 billion related to the WMC FIRREA investigation in discontinued operations
• Recently recast historical financial information to reflect new accounting standards and methodology changes
• Reaffirmed 2018 guidance
BOSTON – April 20, 2018 - GE (NYSE:GE) announced results today for the first quarter of 2018. GE Chairman and CEO John Flannery said, “The first quarter is a step forward in executing on our 2018 plan and we are seeing signs of progress in our performance. Industrial earnings, free cash flow, and margins all improved year over year. We reduced Industrial structural costs by $805 million and are on track to exceed our cost reduction goal of $2 billion in 2018.”
Flannery continued, “Aviation, Healthcare, Renewables, and Transportation grew earnings, and BHGE continues to execute on its plan. Power is making progress on cost actions and operational and services execution, but the industry continues to be challenging and is trending softer than our forecast. We are working to resolve legacy matters in our discontinued operations, and we recorded a reserve of $1.5 billion related to the WMC FIRREA investigation. We are making significant progress on the $20 billion of dispositions planned for 2018 & 2019. There is no change to our framework for 2018.”
Three months ended March 31
(Dollars in millions; except per-share amounts) 2018 2017 Year on Year
GAAP Metrics
Continuing Operations EPS $ 0.04 $ 0.01 F
Net Earnings EPS (0.14) (0.01) U
Total Revenues 28,660 26,881 7 %
GE Industrial Operating Margin 7.7 % 5.2 % 250 bps
GE Cash From Operating Activities (GE CFOA) (1,012) 368 U
Non-GAAP Metrics
Adjusted EPS $ 0.16 $ 0.14 14 %
GE Industrial Segment Organic Revenues 23,817 24,724 (4) %
Adjusted GE Industrial Operating Profit-c) 2,745 2,377 15 %
Adjusted GE Industrial Operating Margin-c) 10.2 % 9.6 % 60 bps
Adjusted GE Industrial Free Cash Flows (FCF)-a) (1,681) (2,748) 39 %
-a) Excluding deal taxes and GE Pension Plan funding, and with BHGE on a dividend basis -b) Structural costs exclude restructuring & other charges, segment business development, segment FX impact and Corporate gains/losses, effects of
acquisitions/dispositions; BHGE on a proforma basis -c) Excludes gains/(losses) and restructuring & other
We present both GAAP and non-GAAP measures to provide investors with additional information. We believe that providing these non-GAAP measures along with GAAP measures allows for increased comparability of our ongoing performance from period to period. Please see page 7 for explanations of why we use these non-GAAP measures and the reconciliation to the most comparable GAAP financial measures.
2
Results by Reporting Segment
The following segment discussions and variance explanations are intended to reflect management’s view of the relevant comparisons of financial results.
Power
Three months ended March 31
(in millions) 2018 2017 Year on Year
Orders $ 5,562 $ 7,861 (29) %
Revenues 7,222 7,940 (9) %
Segment Profit 273 438 (38) %
Segment Profit Margin 3.8 % 5.5 % (170) bps
Orders of $5.6 billion were down 29%. Revenue of $7.2 billion was down 9%. Segment profit of $273 million was down 38% reported. Power is making progress on cost actions and operational and services execution, but the industry continues to be challenging and is trending softer than our forecast.
Renewable Energy
Three months ended March 31
(in millions) 2018 2017 Year on Year
Orders $ 2,423 $ 2,102 15 %
Revenues 1,646 1,767 (7) %
Segment Profit 77 70 10 %
Segment Profit Margin 4.7 % 4.0 % 70 bps
Orders of $2.4 billion were up 15%. Revenue of $1.6 billion was down 7%, driven by lower Onshore Wind equipment sales given timing of shipments relative to last year’s profile. Segment profit of $77 million was up 10% reported. Backlog grew 8% from the prior quarter, principally from strength in Onshore Wind.
Oil & Gas
Three months ended March 31
(in millions) 2018 2017 Year on Year
Orders $ 5,232 $ 2,588 F
Revenues 5,385 3,086 74 %
Adjusted Segment Profit-a) 181 260 (30) %
Adjusted Segment Profit Margin-a) 3.4 % 8.4 % (500) bps
-a) Excluded restructuring and other charges; O&G segment profit including these items was $(144) million for 1Q.
BHGE is releasing its financial results this morning. Orders were $5.2 billion, up 102% reported and down 3% organic. Revenues were $5.4 billion, up 74% reported and down 14% organic*. Adjusted segment profit* was $181 million, down 30% reported and down 79% organic*, driven by declines in our longer cycle oilfield equipment and turbomachinery businesses. Synergies remain on track for the year. During the quarter, we received cash distributions from BHGE totaling $441 million, including our portion of share repurchases of $314 million and quarterly dividend of $127 million.
Aviation
Three months ended March 31
(in millions) 2018 2017 Year on Year
Orders $ 8,114 $ 7,181 13 %
Revenues 7,112 6,673 7 %
Segment Profit 1,603 1,273 26 %
Segment Profit Margin 22.5 % 19.1 % 340 bps
Orders in the quarter totaled $8.1 billion, up 13%. Equipment orders grew 18% and service orders grew 10%. Revenues in the quarter grew 7% to $7.1 billion, and we shipped 186 LEAP engines this quarter versus 77 last year. Segment profit of $1.6 billion was up 26% primarily driven by higher price on commercial engines and aftermarket materials, as well as product cost productivity, which was partly offset by negative mix from higher LEAP shipments. * Non-GAAP Financial Measure
3
Healthcare
Three months ended March 31
(in millions) 2018 2017 Year on Year
Orders $ 4,731 $ 4,535 4 %
Revenues 4,702 4,305 9 %
Segment Profit 735 661 11 %
Segment Profit Margin 15.6 % 15.4 % 20 bps
Orders of $4.7 billion were up 4% reported and up 1% organic. Revenues of $4.7 billion grew 9% reported and 6% organic*. Healthcare Systems revenues were up 10% and Life Sciences up 11% reported. Segment profit of $735 million was up 11% reported, driven by continued volume growth and productivity, offset partially by negative price and higher program investments. In April, we announced the disposition of our Value-Based Care solutions division to Veritas for over $1 billion of cash. The transaction is expected to close in the third quarter, subject to customary closing conditions.
Transportation
Three months ended March 31
(in millions) 2018 2017 Year on Year
Orders $ 1,509 $ 1,035 46 %
Revenues 872 979 (11) %
Segment Profit 130 95 37 %
Segment Profit Margin 14.9 % 9.7 % 520 bps
Orders of $1.5 billion were up 46%, with equipment orders up 34% and services orders up 58%. Revenues of $872 million were down 11%, with equipment revenues down 47% on lower locomotive volume. Segment profit of $130 million was up 37%, driven by services growth more than offsetting locomotive volume declines.
Lighting
Three months ended March 31
(in millions) 2018 2017 Year on Year
Orders $ 221 $ 243 (9) %
Revenues 456 462 (1) %
Segment Profit 1 10 (90) %
Segment Profit Margin 0.2 % 2.2 % (200) bps
Orders of $221 million were down 9%. Revenues in the quarter were down 1%. Segment profit was $1 million, down from $10 million last year. In 1Q, we announced an agreement to sell our Europe, Middle East, Africa and Turkey and Global Automotive Lighting businesses. These businesses represented approximately $200 million of Current & Lighting’s annual revenues of $2 billion. We expect to close substantially all of this deal in 2Q and to sell the remainder of Current & Lighting by the end of 2018, subject to customary closing conditions.
GE Capital
Three months ended March 31
(in millions) 2018 2017 Year on Year
Capital continuing operations $ (215) $ (47) U
Discontinued operations (1,553) (242) U
GE Capital Earnings $ (1,768) $ (290) U
Continuing operations generated a loss of $215 million in the quarter, versus a loss of $47 million in the prior year. This includes a $45 million charge related to updates to the U.S. tax reform impact on energy investments and a $50 million non-cash charge associated with upfront costs from calling approximately $2 billion of excess debt. The Company is working to resolve legacy matters in our discontinued operations, and this quarter Capital also recorded a reserve of $1.5 billion in discontinued operations related to the WMC FIRREA investigation. GE Capital ended the quarter with $146 billion of assets, including $22 billion of liquidity. * Non-GAAP Financial Measure
4
GENERAL ELECTRIC COMPANY
CONDENSED STATEMENT OF EARNINGS (LOSS) (UNAUDITED)
Consolidated GE(a) Financial Services (GE Capital)
Three months ended March 31 2018 2017 V% 2018 2017 V% 2018 2017 V%
Revenues Sales of goods and services $ 26,874 $ 24,616 9 % $ 26,894 $ 24,781 9 % $ 32 $ 29 10 %
GE Capital revenues from services 1,786 2,264 — — 2,141 2,652 Total revenues 28,660 26,881 7 % 26,894 24,780 9 % 2,173 2,681 (19 )%
Costs and expenses Cost of sales 21,526 20,230 21,027 19,845 550 585 Selling, general and administrative expenses 4,204 4,287 3,999 3,803 343 572 Interest and other financial charges 1,285 1,139 642 564 819 812 Investment contracts, insurance losses and
insurance annuity benefits 630 634 — — 645 636 Non-operating benefit costs 688 651 684 649 4 2 Other costs and expenses 121 190 — — 133 214
Total costs and expenses 28,453 27,131 5 % 26,352 24,860 6 % 2,495 2,820 (12 )%
Other income 205 197 193 166 — — GE Capital earnings (loss) from continuing operations — — (215 ) (47 ) — — Earnings (loss) from continuing operations
before income taxes 413 (53 ) F 519 39 F (321 ) (139 ) U
Benefit (provision) for income taxes 27 105 (112 ) (23 ) 139 128 Earnings (loss) from continuing operations 440 52 F 407 16 F (182 ) (11 ) U
Earnings (loss) from discontinued operations, net of taxes (1,553 ) (239 ) (1,553 ) (239 ) (1,553 ) (242 )
Net earnings (loss) (1,113 ) (187 ) U (1,146 ) (223 ) U (1,735 ) (253 ) U
Less net earnings (loss) attributable to noncontrolling interests 34 (104 ) 38 (106 ) (4 ) 2
Net earnings (loss) attributable to the Company (1,147 ) (83 ) U (1,184 ) (117 ) U (1,731 ) (256 ) U
Preferred stock dividends (37 ) (34 ) — — (37 ) (34 ) Net earnings (loss) attributable to
GE common shareowners $ (1,184 ) $ (117 ) U $ (1,184 ) $ (117 ) U $ (1,768 ) $ (290 ) U
Amounts attributable to GE common shareowners: Earnings (loss) from continuing operations $ 440 $ 52 F $ 407 $ 16 F $ (182 ) $ (11 ) U
Less net earnings (loss) attributable to noncontrolling interests, continuing operations 34 (104 ) 38 (106 ) (4 ) 2
Earnings (loss) from continuing operations attributable to the Company 406 156 F 369 122 F (179 ) (13 ) U
Preferred stock dividends (37 ) (34 ) — — (37 ) (34 ) Earnings (loss) from continuing operations
attributable to GE common shareowners 369 122 F 369 122 F (215 ) (47 ) U
Earnings (loss) from discontinued operations, net of taxes (1,553 ) (239 ) (1,553 ) (239 ) (1,553 ) (242 )
Less net earnings (loss) attributable to noncontrolling interests, discontinued operations — — — — — —
Net earnings (loss) attributable to GE common shareowners $ (1,184 ) $ (117 ) U $ (1,184 ) $ (117 ) U $ (1,768 ) $ (290 ) U
Per-share amounts - earnings (loss) from continuing operations
Diluted earnings (loss) per share $ 0.04 $ 0.01 F Basic earnings (loss) per share $ 0.04 $ 0.01 F Per-share amounts - net earnings (loss) Diluted earnings (loss) per share $ (0.14 ) $ (0.01 ) U Basic earnings (loss) per share $ (0.14 ) $ (0.01 ) U Total average equivalent shares Diluted 8,696 8,811 (1 )% Basic 8,683 8,714 — % Dividends declared per common share $ 0.12 $ 0.24 (50 )%
(a) Represents the adding together of all affiliated companies except GE Capital, which is presented on a one-line basis.
Amounts may not add due to rounding. Dollar amounts and share amounts in millions; per-share amounts in dollars.
"GE Capital" means GE Capital Global Holdings, LLC (GECGH) and all of their affiliates and associated companies. Separate information is shown for
"GE" and "Financial Services (GE Capital)." Transactions between GE and GE Capital have been eliminated from the "Consolidated" column. See Note
1 to the 2017 consolidated financial statements at www.ge.com/ar2017 for further information about consolidation matters

5
GENERAL ELECTRIC COMPANY
SUMMARY OF OPERATING SEGMENTS (UNAUDITED)
Three months ended March 31
(Dollars in millions) 2018 2017 V%
Revenues(a)
Power(b) $ 7,222 $ 7,940 (9 )%
Renewable Energy 1,646 1,767 (7 )%
Oil & Gas 5,385 3,086 74 %
Aviation 7,112 6,673 7 %
Healthcare 4,702 4,305 9 %
Transportation 872 979 (11 )%
Lighting(b) 456 462 (1 )%
Total industrial segment revenues 27,395 25,213 9 %
Capital 2,173 2,681 (19 )%
Total segment revenues 29,569 27,894 6 %
Corporate items and eliminations(a) (908 ) (1,013 ) Consolidated revenues $ 28,660 $ 26,881 7 %
Segment profit (loss)(a)
Power(b) $ 273 $ 438 (38 )%
Renewable Energy 77 70 10 %
Oil & Gas(c) (144 ) 260 U
Aviation 1,603 1,273 26 %
Healthcare 735 661 11 %
Transportation 130 95 37 %
Lighting(b) 1 10 (90 )%
Total industrial segment profit 2,675 2,807 (5 )%
Capital (215 ) (47 ) U
Total segment profit (loss) 2,460 2,760 (11 )%
Corporate items and eliminations(a) (653 ) (1,402 ) GE interest and other financial charges (642 ) (564 ) GE benefit (provision) for income taxes (112 ) (23 ) GE non-operating benefit costs (684 ) (649 ) Earnings (loss) from continuing operations
attributable to GE common shareowners 369 122 F
Earnings (loss) from discontinued operations, net of taxes (1,553 ) (239 ) U
Less net earnings attributable to noncontrolling interests, discontinued operations — —
Earnings (loss) from discontinued operations, net of tax and noncontrolling interests (1,553 ) (239 ) U
Consolidated net earnings (loss) attributable to GE common shareowners $ (1,184 ) $ (117 ) U
(a) Segment revenues include sales of products and services related to the segment. Segment profit excludes results reported as discontinued
operations and material accounting changes, the portion of earnings or loss attributable to noncontrolling interests of consolidated
subsidiaries, and as such only includes the portion of earnings or loss attributable to our share of the consolidated earnings or loss of
consolidated subsidiaries. Segment profit excludes or includes interest and other financial charges, non-operating benefit costs, income taxes,
and preferred stock dividends according to how a particular segment's management is measured – excluded in determining segment profit,
which we sometimes refer to as "operating profit," for Power, Renewable Energy, Oil & Gas, Aviation, Healthcare, Transportation and Lighting;
included in determining segment profit, which we sometimes refer to as "net earnings," for Capital. Other income is included in segment profit
for the industrial segments and the Capital segment. Certain corporate costs, such as shared services, employee benefits and information
technology are allocated to our segments based on usage. A portion of the remaining corporate costs is allocated based on each segment's
relative net cost of operations. Industrial segment revenues and profit include the sum of our seven industrial reporting segments without
giving effect to the elimination of transactions among such segments and between these segments and our financial services segment. Total
segment revenues and profit include the sum of our seven industrial segments and one financial services segment, without giving effect to the
elimination of transactions among such segments. We believe that this provides investors with a view as to the results of all of our segments,
without inter-segment eliminations and corporate items.
(b) Beginning in the third quarter of 2017, the Energy Connections business within the former Energy Connections & Lighting segment has been
combined with the Power segment and presented as one reporting segment called Power. As a result of this combination, our GE Lighting and
Current, powered by GE (Current) businesses, have been reported as a separate segment called Lighting.
(c) Oil & Gas segment profit (loss) includes $324 million of restructuring and other charges in the three months ended March 31, 2018. Excluding
this amount, Oil & Gas operating profit was $181 million in the three months ended March 31, 2018.
Amounts may not add due to rounding
6
GENERAL ELECTRIC COMPANY
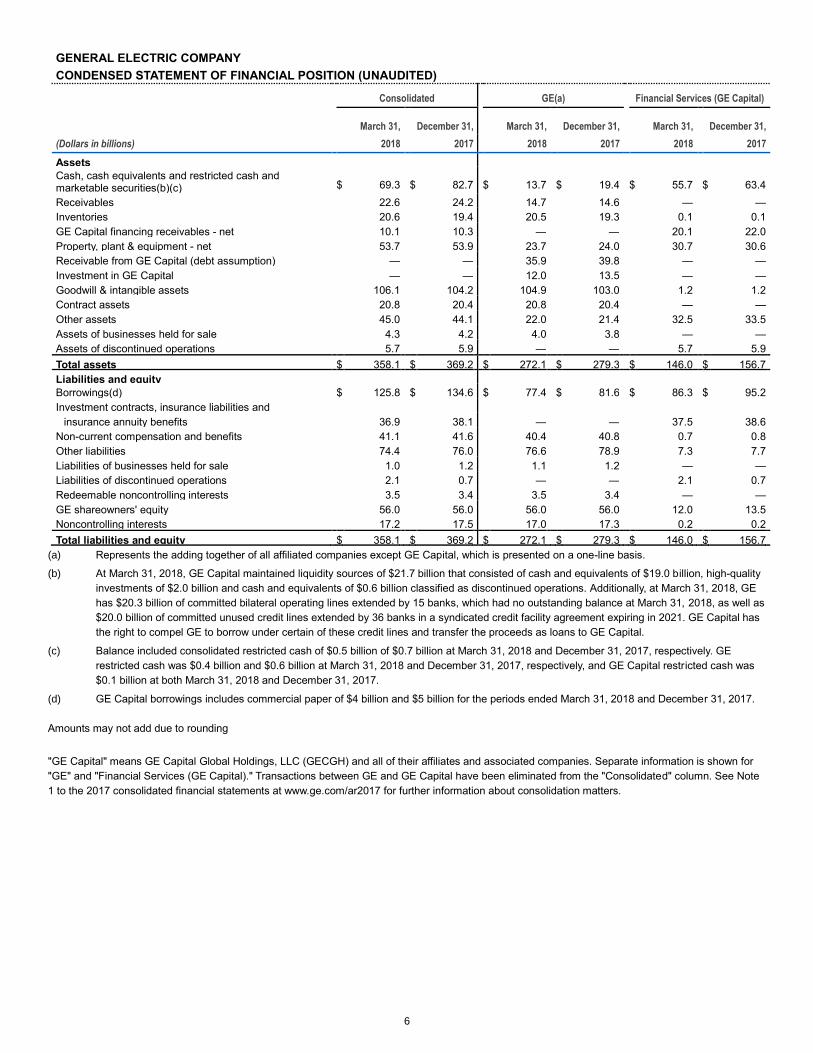
CONDENSED STATEMENT OF FINANCIAL POSITION (UNAUDITED)
Consolidated GE(a) Financial Services (GE Capital)
March 31, December 31, March 31, December 31, March 31, December 31,
(Dollars in billions) 2018 2017 2018 2017 2018 2017
Assets Cash, cash equivalents and restricted cash and marketable securities(b)(c) $ 69.3
$ 82.7
$ 13.7
$ 19.4
$ 55.7
$ 63.4
Receivables 22.6 24.2 14.7 14.6 — — Inventories 20.6 19.4 20.5 19.3 0.1 0.1 GE Capital financing receivables - net 10.1 10.3 — — 20.1 22.0 Property, plant & equipment - net 53.7 53.9 23.7 24.0 30.7 30.6 Receivable from GE Capital (debt assumption) — — 35.9 39.8 — — Investment in GE Capital — — 12.0 13.5 — — Goodwill & intangible assets 106.1 104.2 104.9 103.0 1.2 1.2 Contract assets 20.8 20.4 20.8 20.4 — — Other assets 45.0 44.1 22.0 21.4 32.5 33.5 Assets of businesses held for sale 4.3 4.2 4.0 3.8 — — Assets of discontinued operations 5.7 5.9 — — 5.7 5.9
Total assets $ 358.1 $ 369.2 $ 272.1 $ 279.3 $ 146.0 $ 156.7 Liabilities and equity Borrowings(d) $ 125.8 $ 134.6 $ 77.4 $ 81.6 $ 86.3 $ 95.2 Investment contracts, insurance liabilities and
insurance annuity benefits 36.9 38.1 — — 37.5 38.6 Non-current compensation and benefits 41.1 41.6 40.4 40.8 0.7 0.8 Other liabilities 74.4 76.0 76.6 78.9 7.3 7.7 Liabilities of businesses held for sale 1.0 1.2 1.1 1.2 — — Liabilities of discontinued operations 2.1 0.7 — — 2.1 0.7 Redeemable noncontrolling interests 3.5 3.4 3.5 3.4 — — GE shareowners' equity 56.0 56.0 56.0 56.0 12.0 13.5 Noncontrolling interests 17.2 17.5 17.0 17.3 0.2 0.2
Total liabilities and equity $ 358.1 $ 369.2 $ 272.1 $ 279.3 $ 146.0 $ 156.7 (a) Represents the adding together of all affiliated companies except GE Capital, which is presented on a one-line basis.
(b) At March 31, 2018, GE Capital maintained liquidity sources of $21.7 billion that consisted of cash and equivalents of $19.0 billion, high-quality
investments of $2.0 billion and cash and equivalents of $0.6 billion classified as discontinued operations. Additionally, at March 31, 2018, GE
has $20.3 billion of committed bilateral operating lines extended by 15 banks, which had no outstanding balance at March 31, 2018, as well as
$20.0 billion of committed unused credit lines extended by 36 banks in a syndicated credit facility agreement expiring in 2021. GE Capital has
the right to compel GE to borrow under certain of these credit lines and transfer the proceeds as loans to GE Capital.
(c) Balance included consolidated restricted cash of $0.5 billion of $0.7 billion at March 31, 2018 and December 31, 2017, respectively. GE
restricted cash was $0.4 billion and $0.6 billion at March 31, 2018 and December 31, 2017, respectively, and GE Capital restricted cash was
$0.1 billion at both March 31, 2018 and December 31, 2017.
(d) GE Capital borrowings includes commercial paper of $4 billion and $5 billion for the periods ended March 31, 2018 and December 31, 2017.
Amounts may not add due to rounding
"GE Capital" means GE Capital Global Holdings, LLC (GECGH) and all of their affiliates and associated companies. Separate information is shown for
"GE" and "Financial Services (GE Capital)." Transactions between GE and GE Capital have been eliminated from the "Consolidated" column. See Note
1 to the 2017 consolidated financial statements at www.ge.com/ar2017 for further information about consolidation matters.

7
GENERAL ELECTRIC COMPANY
Financial Measures That Supplement GAAP
We sometimes use financial measures derived from consolidated financial information but not presented in our financial statements
prepared in accordance with U.S. generally accepted accounting principles (GAAP). Certain of these are considered "non-GAAP
financial measures" under the U.S. Securities and Exchange Commission rules. The following non-GAAP financial measures
supplement our GAAP disclosures and should not be considered an alternative to the GAAP measure.
• Adjusted earnings and EPS
• Adjusted GE Industrial operating profit and operating profit margin (excluding certain items)
• GE Industrial segments organic revenue growth
• Oil & Gas organic revenue growth
• Healthcare organic revenue growth
• Oil & Gas organic operating profit growth
• GE Industrial structural costs
• GE Industrial free cash flows (FCF) and adjusted GE Industrial FCF
The reasons we use these non-GAAP financial measures and the reconciliations to their most directly comparable GAAP financial
measures follow. Certain columns, rows or percentages within these reconciliations may not add or recalculate due to the use of
rounded numbers. Totals and percentages presented are calculated from the underlying numbers in millions.
performance of the businesses we expect to retain after the disposition of most of our financial services business.

8
ADJUSTED EARNINGS AND EPS (NON-GAAP)
Three months ended March 31
(Dollars in millions; except per-share amounts) 2018 2017 V%
Consolidated earnings (loss) from continuing operations attributable to GE common shareowners (GAAP) $ 369 $ 122 F
Non-operating benefits costs (pre-tax) (GAAP) (684 ) (649 ) (5 )%
Tax effect on non-operating benefit costs 144 227 (37 )%
Less: non-operating benefit costs (net of tax) (540 ) (422 ) (28 )%
Operating earnings (GAAP) 909 544 67 %
Less: GE Capital earnings (loss) from continuing operations attributable to GE common shareowners (215 ) (47 ) U
GE Industrial operating earnings (GAAP) $ 1,125 $ 591 90 %
Gains (losses) and impairments for businesses held for sale (pre-tax) (67 ) 2 U
Tax effect on gains (losses) and impairments for businesses held for sale 24 (1 ) F
Less: Gains (losses) and impairments for businesses held for sale (net of tax) (43 ) 1 U
Restructuring & other (pre-tax) (522 ) (974 ) 46 %
Tax effect on restructuring & other 132 292 (55 )%
Less: restructuring & other (net of tax) (390 ) (681 ) 43 %
Less: GE Industrial U.S. tax reform enactment adjustment (31 ) — U
Adjusted GE Industrial operating earnings (Non-GAAP) 1,588 1,271 25 %
GE Capital earnings (loss) from continuing operations attributable to GE common shareowners (GAAP) (215 ) (47 ) U
Less: GE Capital U.S. tax reform enactment adjustment (45 ) — U
Adjusted GE Capital earnings (Non-GAAP) (170 ) (47 ) U
Adjusted GE Industrial operating earnings (Non-GAAP) 1,588 1,271 25 %
Add: Adjusted GE Capital earnings (Non-GAAP) (170 ) (47 ) U
Adjusted earnings (Non-GAAP) 1,418 1,224 16 %
Earnings (loss) per share (EPS) - diluted(b) Consolidated EPS from continuing operations attributable to GE common shareowners (GAAP) $ 0.04 $ 0.01 F
Non-operating benefits costs (pre-tax) (GAAP) (0.08 ) (0.07 ) Tax effect on non-operating benefit costs 0.02 0.03
Less: non-operating benefit costs (net of tax) (0.06 ) (0.05 ) Operating EPS (GAAP) 0.10 0.06 67 %
Less: GE Capital EPS from continuing operations attributable to GE common shareowners (0.02 ) (0.01 ) GE Industrial operating EPS (GAAP) 0.13 0.07 86 %
Gains (losses) and impairments for businesses held for sale (pre-tax) (0.01 ) — Tax effect on gains (losses) and impairments for businesses held for sale — —
Less: Gains (losses) and impairments for businesses held for sale (net of tax) — — Restructuring & other (pre-tax) (0.06 ) (0.11 ) Tax effect on restructuring & other 0.02 0.03 Less: restructuring & other (net of tax) (0.04 ) (0.08 ) Less: GE Industrial U.S. tax reform enactment adjustment — — Adjusted GE Industrial operating EPS (Non-GAAP) 0.18 0.14 29 %
GE Capital EPS from continuing operations attributable to GE common shareowners (GAAP) (0.02 ) (0.01 ) (100 )%
Less: GE Capital U.S. tax reform enactment adjustment (0.01 ) — Adjusted GE Capital EPS (Non-GAAP) (0.02 ) (0.01 ) (100 )%
Adjusted GE Industrial operating EPS (Non-GAAP) 0.18 0.14 29 %
Add: Adjusted GE Capital EPS (Non-GAAP) (0.02 ) (0.01 ) Adjusted EPS (Non-GAAP) $ 0.16 $ 0.14 14 %
(a) The tax effect on non-operating benefit costs was calculated using a 21% U.S. federal statutory tax rate, based on its applicability to such cost. (b) Earnings-per-share amounts are computed independently. As a result, the sum of per-share amounts may not equal the total. Adjusted earnings (loss) and EPS* excludes non-operating benefit costs, gains, and restructuring and other items, after tax. The service cost of our
pension and other benefit plans are included in adjusted earnings, which represents the ongoing cost of providing pension benefits to our employees. The components of non-operating benefit costs are mainly driven by capital allocation decisions and market performance, and we manage these separately from the operational performance of our businesses. Gains and restructuring and other items are impacted by the timing and magnitude of gains associated with dispositions, and the timing and magnitude of costs associated with restructuring activities. We believe that the retained costs in Adjusted earnings and EPS* provides management and investors a useful measure to evaluate the performance of the total company, and increases period-to-period comparability. We also use Adjusted EPS* as a performance metric at the company level for our annual executive incentive plan for 2018. We believe that presenting Adjusted Industrial earnings and EPS* separately for our financial services businesses also provides management and investors with useful information about the relative size of our industrial and financial services businesses in relation to the total company.
*Non-GAAP Financial Measure
9
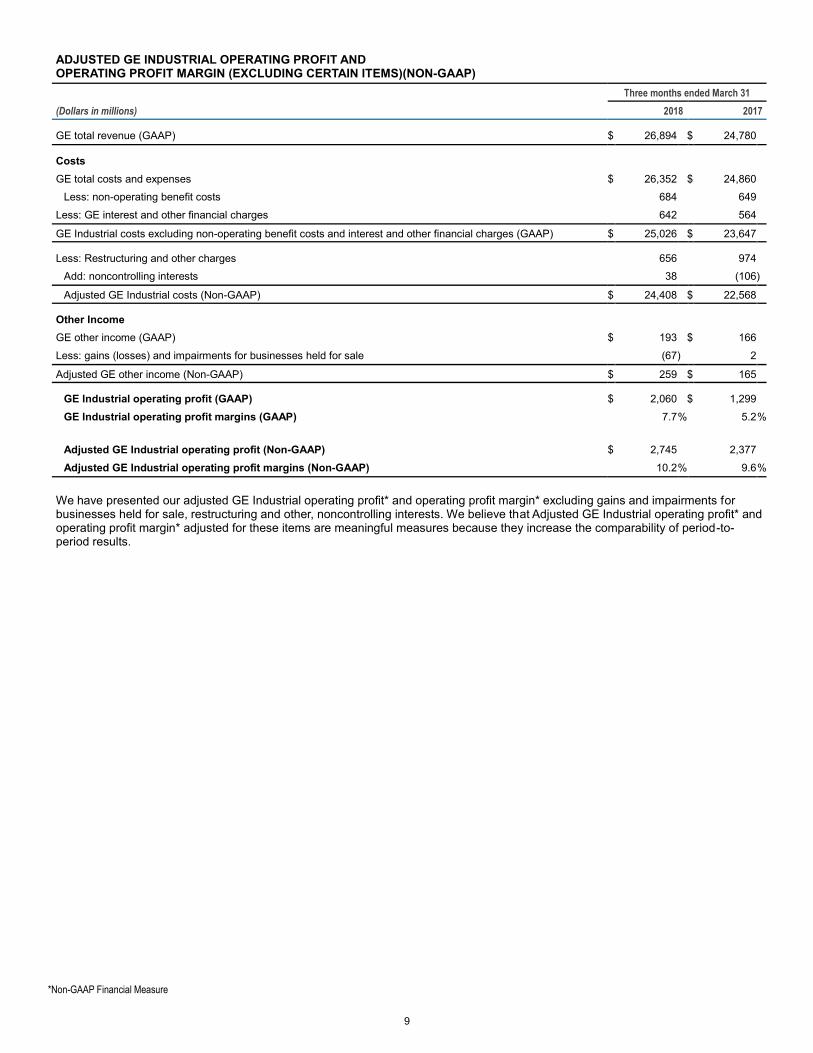
ADJUSTED GE INDUSTRIAL OPERATING PROFIT AND OPERATING PROFIT MARGIN (EXCLUDING CERTAIN ITEMS)(NON-GAAP)
Three months ended March 31
(Dollars in millions) 2018 2017
GE total revenue (GAAP) $ 26,894 $ 24,780
Costs
GE total costs and expenses $ 26,352 $ 24,860
Less: non-operating benefit costs 684 649
Less: GE interest and other financial charges 642 564
GE Industrial costs excluding non-operating benefit costs and interest and other financial charges (GAAP) $ 25,026 $ 23,647
Less: Restructuring and other charges 656 974
Add: noncontrolling interests 38 (106 )
Adjusted GE Industrial costs (Non-GAAP) $ 24,408 $ 22,568
Other Income
GE other income (GAAP) $ 193 $ 166
Less: gains (losses) and impairments for businesses held for sale (67 ) 2
Adjusted GE other income (Non-GAAP) $ 259 $ 165
GE Industrial operating profit (GAAP) $ 2,060 $ 1,299
GE Industrial operating profit margins (GAAP) 7.7 % 5.2 %
Adjusted GE Industrial operating profit (Non-GAAP) $ 2,745 2,377
Adjusted GE Industrial operating profit margins (Non-GAAP) 10.2 % 9.6 %
We have presented our adjusted GE Industrial operating profit* and operating profit margin* excluding gains and impairments for businesses held for sale, restructuring and other, noncontrolling interests. We believe that Adjusted GE Industrial operating profit* and operating profit margin* adjusted for these items are meaningful measures because they increase the comparability of period-to-period results.
*Non-GAAP Financial Measure
10
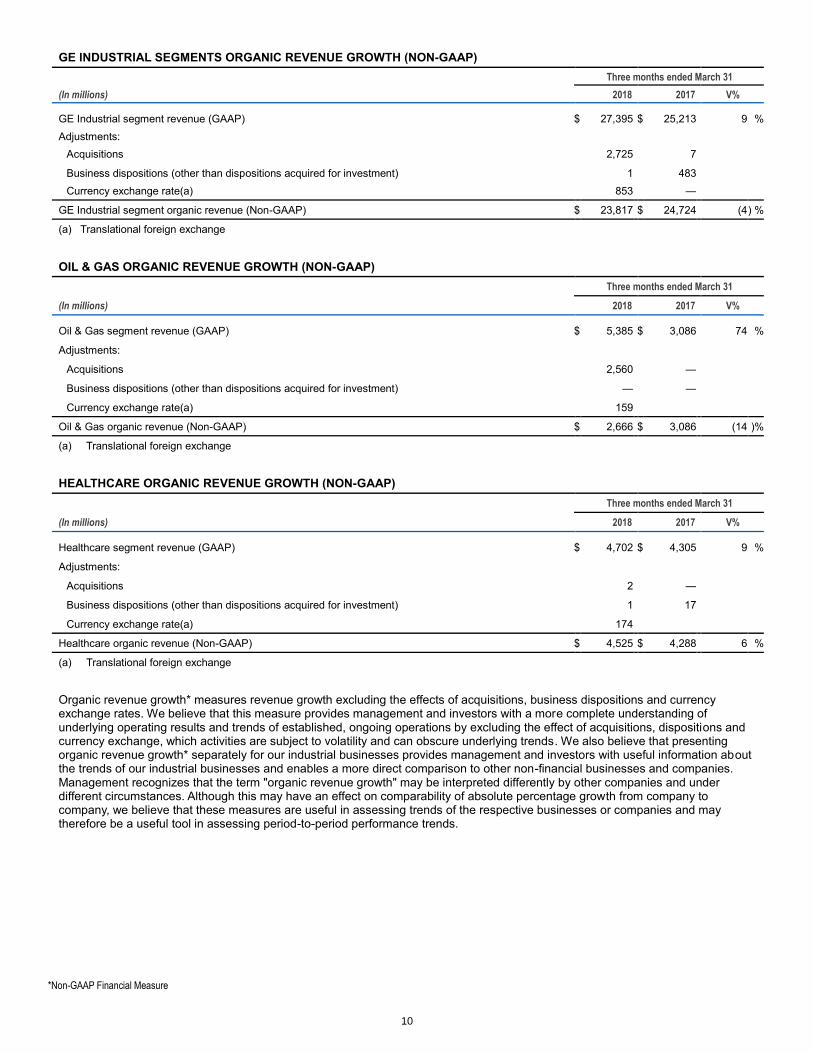
GE INDUSTRIAL SEGMENTS ORGANIC REVENUE GROWTH (NON-GAAP)
Three months ended March 31
(In millions) 2018 2017 V%
GE Industrial segment revenue (GAAP) $ 27,395 $ 25,213 9 %
Adjustments:
Acquisitions 2,725 7
Business dispositions (other than dispositions acquired for investment) 1 483
Currency exchange rate(a) 853 —
GE Industrial segment organic revenue (Non-GAAP) $ 23,817 $ 24,724 (4 ) %
(a) Translational foreign exchange
OIL & GAS ORGANIC REVENUE GROWTH (NON-GAAP)
Three months ended March 31
(In millions) 2018 2017 V%
Oil & Gas segment revenue (GAAP) $ 5,385 $ 3,086 74 %
Adjustments:
Acquisitions 2,560 —
Business dispositions (other than dispositions acquired for investment) — —
Currency exchange rate(a) 159
Oil & Gas organic revenue (Non-GAAP) $ 2,666 $ 3,086 (14 )%
(a) Translational foreign exchange
HEALTHCARE ORGANIC REVENUE GROWTH (NON-GAAP)
Three months ended March 31
(In millions) 2018 2017 V%
Healthcare segment revenue (GAAP) $ 4,702 $ 4,305 9 %
Adjustments:
Acquisitions 2 —
Business dispositions (other than dispositions acquired for investment) 1 17
Currency exchange rate(a) 174
Healthcare organic revenue (Non-GAAP) $ 4,525 $ 4,288 6 %
(a) Translational foreign exchange
Organic revenue growth* measures revenue growth excluding the effects of acquisitions, business dispositions and currency exchange rates. We believe that this measure provides management and investors with a more complete understanding of underlying operating results and trends of established, ongoing operations by excluding the effect of acquisitions, dispositions and currency exchange, which activities are subject to volatility and can obscure underlying trends. We also believe that presenting organic revenue growth* separately for our industrial businesses provides management and investors with useful information about the trends of our industrial businesses and enables a more direct comparison to other non-financial businesses and companies. Management recognizes that the term "organic revenue growth" may be interpreted differently by other companies and under different circumstances. Although this may have an effect on comparability of absolute percentage growth from company to company, we believe that these measures are useful in assessing trends of the respective businesses or companies and may therefore be a useful tool in assessing period-to-period performance trends.
*Non-GAAP Financial Measure

11
OIL & GAS ORGANIC OPERATING PROFIT GROWTH (NON-GAAP)
Three months ended March 31
(In millions) 2018 2017 V%
Oil & Gas segment operating profit (GAAP) $ (144 ) $ 260 U
Less: restructuring (324 )
Adjusted Oil & Gas segment operating profit (Non-GAAP) $ 181 $ 260
Adjustments:
Acquisitions 121 —
Business dispositions (other than dispositions required for investment) — —
Currency exchange rate(a) 5 —
Oil & Gas organic operating profit (Non-GAAP) $ 55 $ 260 (79 )%
(a) Translational foreign exchange
Organic operating profit growth* measures profit excluding the effects of acquisitions, business dispositions and currency exchange rates. We believe that this measure provides management and investors with a more complete understanding of underlying operating results and trends of established, ongoing operations by excluding the effect of acquisitions, dispositions and currency exchange, which activities are subject to volatility and can obscure underlying trends. Management recognizes that the term "organic operating profit growth" may be interpreted differently by other companies and under different circumstances. Although this may have an effect on comparability of absolute percentage growth from company to company, we believe that these measures are useful in assessing trends of the Oil & Gas business and may therefore be a useful tool in assessing period-to-period performance trends.
GE INDUSTRIAL STRUCTURAL COSTS (NON-GAAP)
Three months ended March 31
(In millions) 2018 2017 V$
GE Industrial costs excluding interest and other financial charges and non-operating benefit costs (GAAP) $ 25,026 $ 23,647 $ 1,379
Less: Segment variable costs 18,757 16,932 Less: Segment restructuring & other charges 280 12 Less: Segment acquisitions/dispositions structural costs and impact from foreign exchange 306 (376 ) Less: Corporate restructuring & other charges 331 974 Add: Corporate revenues, other income and NCI (excluding gains and GE Capital eliminations) 373 424 GE Industrial structural costs (Non-GAAP) $ 5,725 $ 6,530 $ (805 )
GE Industrial structural costs* include segment structural costs excluding the impact of restructuring and other charges, business acquisitions and dispositions, foreign exchange, plus total Corporate operating profit excluding restructuring and other charges and gains. The Baker Hughes acquisition is represented on a pro-forma basis, which means we calculated our structural costs by including legacy Baker Hughes results for the three months ended March 31, 2017.
We believe that GE Industrial structural costs* are a meaningful measure as they are broader than selling, general and administrative costs and represent the total structural costs in the industrial segments and Corporate that generally do not vary with volume.
*Non-GAAP Financial Measure

12
GE INDUSTRIAL FREE CASH FLOWS (FCF) AND ADJUSTED GE INDUSTRIAL FCF (NON-GAAP)
Three months ended March 31
(Dollars in millions) 2018 2017 V$
GE CFOA (GAAP) $ (1,012 ) $ 368 $ (1,380 )
Add: Gross additions to PP&E (882 ) (992 )
Add: Gross additions to internal-use software (91 ) (124 )
Less: Dividends from GE Capital — 2,000
Less: GE Pension Plan funding (287 ) —
Less: Taxes related to business sale — —
GE Industrial Free Cash Flows (Non-GAAP) $ (1,698 ) $ (2,748 ) $ 1,050
Less: Oil & Gas CFOA 291 $ —
Less: Oil & Gas gross additions to PP&E (173 ) $ —
Less: Oil & Gas gross additions to internal-use software (9 ) $ —
Add: BHGE Class B shareholder dividend 127 $ —
Adjusted GE Industrial Free Cash Flows (Non-GAAP) $ (1,681 ) $ (2,748 ) $ 1,067
In 2018, GE transitioned from reporting an Adjusted GE Industrial CFOA metric to measuring itself on a GE Industrial Free Cash Flow basis*. This metric includes GE CFOA plus investments in property, plant and equipment and additions to internal-use software; this metric excludes any dividends received from GE Capital, any cash received from dispositions of property, plant, and equipment and internal-use software.
We believe that investors may also find it useful to compare GE’s Industrial free cash flow performance without the effects of cash used for deal taxes and contributions to the GE Principal Pension Plan. We believe that this measure will better allow management and investors to evaluate the capacity of our industrial operations to generate free cash flows. In addition, we report Adjusted GE Industrial Free Cash Flows* in order to provide a more fair representation of the cash that we are entitled to utilize in a given period. We also use Adjusted GE Industrial Free Cash Flows* as a performance metric at the company-wide level for our annual executive incentive plan for 2018.
Management recognizes that the term free cash flow may be interpreted differently by other companies and under different circumstances. Although this may have an effect on comparability of absolute percentage growth from company to company, we believe that these measures are useful in assessing trends of the respective businesses or companies and may therefore be a useful tool in assessing period-to-period performance trends.
*Non-GAAP Financial Measure
13
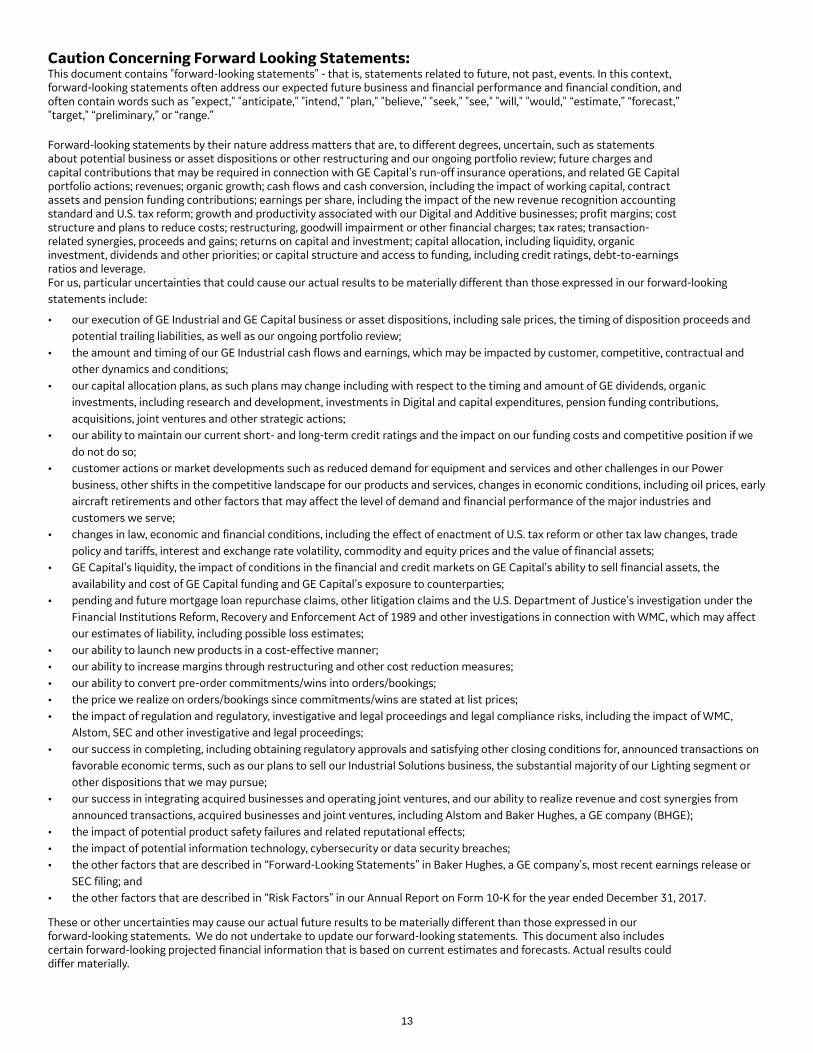
Caution Concerning Forward Looking Statements: This document contains "forward-looking statements" - that is, statements related to future, not past, events. In this context, forward-looking statements often address our expected future business and financial performance and financial condition, and often contain words such as "expect," "anticipate," "intend," "plan," "believe," "seek," "see," "will," "would," “estimate,” “forecast,” "target," “preliminary,” or “range.”
Forward-looking statements by their nature address matters that are, to different degrees, uncertain, such as statements about potential business or asset dispositions or other restructuring and our ongoing portfolio review; future charges and capital contributions that may be required in connection with GE Capital’s run-off insurance operations, and related GE Capital portfolio actions; revenues; organic growth; cash flows and cash conversion, including the impact of working capital, contract assets and pension funding contributions; earnings per share, including the impact of the new revenue recognition accounting standard and U.S. tax reform; growth and productivity associated with our Digital and Additive businesses; profit margins; cost structure and plans to reduce costs; restructuring, goodwill impairment or other financial charges; tax rates; transaction-related synergies, proceeds and gains; returns on capital and investment; capital allocation, including liquidity, organic investment, dividends and other priorities; or capital structure and access to funding, including credit ratings, debt-to-earnings ratios and leverage. For us, particular uncertainties that could cause our actual results to be materially different than those expressed in our forward-looking
statements include:
• our execution of GE Industrial and GE Capital business or asset dispositions, including sale prices, the timing of disposition proceeds and
potential trailing liabilities, as well as our ongoing portfolio review;
• the amount and timing of our GE Industrial cash flows and earnings, which may be impacted by customer, competitive, contractual and
other dynamics and conditions;
• our capital allocation plans, as such plans may change including with respect to the timing and amount of GE dividends, organic
investments, including research and development, investments in Digital and capital expenditures, pension funding contributions,
acquisitions, joint ventures and other strategic actions;
• our ability to maintain our current short- and long-term credit ratings and the impact on our funding costs and competitive position if we
do not do so;
• customer actions or market developments such as reduced demand for equipment and services and other challenges in our Power
business, other shifts in the competitive landscape for our products and services, changes in economic conditions, including oil prices, early
aircraft retirements and other factors that may affect the level of demand and financial performance of the major industries and
customers we serve;
• changes in law, economic and financial conditions, including the effect of enactment of U.S. tax reform or other tax law changes, trade
policy and tariffs, interest and exchange rate volatility, commodity and equity prices and the value of financial assets;
• GE Capital’s liquidity, the impact of conditions in the financial and credit markets on GE Capital’s ability to sell financial assets, the
availability and cost of GE Capital funding and GE Capital’s exposure to counterparties;
• pending and future mortgage loan repurchase claims, other litigation claims and the U.S. Department of Justice’s investigation under the
Financial Institutions Reform, Recovery and Enforcement Act of 1989 and other investigations in connection with WMC, which may affect
our estimates of liability, including possible loss estimates;
• our ability to launch new products in a cost-effective manner;
• our ability to increase margins through restructuring and other cost reduction measures;
• our ability to convert pre-order commitments/wins into orders/bookings;
• the price we realize on orders/bookings since commitments/wins are stated at list prices;
• the impact of regulation and regulatory, investigative and legal proceedings and legal compliance risks, including the impact of WMC,
Alstom, SEC and other investigative and legal proceedings;
• our success in completing, including obtaining regulatory approvals and satisfying other closing conditions for, announced transactions on
favorable economic terms, such as our plans to sell our Industrial Solutions business, the substantial majority of our Lighting segment or
other dispositions that we may pursue;
• our success in integrating acquired businesses and operating joint ventures, and our ability to realize revenue and cost synergies from
announced transactions, acquired businesses and joint ventures, including Alstom and Baker Hughes, a GE company (BHGE);
• the impact of potential product safety failures and related reputational effects;
• the impact of potential information technology, cybersecurity or data security breaches;
• the other factors that are described in “Forward-Looking Statements” in Baker Hughes, a GE company’s, most recent earnings release or
SEC filing; and
• the other factors that are described in “Risk Factors” in our Annual Report on Form 10-K for the year ended December 31, 2017.
These or other uncertainties may cause our actual future results to be materially different than those expressed in our forward-looking statements. We do not undertake to update our forward-looking statements. This document also includes certain forward-looking projected financial information that is based on current estimates and forecasts. Actual results could differ materially.

14
General Electric Capital Corporation (GECC) was merged into GE and our financial services business is now operated by GE Capital Global Holdings, LLC (GECGH). We refer to GECC and GECGH as “GE Capital”. We refer to the industrial businesses of the Company including GE Capital on an equity basis as “GE”. “GE (ex-GE Capital)” and /or “Industrial” refer to GE excluding GE Capital.
GE’s Investor Relations website at www.ge.com/investor and our corporate blog at www.gereports.com, as well as GE’s Facebook page and Twitter accounts, contain a significant amount of information about GE, including financial and other information for investors. GE encourages investors to visit these websites from time to time, as information is updated and new information is posted.
Supplemental Financial Information Supplemental financial information can be found on the Company’s website at: ge.com/investor under Events and Reports.
Conference Call and Webcast The Company has scheduled an investor conference call to discuss management’s outlook and the results reported in today’s earnings announcement. The call will begin at 8:30 a.m. Eastern time, on Friday, April 20, 2018, the content of which is not part of this earnings release. A slide presentation providing summary financial and statistical information that will be discussed on the call will also be posted to the Company’s website and available for real-time viewing at ge.com/investor. The conference call will be broadcast live via a webcast and can be accessed by visiting the Events and Reports page on the Company’s website at: ge.com/investor. An archived version of the webcast will be available on the website after the call.
About GE GE (NYSE:GE) drives the world forward by tackling its biggest challenges: Energy, health, transportation—the essentials of modern life. By combining world-class engineering with software and analytics, GE helps the world work more efficiently, reliably, and safely. For more than 125 years, GE has invented the future of industry, and today it leads new paradigms in additive manufacturing, materials science, and data analytics. GE people are global, diverse and dedicated, operating with the highest integrity and passion to fulfill GE’s mission and deliver for our customers. www.ge.com GE Investor Contact: Matt Cribbins, 617.443.3400 [email protected] GE Media Contact: Jennifer Erickson, 646.682.5620 [email protected]


![-púà·H elË|åT `OXß= ã ]ë ëW{Å ýOÃ+³äÑ?N qh...1 (1) Financial Summary Revenues 161.0 JPY billion (down 10% on 2001/6) Expenses 136.3 JPY billion (down 13% on 2001/6)](https://img.pdfslide.net/doc/110x75/5f97302eee1e186061080392/-ph-elt-ox-w-ofn-qh-1-1-financial-summary.jpg)