Embed Size (px)
Citation preview
GEE Papers Número 40 Setembro de 2011
FDI and Institutional Reform in Portugal
Paulo Júlio Ricardo Pinheiro Alves
José Tavares
FDI and institutional reform in Portugal
FDI and institutional reform in Portugal*
Abstract:
This article analyses the effects of several geographic, economic and institutional factors on bilateral inward FDI in
Europe. Moreover, it assesses the required reform effort, and the expected benefits, for Portugal to converge with
the EU in the institutional variables that are relevant to attract investment. We conclude that good institutions fa-
vouring economic freedom and the ease of doing business, and geography, market size and labor costs, affect
bilateral inward FDI. Political risk does not lead to significant differences in FDI across the EU. The results are
robust to different methods – principal component analysis, factor-based scores and by considering several institu-
tional indicators successively. We also find that most promising reforms arise in the financial system, corruption,
property rights, and in some business regulations associated with starting a business. Increasing labor market
flexibility to the EU level has also a large impact on inward FDI, but this reform comes at a comparatively higher
effort.
Acknowledgments
We are extremely grateful to Francisco Veiga and to all the participants in the 5th
Annual Meeting of the Portu-
guese Economic Journal (Aveiro, July 2011) for precious comments and suggestions, and to Inês Cabo for excel-
lent research assistance.
Paulo Júlio Gabinete de Estratégia e Estudos, Portuguese Ministry of Economy and Employment, and NOVA School
of Business and Economics
Email: [email protected]
Ricardo Pinheiro Alves Gabinete de Estratégia e Estudos, Portuguese Ministry of Economy and Employment and Instituto de Artes Visuais, Design e Marketing Email: [email protected]
José Tavares NOVA School of Business and Economics and Center for Economic Policy Research Email: [email protected]
JEL Classification: F30, H00
Keywords: FDI, Institutional reform, Institutions, Portugal, EU
* The opinions expressed in this article represent the views of the authors and do not necessarily correspond to those of the Ministry of Economy and Employment.
FDI and institutional reform in Portugal
Index
1. Introduction 1
2. Literature review 3
3. Data 5
4. Econometric approach 8
5. Results 10
5.1. Economic determinants of FDI 10
5.2. Institutional determinants 11
5.2.1. A principal components analysis 12
5.2.2. A factor-based scores approach 14
5.2.3. Institutional analysis - a breakdown 16
6. Measuring institutional reform in Portugal 19
7. Concluding remarks and policy implications 23
FDI and institutional reform in Portugal∗
Paulo Julio† Ricardo Pinheiro-Alves‡ Jose Tavares§
September 13, 2011
Abstract
This article analyzes the effects of several geographic, economic and institutional fac-tors on bilateral inward FDI in Europe. Moreover, it assesses the required reform effort,and the expected benefits, for Portugal to converge with the EU in the institutionalvariables that are relevant to attract investment. We conclude that good institutionsfavoring economic freedom and the ease of doing business, and geography, market sizeand labor costs, affect bilateral inward FDI. Political risk does not lead to significantdifferences in FDI across the EU. The results are robust to different methods—principalcomponent analysis, factor-based scores and by considering several institutional indi-cators successively. We also find that the most promising reforms arise in the financialsystem, corruption, property rights, and in some business regulations associated withstarting a business. Increasing labor market flexibility to the EU level has also a largeimpact on inward FDI, but this reform comes at a comparatively higher effort.
JEL Classification: F30, H00Keywords: FDI, Institutional reform, Institutions, Portugal, EU
∗We are extremely grateful to Francisco Veiga and to all the participants in the 5th Annual Meeting ofthe Portuguese Economic Journal (Aveiro, July 2011) for precious comments and suggestions, and to InesCabo for excellent research assistance.†Gabinete de Estrategia e Estudos, Portuguese Ministry of Economy and Employment, and NOVA School
of Business and Economics. Corresponding author: [email protected].‡Gabinete de Estrategia e Estudos, Portuguese Ministry of Economy and Employment, and Instituto de
Artes Visuais, Design e Marketing.§NOVA School of Business and Economics and Centre for Economic Policy Research.
1 Introduction
The purpose of this article is twofold. Firstly, it analyzes the effects of economic and in-
stitutional factors, including some business regulations, on bilateral inward Foreign Direct
Investment (FDI) into Europe. To obtain a full characterization of the institutional envi-
ronment, we use 3 distinct databases: the Index of Economic Freedom (IEF), the political
risk rating from the International Country Risk Guide (ICRG), and the Doing Business
(DB) database. Secondly, it evaluates the benefits of reforming Portuguese institutions to
the European Union (EU) average level—both viz-a-viz the EU-15 and the EU-27. The
conclusions enable the formulation some policy recommendations as to the institutional
areas in which a reform should be prioritized.
Since the 1990s, FDI has become increasingly important in a globalized economy, both
for developed and developing countries. According to the UNCTAD, FDI in developing
economies went up to around 28% of GDP in 2009, from 13% in 1990, while in developed
economies it has gone up to 31% from 9% of GDP in the same time period. When registered
in millions of dollars, this trend resulted in a worldwide fivefold increase in FDI, at a yearly
growth rate of 8.6% between 1990 and 2009. However, developed economies are hosts of
almost three quarters of these inflows, of which more than half is targeted to the EU.
A large fraction of this trend can be explained by the increasing internationalization
of multinational firms. Horstmann and Markusen (1992) and Brainard (1997) developed
a proximity-concentration model to explain multi-plant multinationals and two-way hor-
izontal FDI, which arise when the access to markets becomes relatively less expensive in
comparison with exporting. Helpman et al. (2004) consider that firms rationally decide
whether of serve foreign costumers, and whether they should do so through exports or
through outbound FDI. They conclude that only the efficient firms choose to serve foreign
costumers, and only the most efficient ones do so through FDI.1 Whereas a firm deciding
to export its products is able to concentrate production in one place, benefiting from scale
economies, it may have to incur in large transaction costs, namely those associated with
transporting and licensing a product abroad, in order to successfully sell its products in the
foreign market. FDI may lessen these transaction costs, but also brings new ones, namely
communication costs, training costs for personnel, language barriers, and unfamiliarity with
local business and government practices. On the other hand, FDI may allow a multina-
tional firm to access cheap or qualified labor, natural resources and strategic assets, and
better regulations and business practices (e.g. Dunning, 2008). Obviously, a corporation
should engage in FDI only when the net benefits of exporting a product to a given market
are outweighed by the net benefits of producing the product locally.
From the viewpoint of host countries, FDI also brings several advantages besides its di-
1Bhattacharya et al. (2010) extend this idea to the tradable services sector, by considering a setup wheretransport costs are zero, but serving the foreign market through exports induces risk in the consumer utilityfunction. They conclude that, in this case, the least productive firms are the ones that engage in FDI.
1
5 5.5 6 6.5 7 7.5 8 8.5 9 9.5-6
-4
-2
0
2
4
6
Firms freedom
Res
idua
ls
(a) Firms freedom
6 6.5 7 7.5 8 8.5 9-6
-4
-2
0
2
4
6
Ease of doing business
Res
idua
ls
(b) Ease of doing business
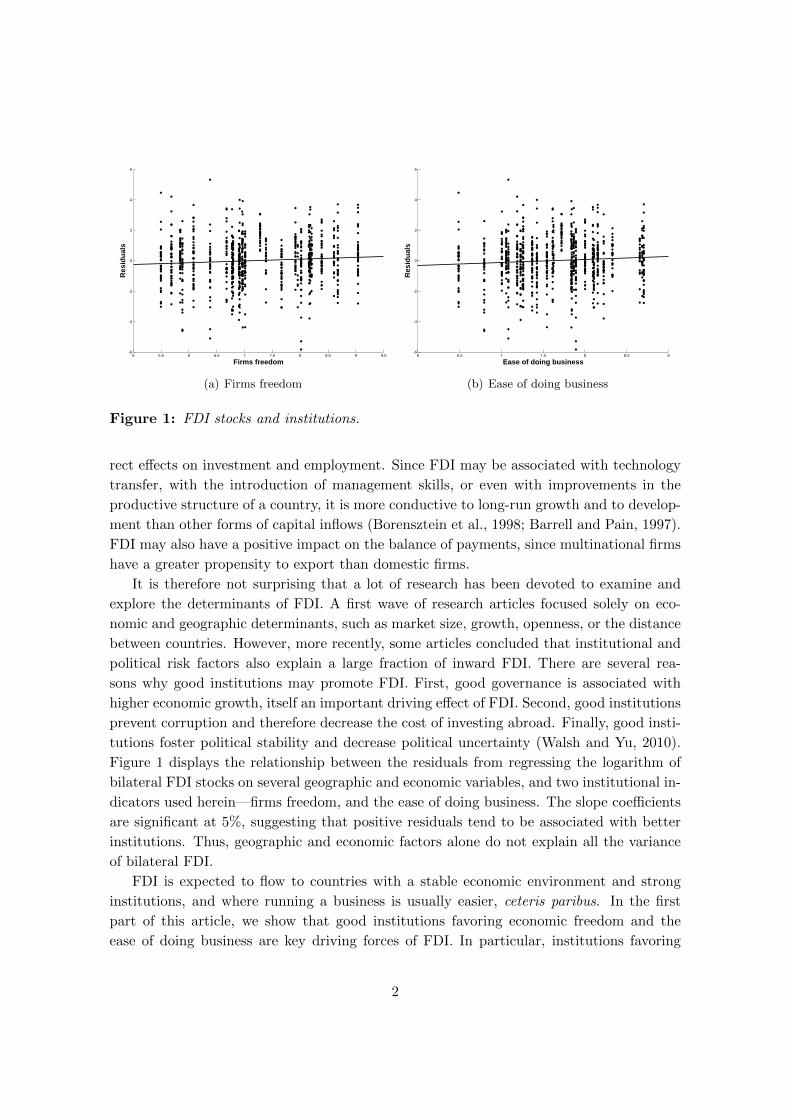
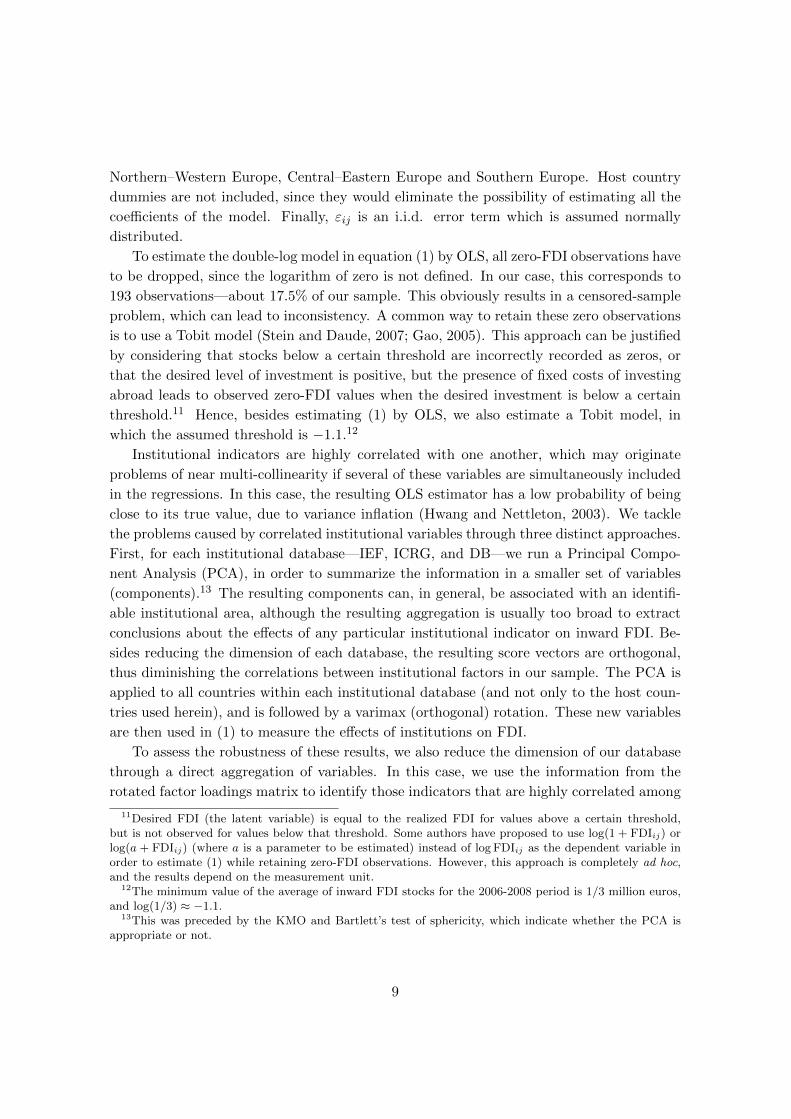
Figure 1: FDI stocks and institutions.
rect effects on investment and employment. Since FDI may be associated with technology
transfer, with the introduction of management skills, or even with improvements in the
productive structure of a country, it is more conductive to long-run growth and to develop-
ment than other forms of capital inflows (Borensztein et al., 1998; Barrell and Pain, 1997).
FDI may also have a positive impact on the balance of payments, since multinational firms
have a greater propensity to export than domestic firms.
It is therefore not surprising that a lot of research has been devoted to examine and
explore the determinants of FDI. A first wave of research articles focused solely on eco-
nomic and geographic determinants, such as market size, growth, openness, or the distance
between countries. However, more recently, some articles concluded that institutional and
political risk factors also explain a large fraction of inward FDI. There are several rea-
sons why good institutions may promote FDI. First, good governance is associated with
higher economic growth, itself an important driving effect of FDI. Second, good institutions
prevent corruption and therefore decrease the cost of investing abroad. Finally, good insti-
tutions foster political stability and decrease political uncertainty (Walsh and Yu, 2010).
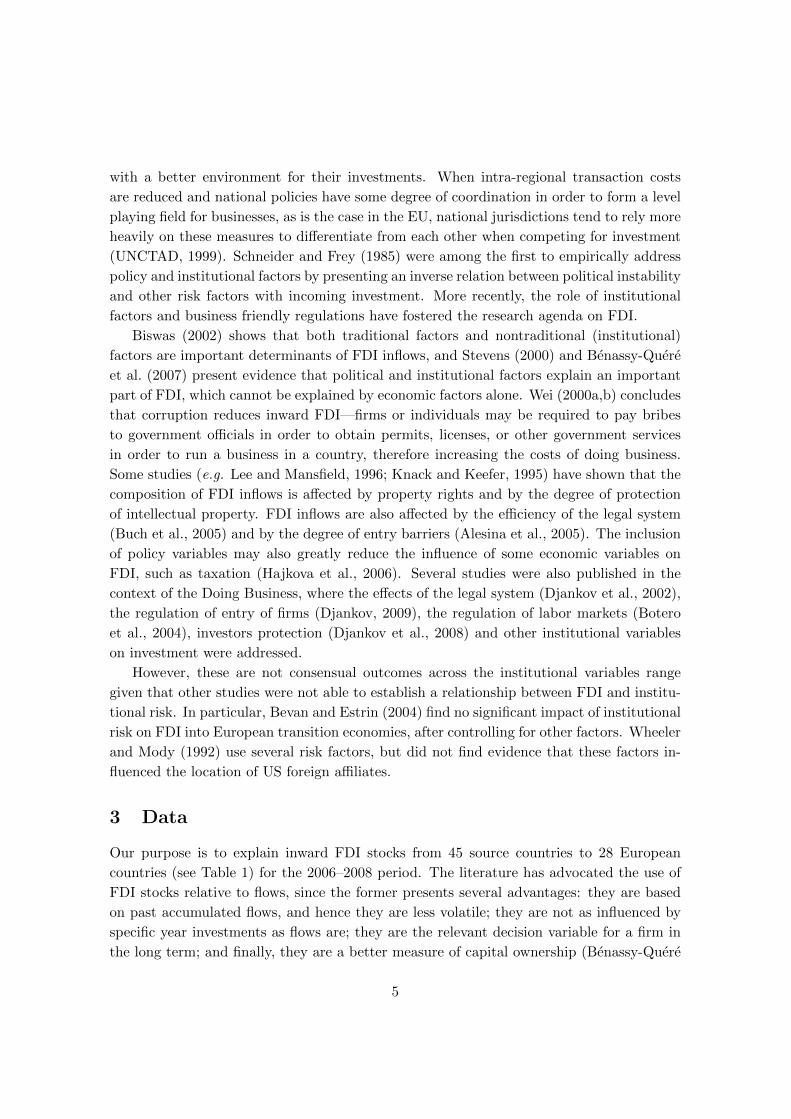
Figure 1 displays the relationship between the residuals from regressing the logarithm of
bilateral FDI stocks on several geographic and economic variables, and two institutional in-
dicators used herein—firms freedom, and the ease of doing business. The slope coefficients
are significant at 5%, suggesting that positive residuals tend to be associated with better
institutions. Thus, geographic and economic factors alone do not explain all the variance
of bilateral FDI.
FDI is expected to flow to countries with a stable economic environment and strong
institutions, and where running a business is usually easier, ceteris paribus. In the first
part of this article, we show that good institutions favoring economic freedom and the
ease of doing business are key driving forces of FDI. In particular, institutions favoring
2
the absence of corruption, the independence of the financial system, and efficient business
regulations—mainly those related with starting a business and cross-border trade—tend to
foster inward FDI. Political risk, on the other hand, presents a less robust effect on FDI, a
fact that may result from the set of countries used herein.
This approach obviously leaves unanswered the question of which areas are most promis-
ing for reform. In the second part of this article, we use three indicators to measure the
effects of reforming Portuguese institutions and business regulations to the EU-15 and to
the EU-27 levels, namely: the effect of the reform on FDI, the required reform effort, and
the efficiency of the reform. We find that, for those areas in which Portugal is lagging
behind the EU average, the most promising reforms consist in increasing the independence
of the financial system, lowering the levels of corruption, and improving property rights and
some business regulations—mainly by decreasing the bureaucracy associated with starting
a business. Increasing labor market flexibility to the EU level has also a large impact on
inward FDI; however, reforming this area requires a comparatively higher effort.
This article is organized as follows. The next section reviews the literature. Section
3 presents the data used in the empirical analysis. Section 4 introduces the econometric
methodology. Section 5 discusses the results. Section 6 deals with institutional reform in
Portugal. Section 7 concludes.
2 Literature Review
The empirical literature on FDI was initially focused on economic factors.2 The market
size or market potential—usually a GDP measure, population, or economic growth—are
among the most extensively discussed economic determinants of FDI. Billington (1999)
and Scaperlanda and Balough (1983) find that market size and growth have a statistically
significant impact on FDI locations. Using a simultaneous equation model, Tsai (1994)
also shows that domestic market size is a key determinant of FDI, but the role of growth
is dubious. Janicki and Wunnava (2004) show that GDP positively affected FDI for EU
accession candidates. Many other studies found similar relationships between market vari-
ables and FDI—e.g. Kravis and Lipsey (1982), Culem (1988), Wheeler and Mody (1992),
Barrell and Pain (1996), Love and Lage-Hidalgo (2000).
Taxes are also a key determinant of FDI. The empirical analysis of the effects of taxation
on FDI dates back, at least, to Hartman (1984, 1985), who had suggested a negative
relationship between these variables. Using a panel approach, Cassou (1997) also finds
that host country corporate tax rates have a significant negative impact on investment
flows. Related conclusions are also shared by Grubert and Mutti (1991), who show that
real investment responds to the host country effective tax rates, by Devereux and Griffith
(1998), who show that average effective tax rates influence firm location choices, and by
2See Caves (2007) and Blonigen (2005) for a survey of the literature.
3
Hines (1996), who finds that state taxes significantly influenced the FDI pattern in the
United States (US). However, contrary evidence is found in Swenson (1994), who argues
that greater average tax rates increase FDI.3
There are other economic determinants which are less consensual. For instance, it is
expected that labor costs present a negative impact on inward FDI, ceteris paribus. This
is shown to be true by Culem (1988), Barrell and Pain (1996), Bevan and Estrin (2004)
and Janicki and Wunnava (2004), but other authors—e.g. Tsai (1994), Wheeler and Mody
(1992), Kravis and Lipsey (1982)—have found insignificant or opposite relationships. This
mixed evidence can be explained by the role of labor productivity in FDI, which is highly
correlated with labor costs. The degree of openness has been studied, inter alia, by Bajo-
Rubio and Sosvilla-Rivero (1994) and Culem (1988). The former analyzes the determinants
of FDI in Spain, whereas the latter analyzes bilateral FDI inflows among 6 industrialized
countries. Both conclude that the degree of openness has a positive effect on FDI. Wheeler
and Mody (1992) and Schmitz and Bieri (1972), on the other hand, find no statistically
significant relationship between these variables.4 Education is considered by Walsh and
Yu (2010), who find that it has a negligible or a slightly counter-intuitive negative effect
on FDI, depending on whether one considers FDI in the secondary sector or in services.
Altomonte and Guagliano (2003), on the other hand, find that education has a negative
effect on a multinational’s probability to invest in Central and Eastern European or in
Mediterranean countries if that investment is made on traditional industries, whilst has a
positive and significant impact on that probability if the investment is made in the services
sector in Mediterranean countries.5
Since the mid 1990s the role of institutional determinants has become increasingly
important. Their relevance originated in the context of regional integration agreements,
where governments implemented business facilitation measures in order to provide firms
3An extensive survey of this literature is provided by de Mooij and Ederveen (2003).4Additionally, Culem (1988) and Schmitz and Bieri (1972) analyze the effects of trade barriers on FDI,
with contradictory evidence: while the former article reports a negative relationship, the latter posits apositive one. Mixed evidence on the effects of trade barriers on FDI is also found in Grubert and Mutti(1991).
5There are other economic factors affecting inward FDI. For instance, Head et al. (1995) use a conditionallogit model to show that agglomeration economies played an important role in explaining Japanese man-ufacturing investments in the US, and Wheeler and Mody (1992) conclude that agglomeration economiesinfluence investors’ decisions. The level of infrastructure and host country currency depreciations are alsothought to positively influence FDI. For instance, Loree and Guisinger (1995) show that communicationstructure and the amount of transportation infrastructure of a country have an important role attractingFDI. Biswas (2002) uses main telephone lines per 100 inhabitants and per capita total net installed capacityof electric generating plants, and reach a similar conclusion. In the case of host country depreciations, severalstudies find a positive relationship with FDI. For instance, Blonigen (1997) supports a positive relationshipbetween real dollar depreciations and Japanese acquisitions in the US, as this induces the acquisition oftransferable assets within a firm across markets. Similar results hold in Kogut and Chang (1996), Klein andRosengren (1994), Swenson (1994) and Froot and Stein (1991). These studies, however, rely solely on USdata, which limits the scope of analysis. Government promotion through fiscal incentives can also influenceFDI flows (Buch et al., 2005).
4
with a better environment for their investments. When intra-regional transaction costs
are reduced and national policies have some degree of coordination in order to form a level
playing field for businesses, as is the case in the EU, national jurisdictions tend to rely more
heavily on these measures to differentiate from each other when competing for investment
(UNCTAD, 1999). Schneider and Frey (1985) were among the first to empirically address
policy and institutional factors by presenting an inverse relation between political instability
and other risk factors with incoming investment. More recently, the role of institutional
factors and business friendly regulations have fostered the research agenda on FDI.
Biswas (2002) shows that both traditional factors and nontraditional (institutional)
factors are important determinants of FDI inflows, and Stevens (2000) and Benassy-Quere
et al. (2007) present evidence that political and institutional factors explain an important
part of FDI, which cannot be explained by economic factors alone. Wei (2000a,b) concludes
that corruption reduces inward FDI—firms or individuals may be required to pay bribes
to government officials in order to obtain permits, licenses, or other government services
in order to run a business in a country, therefore increasing the costs of doing business.
Some studies (e.g. Lee and Mansfield, 1996; Knack and Keefer, 1995) have shown that the
composition of FDI inflows is affected by property rights and by the degree of protection
of intellectual property. FDI inflows are also affected by the efficiency of the legal system
(Buch et al., 2005) and by the degree of entry barriers (Alesina et al., 2005). The inclusion
of policy variables may also greatly reduce the influence of some economic variables on
FDI, such as taxation (Hajkova et al., 2006). Several studies were also published in the
context of the Doing Business, where the effects of the legal system (Djankov et al., 2002),
the regulation of entry of firms (Djankov, 2009), the regulation of labor markets (Botero
et al., 2004), investors protection (Djankov et al., 2008) and other institutional variables
on investment were addressed.
However, these are not consensual outcomes across the institutional variables range
given that other studies were not able to establish a relationship between FDI and institu-
tional risk. In particular, Bevan and Estrin (2004) find no significant impact of institutional
risk on FDI into European transition economies, after controlling for other factors. Wheeler
and Mody (1992) use several risk factors, but did not find evidence that these factors in-
fluenced the location of US foreign affiliates.
3 Data
Our purpose is to explain inward FDI stocks from 45 source countries to 28 European
countries (see Table 1) for the 2006–2008 period. The literature has advocated the use of
FDI stocks relative to flows, since the former presents several advantages: they are based
on past accumulated flows, and hence they are less volatile; they are not as influenced by
specific year investments as flows are; they are the relevant decision variable for a firm in
the long term; and finally, they are a better measure of capital ownership (Benassy-Quere
5
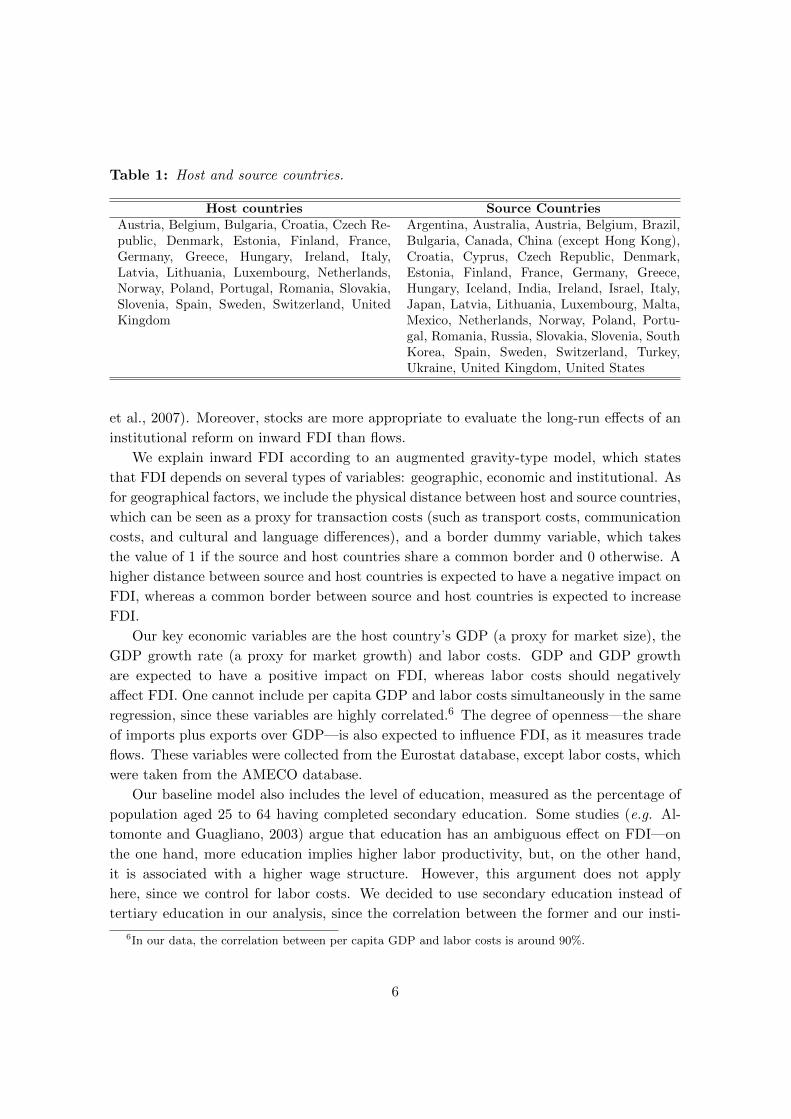
Table 1: Host and source countries.
Host countries Source CountriesAustria, Belgium, Bulgaria, Croatia, Czech Re-public, Denmark, Estonia, Finland, France,Germany, Greece, Hungary, Ireland, Italy,Latvia, Lithuania, Luxembourg, Netherlands,Norway, Poland, Portugal, Romania, Slovakia,Slovenia, Spain, Sweden, Switzerland, UnitedKingdom
Argentina, Australia, Austria, Belgium, Brazil,Bulgaria, Canada, China (except Hong Kong),Croatia, Cyprus, Czech Republic, Denmark,Estonia, Finland, France, Germany, Greece,Hungary, Iceland, India, Ireland, Israel, Italy,Japan, Latvia, Lithuania, Luxembourg, Malta,Mexico, Netherlands, Norway, Poland, Portu-gal, Romania, Russia, Slovakia, Slovenia, SouthKorea, Spain, Sweden, Switzerland, Turkey,Ukraine, United Kingdom, United States
et al., 2007). Moreover, stocks are more appropriate to evaluate the long-run effects of an
institutional reform on inward FDI than flows.
We explain inward FDI according to an augmented gravity-type model, which states
that FDI depends on several types of variables: geographic, economic and institutional. As
for geographical factors, we include the physical distance between host and source countries,
which can be seen as a proxy for transaction costs (such as transport costs, communication
costs, and cultural and language differences), and a border dummy variable, which takes
the value of 1 if the source and host countries share a common border and 0 otherwise. A
higher distance between source and host countries is expected to have a negative impact on
FDI, whereas a common border between source and host countries is expected to increase
FDI.
Our key economic variables are the host country’s GDP (a proxy for market size), the
GDP growth rate (a proxy for market growth) and labor costs. GDP and GDP growth
are expected to have a positive impact on FDI, whereas labor costs should negatively
affect FDI. One cannot include per capita GDP and labor costs simultaneously in the same
regression, since these variables are highly correlated.6 The degree of openness—the share
of imports plus exports over GDP—is also expected to influence FDI, as it measures trade
flows. These variables were collected from the Eurostat database, except labor costs, which
were taken from the AMECO database.
Our baseline model also includes the level of education, measured as the percentage of
population aged 25 to 64 having completed secondary education. Some studies (e.g. Al-
tomonte and Guagliano, 2003) argue that education has an ambiguous effect on FDI—on
the one hand, more education implies higher labor productivity, but, on the other hand,
it is associated with a higher wage structure. However, this argument does not apply
here, since we control for labor costs. We decided to use secondary education instead of
tertiary education in our analysis, since the correlation between the former and our insti-
6In our data, the correlation between per capita GDP and labor costs is around 90%.
6
tutional variables is much lower. We also experimented our model with three different tax
measures—the statutory tax rate, the effective marginal tax rate (EMTR), and the effective
average tax rate (EATR)—but our baseline model retains only the EATR.7 Conclusions
do not change substantially if any of the other tax measures is used instead. Education
was taken from the Eurostat database, whereas effective tax rates were kindly provided by
Michael Overesch (see Overesch and Rincke, 2009). All variables are 2006–2008 averages,
in order to smooth extreme events. The exception is the EATR, which is for 2006.
Our first set of institutional variables is based on the IEF, computed by the Heritage
Foundation.8 The data collected concerns the year 2007, which covers the second half
of 2005 and the first half of 2006. As the Heritage Foundation puts on their website,
economic freedom is the fundamental right of every citizen to control his or her own labor
and property. “In a free society, individuals are free to make their own production and
consumption decisions, protected and unconstrained by the state.” Thus, it is not surprising
that societies that have better scores in this index are able to attract more FDI, since they
offer higher levels of protection to investors, lower tax burdens, less restrictive regulations,
less bureaucracy and less corruption. The IEF is composed by 10 different components:
business freedom, trade freedom, fiscal freedom, government freedom, monetary freedom,
investment freedom, financial freedom, property freedom, corruption freedom, and labor
freedom. Each of these indexes was rescaled to the 0–10 range, with higher scores meaning
better performances. Our second set of institutional variables is based on the political
risk rating from the ICRG. This rating assesses the political risk of the host country, and
comprises 12 indicators: government stability, socioeconomic conditions, investment profile,
internal conflict, external conflict, corruption, military in politics, religion in politics, law
and order, ethnic tensions, democratic accountability and bureaucracy quality. All variables
were converted to the 0–10 scale to ease comparisons. The data collected is for 2006.
Finally, our last set of institutional variables assesses the ease of doing business in the
host country. The DB database complements the more generic information on business
regulations that is reported by the IEF, by measuring the cost of starting, operating, and
closing a business, for a medium-sized firm in a given country.9 The DB database reports
33 variables, covering 9 different areas—starting a business, dealing with construction per-
mits, registering property, getting credit, protecting investors, paying taxes, trading across
borders, enforcing contracts and closing a business. For convenience, each of the 33 vari-
7The statutory tax rate is the relevant variable for companies seeking to shift income towards lowtax countries, whereas the EATR reflects the incentives (such as investment tax credits and accelerateddepreciation) that are granted to firms when the investment occurs (Grubert and Mutti, 1991). The EMTR,on the other hand, captures incentives to use new capital once the location choice has been made. Thus,the EATR should be the relevant decision variable for multinationals seeking to invest abroad (Devereuxand Griffith, 1998).
8This data is available at www.heritage.org/index.9The Doing Business report is a co-publication of the World Bank and the International Finance Cor-
poration, and the data is available at www.doingbusiness.org.
7
ables were converted to indexes, according to the min-max standardization method. To
ease interpretations, this conversion was made such that higher values always mean better
performances. The resulting indexes were then summarized into these 9 categories. The
data collected respects the 2007 report, which addresses business regulations as of June 1,
2006.
It is worth noting that institutions tend to change slowly over time. Hence, the insti-
tutional indicators for 2006 can be used as proxies for a country’s institutional level in the
preceding years. This argument follows Tavares (2004), and is implicitly used in the FDI
literature, for instance, in Wei (2000a) and Benassy-Quere et al. (2007).10
4 Econometric approach
The gravity model was first developed in the context of international trade (see Eaton
and Tamura, 1995), but it has also been successfully applied to explain bilateral FDI (e.g.
Wei, 2000a,b). In its simplest formulation, the gravity model states that bilateral FDI
depends positively on the economic size of the source and host countries and negatively
on the distance between them. Here, we use an augmented version of the gravity model
which takes into account other economic and institutional factors that affect FDI. Denoting
by j the source country and by i the host country, we estimate the following augmented
gravity-type model
log(FDIij) = α1cj + α2cr + β1DISTANCEij + β2ECOi + β3INSTi + εij (1)
Here, FDIij is the inward FDI stock from country j to country i; DISTANCEij is a vector
composed by the physical distance between country j and country i and the border dummy
variable; ECOi is a vector containing the host country economic variables—namely GDP,
GDP growth, labor costs, the degree of openness, education and the EART—and finally
INSTi is a vector of institutional variables for the host country. Besides FDIij , the distance
between source and host countries, GDP and labor costs will enter (1) in logarithmic
form, which helps making the error term homoskedastic. Nonetheless, heteroskedasticity
consistent standard errors will be reported. Furthermore, a double-log specification displays
the best fit to the data, consistently delivering good values for the R2 and more precise
estimates as compared to alternative specifications (Stein and Daude, 2007). We implement
a quasi-fixed effects model, i.e., we include source country dummies, represented in (1) by
the vector cj . These dummy variables are meant to capture all specific characteristics of
the source country that are relevant to the size of outward FDI, such as the level of GDP,
the level of development or the institutional framework. We also include regional dummy
variables, denoted by cr, which are meant to capture patterns of FDI that are specific to
10Regression results using institutional indicators for 2004 and 2005 are available upon request from theauthors. These results do not change the main conclusions of this article.
8
Northern–Western Europe, Central–Eastern Europe and Southern Europe. Host country
dummies are not included, since they would eliminate the possibility of estimating all the
coefficients of the model. Finally, εij is an i.i.d. error term which is assumed normally
distributed.
To estimate the double-log model in equation (1) by OLS, all zero-FDI observations have
to be dropped, since the logarithm of zero is not defined. In our case, this corresponds to
193 observations—about 17.5% of our sample. This obviously results in a censored-sample
problem, which can lead to inconsistency. A common way to retain these zero observations
is to use a Tobit model (Stein and Daude, 2007; Gao, 2005). This approach can be justified
by considering that stocks below a certain threshold are incorrectly recorded as zeros, or
that the desired level of investment is positive, but the presence of fixed costs of investing
abroad leads to observed zero-FDI values when the desired investment is below a certain
threshold.11 Hence, besides estimating (1) by OLS, we also estimate a Tobit model, in
which the assumed threshold is −1.1.12
Institutional indicators are highly correlated with one another, which may originate
problems of near multi-collinearity if several of these variables are simultaneously included
in the regressions. In this case, the resulting OLS estimator has a low probability of being
close to its true value, due to variance inflation (Hwang and Nettleton, 2003). We tackle
the problems caused by correlated institutional variables through three distinct approaches.
First, for each institutional database—IEF, ICRG, and DB—we run a Principal Compo-
nent Analysis (PCA), in order to summarize the information in a smaller set of variables
(components).13 The resulting components can, in general, be associated with an identifi-
able institutional area, although the resulting aggregation is usually too broad to extract
conclusions about the effects of any particular institutional indicator on inward FDI. Be-
sides reducing the dimension of each database, the resulting score vectors are orthogonal,
thus diminishing the correlations between institutional factors in our sample. The PCA is
applied to all countries within each institutional database (and not only to the host coun-
tries used herein), and is followed by a varimax (orthogonal) rotation. These new variables
are then used in (1) to measure the effects of institutions on FDI.
To assess the robustness of these results, we also reduce the dimension of our database
through a direct aggregation of variables. In this case, we use the information from the
rotated factor loadings matrix to identify those indicators that are highly correlated among
11Desired FDI (the latent variable) is equal to the realized FDI for values above a certain threshold,but is not observed for values below that threshold. Some authors have proposed to use log(1 + FDIij) orlog(a + FDIij) (where a is a parameter to be estimated) instead of log FDIij as the dependent variable inorder to estimate (1) while retaining zero-FDI observations. However, this approach is completely ad hoc,and the results depend on the measurement unit.
12The minimum value of the average of inward FDI stocks for the 2006-2008 period is 1/3 million euros,and log(1/3) ≈ −1.1.
13This was preceded by the KMO and Bartlett’s test of sphericity, which indicate whether the PCA isappropriate or not.
9
themselves, and which can therefore be aggregated into a new variable. The aggregation
was done by taking the simple average, and the resulting variables can be interpreted as
factor-based scores.
The main disadvantage of these approaches is that the resulting aggregation is too
broad, because the correlations between institutional variables are high. For instance, the
effect of bureaucracy on FDI cannot be disentangled from the effect of corruption, or from
the effect of the costs of starting or closing a business, since these variables are highly
correlated. To tackle this issue, we estimate the model in (1) by adding each institutional
variable successively. This approach is widely followed in the literature (e.g. Walsh and Yu,
2010; Chakrabarti, 2001), and to our knowledge, it is the only way to evaluate the effect
of individual institutions on inward FDI while avoiding the problems caused by variance
inflation. However, this approach should be interpreted with caution, as the coefficient
from the institutional variable included in the model may also capture the effects of other
omitted institutions on FDI.
5 Results
5.1 Economic determinants of FDI
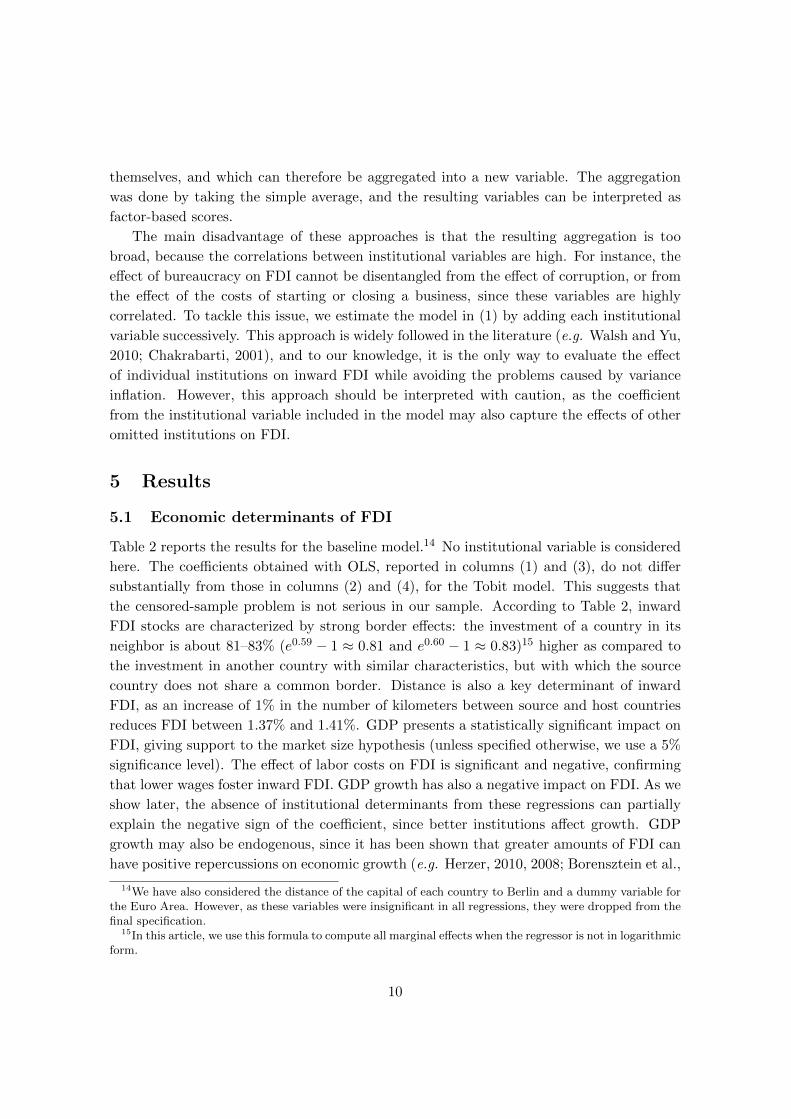
Table 2 reports the results for the baseline model.14 No institutional variable is considered
here. The coefficients obtained with OLS, reported in columns (1) and (3), do not differ
substantially from those in columns (2) and (4), for the Tobit model. This suggests that
the censored-sample problem is not serious in our sample. According to Table 2, inward
FDI stocks are characterized by strong border effects: the investment of a country in its
neighbor is about 81–83% (e0.59 − 1 ≈ 0.81 and e0.60 − 1 ≈ 0.83)15 higher as compared to
the investment in another country with similar characteristics, but with which the source
country does not share a common border. Distance is also a key determinant of inward
FDI, as an increase of 1% in the number of kilometers between source and host countries
reduces FDI between 1.37% and 1.41%. GDP presents a statistically significant impact on
FDI, giving support to the market size hypothesis (unless specified otherwise, we use a 5%
significance level). The effect of labor costs on FDI is significant and negative, confirming
that lower wages foster inward FDI. GDP growth has also a negative impact on FDI. As we
show later, the absence of institutional determinants from these regressions can partially
explain the negative sign of the coefficient, since better institutions affect growth. GDP
growth may also be endogenous, since it has been shown that greater amounts of FDI can
have positive repercussions on economic growth (e.g. Herzer, 2010, 2008; Borensztein et al.,
14We have also considered the distance of the capital of each country to Berlin and a dummy variable forthe Euro Area. However, as these variables were insignificant in all regressions, they were dropped from thefinal specification.
15In this article, we use this formula to compute all marginal effects when the regressor is not in logarithmicform.
10
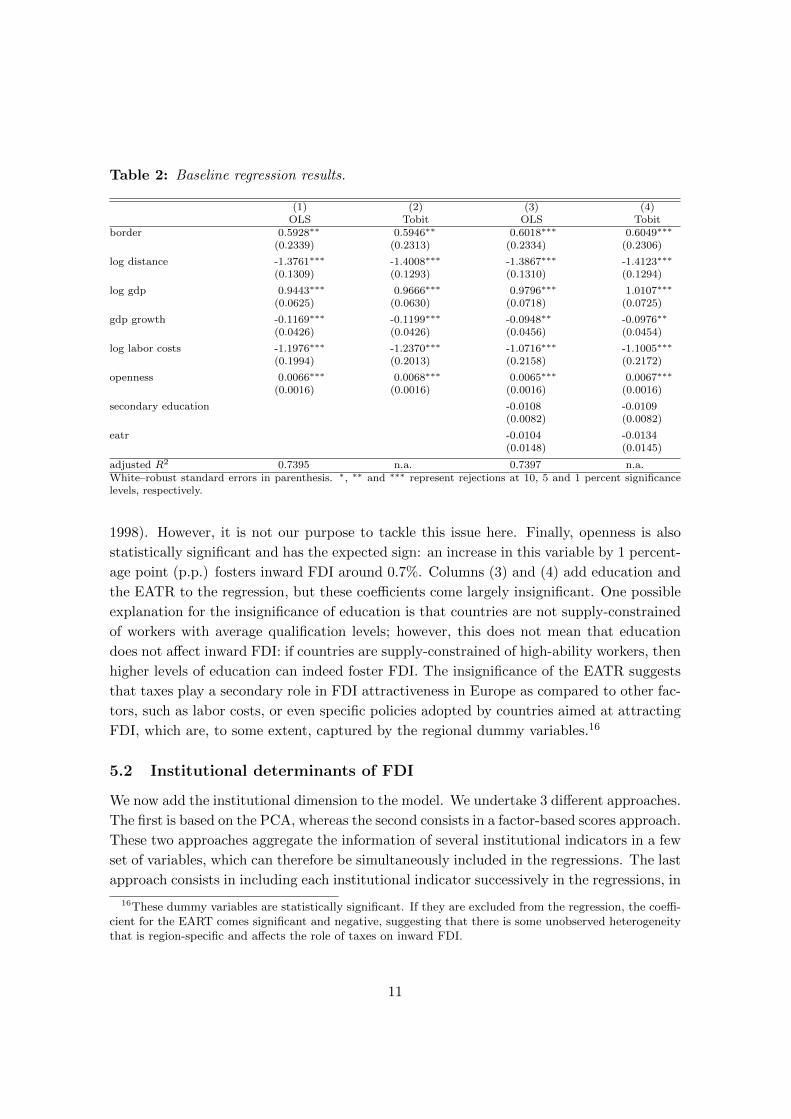
Table 2: Baseline regression results.
(1) (2) (3) (4)OLS Tobit OLS Tobit
border 0.5928∗∗ 0.5946∗∗ 0.6018∗∗∗ 0.6049∗∗∗
(0.2339) (0.2313) (0.2334) (0.2306)
log distance -1.3761∗∗∗ -1.4008∗∗∗ -1.3867∗∗∗ -1.4123∗∗∗
(0.1309) (0.1293) (0.1310) (0.1294)
log gdp 0.9443∗∗∗ 0.9666∗∗∗ 0.9796∗∗∗ 1.0107∗∗∗
(0.0625) (0.0630) (0.0718) (0.0725)
gdp growth -0.1169∗∗∗ -0.1199∗∗∗ -0.0948∗∗ -0.0976∗∗
(0.0426) (0.0426) (0.0456) (0.0454)
log labor costs -1.1976∗∗∗ -1.2370∗∗∗ -1.0716∗∗∗ -1.1005∗∗∗
(0.1994) (0.2013) (0.2158) (0.2172)
openness 0.0066∗∗∗ 0.0068∗∗∗ 0.0065∗∗∗ 0.0067∗∗∗
(0.0016) (0.0016) (0.0016) (0.0016)
secondary education -0.0108 -0.0109(0.0082) (0.0082)
eatr -0.0104 -0.0134(0.0148) (0.0145)
adjusted R2 0.7395 n.a. 0.7397 n.a.White–robust standard errors in parenthesis. ∗, ∗∗ and ∗∗∗ represent rejections at 10, 5 and 1 percent significancelevels, respectively.
1998). However, it is not our purpose to tackle this issue here. Finally, openness is also
statistically significant and has the expected sign: an increase in this variable by 1 percent-
age point (p.p.) fosters inward FDI around 0.7%. Columns (3) and (4) add education and
the EATR to the regression, but these coefficients come largely insignificant. One possible
explanation for the insignificance of education is that countries are not supply-constrained
of workers with average qualification levels; however, this does not mean that education
does not affect inward FDI: if countries are supply-constrained of high-ability workers, then
higher levels of education can indeed foster FDI. The insignificance of the EATR suggests
that taxes play a secondary role in FDI attractiveness in Europe as compared to other fac-
tors, such as labor costs, or even specific policies adopted by countries aimed at attracting
FDI, which are, to some extent, captured by the regional dummy variables.16
5.2 Institutional determinants of FDI
We now add the institutional dimension to the model. We undertake 3 different approaches.
The first is based on the PCA, whereas the second consists in a factor-based scores approach.
These two approaches aggregate the information of several institutional indicators in a few
set of variables, which can therefore be simultaneously included in the regressions. The last
approach consists in including each institutional indicator successively in the regressions, in
16These dummy variables are statistically significant. If they are excluded from the regression, the coeffi-cient for the EART comes significant and negative, suggesting that there is some unobserved heterogeneitythat is region-specific and affects the role of taxes on inward FDI.
11
order to assess the effects of specific institutional indicators on inward FDI while avoiding
variance inflation issues.
5.2.1 A principal components analysis
First, we use the PCA to summarize the indicators from the IEF, from the political risk
index of the ICRG, and from the DB database, in a set of few variables. We then run the
regressions using these newly created variables to represent the institutional framework of
a country.
For the IEF, the standard eigenvalue-based criteria, with a cut-off value of 1, identified
2 components, explaining almost 68% of total variance. The rotated factor loading matrix
associates the first component score (hereinafter denominated as “firms freedom”) with
all the elements that, in some way, influence the firms profitability and the ease of doing
business. It includes the following indicators: business freedom, trade freedom, monetary
freedom, investment freedom, financial freedom, property rights, freedom from corruption,
and labor freedom. All these variables displayed a factor loading above 0.62 in this com-
ponent, whereas the correlation between the remaining variables and this component was
below 0.2. The second component score (which we call “public sector freedom”) measures
the public sector effects on economic freedom—namely fiscal freedom and government free-
dom.
When applied to the 12 political risk variables from the ICRG, the PCA identifies 3
components, which together explain more than 72% of total variance. The first component
is interpreted as the “firms political risk,” as it is related with the political risk factors that
may directly affect firms. The rotated factor loadings associate this component with socioe-
conomic conditions, investment profile, corruption, law and order, bureaucracy quality and
military in politics. It may seem surprising that the variable military in politics loads in
this component, but the fact is that a country with a military regime may have an uneasy
environment for foreign businesses, and is more prone to corruption in the long term. The
second component represents “conflicts and tensions,” as it is highly correlated with the
variables internal conflict, external conflict, religious tensions and ethnic tensions. The last
component stands for “democratic responsiveness,” and comprises government stability and
democratic accountability. In this component, government stability loads with a negative
value, and hence higher values are associated with greater democratic accountability, but
with lower government stability. This occurs because a higher government stability is asso-
ciated with a greater government’s ability to stay in office, and sometimes this is achieved
at the expense of a lower democratic accountability (e.g. one party states or autocracies).
The standard eigenvalue-based criteria applied to the 9 areas of doing business identified
2 factors; however factor loadings were perplexing and did not allow a clear interpretation
of the components. We opted instead to extract only one factor from the DB database,
which is interpreted as representing an overall measure of doing business. This component
12
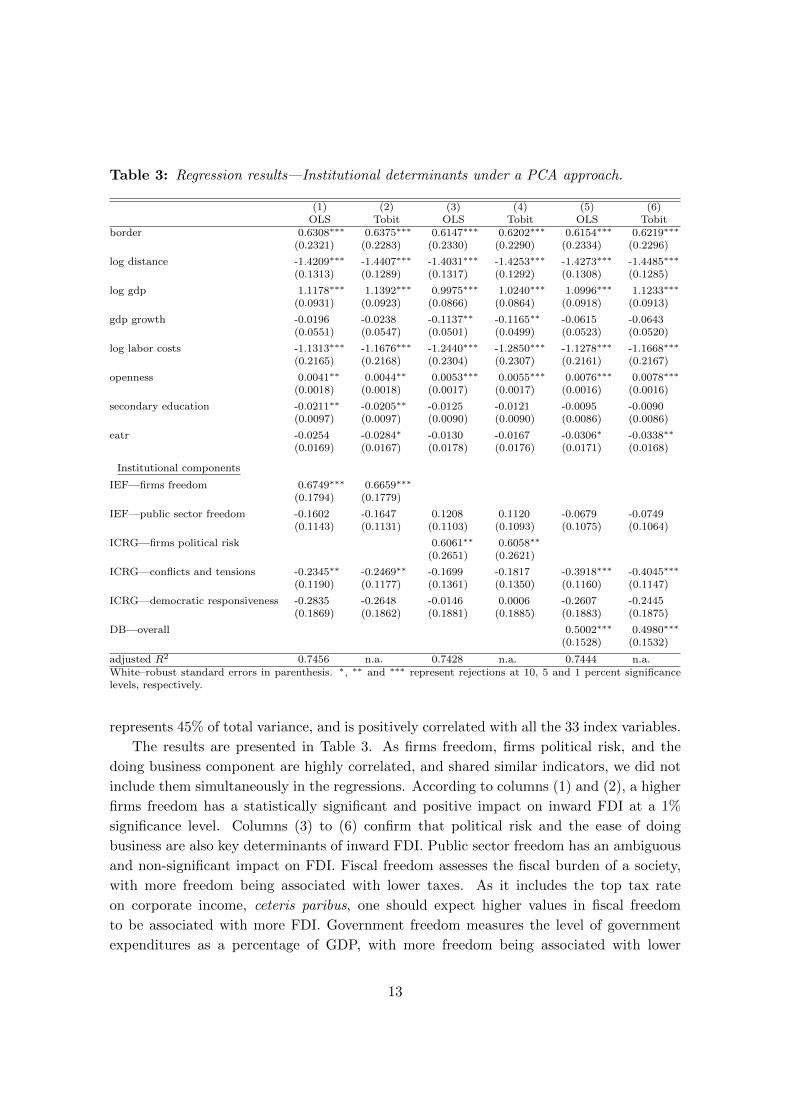
Table 3: Regression results—Institutional determinants under a PCA approach.
(1) (2) (3) (4) (5) (6)OLS Tobit OLS Tobit OLS Tobit
border 0.6308∗∗∗ 0.6375∗∗∗ 0.6147∗∗∗ 0.6202∗∗∗ 0.6154∗∗∗ 0.6219∗∗∗
(0.2321) (0.2283) (0.2330) (0.2290) (0.2334) (0.2296)
log distance -1.4209∗∗∗ -1.4407∗∗∗ -1.4031∗∗∗ -1.4253∗∗∗ -1.4273∗∗∗ -1.4485∗∗∗
(0.1313) (0.1289) (0.1317) (0.1292) (0.1308) (0.1285)
log gdp 1.1178∗∗∗ 1.1392∗∗∗ 0.9975∗∗∗ 1.0240∗∗∗ 1.0996∗∗∗ 1.1233∗∗∗
(0.0931) (0.0923) (0.0866) (0.0864) (0.0918) (0.0913)
gdp growth -0.0196 -0.0238 -0.1137∗∗ -0.1165∗∗ -0.0615 -0.0643(0.0551) (0.0547) (0.0501) (0.0499) (0.0523) (0.0520)
log labor costs -1.1313∗∗∗ -1.1676∗∗∗ -1.2440∗∗∗ -1.2850∗∗∗ -1.1278∗∗∗ -1.1668∗∗∗
(0.2165) (0.2168) (0.2304) (0.2307) (0.2161) (0.2167)
openness 0.0041∗∗ 0.0044∗∗ 0.0053∗∗∗ 0.0055∗∗∗ 0.0076∗∗∗ 0.0078∗∗∗
(0.0018) (0.0018) (0.0017) (0.0017) (0.0016) (0.0016)
secondary education -0.0211∗∗ -0.0205∗∗ -0.0125 -0.0121 -0.0095 -0.0090(0.0097) (0.0097) (0.0090) (0.0090) (0.0086) (0.0086)
eatr -0.0254 -0.0284∗ -0.0130 -0.0167 -0.0306∗ -0.0338∗∗
(0.0169) (0.0167) (0.0178) (0.0176) (0.0171) (0.0168)
Institutional components
IEF—firms freedom 0.6749∗∗∗ 0.6659∗∗∗
(0.1794) (0.1779)
IEF—public sector freedom -0.1602 -0.1647 0.1208 0.1120 -0.0679 -0.0749(0.1143) (0.1131) (0.1103) (0.1093) (0.1075) (0.1064)
ICRG—firms political risk 0.6061∗∗ 0.6058∗∗
(0.2651) (0.2621)
ICRG—conflicts and tensions -0.2345∗∗ -0.2469∗∗ -0.1699 -0.1817 -0.3918∗∗∗ -0.4045∗∗∗
(0.1190) (0.1177) (0.1361) (0.1350) (0.1160) (0.1147)
ICRG—democratic responsiveness -0.2835 -0.2648 -0.0146 0.0006 -0.2607 -0.2445(0.1869) (0.1862) (0.1881) (0.1885) (0.1883) (0.1875)
DB—overall 0.5002∗∗∗ 0.4980∗∗∗
(0.1528) (0.1532)
adjusted R2 0.7456 n.a. 0.7428 n.a. 0.7444 n.a.White–robust standard errors in parenthesis. ∗, ∗∗ and ∗∗∗ represent rejections at 10, 5 and 1 percent significancelevels, respectively.
represents 45% of total variance, and is positively correlated with all the 33 index variables.
The results are presented in Table 3. As firms freedom, firms political risk, and the
doing business component are highly correlated, and shared similar indicators, we did not
include them simultaneously in the regressions. According to columns (1) and (2), a higher
firms freedom has a statistically significant and positive impact on inward FDI at a 1%
significance level. Columns (3) to (6) confirm that political risk and the ease of doing
business are also key determinants of inward FDI. Public sector freedom has an ambiguous
and non-significant impact on FDI. Fiscal freedom assesses the fiscal burden of a society,
with more freedom being associated with lower taxes. As it includes the top tax rate
on corporate income, ceteris paribus, one should expect higher values in fiscal freedom
to be associated with more FDI. Government freedom measures the level of government
expenditures as a percentage of GDP, with more freedom being associated with lower
13
expenditures. It is not clear whether this should attract or repel FDI, since higher public
expenditures may be associated, on the one hand, with better socioeconomic conditions,
higher development, better infrastructures, or greater incentives for FDI, but, on the other
hand, with a higher future fiscal burden and fiscal uncertainty, or with a lower efficiency
in the usage of public resources. This may help explaining the results. A priori, one
would expect the conflicts and tensions indicator to be insignificant; however, this indicator
seems to have an unexpected negative effect on FDI. One possible explanation is that the
coefficient is capturing a casual negative correlation between conflicts and tensions and
FDI. In fact, several countries, such as France, Belgium or the United Kingdom, perform
poorly in this indicator relative to other European countries, due to several ethnic or
external conflicts. However, these countries are also amongst the ones which attract more
inward FDI. Multinational firms should not care directly about conflicts and tensions in
the host country, as long as their investments are protected by the state, and the economic,
legal and democratic environment is conductive to doing business. Finally, democratic
responsiveness, per se, does not affect inward FDI.
Notice also that, in columns (3) and (4), as in the baseline regression, the coefficient
for GDP growth is significant and negative, whereas in the remaining columns, it is in-
significant. One possible interpretation for these mixed results is that low growth countries
have a higher level of development and hence better institutions, and the variables firms
freedom and doing business provide a better control for those institutions that influence
the performance of firms. Once we control for this effect, economic growth becomes irrel-
evant to explain inward FDI. Obviously, the endogeneity problem mentioned earlier may
also affect the level of significance. Education tends to be insignificant, except in columns
(1) and (2), confirming the results from the baseline specification. The coefficient for the
EATR is also insignificant, as before.
5.2.2 A factor-based scores approach
We now use the information from the rotated factor loadings matrix to aggregate the vari-
ables which loaded into the same component. This robustness exercise has two advantages.
First, it allows us to protect against the fact that factor scores representing a given com-
ponent always have some residual correlations with other components, which might affect
the results. Second, contrary to factor scores, the vectors computed here are interpretable,
as the variables are measured in indexes. A potential disadvantage of this approach is that
the weights are not optimally computed. The new variables were aggregated by taking the
simple average across the indicators that the PCA identified as loading into the same com-
ponent. The exception is democratic responsiveness, which does not consider government
stability. In fact, as this variable is negatively associated with democratic accountability by
construction (the indicator loaded in the component with a negative sign), it makes no sense
to take the simple average between them to create a factor of democratic responsiveness.
14
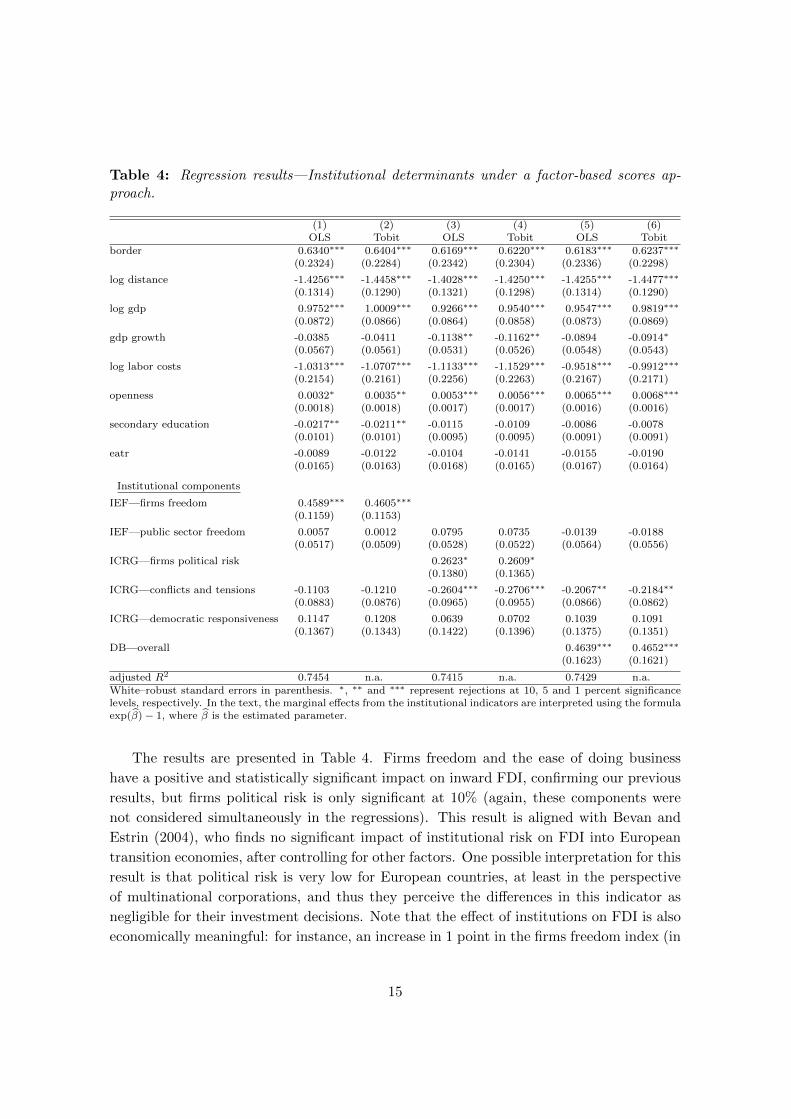
Table 4: Regression results—Institutional determinants under a factor-based scores ap-proach.
(1) (2) (3) (4) (5) (6)OLS Tobit OLS Tobit OLS Tobit
border 0.6340∗∗∗ 0.6404∗∗∗ 0.6169∗∗∗ 0.6220∗∗∗ 0.6183∗∗∗ 0.6237∗∗∗
(0.2324) (0.2284) (0.2342) (0.2304) (0.2336) (0.2298)
log distance -1.4256∗∗∗ -1.4458∗∗∗ -1.4028∗∗∗ -1.4250∗∗∗ -1.4255∗∗∗ -1.4477∗∗∗
(0.1314) (0.1290) (0.1321) (0.1298) (0.1314) (0.1290)
log gdp 0.9752∗∗∗ 1.0009∗∗∗ 0.9266∗∗∗ 0.9540∗∗∗ 0.9547∗∗∗ 0.9819∗∗∗
(0.0872) (0.0866) (0.0864) (0.0858) (0.0873) (0.0869)
gdp growth -0.0385 -0.0411 -0.1138∗∗ -0.1162∗∗ -0.0894 -0.0914∗
(0.0567) (0.0561) (0.0531) (0.0526) (0.0548) (0.0543)
log labor costs -1.0313∗∗∗ -1.0707∗∗∗ -1.1133∗∗∗ -1.1529∗∗∗ -0.9518∗∗∗ -0.9912∗∗∗
(0.2154) (0.2161) (0.2256) (0.2263) (0.2167) (0.2171)
openness 0.0032∗ 0.0035∗∗ 0.0053∗∗∗ 0.0056∗∗∗ 0.0065∗∗∗ 0.0068∗∗∗
(0.0018) (0.0018) (0.0017) (0.0017) (0.0016) (0.0016)
secondary education -0.0217∗∗ -0.0211∗∗ -0.0115 -0.0109 -0.0086 -0.0078(0.0101) (0.0101) (0.0095) (0.0095) (0.0091) (0.0091)
eatr -0.0089 -0.0122 -0.0104 -0.0141 -0.0155 -0.0190(0.0165) (0.0163) (0.0168) (0.0165) (0.0167) (0.0164)
Institutional components
IEF—firms freedom 0.4589∗∗∗ 0.4605∗∗∗
(0.1159) (0.1153)
IEF—public sector freedom 0.0057 0.0012 0.0795 0.0735 -0.0139 -0.0188(0.0517) (0.0509) (0.0528) (0.0522) (0.0564) (0.0556)
ICRG—firms political risk 0.2623∗ 0.2609∗
(0.1380) (0.1365)
ICRG—conflicts and tensions -0.1103 -0.1210 -0.2604∗∗∗ -0.2706∗∗∗ -0.2067∗∗ -0.2184∗∗
(0.0883) (0.0876) (0.0965) (0.0955) (0.0866) (0.0862)
ICRG—democratic responsiveness 0.1147 0.1208 0.0639 0.0702 0.1039 0.1091(0.1367) (0.1343) (0.1422) (0.1396) (0.1375) (0.1351)
DB—overall 0.4639∗∗∗ 0.4652∗∗∗
(0.1623) (0.1621)
adjusted R2 0.7454 n.a. 0.7415 n.a. 0.7429 n.a.White–robust standard errors in parenthesis. ∗, ∗∗ and ∗∗∗ represent rejections at 10, 5 and 1 percent significancelevels, respectively. In the text, the marginal effects from the institutional indicators are interpreted using the formulaexp(β)− 1, where β is the estimated parameter.
The results are presented in Table 4. Firms freedom and the ease of doing business
have a positive and statistically significant impact on inward FDI, confirming our previous
results, but firms political risk is only significant at 10% (again, these components were
not considered simultaneously in the regressions). This result is aligned with Bevan and
Estrin (2004), who finds no significant impact of institutional risk on FDI into European
transition economies, after controlling for other factors. One possible interpretation for this
result is that political risk is very low for European countries, at least in the perspective
of multinational corporations, and thus they perceive the differences in this indicator as
negligible for their investment decisions. Note that the effect of institutions on FDI is also
economically meaningful: for instance, an increase in 1 point in the firms freedom index (in
15
a 0-10 scale) increases FDI around 58%. The effect is similar for the ease of doing business.
The effects of public sector freedom and democratic responsiveness remain insignificant,
whereas conflicts and tensions display the same negative association with respect to inward
FDI. All in all, this analysis confirms that countries with better economic and business
environments and lower bureaucratic loads are able to attract larger amounts of FDI, and
the effects are significant and important. The effect of political risk at the firm level on
FDI is positive, but weak.
5.2.3 Institutional analysis—a breakdown
The previous analysis focused on the effects of institutions on inward FDI at a broad level,
but it was silent about the effects of specific institutions. To examine this issue, we now
re-estimate (1) by successively adding each institutional variable to the model. We omit
the indicators related with conflicts and tensions and with public sector freedom from the
analysis, since our previous results suggest that these variables have a dubious impact on
FDI. This also accords with our intuition that the key institutional determinants of inward
FDI are those which are directly related with the restrictions to economic activity and to
doing business.
The results are presented in Table 5. To save space, we omit the coefficients for the con-
trol variables, and show only the coefficients for the institutional indicators. The variables
are ordered according to their contribution in explaining the variance of the dependent
variable (R2) in the OLS estimation. Recall that all indicators range from 0 to 10, so that
the coefficients must be interpreted as the impact on FDI from a change in 1/10 points
of the range of the respective index. Higher values always mean better performances. For
the IEF, the results indicate that all variables display the expected sign, and all of them,
except trade freedom and monetary freedom, are significant. Probably, the low differences
across countries in terms of tariffs and tariff barriers (trade freedom), and well as in terms
of price stability and price controls (monetary freedom) are driving these results. The most
relevant factors affecting inbound FDI, in the sense that they explain a greater fraction of
the variance of the dependent variable, are financial freedom and labor freedom. These
indicators have a unitary impact on inward FDI around 25% and 14% respectively. Finan-
cial freedom measures the independence of financial institutions from state control, which
contributes to more competition and to a higher level of services available from financial
intermediaries. Labor freedom provides a quantitative measure of labor regulations: the
higher the score, the more flexible is the labor market and the less expensive is for multina-
tional corporations to adjust their labor force. Thus, it is not surprising that higher factor
scores in these indexes are associated with higher volumes of FDI. Business freedom and
corruption freedom also play an important role in explaining the variance of the dependent
variable. The former measures the overall burden and government efficiency associated with
starting, operating, and closing a business, whereas the latter assesses the level of insecurity
16
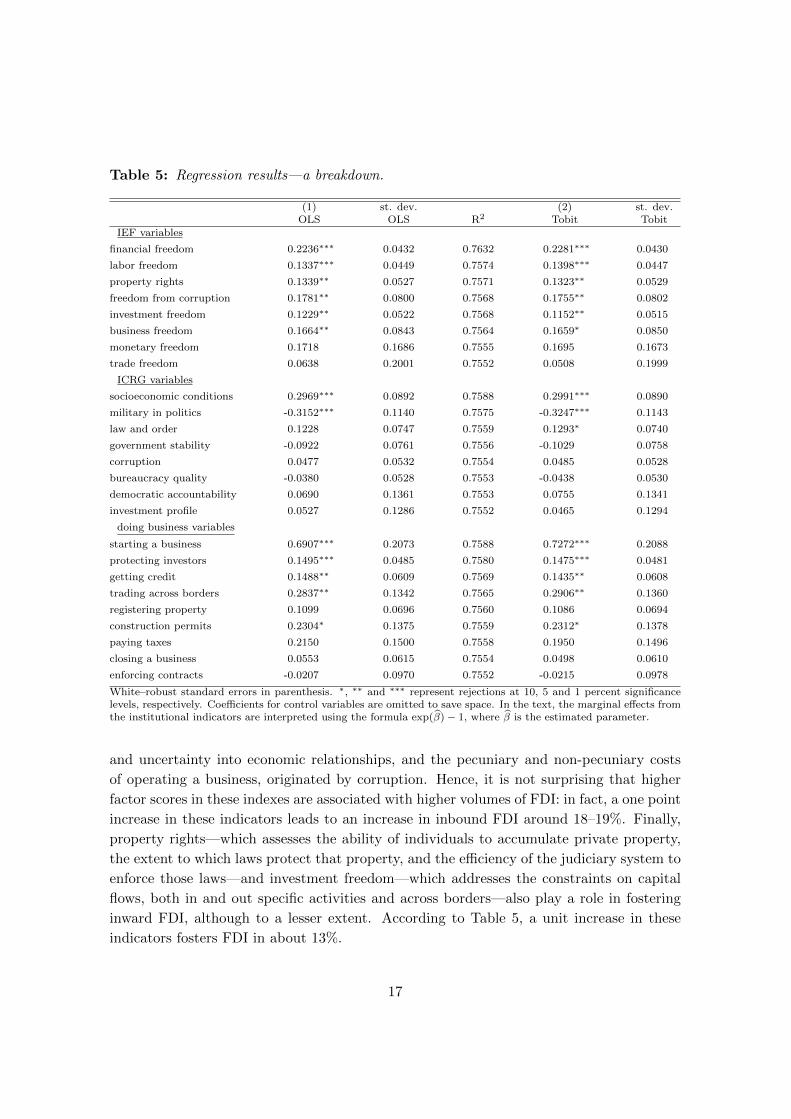
Table 5: Regression results—a breakdown.
(1) st. dev. (2) st. dev.OLS OLS R2 Tobit Tobit
IEF variables
financial freedom 0.2236∗∗∗ 0.0432 0.7632 0.2281∗∗∗ 0.0430
labor freedom 0.1337∗∗∗ 0.0449 0.7574 0.1398∗∗∗ 0.0447
property rights 0.1339∗∗ 0.0527 0.7571 0.1323∗∗ 0.0529
freedom from corruption 0.1781∗∗ 0.0800 0.7568 0.1755∗∗ 0.0802
investment freedom 0.1229∗∗ 0.0522 0.7568 0.1152∗∗ 0.0515
business freedom 0.1664∗∗ 0.0843 0.7564 0.1659∗ 0.0850
monetary freedom 0.1718 0.1686 0.7555 0.1695 0.1673
trade freedom 0.0638 0.2001 0.7552 0.0508 0.1999
ICRG variables
socioeconomic conditions 0.2969∗∗∗ 0.0892 0.7588 0.2991∗∗∗ 0.0890
military in politics -0.3152∗∗∗ 0.1140 0.7575 -0.3247∗∗∗ 0.1143
law and order 0.1228 0.0747 0.7559 0.1293∗ 0.0740
government stability -0.0922 0.0761 0.7556 -0.1029 0.0758
corruption 0.0477 0.0532 0.7554 0.0485 0.0528
bureaucracy quality -0.0380 0.0528 0.7553 -0.0438 0.0530
democratic accountability 0.0690 0.1361 0.7553 0.0755 0.1341
investment profile 0.0527 0.1286 0.7552 0.0465 0.1294
doing business variables
starting a business 0.6907∗∗∗ 0.2073 0.7588 0.7272∗∗∗ 0.2088
protecting investors 0.1495∗∗∗ 0.0485 0.7580 0.1475∗∗∗ 0.0481
getting credit 0.1488∗∗ 0.0609 0.7569 0.1435∗∗ 0.0608
trading across borders 0.2837∗∗ 0.1342 0.7565 0.2906∗∗ 0.1360
registering property 0.1099 0.0696 0.7560 0.1086 0.0694
construction permits 0.2304∗ 0.1375 0.7559 0.2312∗ 0.1378
paying taxes 0.2150 0.1500 0.7558 0.1950 0.1496
closing a business 0.0553 0.0615 0.7554 0.0498 0.0610
enforcing contracts -0.0207 0.0970 0.7552 -0.0215 0.0978
White–robust standard errors in parenthesis. ∗, ∗∗ and ∗∗∗ represent rejections at 10, 5 and 1 percent significancelevels, respectively. Coefficients for control variables are omitted to save space. In the text, the marginal effects fromthe institutional indicators are interpreted using the formula exp(β)− 1, where β is the estimated parameter.
and uncertainty into economic relationships, and the pecuniary and non-pecuniary costs
of operating a business, originated by corruption. Hence, it is not surprising that higher
factor scores in these indexes are associated with higher volumes of FDI: in fact, a one point
increase in these indicators leads to an increase in inbound FDI around 18–19%. Finally,
property rights—which assesses the ability of individuals to accumulate private property,
the extent to which laws protect that property, and the efficiency of the judiciary system to
enforce those laws—and investment freedom—which addresses the constraints on capital
flows, both in and out specific activities and across borders—also play a role in fostering
inward FDI, although to a lesser extent. According to Table 5, a unit increase in these
indicators fosters FDI in about 13%.
17
The second set of results in Table 5 confirms the idea that political risk is not a key
determinant of inward FDI for the set of countries considered here. In fact, only socioe-
conomic conditions—which assesses the pressures that could constraint government action
or fuel social dissatisfaction, namely unemployment, consumer confidence and poverty—
has a positive effect and is significant at the standard level. Military in politics is also
significant, but displays a negative impact on inward FDI. In fact, while military partici-
pation in government can fuel corruption, decrease democratic accountability, and lead to
social unrest in the long-run, it can also provide stability and reduce business risks in the
short term. Moreover, except for a few eastern economies, European countries receive full
points in this rating, for which the long-run risks are most certainly insignificant in the
perspective of multinational firms. In order to interpret the effects of other indicators, it is
important to notice that the ICRG indicators are constructed with the purpose of assessing
the political risk of a country, and thus they differ from similar indicators from the IEF,
or other databases. For this reason, variables which measure the level of corruption or
restrictions to investment, for instance, came significant in the IEF, but insignificant in the
ICRG. Most probably, multinational corporations perceive Europe as a stable and secure
destination for their investments, and thus differences in political risk across countries can
only affect investments at the margin.
All the coefficients for the 9 areas of doing business are positive, except for enforcing
contracts. However, only 4 are significant at the standard level. The most relevant factor is
starting a business, whose unitary increase is able to double inward FDI. The importance
of this indicator was already identified by the business freedom coefficient, although the
effect here is much larger. The difference in magnitudes between both variables is most
probably explained by the fact that business freedom includes other variables besides those
considered in starting a business, with a lower impact on inward FDI. The formulas used to
compute both indexes are different also. The strength of investor protection, measured by
the protecting investors index, and the credit information registries and the effectiveness
of collateral and bankruptcy laws in facilitating lending, measured by the getting credit
index, also provide an important contribute to explain the variability of the dependent
variable, and have an important impact on FDI: a one point increase in each of these
variables leads to an increase in FDI around 15%. From the remaining, the necessary
procedural requirements for exporting and importing (trading across borders) also displays
a significant effect on inward FDI, around 33% for a unit increase. Licensing procedures for
some activities (construction permits) has also a meaningful impact on inward FDI (around
26%), but the effect is only significant at 10%.
The analysis in this section clearly confirms that institutional factors are an important
driving force of foreign investments. In particular, the number of procedures, the costs
and the time required to start a business, the procedural requirements for exporting and
importing, the amount of financial services provided in the host country, and the level of
corruption, are the areas which display the highest effects on inward FDI. Socioeconomic
18
conditions are also shown to be relevant.
6 Measuring institutional reform in Portugal
If one seeks to understand the impact on Portugal’s inbound FDI originating from an
institutional reform that approximates Portuguese institutions to the EU level, the analysis
from the previous section provides only an incomplete picture. Firstly, because it does
not incorporate the amount of institutional reform needed to achieve the EU level. And
secondly, because it does not address the effort required to achieve that level. In this
section we evaluate the effects of an institutional reform in Portugal. We follow closely
Tavares (2004), who has proposed 3 measures of institutional reform to assess the benefits
of reforming Portuguese institutions to the level of the EU on Portuguese economic growth.
For each institutional indicator for which Portugal is lagging behind the EU, we evaluate
the impact on Portugal’s inward FDI of reforming that institution to the EU average, the
required reform effort and the efficiency of the reform. The analysis is conducted versus the
EU-27 and the EU-15.17 The impact of reforming institution k to the EU level is given by
the exponential of the respective coefficient for that institution (computed in the previous
section) multiplied by the difference between the institutional index for the EU and for
Portugal minus 1. That is
Impact on FDIk = exp(β3,k(INSTEU,k − INSTP,k)
)− 1 (2)
where INSTi,k denotes the institutional index of institution k in country i, i = EU,P (where
EU stands for the EU average and P for Portugal) and β3,k is the respective coefficient.18
Obviously, the higher the value of (2), the more promising is the reform in that area, either
because it has a large impact on inbound FDI, or because the Portuguese institutional index
is substantially below that of the EU. For this reason, this measure completely abstracts
from the “cost of reform,” i.e., from the required effort to bring the Portuguese institutional
index closer to that of the EU
Required reform effortk =INSTEU,k − INSTP,k
INSTP,k(3)
Equation (3) measures the relative distance of the Portuguese institutional index relative
to the EU average, i.e., the required institutional change that Portugal needs to achieve
the EU level, relative to its current position. A higher value means that achieving the EU
average requires a higher percentage change in the institutional indicator, and thus more
effort has to be put on the reform.
17For the EU-27, the analysis actually comprises only 25 countries, since Cyprus and Malta are notincluded in our database.
18In our computations, we take into account that a change in the Portuguese institutional index alsochanges EU average institutional index.
19
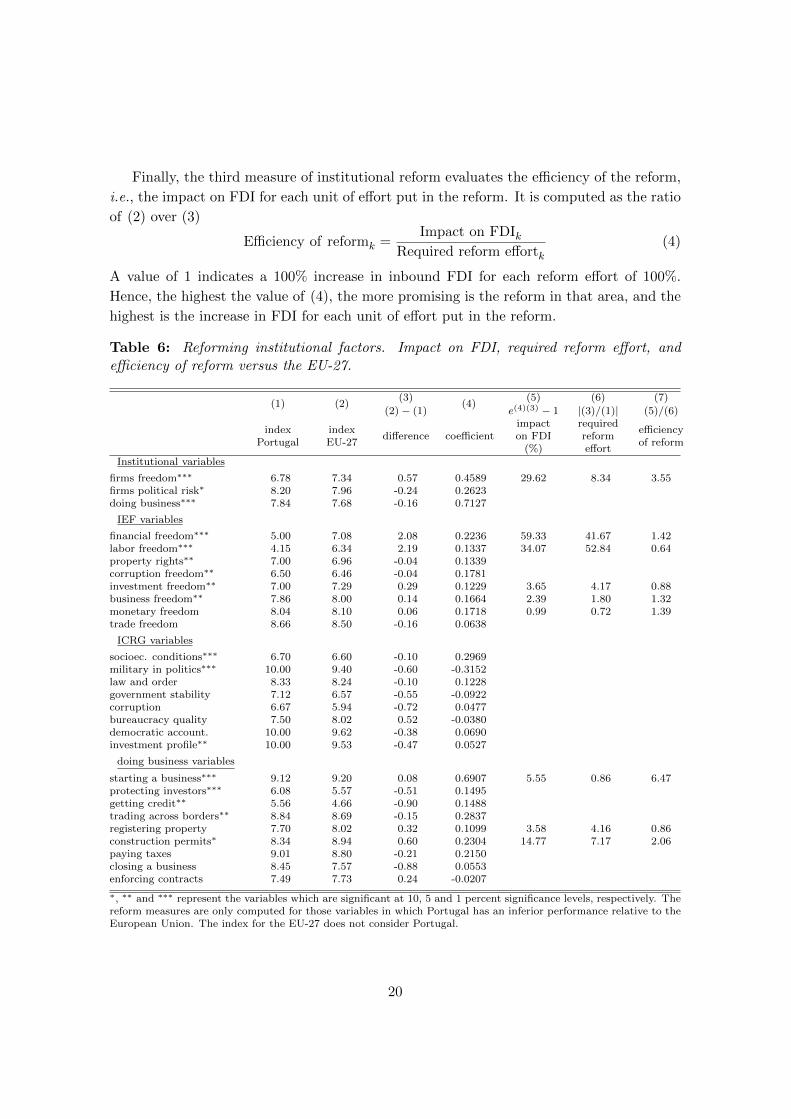
Finally, the third measure of institutional reform evaluates the efficiency of the reform,
i.e., the impact on FDI for each unit of effort put in the reform. It is computed as the ratio
of (2) over (3)
Efficiency of reformk =Impact on FDIk
Required reform effortk(4)
A value of 1 indicates a 100% increase in inbound FDI for each reform effort of 100%.
Hence, the highest the value of (4), the more promising is the reform in that area, and the
highest is the increase in FDI for each unit of effort put in the reform.
Table 6: Reforming institutional factors. Impact on FDI, required reform effort, andefficiency of reform versus the EU-27.
(1) (2)(3)
(4)(5) (6) (7)
(2)− (1) e(4)(3) − 1 |(3)/(1)| (5)/(6)
indexPortugal
indexEU-27
difference coefficientimpacton FDI
(%)
requiredreformeffort
efficiencyof reform
Institutional variables
firms freedom∗∗∗ 6.78 7.34 0.57 0.4589 29.62 8.34 3.55firms political risk∗ 8.20 7.96 -0.24 0.2623doing business∗∗∗ 7.84 7.68 -0.16 0.7127
IEF variables
financial freedom∗∗∗ 5.00 7.08 2.08 0.2236 59.33 41.67 1.42labor freedom∗∗∗ 4.15 6.34 2.19 0.1337 34.07 52.84 0.64property rights∗∗ 7.00 6.96 -0.04 0.1339corruption freedom∗∗ 6.50 6.46 -0.04 0.1781investment freedom∗∗ 7.00 7.29 0.29 0.1229 3.65 4.17 0.88business freedom∗∗ 7.86 8.00 0.14 0.1664 2.39 1.80 1.32monetary freedom 8.04 8.10 0.06 0.1718 0.99 0.72 1.39trade freedom 8.66 8.50 -0.16 0.0638
ICRG variables
socioec. conditions∗∗∗ 6.70 6.60 -0.10 0.2969military in politics∗∗∗ 10.00 9.40 -0.60 -0.3152law and order 8.33 8.24 -0.10 0.1228government stability 7.12 6.57 -0.55 -0.0922corruption 6.67 5.94 -0.72 0.0477bureaucracy quality 7.50 8.02 0.52 -0.0380democratic account. 10.00 9.62 -0.38 0.0690investment profile∗∗ 10.00 9.53 -0.47 0.0527
doing business variables
starting a business∗∗∗ 9.12 9.20 0.08 0.6907 5.55 0.86 6.47protecting investors∗∗∗ 6.08 5.57 -0.51 0.1495getting credit∗∗ 5.56 4.66 -0.90 0.1488trading across borders∗∗ 8.84 8.69 -0.15 0.2837registering property 7.70 8.02 0.32 0.1099 3.58 4.16 0.86construction permits∗ 8.34 8.94 0.60 0.2304 14.77 7.17 2.06paying taxes 9.01 8.80 -0.21 0.2150closing a business 8.45 7.57 -0.88 0.0553enforcing contracts 7.49 7.73 0.24 -0.0207
∗, ∗∗ and ∗∗∗ represent the variables which are significant at 10, 5 and 1 percent significance levels, respectively. Thereform measures are only computed for those variables in which Portugal has an inferior performance relative to theEuropean Union. The index for the EU-27 does not consider Portugal.
20
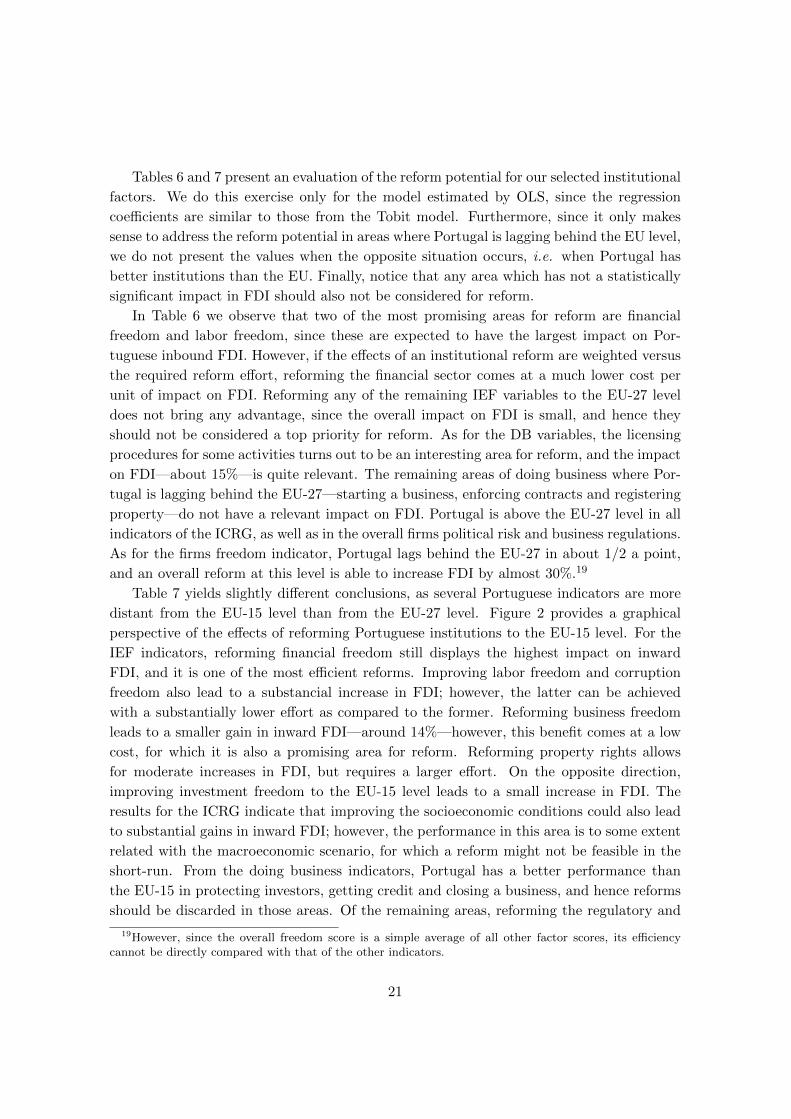
Tables 6 and 7 present an evaluation of the reform potential for our selected institutional
factors. We do this exercise only for the model estimated by OLS, since the regression
coefficients are similar to those from the Tobit model. Furthermore, since it only makes
sense to address the reform potential in areas where Portugal is lagging behind the EU level,
we do not present the values when the opposite situation occurs, i.e. when Portugal has
better institutions than the EU. Finally, notice that any area which has not a statistically
significant impact in FDI should also not be considered for reform.
In Table 6 we observe that two of the most promising areas for reform are financial
freedom and labor freedom, since these are expected to have the largest impact on Por-
tuguese inbound FDI. However, if the effects of an institutional reform are weighted versus
the required reform effort, reforming the financial sector comes at a much lower cost per
unit of impact on FDI. Reforming any of the remaining IEF variables to the EU-27 level
does not bring any advantage, since the overall impact on FDI is small, and hence they
should not be considered a top priority for reform. As for the DB variables, the licensing
procedures for some activities turns out to be an interesting area for reform, and the impact
on FDI—about 15%—is quite relevant. The remaining areas of doing business where Por-
tugal is lagging behind the EU-27—starting a business, enforcing contracts and registering
property—do not have a relevant impact on FDI. Portugal is above the EU-27 level in all
indicators of the ICRG, as well as in the overall firms political risk and business regulations.
As for the firms freedom indicator, Portugal lags behind the EU-27 in about 1/2 a point,
and an overall reform at this level is able to increase FDI by almost 30%.19
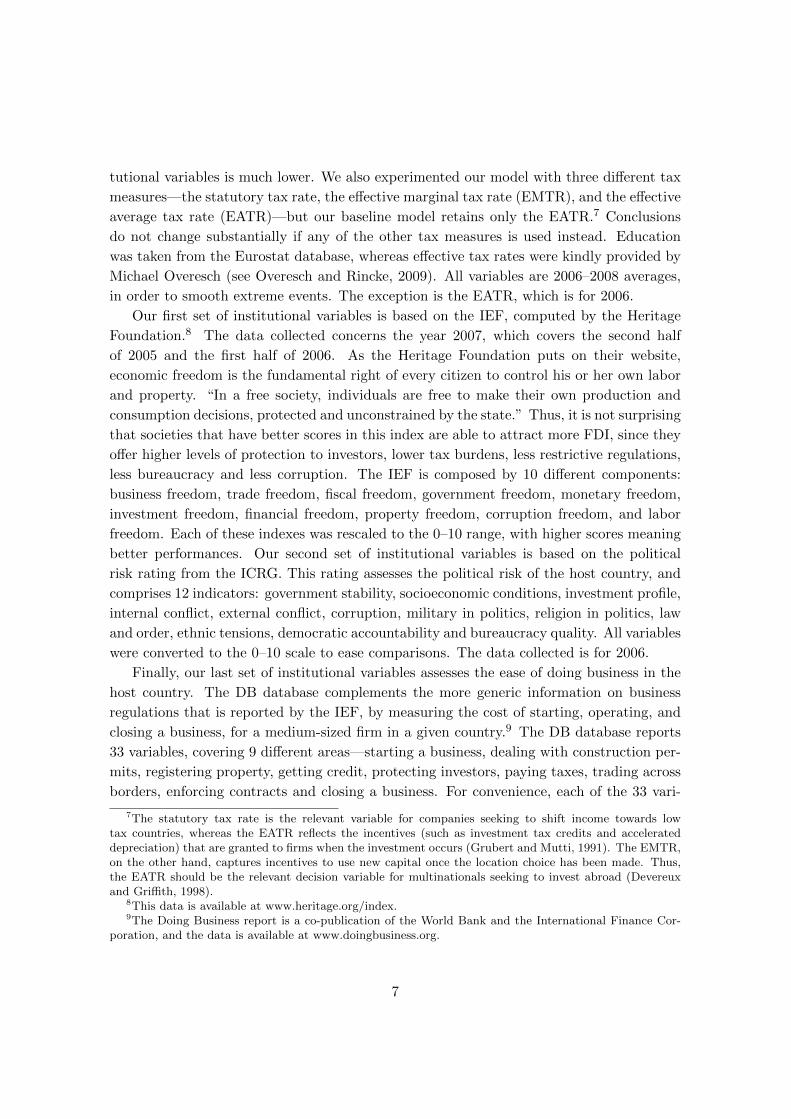
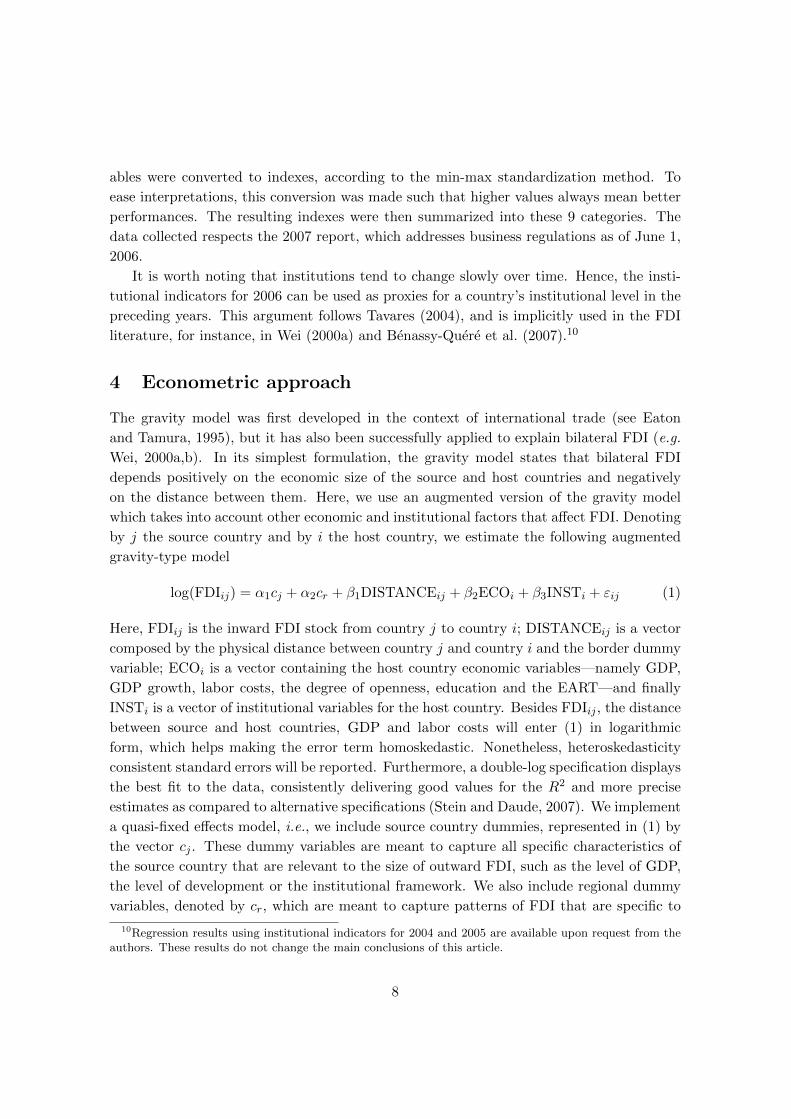
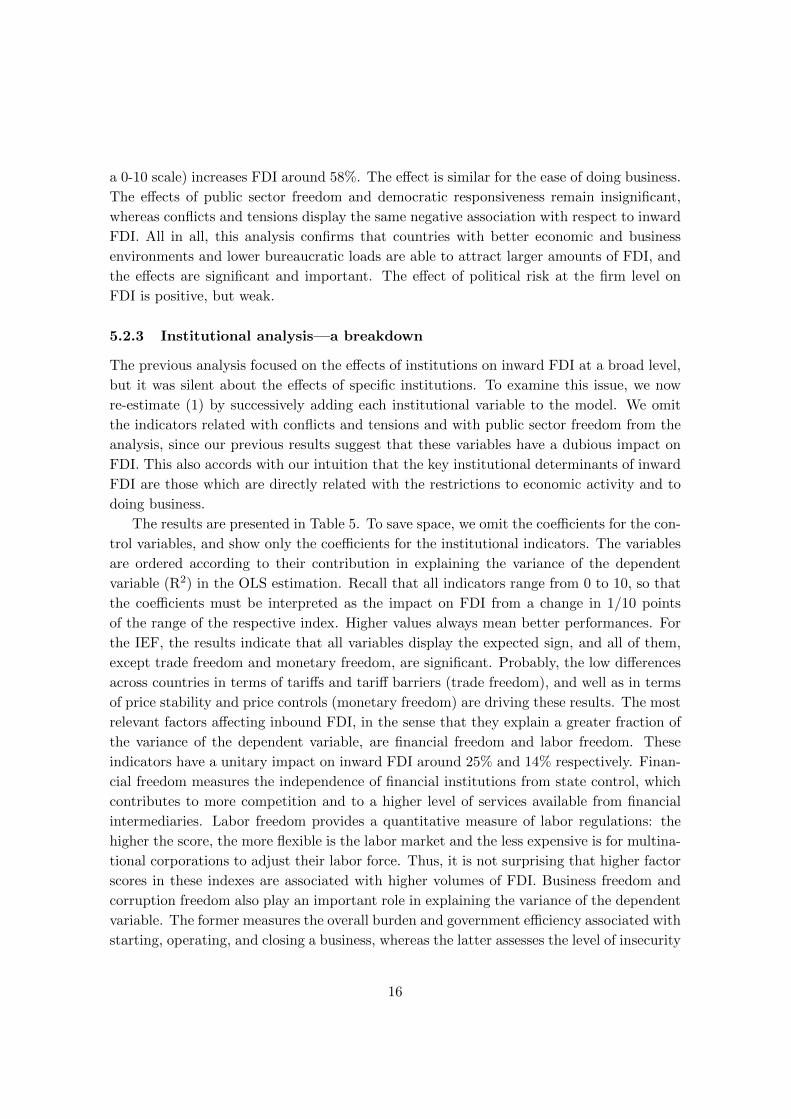
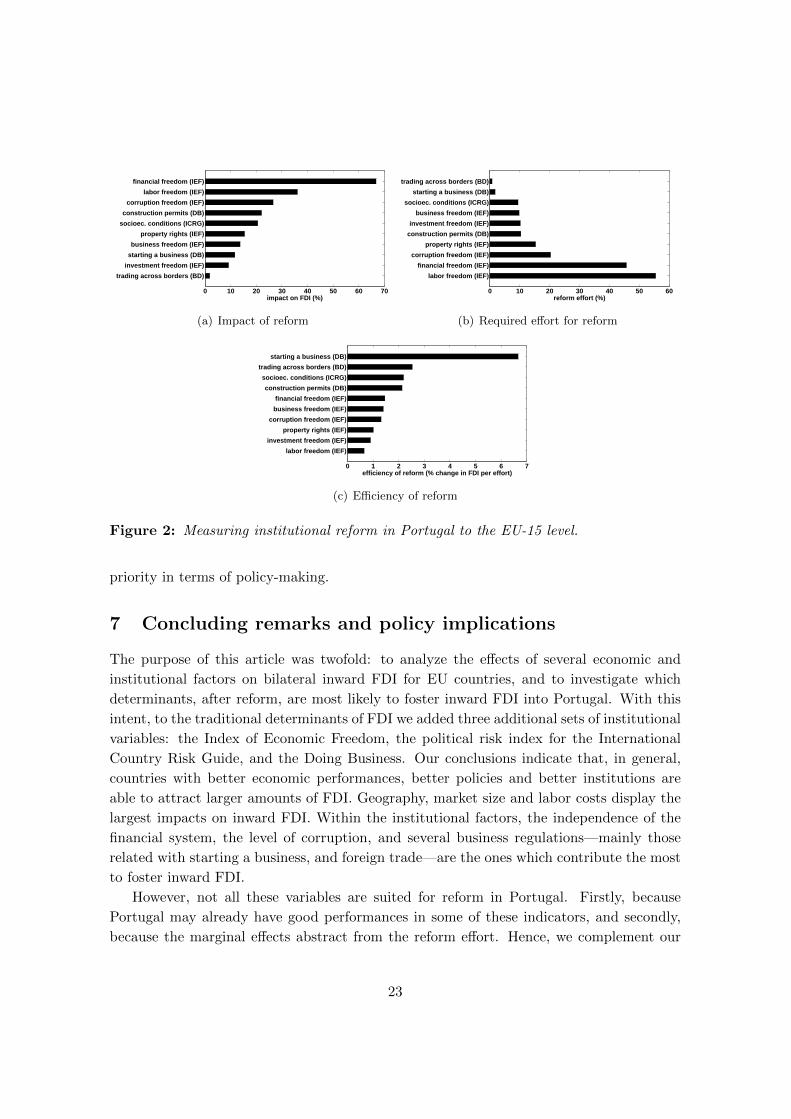
Table 7 yields slightly different conclusions, as several Portuguese indicators are more
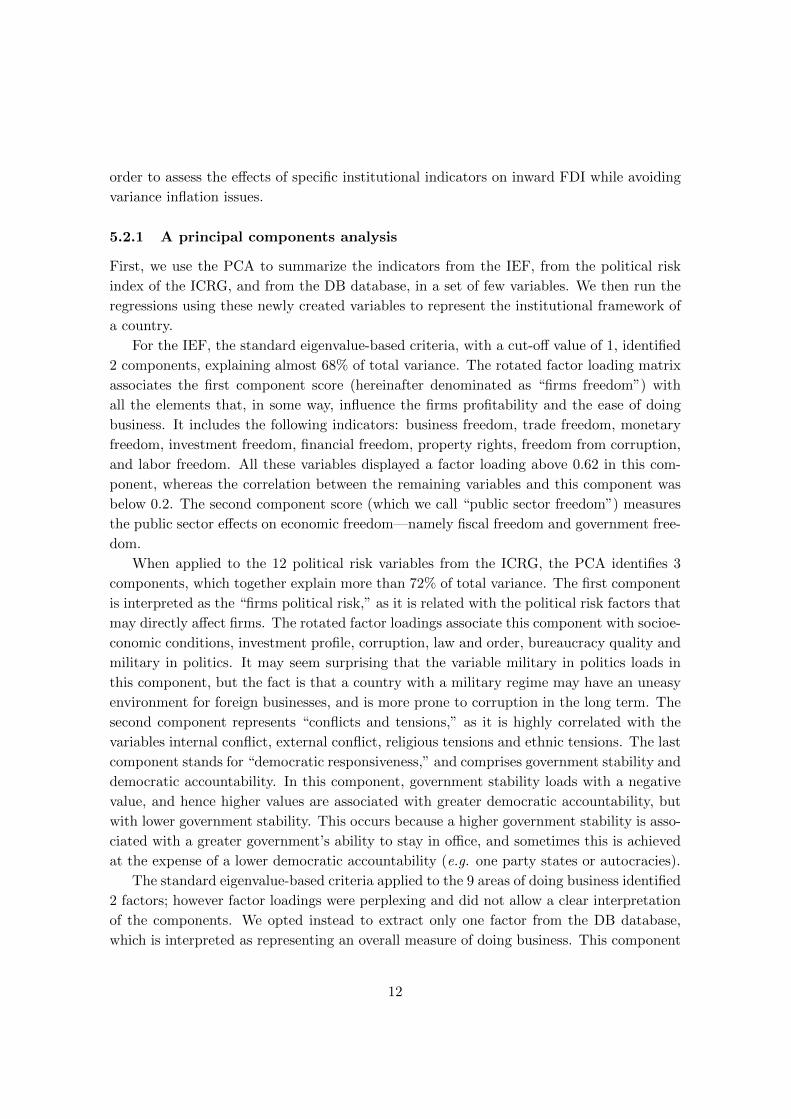
distant from the EU-15 level than from the EU-27 level. Figure 2 provides a graphical
perspective of the effects of reforming Portuguese institutions to the EU-15 level. For the
IEF indicators, reforming financial freedom still displays the highest impact on inward
FDI, and it is one of the most efficient reforms. Improving labor freedom and corruption
freedom also lead to a substancial increase in FDI; however, the latter can be achieved
with a substantially lower effort as compared to the former. Reforming business freedom
leads to a smaller gain in inward FDI—around 14%—however, this benefit comes at a low
cost, for which it is also a promising area for reform. Reforming property rights allows
for moderate increases in FDI, but requires a larger effort. On the opposite direction,
improving investment freedom to the EU-15 level leads to a small increase in FDI. The
results for the ICRG indicate that improving the socioeconomic conditions could also lead
to substantial gains in inward FDI; however, the performance in this area is to some extent
related with the macroeconomic scenario, for which a reform might not be feasible in the
short-run. From the doing business indicators, Portugal has a better performance than
the EU-15 in protecting investors, getting credit and closing a business, and hence reforms
should be discarded in those areas. Of the remaining areas, reforming the regulatory and
19However, since the overall freedom score is a simple average of all other factor scores, its efficiencycannot be directly compared with that of the other indicators.
21
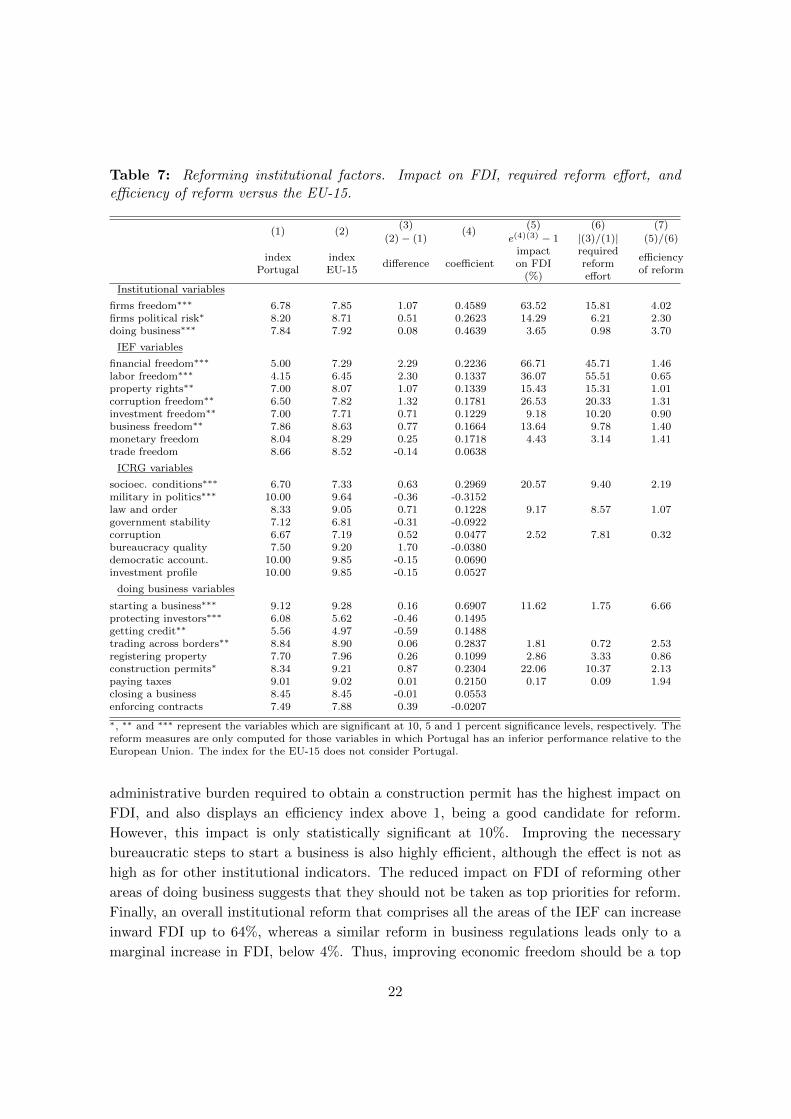
Table 7: Reforming institutional factors. Impact on FDI, required reform effort, andefficiency of reform versus the EU-15.
(1) (2)(3)
(4)(5) (6) (7)
(2)− (1) e(4)(3) − 1 |(3)/(1)| (5)/(6)
indexPortugal
indexEU-15
difference coefficientimpacton FDI
(%)
requiredreformeffort
efficiencyof reform
Institutional variables
firms freedom∗∗∗ 6.78 7.85 1.07 0.4589 63.52 15.81 4.02firms political risk∗ 8.20 8.71 0.51 0.2623 14.29 6.21 2.30doing business∗∗∗ 7.84 7.92 0.08 0.4639 3.65 0.98 3.70
IEF variables
financial freedom∗∗∗ 5.00 7.29 2.29 0.2236 66.71 45.71 1.46labor freedom∗∗∗ 4.15 6.45 2.30 0.1337 36.07 55.51 0.65property rights∗∗ 7.00 8.07 1.07 0.1339 15.43 15.31 1.01corruption freedom∗∗ 6.50 7.82 1.32 0.1781 26.53 20.33 1.31investment freedom∗∗ 7.00 7.71 0.71 0.1229 9.18 10.20 0.90business freedom∗∗ 7.86 8.63 0.77 0.1664 13.64 9.78 1.40monetary freedom 8.04 8.29 0.25 0.1718 4.43 3.14 1.41trade freedom 8.66 8.52 -0.14 0.0638
ICRG variables
socioec. conditions∗∗∗ 6.70 7.33 0.63 0.2969 20.57 9.40 2.19military in politics∗∗∗ 10.00 9.64 -0.36 -0.3152law and order 8.33 9.05 0.71 0.1228 9.17 8.57 1.07government stability 7.12 6.81 -0.31 -0.0922corruption 6.67 7.19 0.52 0.0477 2.52 7.81 0.32bureaucracy quality 7.50 9.20 1.70 -0.0380democratic account. 10.00 9.85 -0.15 0.0690investment profile 10.00 9.85 -0.15 0.0527
doing business variables
starting a business∗∗∗ 9.12 9.28 0.16 0.6907 11.62 1.75 6.66protecting investors∗∗∗ 6.08 5.62 -0.46 0.1495getting credit∗∗ 5.56 4.97 -0.59 0.1488trading across borders∗∗ 8.84 8.90 0.06 0.2837 1.81 0.72 2.53registering property 7.70 7.96 0.26 0.1099 2.86 3.33 0.86construction permits∗ 8.34 9.21 0.87 0.2304 22.06 10.37 2.13paying taxes 9.01 9.02 0.01 0.2150 0.17 0.09 1.94closing a business 8.45 8.45 -0.01 0.0553enforcing contracts 7.49 7.88 0.39 -0.0207
∗, ∗∗ and ∗∗∗ represent the variables which are significant at 10, 5 and 1 percent significance levels, respectively. Thereform measures are only computed for those variables in which Portugal has an inferior performance relative to theEuropean Union. The index for the EU-15 does not consider Portugal.
administrative burden required to obtain a construction permit has the highest impact on
FDI, and also displays an efficiency index above 1, being a good candidate for reform.
However, this impact is only statistically significant at 10%. Improving the necessary
bureaucratic steps to start a business is also highly efficient, although the effect is not as
high as for other institutional indicators. The reduced impact on FDI of reforming other
areas of doing business suggests that they should not be taken as top priorities for reform.
Finally, an overall institutional reform that comprises all the areas of the IEF can increase
inward FDI up to 64%, whereas a similar reform in business regulations leads only to a
marginal increase in FDI, below 4%. Thus, improving economic freedom should be a top
22
0 10 20 30 40 50 60 70
trading across borders (BD)investment freedom (IEF)starting a business (DB)business freedom (IEF)
property rights (IEF)socioec. conditions (ICRG)construction permits (DB)
corruption freedom (IEF)labor freedom (IEF)
financial freedom (IEF)
impact on FDI (%)
(a) Impact of reform
0 10 20 30 40 50 60
labor freedom (IEF)financial freedom (IEF)
corruption freedom (IEF)property rights (IEF)
construction permits (DB)investment freedom (IEF)
business freedom (IEF)socioec. conditions (ICRG)
starting a business (DB)trading across borders (BD)
reform effort (%)
(b) Required effort for reform
0 1 2 3 4 5 6 7
labor freedom (IEF)investment freedom (IEF)
property rights (IEF)corruption freedom (IEF)
business freedom (IEF)financial freedom (IEF)
construction permits (DB)socioec. conditions (ICRG)
trading across borders (BD)starting a business (DB)
efficiency of reform (% change in FDI per effort)
(c) Efficiency of reform
Figure 2: Measuring institutional reform in Portugal to the EU-15 level.
priority in terms of policy-making.
7 Concluding remarks and policy implications
The purpose of this article was twofold: to analyze the effects of several economic and
institutional factors on bilateral inward FDI for EU countries, and to investigate which
determinants, after reform, are most likely to foster inward FDI into Portugal. With this
intent, to the traditional determinants of FDI we added three additional sets of institutional
variables: the Index of Economic Freedom, the political risk index for the International
Country Risk Guide, and the Doing Business. Our conclusions indicate that, in general,
countries with better economic performances, better policies and better institutions are
able to attract larger amounts of FDI. Geography, market size and labor costs display the
largest impacts on inward FDI. Within the institutional factors, the independence of the
financial system, the level of corruption, and several business regulations—mainly those
related with starting a business, and foreign trade—are the ones which contribute the most
to foster inward FDI.
However, not all these variables are suited for reform in Portugal. Firstly, because
Portugal may already have good performances in some of these indicators, and secondly,
because the marginal effects abstract from the reform effort. Hence, we complement our
23
analysis by presenting and analyzing 3 measures of institutional reform: the impact of
the reform on FDI, the required reform effort, and the efficiency of reform. The results
suggest that the most important reforms to put Portuguese institutions at the EU-27
level are related with the independence of the financial system and with labor regulations,
although the latter requires a comparatively higher effort. A more ambitious reform plan
which puts Portuguese institutions at the EU-15 average level should also consider reforms
aimed at decreasing corruption, at improving property rights, and at simplify the necessary
procedures to start a business.
References
Alesina, A., S. Ardagna, G. Nicoletti and F. Schiantarelli, “Regulation and investment,”
Journal of the European Economic Association 3 (2005), 791–825.
Altomonte, C. and C. Guagliano, “Comparative study of FDI in Central and Eastern Europe
and the Mediterranean,” Economic Systems 27 (2003), 223–246.
Bajo-Rubio, O. and S. Sosvilla-Rivero, “An econometric analysis of foreign direct investment
in Spain, 1964–89,” Southern Economic Journal 61 (1994), 104–120.
Barrell, R. and N. Pain, “An econometric analysis of U.S. foreign direct investment,” The
Review of Economics and Statistics 78 (1996), 200–207.
———, “Foreign direct investment, technological change, and economic growth within Europe,”
The Economic Journal 107 (1997), 1770–1786.
Benassy-Quere, A., M. Coupet and T. Mayer, “Institutional determinants of foreign direct
investment,” The World Economy 30 (2007), 764–782.
Bevan, A. and S. Estrin, “The determinants of foreign direct investment into European transition
economies,” Journal of Comparative Economics 32 (2004), 775–787.
Bhattacharya, R., I. Patnaik and A. Shah, “Export versus FDI in services,” IMF Working
Paper No. 10/290 (2010).
Billington, N., “The location of foreign direct investment: an empirical analysis,” Applied Eco-
nomics 31 (1999), 65–76.
Biswas, R., “Determinants of foreign direct investment,” Review of Development Economics 6
(2002), 492–504.
Blonigen, B., “Firm-specific assets and the link between exchange rates and foreign direct invest-
ment,” The American Economic Review 87 (1997), 447–465.
———, “A review of the empirical literature on FDI determinants,” Atlantic Economic Journal 33
(2005), 383–403.
Borensztein, E., J. De Gregorio and J. Lee, “How does foreign direct investment affect
economic growth?,” Journal of international Economics 45 (1998), 115–135.
Botero, J., S. Djankov, R. La Porta, F. Lopez-de Silanes and A. Shleifer, “The regu-
lation of labor,” Quarterly Journal of Economics 119 (2004), 1339–1382.
Brainard, S. L., “An empirical assessment of the proximity-concentration trade-off between multi-
national sales and trade,” The American Economic Review 87 (1997), 520–544.
24
Buch, C., J. Kleinert, A. Lipponer and F. Toubal, “Determinants and effects of foreign
direct investment: evidence from German firm-level data,” Economic Policy 20 (2005), 52–110.
Cassou, S., “The link between tax rates and foreign direct investment,” Applied Economics 29
(1997), 1295–1301.
Caves, R., Multinational enterprise and economic analysis (Cambridge Univ Pr, 2007).
Chakrabarti, A., “The determinants of foreign direct investment: sensitivity analysis of cross-
country regressions,” KYKLOS 54 (2001), 89–114.
Culem, C., “The locational determinant of direct foreign investment among industrialized coun-
tries,” European Economic Review 32 (1988), 885–904.
de Mooij, R. and S. Ederveen, “Taxation and foreign direct investment: a synthesis of empirical
research,” International Tax and Public Finance 10 (2003), 673–693.
Devereux, M. and R. Griffith, “Taxes and the location of production: evidence from a panel
of U.S. multinationals,” Journal of Public Economics 68 (1998), 335–367.
Djankov, S., “The regulation of entry: a survey,” The World Bank Research Observer 24 (2009),
183.
Djankov, S., R. La Porta, F. Lopez-de Silanes and A. Shleifer, “Courts: the lex mundi
project,” (2002).
Djankov, S., R. L. Porta, F. L. de Silanes and A. Shleifer, “The law and economics of
self-dealing,” Journal of Financial Economics (2008), 430–465.
Dunning, J., Multinational enterprises and the global economy (Cheltenham: Edward Elgar, 2008).
Eaton, J. and A. Tamura, “Bilateralism and regionalism in Japanese and U.S. trade and direct
foreign investment patterns,” NBER Working Paper No. 4758 (1995).
Froot, K. and J. Stein, “Exchange rates and foreign direct investment: an imperfect capital
markets approach,” The Quarterly Journal of Economics 106 (1991), 1191–1217.
Gao, T., “Foreign direct investment from developing Asia: some distinctive features,” Economics
Letters 86 (2005), 29–35.
Grubert, H. and J. Mutti, “Taxes, tariffs and transfer pricing in multinational corporate decision
making,” The Review of Economics and Statistics 73 (1991), 285–293.
Hajkova, D., G. Nicoletti, L. Vartia and K.-Y. Yoo, “Taxation, business environment and
FDI location in OECD countries,” OECD Working Paper No.502 (2006).
Hartman, D., “Tax policy and foreign direct investment in the United States,” National Tax
Journal 37 (1984), 475–487.
———, “Tax policy and foreign direct investment,” Journal of Public Economics 26 (1985), 107–
121.
Head, K., J. Ries and D. Swenson, “Agglomeration benefits and location choice: evidence from
Japanese manufacturing investments in the United States,” Journal of International Economics
38 (1995), 223–247.
Helpman, E., M. Melitz and S. Yeaple, “Export versus FDI with heterogeneous firms,” The
American Economic Review 94 (2004), 300–316.
Herzer, D., “The long-run relationship between outward FDI and domestic output: evidence from
25
panel data,” Economics Letters 100 (2008), 146–149.
———, “Outward FDI and economic growth,” Journal of Economic Studies 37 (2010), 476–494.
Hines, J., “Altered states: taxes and the location of foreign direct investment in America,” The
American Economic Review 86 (1996), 1076–1094.
Horstmann, I. and J. Markusen, “Endogenous market structures in international trade (natura
facit saltum),” Journal of International Economics 32 (1992), 109–129.
Hwang, J. and D. Nettleton, “Principal components regression with data chosen components
and related methods,” Technometrics 45 (2003), 70–79.
Janicki, H. and P. Wunnava, “Determinants of foreign direct investment: empirical evidence
from EU accession candidates,” Applied Economics 36 (2004), 505–509.
Klein, M. and E. Rosengren, “The real exchange rate and foreign direct investment in the
United States: relative wealth vs. relative wage effects,” Journal of International Economics 36
(1994), 373–389.
Knack, S. and P. Keefer, “Institutions and economic performance: cross-country tests using
alternative institutional measures,” Economics and Politics 7 (1995), 207–227.
Kogut, B. and S. J. Chang, “Platform investments and volatile exchange rates: direct investment
in the U.S. by Japanese electronic companies,” The Review of Economics and Statistics 78 (1996),
221–231.
Kravis, I. and R. Lipsey, “The location of overseas production and production for exports by
U.S. multinational firms,” Journal of International Economics 12 (1982), 201–223.
Lee, J.-Y. and E. Mansfield, “Intellectual property protection and U.S. foreign direct invest-
ment,” The Review of Economics and Statistics 78 (1996), 181–186.
Loree, D. and S. Guisinger, “Policy and non-policy determinants of U.S. equity foreign direct
investment,” Journal of International Business Studies 26 (1995), 281–299.
Love, J. and F. Lage-Hidalgo, “Analysing the determinants of U.S. direct investment in Mex-
ico,” Applied Economics 32 (2000), 1259–1267.
Overesch, M. and J. Rincke, “The dynamics of corporate tax setting in Europe, 1984–2006,”
CESifo Working Paper No. 2535 (2009).
Scaperlanda, A. and R. Balough, “Determinants of U.S. direct investment in the E.E.C.:
revisited,” European Economic Review 21 (1983), 381–390.
Schmitz, A. and J. Bieri, “E.C.C. tariffs and U.S. direct investment,” European Economic Review
3 (1972), 259–270.
Schneider, F. and B. Frey, “Economic and political developments of foreign direct investment,”
World Development 13 (1985), 161–175.
Stein, E. and C. Daude, “Longitude matters: time zones and the location of foreign direct
investment,” Journal of International Economics 71 (2007), 96–112.
Stevens, G., “Politics, economics and investment: explaining plant and equipment spending by
U.S. direct investors in Argentina, Brazil and Mexico,” Journal of International Money and
Finance 19 (2000), 153–183.
Swenson, D., “The impact of U.S. tax reform on foreign direct investment in the United States,”
Journal of Public Economics 54 (1994), 243–266.
26
Tavares, J., “Institutions and economic growth in Portugal: a quantitative exploration,” Por-
tuguese Economic Journal 3 (2004), 49–79.
Tsai, P.-L., “Determinants of foreign direct investment and its impact on economic growth,”
Journal of Economic Development 19 (1994), 137–163.
UNCTAD, “World Investment Report 1998—trends and determinants,” UNCTAD, New York
(1999).
Walsh, J. and J. Yu, “Determinants of foreign direct investment: a sectoral and institutional
approach,” IMF Working Paper No. 10/187 (2010).
Wei, S.-J., “How taxing is corruption on international investors,” The Review of Economics and
Statistics 82 (2000a), 1–11.
———, “Local corruption and global capital flows,” Brookings Papers on Economic Activity 2
(2000b), 303–346.
Wheeler, D. and A. Mody, “International investment location decisions: the case of U.S. firms,”
Journal of International Economics 33 (1992), 57–76.
A Data description
A.1 Distance and economic variables
The following variables are used.
FDI stock: Bilateral inward FDI stocks in Millions of Euros. Source: Eurostat.
Border: Dummy variable which takes the value of 1 if the source and host countries share
a common border and 0 otherwise.
Distance: Distance, in Kilometers, from the capital of the source country to the capital
of the host country, calculated using the great circle distance.
GDP: Gross Domestic Product in Millions of Euros at current market prices. Source:
Eurostat.
GDP growth: Real GDP growth rate (percentage) relative to the previous year. Source:
Eurostat.
Labor cost: Yearly nominal compensation per employee in thousands of Euros. Source:
AMECO.
Openness: Degree of openness, measured by the ratio of exports plus imports over GDP.
Source: Eurostat.
Secondary education: Percentage of population aged 25 to 64 having completed sec-
ondary education. Source: Eurostat.
EATR: Effective average tax rate in the host country (percentage). The data was kindly
provided by Michael Overesch (see Overesch and Rincke, 2009).
27
A.2 Index of Economic Freedom
The Index of Economic Freedom is computed by the Heritage Foundation, and the data
can be found in their website (www.heritage.org/index). The overall index of economic
freedom is constructed by taking the simple average across 10 different indexes. The in-
dexes, described below, were rescaled to the 0–10 range to ease the exposition. A higher
score means a better performance.
Business Freedom: Measures the ability to start, operate, and close a business, thus
representing the overall burden from regulation and government efficiency in the regula-
tory process. This score is constructed using data on 10 factores from the Doing Business
study: number of procedures to start a business, number of days to start a business, cost
of starting a business, minimum capital required to start a business, number of procedures
to obtain a licence, time in obtaining a licence, cost in obtaining a licence, time to close a
business, cost of closing a business, and recovery rate in closing a business.
Trade Freedom: Composite measure of the absence of tariff and non-tariff barriers that
affect imports and exports of goods and services. It is based on the trade-weighted average
tariff rate and on non-tariff barriers.
Fiscal Freedom: Measures the tax burden imposed by the government. It includes the
direct tax burden on individual and corporate incomes, and tax revenues as a percentage
of GDP.
Government Freedom: Assesses the weight of government expenditures on GDP. Ac-
cording to this index, a higher share of government expenditures on GDP is associated with
a lower score.
Monetary Freedom: Measures price stability (the weighted average inflation rate for the
last 3 years) and price controls. The index is constructed such that inflation and price
controls originate lower scores.
Investment Freedom: Evaluates a variety of restrictions imposed on investment, namely
restrictions on FDI, transparency and bureaucracy in the foreign investment code, re-
strictions on land ownership, sectoral investment restrictions, expropriation of investments
without fair compensation, foreign exchange controls and capital controls.
Financial Freedom: Measures bank security and the independence of the financial sys-
tem from government control. This score comprises the extent of government regulation in
the financial system, the extent of state intervention in banks, the difficulty of operating
financial services, and the government influence on the allocation of credit.
Property Freedom: Assesses the ability of individuals to accumulate private property,
secured by clear laws that are fully enforced by the state. Thus, it measures the extent
to which laws protect private property, the degree of enforcement of those laws by the
government, and the likelihood of expropriation. It also analyzes the independence of the
judiciary system, the level of corruption within the judiciary system, and the ability of
28
individuals and business men to enforce contracts.
Freedom from Corruption: Measures the degree of corruption within a country.
Labor Freedom: Measures several aspects of the legal and regulatory framework of a
country’s labor market, such as regulations on the minimum wage, laws inhibiting layoffs,
regulatory burdens on hiring, among others.
A.3 International Country Risk Guide—Political Risk Rating
The International Country Risk Guide computes 22 variables in three categories of risk:
political, financial, and economic. The political risk rating includes 12 variables, covering
political and social attributes. Although some of them are more related with inward FDI
than others, all are used in the principal components analysis, as explained in the main
text. In order to facilitate the comparison in the magnitude of the coefficients, we convert
all indexes to the 0–10 range.
Government stability: Assesses the government’s ability to carry out its declared pro-
gram and the ability to stay in office. It is constructed from 3 subcomponents: government
unity, legislative strength and popular support.
Socioeconomic conditions: Assesses the pressures that could constraint government ac-
tion or fuel social dissatisfaction. It is constructed from 3 subcomponents: unemployment,
consumer confidence and poverty.
Investment profile: Assesses the risks to investment that are not covered by other eco-
nomic, political and financial risk components. It is constructed from 3 subcomponents:
contract viability/expropriation, profile repatriation and payment delays.
Internal conflict: Assesses the political violence and its potential impact on governance.
It is constructed from 3 subcomponents: civil way/coup threat, terrorism/political violence
and civil disorder.
External conflict: Assesses the risk to the government from foreign action, both orig-
inating from non-violent pressures (for instance diplomatic pressures, trade restrictions,
territorial disputes) and violent pressures (cross-border conflicts and war). It is constructed
from 3 subcomponents: war, cross-border conflict and foreign pressures.
Corruption: Assesses corruption in the political system, including bribes, exchange con-
trols and tax assessments, among others.
Military in politics: Measures the involvement of military in politics, which distorts
government policy and diminishes democratic accountability.
Religious tensions: Measures the involvement of religious groups in politics. Religious
groups often seek to replace civil laws by religious laws, thus distorting and constraining
government action.
Law and order: Measures the strength and impartiality of the legal system and the pop-
29
ular observance of the law.
Ethnic tensions: Measures racial, nationality and language tensions, which originate in-
tolerance and unwillingness to make compromises.
Democratic accountability: Measures the responsiveness of government to its people.
The score for this component is based on the following types of governance: alternating
democracy, dominating democracy, de-facto one-party state, de jure one-party state and
autarchy.
Bureaucracy quality: Measures the institutional strength and quality of the bureau-
cracy, and the extent to which bureaucracy is autonomous from the political pressure and
has a established mechanism for recruitment and training.
A.4 Ease of Doing Business
The World Bank’s Doing Business (DB) database measures business regulations and there-
fore the cost of a firm operating in a country. More specifically, it provides quantitative
assessment for starting a business, dealing with construction permits, registering prop-
erty, getting credit, protecting investors, paying taxes, trading across borders, enforcing
contracts and closing a business, in a total of 33 raw factores, described below. For the
analysis, these factors were aggregated into 9 indexes ranging from 0 to 10, each summariz-
ing a specific topic of doing business. To compute these indexes, we proceeded as follows.
First, we represented each raw factor by an index, ranging from 0 to 10, according to the
min-max standardization method,
Scorek = 10factork − factormin
factormax − factormin
if higher factor values imply better performances (e.g., strength of legal rights, recovery
rate when closing a business), or
Scorek = 10 − 10factork − factormin
factormax − factormin
if higher factor values imply worst performances (e.g., procedures, time, cost).
This was done for all countries in the DB database. According to these formulas, all
scores are organized such that higher values always mean better performances. The topic
score is the simple average of all factors that compose that topic. An overall ease of doing
business index is created by taking the simple average of the 9 topic scores.
A.4.1 Starting a business
The starting a business index measures all procedures, costs and time that are formally
required for an entrepreneur to start up and formally operate an industrial or commercial
30

business. It includes the following factors:
Procedures: Number of interactions of the company founders with external parties in
order to formally start operating a business.
Time: Median duration in calendar days that is necessary to complete a procedure with
minimum follow-up with government agencies and no extra payments.
Cost: All official fees and fees for legal or professional services if such services are required
by law in order to start operating a business. It is recorded as a percentage of the economy’s
income per capita.
Minimum Capital: The amount that the entrepreneur needs to deposit in a bank or with
a notary before registration and up to 3 months following incorporation in order to start
operating a business. It is recorded as a percentage of the economy’s income per capita.
A.4.2 Dealing with construction permits
The dealing with construction permits index measures all procedures required for a busi-
ness in the construction industry to build a standardized warehouse, as well as the costs
and time required to complete the procedures. It includes the following factors:
Procedures: Number of procedures required for a business in the construction industry
to build a standardized warehouse.
Time: Median duration in calendar days that is necessary to complete the required pro-
cedures.
Cost: All fees associated with completing the procedures to legally build a warehouse. The
cost is recorded as a percentage of the economy’s income per capita.
A.4.3 Registering property
The registering a property index records the necessary procedures that a business man
must incur to purchase a property from another business man and to transfer the property
title to his name, as well as the associated costs and time. It includes the following factors:
Procedures: Number of procedures that are legally or in practice required for registering
a property.
Time: Median duration that property lawyers, notaries or registry officials indicate is
necessary to complete the procedures for registering a property.
Cost: All the necessary fees to register a property. This variable is recorded as a percentage
of the property value.
31
A.4.4 Getting credit
The getting credit index measures the legal rights of borrowers and lenders with respect to
secured transactions and the sharing of credit information. It includes the following factors:
Strength of legal rights: Index that measures the degree to which collateral and bankruptcy
laws protect the rights of borrowers and lenders and thus facilitate lending. It ranges from
0 to 10.
Depth of credit information: Index that assesses the rules and practices affecting the
coverage, scope and accessibility of credit information, regardless of whether this informa-
tion is available through a public credit registry or through a private credit bureau. It
ranges from 0 to 6.
Public registry coverage: Reports the number of individuals and firms listed in a public
credit registry with information on their borrowing history from the past 5 years. It is
measured as a percentage of adults aged 15 and above.
Private bureau coverage: Reports the number of individuals and firms listed by a pri-
vate credit bureau with information on their borrowing history from the past 5 years. The
number is expressed as a percentage of the adult population aged 15 and above.
A.4.5 Strength of investor protection
The strength of investor protection index measures the strength of minority shareholder
protections against directors misuse of corporate assets for personal gain. It includes the
following factors:
Extent of disclosure: Index which assesses who can approve related-party transactions
and the requirements for external and internal disclosure in case of related-party transac-
tions. It ranges from 0 to 10.
Extent of director liability: Index which measures the ability of shareholders to hold
the interested party and the approving body liable in case of a prejudicial related-party
transaction, the availability of legal remedies (damages, repayment of profits, fines, impris-
onment and rescission of the transaction) and the ability of shareholders to sue. It ranges
from 0 to 10.
Ease of shareholder suits: Index that measures the documents and information available
during trial and the access to internal corporate documents. It ranges from 0 to 10.
A.4.6 Paying taxes
The paying taxes index measures the tax burden and mandatory contributions that a
medium size company must pay in a given year, as well as the administrative burden of
32
paying taxes and contributions. It includes the following factors:
Payments: Reflects the total number of taxes and contributions paid, including consump-
tion taxes, as well as the method of payment, the frequency of payment, the frequency of
filing, for a company during the second year of operation.
Time: Measures the hours per year a company spends to prepare, file and pay the corpo-
rate tax, the value added tax, and social contributions. It includes the time spent to collect
information and to compute the amount payable.
Total tax rate: Measures all taxes and contributions (corporate taxes, social contribu-
tions, labor taxes, property taxes, and other taxes) paid by firms as a percentage of total
profits.
A.4.7 Trading across borders
The trading across borders index measures procedural requirements for exporting and im-
porting a standardized cargo of goods by ocean transport. It includes the following factors:
Documents to export: Number of bank documents, customs clearance documents, port
and terminal handling documents and transport documents required for exporting.
Documents to import: Number of bank documents, customs clearance documents, port
and terminal handling documents and transport documents required for importing.
Time to export: Time (in calendar days) to obtain all documents required for inland
transport and handling, for customs clearance and inspections, and for port and terminal
handling, for exporting a standardized cargo.
Time to import: Time (in calendar days) to obtain all documents required for inland
transport and handling, for customs clearance and inspections, and for port and terminal
handling, for importing a standardized cargo.
Cost to export: Measures the costs (in US dollars per container) of all documentation,
inland transport and handling, customs clearance and inspections and port and terminal
handling, for exporting a standardized cargo.
Cost to import: Measures the costs (in US dollars per container) of all documentation,
inland transport and handling, customs clearance and inspections, and port and terminal
handling, for importing a standardized cargo.
A.4.8 Enforcing contracts
The enforcing contracts index measures the efficiency of the judicial system in resolving a
commercial dispute. It includes the following factors:
33
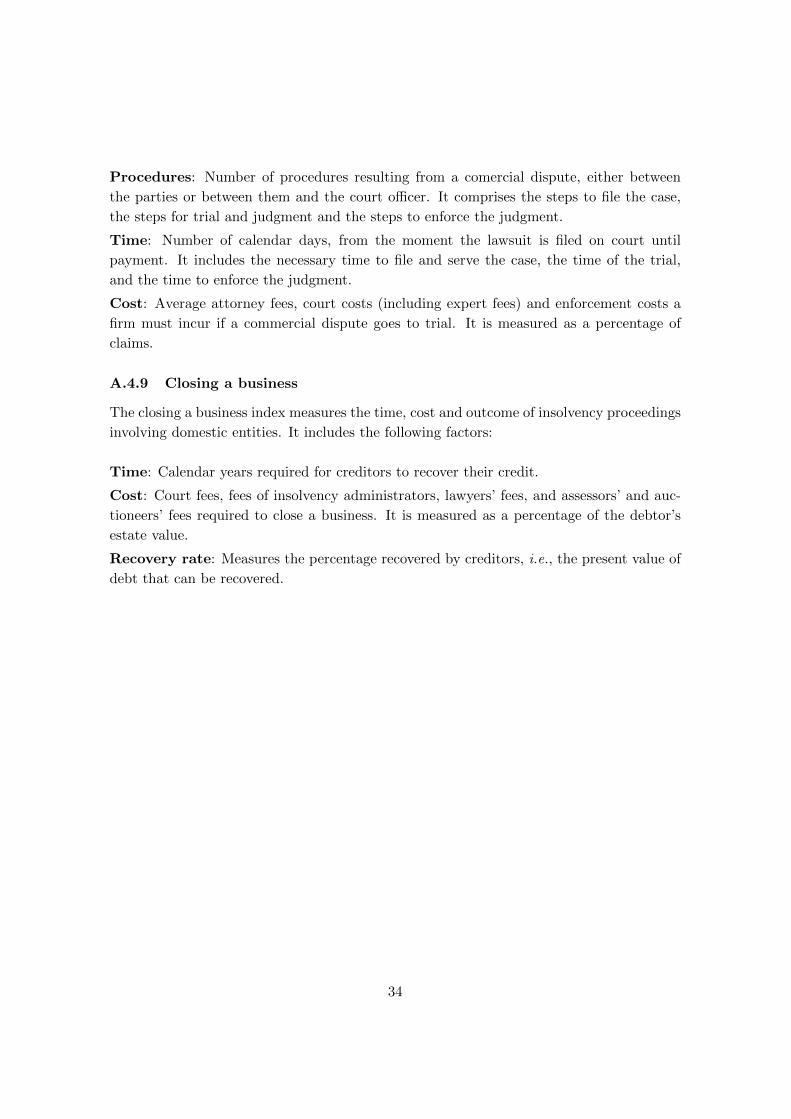
Procedures: Number of procedures resulting from a comercial dispute, either between
the parties or between them and the court officer. It comprises the steps to file the case,
the steps for trial and judgment and the steps to enforce the judgment.
Time: Number of calendar days, from the moment the lawsuit is filed on court until
payment. It includes the necessary time to file and serve the case, the time of the trial,
and the time to enforce the judgment.
Cost: Average attorney fees, court costs (including expert fees) and enforcement costs a
firm must incur if a commercial dispute goes to trial. It is measured as a percentage of
claims.
A.4.9 Closing a business
The closing a business index measures the time, cost and outcome of insolvency proceedings
involving domestic entities. It includes the following factors:
Time: Calendar years required for creditors to recover their credit.
Cost: Court fees, fees of insolvency administrators, lawyers’ fees, and assessors’ and auc-
tioneers’ fees required to close a business. It is measured as a percentage of the debtor’s
estate value.
Recovery rate: Measures the percentage recovered by creditors, i.e., the present value of
debt that can be recovered.
34