Embed Size (px)
Citation preview

Disclosures & Disclaimer
This report must be read with the disclosures and the analyst certifications in
the Disclosure appendix, and with the Disclaimer, which forms part of it.
Issuer of report: HSBC Securities and Capital Markets (India) Private Limited
View HSBC Global Research at:
https://www.research.hsbc.com
GEMs Super 15 is an equity portfolio reflecting our best ideas
across EMs
Since its launch in February 2013, our portfolio has returned
26.8% relative to its custom benchmark
Over the past month, portfolio outperformance was 0.9%
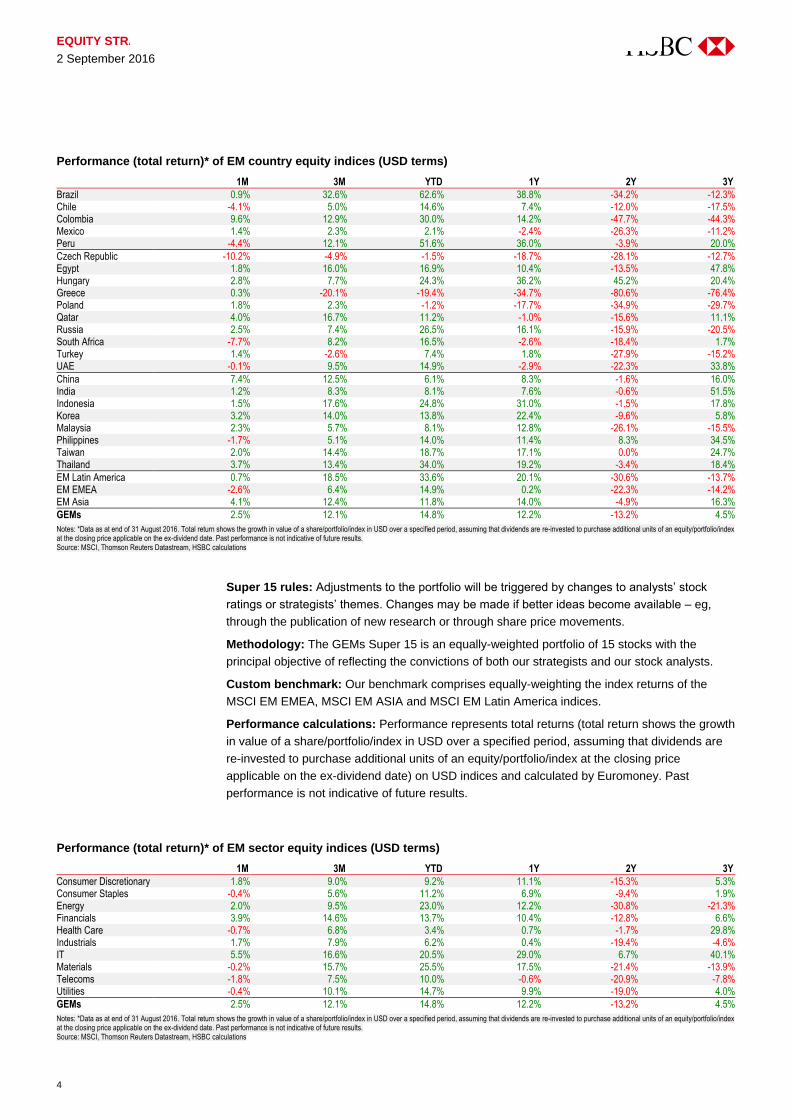
EM equities (as measured by MSCI EM USD index) yielded a total return1 of +2.5%
during August and outperformed their DM counterparts. Amongst EM regions, Asia
outperformed (with total return of +4.1%) helped by a strong performance from China
(+7.4%, second-best performer in EM space for the month), Thailand (+3.7%) and
Korea (+3.2%). LatAm (+0.7%) showed a tepid performance during August following
the stellar performance in the first seven months of this year (+33.6%) primarily as
returns in Brazil (+0.9%) slowed. Colombian equities (with total return of 9.6%),
however, emerged as the best performers among EMs last month. EEMEA equities
(-2.6%) underperformed significantly as performance of South Africa (-7.7%) and
Czech Republic (-10.2%) lagged. By sector, IT (5.5%), Financials (+3.9%)
outperformed; Telecoms (-1.8%) and Healthcare (-0.7%) underperformed the most.
The GEMs Super 15 portfolio outperformed its custom benchmark2 by 0.9% over the
past month, taking the outperformance since inception to 26.8% (see detailed
portfolio statistics on page 3). However, on a year-to-date basis, the portfolio
underperformed by 10.0% given the portfolio’s low beta (0.77) to the cyclical rally in
EMs this year. Over the past month, our positions in Moscow Exchange
(outperformed the benchmark by 12.6%), Bank of China (+8.7%), Samsung
Electronics (+5.0%), Lukoil (+4.2%), Sabanci (+2.8%) and CIB (+2.1%)
outperformed, while those in Anglo Platinum (-15.9%), Bharti Airtel (-8.7%),
Nemak (-1.9%) and Ayala Land (-1.5%) underperformed.
In terms of the portfolio strategy, although a little near-term weakness seems quite
plausible, we are highly constructive on the outlook for EM equities – helped by a
stabilisation in the macro cycle, improvement in earnings, inexpensive valuations, not
so strong USD and lower for longer rates in DM. Further, the asset class is for the
most part unloved and underowned. We prefer cyclical themes within the market.
______________________________________ 1 Total return shows the growth in value of a share/portfolio/index in USD over a specified period, assuming that dividends are re-invested to purchase additional units of an equity/portfolio/index at the closing price applicable on the ex-dividend date. 2 Our custom benchmark comprises of equally-weighting the index returns of the MSCI EM EMEA, MSCI EM ASIA and MSCI EM Latin America indices
2 September 2016
Kishore Muktinutalapati*
Equity Strategist, Frontier & Emerging Markets
HSBC Securities & Capital Markets (India) Pvt Ltd
+91 80 4555 2756
John Lomax*
Head of Global Emerging Market Equity Strategy
HSBC Bank plc
+44 20 7992 3712
*Employed by a non-US affiliate of HSBC Securities (USA) Inc, and is not registered/qualified pursuant to FINRA regulations
GEMs Super 15 EQUITY STRATEGY GLOBAL EMERGING MARKETS
Portfolio fact sheet – August 2016

EQUITY STRATEGY GLOBAL EMERGING MARKETS
2 September 2016
2
HSBC GEMs Super 15 – Model portfolio of 15 equally weighted stocks
Company Name BBG Code Country Sector Share Price HSBC rating
HSBC Analyst name
HSBC target price (TP)
2016e PE (x)
2016e Div. Yield (%)
Anglo Platinum AMS SJ South Africa Metals & Mining 395.31 (ZAR) Buy Emma Townshend* 501.00 (ZAR) 26.6 0.0 Ayala Land ALI PM Philippines Real Estate 38.50 (PHP) Buy Pratik Burman Ray* 46.40 (PHP) 25.9 1.2 Bank Of China Ltd 3988 HK China Commercial Banks 3.49 (HKD) Buy Michael Chu* 4.10 (HKD) 5.1 5.8 Bharti Airtel BHARTI IN India Wireless Telecoms 331.65 (INR) Buy Rajiv Sharma* 430.00 (INR) 24.5 0.4 CIB COMI EY Egypt Commercial Banks 48.89 (EGP) Buy Aybek Islamov* 56.00 (EGP) 10.5 3.2 Hyundai Mobis 012330 KS Korea Auto Components 260,500.00 (KRW) Buy Paul Choi* 300,000.00 (KRW) 7.3 1.3 Innolux Corporation 3481 TT Taiwan Computers 11.20 (TWD) Buy Jerry Tsai* 14.30 (TWD) NM 0.0 Lojas Americanas LAME4 BZ Brazil Multiline Retail 19.23 (BRL) Buy Rafael Shin 23.00 (BRL) 48.5 0.0 Lukoil LKOD LI Russia Oil & Gas 44.85 (USD) Buy Ildar Khaziev* 50.00 (USD) 6.5 6.3 Moscow Exchange MOEX RM Russia Financial services 127.07 (RUB) Buy Andrzej Nowaczek* 148.00 (RUB) 11.6 5.7 Nemak NEMAKA MM Mexico Auto Components 21.21 (MXN) Buy Ivan Enriquez* 29.00 (MXN) 10.9 0.3 OTP OTP HB Hungary Commercial Banks 7,252.00 (HUF) Buy Andrzej Nowaczek* 8,500.00 (HUF) 10.2 2.9 Sabanci Holding SAHOL TI Turkey Conglomerates 9.13 (TRY) Buy Cenk Orcan* 12.20 (TRY) 7.4 2.4 Samsung Electronics 005930 KS Korea Semiconductors 1,620,000.00 (KRW) Buy Ricky Seo* 2,000,000.00 (KRW) 9.8 2.2 SK Innovation 096770 KS Korea Oil & Gas 145,500.00 (KRW) Buy Dennis Yoo* 195,000.00 (KRW) 6.3 2.2
Notes: Prices as at close of the local market on 31 August 2016. *Employed by a non-US affiliate of HSBC Securities (USA) Inc, and is not registered/ qualified pursuant to FINRA regulations
Source: Thomson Reuters Datastream, HSBC estimates
GEMs Super 15 vs. custom benchmark* (top chart) and GEMs Super 15 relative to the custom benchmark (bottom chart) all total returns** indexed to 100 at the start
Notes: *Our custom benchmark comprises of equally-weighting the index returns of the MSCI EM EMEA, MSCI EM ASIA and MSCI EM Latin America indices. **Total return shows the growth in value of a share/portfolio/index in USD over a specified period, assuming that dividends are re-invested to purchase additional units of an equity/portfolio/index at the closing price applicable on the ex-dividend date. Past performance is not indicative of future results. Source: MSCI, Thomson Reuters Datastream, HSBC
60
70
80
90
100
110
120
130
140GEMs Super 15 Custom benchmark*
100
105
110
115
120
125
130
135
140
145
150
Feb-13 Apr-13 Jun-13 Aug-13 Oct-13 Dec-13 Feb-14 Apr-14 Jun-14 Aug-14 Oct-14 Dec-14 Feb-15 Apr-15 Jun-15 Aug-15 Oct-15 Dec-15 Feb-16 Apr-16 Jun-16 Aug-16
GEMs Super 15 relative to custom benchmark*

3
EQUITY STRATEGY GLOBAL EMERGING MARKETS
2 September 2016
Performance* summary
____________________ Absolute returns ____________________ ___________ Returns relative to custom benchmark** _____________
1M 3M 6M 12M QTD YTD
Since inception
*** 1M 3M 6M 12M QTD YTD
Since inception
***
GEMs Super 15 1.6% 9.1% 20.2% -0.1% 6.2% 8.2% 5.8% 0.9% -2.9% -3.8% -10.7% 0.1% -10.0% 26.8% Current constituents Anglo Platinum -15.4% 20.3% 29.5% 11.3% 7.1% 124.6% 35.5% -15.9% 7.0% 3.6% -0.5% 1.0% 87.0% 7.5% Ayala Land -0.8% 8.9% 21.4% 8.9% 0.8% 14.4% 13.6% -1.5% -3.1% -2.9% -2.7% -5.0% -4.8% 15.0% Bank Of China Ltd 9.4% 18.3% 28.6% 5.4% 13.0% 7.9% 17.0% 8.7% 5.3% 2.9% -5.8% 6.5% -10.2% 7.2% Bharti Airtel -8.0% -4.8% 7.8% -6.7% -8.5% -3.4% -6.8% -8.7% -15.3% -13.7% -16.6% -13.8% -19.6% -16.2% CIB 2.8% 14.8% 31.2% 9.5% 22.7% 15.3% 20.6% 2.1% 2.2% 5.0% -2.1% 15.7% -4.1% 10.9% Sabanci 3.5% -0.9% 6.2% 5.3% -5.8% 10.9% 3.5% 2.8% -11.8% -15.0% -5.9% -11.2% -7.7% 2.8% Hyundai Mobis 2.6% 9.2% 16.0% 35.7% 6.8% 11.1% -1.2% 1.9% -2.8% -7.2% 21.3% 0.6% -7.5% 2.4% Innolux Corporation -4.5% 21.3% 23.7% 1.7% 7.4% 18.8% -4.4% -5.2% 7.9% -1.0% -9.1% 1.2% -1.1% -0.9% Lojas Americanas 0.4% 39.7% 43.2% 60.7% 18.7% 46.3% 0.6% -0.3% 24.3% 14.6% 43.6% 11.9% 21.7% 1.9% Lukoil Oil Comp Adr 4.9% 21.9% 31.3% 27.4% 11.6% 44.8% 10.1% 4.2% 8.5% 5.1% 13.9% 5.2% 20.5% 1.3% Moscow Exchange 13.4% 17.5% 57.5% 86.5% 10.4% 66.0% 33.6% 12.6% 4.5% 26.0% 66.7% 4.1% 38.2% 20.9% OTP 7.1% 7.9% 28.2% 38.8% 16.7% 29.5% -1.5% 6.3% -4.0% 2.6% 24.1% 10.0% 7.8% -0.3% Samsung Electronics 5.7% 34.1% 52.6% 60.4% 17.4% 35.3% 30.3% 5.0% 19.4% 22.1% 43.3% 10.7% 12.6% 22.0% SK Innovation Co Ltd 0.1% -4.9% 11.3% 60.1% 7.0% 17.7% -6.2% -0.6% -15.4% -11.0% 43.1% 0.8% -2.0% -2.8% Nemak -1.2% -11.5% -9.5% -2.8% -3.1% -15.5% -3.0% -1.9% -21.2% -27.6% -13.1% -8.7% -29.7% -18.5%
Notes: *Data as at end of 31 August 2016. Total return shows the growth in value of a share/portfolio/index in USD over a specified period, assuming that dividends are re-invested to purchase additional units of an equity/portfolio/index at the closing price applicable on the ex-dividend date. Past performance is not indicative of future results. **Our custom benchmark comprises of equally-weighting the index returns of the MSCI EM EMEA, MSCI EM ASIA and MSCI EM Latin America indices. ***Since launch of the portfolio and inclusion of the stocks (recommendation history of stocks is provided at the end of the document). Source: MSCI, Thomson Reuters Datastream, HSBC calculations
Portfolio statistics (all data based on USD total returns* of the portfolio constituents)
Metric Description Custom benchmark GEMs Super 15
Total return Return since the launch of the portfolio (on 4 February 2013) -16.57% 5.79% Cumulative relative return 26.80% Mean daily return Arithmetic mean of daily returns since the launch of the portfolio -0.01% 0.01% Median daily return Median of daily returns since the launch of the portfolio 0.00% 0.02% Correlation Correlation between daily returns of the benchmark and that of the portfolio. Measures the strength
of the linear relationship between the movement of both indices; correlation can be any value between +1 and -1.
0.85
Beta Calculated as the slope of regression of daily returns on the portfolio to the daily returns of the custom benchmark, beta measures the volatility, or systematic (market-related) risk, of a portfolio as compared to the benchmark.
0.77
Alpha Calculated as the return on the portfolio after adjusting for beta, alpha measures the excess return of the portfolio above the expected return
18.61%
R-squared R-squared measures the significance of alpha and beta of the portfolio. Values range from 0 to 1, higher the value higher the significance.
0.72
Annualised daily returns Average daily return annualised based on an assumption of 260 days -3.57% 2.79% Annualised volatility of daily returns
Standard deviation of daily returns since the launch of the portfolio annualised based on an assumption of 260 days
17.18% 15.62%
Risk-adjusted return Calculated as Annualised daily returns / Annualised volatility of daily returns. -20.77% 17.84% Annualised volatility of daily 'active' returns
Standard deviation of daily active returns (returns of the portfolio - returns of the benchmark) since the launch of the portfolio annualised based on an assumption of 260 trading days
9.10%
Information ratio Measures the excess returns over a benchmark after adjusting for the risk. Higher ratio represents better risk-adjusted return.
0.70
Hit ratio (absolute performance) % of days in which the index (or portfolio) delivered positive returns 50.1% 50.5% Hit ratio (relative performance) % of days in which the portfolio yielded returns in excess of benchmark 52.2%
Notes: *Data as at end of 31 August 2016. Total return shows the growth in value of a share/portfolio/index in USD over a specified period, assuming that dividends are re-invested to purchase additional units of an equity/portfolio/index at the closing price applicable on the ex-dividend date. Past performance is not indicative of future results. Source: MSCI, Thomson Reuters Datastream and HSBC calculations
EQUITY STRATEGY GLOBAL EMERGING MARKETS
2 September 2016
4
Super 15 rules: Adjustments to the portfolio will be triggered by changes to analysts’ stock
ratings or strategists’ themes. Changes may be made if better ideas become available – eg,
through the publication of new research or through share price movements.
Methodology: The GEMs Super 15 is an equally-weighted portfolio of 15 stocks with the
principal objective of reflecting the convictions of both our strategists and our stock analysts.
Custom benchmark: Our benchmark comprises equally-weighting the index returns of the
MSCI EM EMEA, MSCI EM ASIA and MSCI EM Latin America indices.
Performance calculations: Performance represents total returns (total return shows the growth
in value of a share/portfolio/index in USD over a specified period, assuming that dividends are
re-invested to purchase additional units of an equity/portfolio/index at the closing price
applicable on the ex-dividend date) on USD indices and calculated by Euromoney. Past
performance is not indicative of future results.
Performance (total return)* of EM country equity indices (USD terms)
1M 3M YTD 1Y 2Y 3Y
Brazil 0.9% 32.6% 62.6% 38.8% -34.2% -12.3% Chile -4.1% 5.0% 14.6% 7.4% -12.0% -17.5% Colombia 9.6% 12.9% 30.0% 14.2% -47.7% -44.3% Mexico 1.4% 2.3% 2.1% -2.4% -26.3% -11.2% Peru -4.4% 12.1% 51.6% 36.0% -3.9% 20.0%
Czech Republic -10.2% -4.9% -1.5% -18.7% -28.1% -12.7% Egypt 1.8% 16.0% 16.9% 10.4% -13.5% 47.8% Hungary 2.8% 7.7% 24.3% 36.2% 45.2% 20.4% Greece 0.3% -20.1% -19.4% -34.7% -80.6% -76.4% Poland 1.8% 2.3% -1.2% -17.7% -34.9% -29.7% Qatar 4.0% 16.7% 11.2% -1.0% -15.6% 11.1% Russia 2.5% 7.4% 26.5% 16.1% -15.9% -20.5% South Africa -7.7% 8.2% 16.5% -2.6% -18.4% 1.7% Turkey 1.4% -2.6% 7.4% 1.8% -27.9% -15.2% UAE -0.1% 9.5% 14.9% -2.9% -22.3% 33.8%
China 7.4% 12.5% 6.1% 8.3% -1.6% 16.0% India 1.2% 8.3% 8.1% 7.6% -0.6% 51.5% Indonesia 1.5% 17.6% 24.8% 31.0% -1.5% 17.8% Korea 3.2% 14.0% 13.8% 22.4% -9.6% 5.8% Malaysia 2.3% 5.7% 8.1% 12.8% -26.1% -15.5% Philippines -1.7% 5.1% 14.0% 11.4% 8.3% 34.5% Taiwan 2.0% 14.4% 18.7% 17.1% 0.0% 24.7% Thailand 3.7% 13.4% 34.0% 19.2% -3.4% 18.4%
EM Latin America 0.7% 18.5% 33.6% 20.1% -30.6% -13.7% EM EMEA -2.6% 6.4% 14.9% 0.2% -22.3% -14.2% EM Asia 4.1% 12.4% 11.8% 14.0% -4.9% 16.3%
GEMs 2.5% 12.1% 14.8% 12.2% -13.2% 4.5%
Notes: *Data as at end of 31 August 2016. Total return shows the growth in value of a share/portfolio/index in USD over a specified period, assuming that dividends are re-invested to purchase additional units of an equity/portfolio/index at the closing price applicable on the ex-dividend date. Past performance is not indicative of future results. Source: MSCI, Thomson Reuters Datastream, HSBC calculations
Performance (total return)* of EM sector equity indices (USD terms)
1M 3M YTD 1Y 2Y 3Y
Consumer Discretionary 1.8% 9.0% 9.2% 11.1% -15.3% 5.3% Consumer Staples -0.4% 5.6% 11.2% 6.9% -9.4% 1.9% Energy 2.0% 9.5% 23.0% 12.2% -30.8% -21.3% Financials 3.9% 14.6% 13.7% 10.4% -12.8% 6.6% Health Care -0.7% 6.8% 3.4% 0.7% -1.7% 29.8% Industrials 1.7% 7.9% 6.2% 0.4% -19.4% -4.6% IT 5.5% 16.6% 20.5% 29.0% 6.7% 40.1% Materials -0.2% 15.7% 25.5% 17.5% -21.4% -13.9% Telecoms -1.8% 7.5% 10.0% -0.6% -20.9% -7.8% Utilities -0.4% 10.1% 14.7% 9.9% -19.0% 4.0%
GEMs 2.5% 12.1% 14.8% 12.2% -13.2% 4.5%
Notes: *Data as at end of 31 August 2016. Total return shows the growth in value of a share/portfolio/index in USD over a specified period, assuming that dividends are re-invested to purchase additional units of an equity/portfolio/index at the closing price applicable on the ex-dividend date. Past performance is not indicative of future results. Source: MSCI, Thomson Reuters Datastream, HSBC calculations

5
EQUITY STRATEGY GLOBAL EMERGING MARKETS
2 September 2016
Disclosure appendix
Analyst Certification
The following analyst(s), economist(s), and/or strategist(s) who is(are) primarily responsible for this report, certifies(y) that the
opinion(s) on the subject security(ies) or issuer(s) and/or any other views or forecasts expressed herein accurately reflect their
personal view(s) and that no part of their compensation was, is or will be directly or indirectly related to the specific
recommendation(s) or views contained in this research report: Kishore Muktinutalapati and John Lomax
Brazilian Securities Exchange Commission (CVM) Regulation No. 483
Pursuant to CVM Ruling No. 483 (July 2010), HSBC has obtained from the analyst(s) listed above under "Analyst Certification"
and disclosed (where applicable), the statements set forth in Article 17 and have rendered (where applicable) the statements set
forth in Article 18, under the sections titled "Analyst Certification" and "HSBC & Analyst Disclosures". The analyst(s)
furthermore certifies(y) that the recommendations contained in this report have been prepared independently, even in relation to
HSBC.
Additionally, for purposes of Article 16, the principal analyst responsible for compliance of the mentioned regulation is the first
name in the list under "Analyst Certification" that has local certification, where applicable.
Important disclosures
Equities: Stock ratings and basis for financial analysis
HSBC believes an investor's decision to buy or sell a stock should depend on individual circumstances such as the investor's
existing holdings, risk tolerance and other considerations and that investors utilise various disciplines and investment horizons
when making investment decisions. Ratings should not be used or relied on in isolation as investment advice. Different
securities firms use a variety of ratings terms as well as different rating systems to describe their recommendations and
therefore investors should carefully read the definitions of the ratings used in each research report. Further, investors should
carefully read the entire research report and not infer its contents from the rating because research reports contain more
complete information concerning the analysts' views and the basis for the rating.
From 23rd March 2015 HSBC has assigned ratings on the following basis:
The target price is based on the analyst’s assessment of the stock’s actual current value, although we expect it to take six to 12
months for the market price to reflect this. When the target price is more than 20% above the current share price, the stock will
be classified as a Buy; when it is between 5% and 20% above the current share price, the stock may be classified as a Buy or a
Hold; when it is between 5% below and 5% above the current share price, the stock will be classified as a Hold; when it is
between 5% and 20% below the current share price, the stock may be classified as a Hold or a Reduce; and when it is more
than 20% below the current share price, the stock will be classified as a Reduce.
Our ratings are re-calibrated against these bands at the time of any 'material change' (initiation or resumption of coverage,
change in target price or estimates).
Upside/Downside is the percentage difference between the target price and the share price.
Prior to this date, HSBC’s rating structure was applied on the following basis:
For each stock we set a required rate of return calculated from the cost of equity for that stock’s domestic or, as appropriate,
regional market established by our strategy team. The target price for a stock represented the value the analyst expected the
stock to reach over our performance horizon. The performance horizon was 12 months. For a stock to be classified as
Overweight, the potential return, which equals the percentage difference between the current share price and the target price,
including the forecast dividend yield when indicated, had to exceed the required return by at least 5 percentage points over the
succeeding 12 months (or 10 percentage points for a stock classified as Volatile*). For a stock to be classified as Underweight,
the stock was expected to underperform its required return by at least 5 percentage points over the succeeding 12 months (or
10 percentage points for a stock classified as Volatile*). Stocks between these bands were classified as Neutral.
*A stock was classified as volatile if its historical volatility had exceeded 40%, if the stock had been listed for less than 12
months (unless it was in an industry or sector where volatility is low) or if the analyst expected significant volatility. However,

EQUITY STRATEGY GLOBAL EMERGING MARKETS
2 September 2016
6
stocks which we did not consider volatile may in fact also have behaved in such a way. Historical volatility was defined as the
past month's average of the daily 365-day moving average volatilities. In order to avoid misleadingly frequent changes in rating,
however, volatility had to move 2.5 percentage points past the 40% benchmark in either direction for a stock's status to change.
Rating distribution for long-term investment opportunities
As of 01 September 2016, the distribution of all independent ratings published by HSBC is as follows:
Buy 43% (24% of these provided with Investment Banking Services)
Hold 41% (26% of these provided with Investment Banking Services)
Sell 16% (18% of these provided with Investment Banking Services)
For the purposes of the distribution above the following mapping structure is used during the transition from the previous to
current rating models: under our previous model, Overweight = Buy, Neutral = Hold and Underweight = Sell; under our current
model Buy = Buy, Hold = Hold and Reduce = Sell. For rating definitions under both models, please see “Stock ratings and basis
for financial analysis” above.
For the distribution of non-independent ratings published by HSBC, please see the disclosure page available at
http://www.hsbcnet.com/gbm/financial-regulation/investment-recommendations-disclosures.
Information regarding company share price performance and history of HSBC ratings and target prices in respect of long-term
investment opportunities for the companies that are the subject of this report is available from www.hsbcnet.com/research.
To view a list of all the independent fundamental ratings disseminated by HSBC during the preceding 12-month period, please
see the disclosure page available at www.research.hsbc.com/A/Disclosures.
HSBC & Analyst disclosures
Disclosure checklist
Company Ticker Recent price Price date Disclosure
AYALA LAND ALI.PS 38.40 01-Sep-2016 6, 11 BANK OF CHINA LTD 3988.HK 3.55 01-Sep-2016 1, 2, 4, 5, 6, 7, 11, 12 BHARTI AIRTEL BRTI.BO 331.65 31-Aug-2016 6 CIB COMI.CA 48.89 31-Aug-2016 6 LOJAS AMERICANAS LAME4.SA 19.23 31-Aug-2016 7 NEMAK NEMAKA.MX 21.21 31-Aug-2016 5 OTP OTPB.BU 7252.00 31-Aug-2016 6 SABANCI HOLDING SAHOL.IS 9.13 31-Aug-2016 6, 7 SAMSUNG ELECTRONICS 005930.KS 1587000.00 01-Sep-2016 6 SK INNOVATION 096770.KS 147500.00 01-Sep-2016 6
Source: HSBC
1 HSBC has managed or co-managed a public offering of securities for this company within the past 12 months.
2 HSBC expects to receive or intends to seek compensation for investment banking services from this company in the next 3
months.
3 At the time of publication of this report, HSBC Securities (USA) Inc. is a Market Maker in securities issued by this
company.
4 As of 31 July 2016 HSBC beneficially owned 1% or more of a class of common equity securities of this company.
5 As of 31 July 2016, this company was a client of HSBC or had during the preceding 12 month period been a client of
and/or paid compensation to HSBC in respect of investment banking services.
6 As of 31 July 2016, this company was a client of HSBC or had during the preceding 12 month period been a client of
and/or paid compensation to HSBC in respect of non-investment banking securities-related services.
7 As of 31 July 2016, this company was a client of HSBC or had during the preceding 12 month period been a client of
and/or paid compensation to HSBC in respect of non-securities services.
8 A covering analyst/s has received compensation from this company in the past 12 months.
9 A covering analyst/s or a member of his/her household has a financial interest in the securities of this company, as
detailed below.
10 A covering analyst/s or a member of his/her household is an officer, director or supervisory board member of this

7
EQUITY STRATEGY GLOBAL EMERGING MARKETS
2 September 2016
company, as detailed below.
11 At the time of publication of this report, HSBC is a non-US Market Maker in securities issued by this company and/or in
securities in respect of this company
12 As of 29 August 2016, HSBC beneficially held a net long position of more than 0.5% of this company’s total issued share
capital, calculated according to the SSR methodology.
13 As of 29 August 2016, HSBC beneficially held a net short position of more than 0.5% of this company’s total issued share
capital, calculated according to the SSR methodology.
HSBC and its affiliates will from time to time sell to and buy from customers the securities/instruments, both equity and debt
(including derivatives) of companies covered in HSBC Research on a principal or agency basis.
Analysts, economists, and strategists are paid in part by reference to the profitability of HSBC which includes investment
banking, sales & trading, and principal trading revenues.
Whether, or in what time frame, an update of this analysis will be published is not determined in advance.
Economic sanctions imposed by the EU and OFAC prohibit transacting or dealing in new debt or equity of Russian SSI entities.
This report does not constitute advice in relation to any securities issued by Russian SSI entities on or after July 16 2014 and as
such, this report should not be construed as an inducement to transact in any sanctioned securities.
For disclosures in respect of any company mentioned in this report, please see the most recently published report on that
company available at www.hsbcnet.com/research. In order to find out more about the proprietary models used to produce this
report, please contact the authoring analyst.
Additional disclosures
1 This report is dated as at 02 September 2016.
2 All market data included in this report are dated as at close 31 August 2016, unless a different date and/or a specific time of
day is indicated in the report.
3 HSBC has procedures in place to identify and manage any potential conflicts of interest that arise in connection with its
Research business. HSBC's analysts and its other staff who are involved in the preparation and dissemination of Research
operate and have a management reporting line independent of HSBC's Investment Banking business. Information Barrier
procedures are in place between the Investment Banking, Principal Trading, and Research businesses to ensure that any
confidential and/or price sensitive information is handled in an appropriate manner.
4 You are not permitted to use, for reference, any data in this document for the purpose of (i) determining the interest
payable, or other sums due, under loan agreements or under other financial contracts or instruments, (ii) determining the
price at which a financial instrument may be bought or sold or traded or redeemed, or the value of a financial instrument,
and/or (iii) measuring the performance of a financial instrument.
5 Recommendation history for stocks currently in our GEMs Super 15 portfolio
Ayala Land (from 6 January 2015 at PHP33.70)
Nemak (from 24 September 2015 at MXN20.60)
Bharti Airtel (from 6 October 2015 at INR339.50)
Anglo Platinum (from 26 February 2016 at ZAR306.00)
Bank Of China Ltd (from 1 April 2016 at HKD3.25)
Moscow Exchange (from 8 April 2016 at RUB102.67)
Samsung Electronics (from 25 April 2016 at KRW1,294,000.00)
CIB (from 6 July 2016 at EGP40.55)
Lukoil (from 6 July 2016 at USD43.00)

EQUITY STRATEGY GLOBAL EMERGING MARKETS
2 September 2016
8
Sabanci Holding (from 29 July 2016 at TRY8.55)
Hyundai Mobis (from 11 August 2016 at KRW260,000.00)
Innolux Corporation (from 11 August 2016 at TWD12.00)
SK Innovation (from 11 August 2016 at KRW151,500.00)
Lojas Americanas (from 24 August 2016 at BRL18.30)
OTP (from 24 August 2016 at HUF7,060.00)
6 Recommendation history for stocks removed from our GEMs Super 15 portfolio
Emlak Konut REIT (from 4 February 2013 at TRY3.11 to 10 February 2013 at TRY2.78)
Sberbank RF (from 4 February 2013 at USD3.65 to 14 March 2013 at USD3.40)
Yanbu Petrochemical (from 4 February 2013 at SAR52.00 to 14 March 2013 at SAR51.75)
Golden Eagle Retail Group (from 4 February 2013 at HKD16.70 to 28 March 2013 at HKD13.90)
Grupo Pao de Acucar (from 4 February 2013 at BRL93.90 to 26 April 2013 at BRL109.70)
Lojas Renner (from 4 February 2013 at BRL79.71 to 26 April 2013 at BRL74.75)
ABIL (from 28 March 2013 at ZAR30.10 to 7 May 2013 at ZAR22.74)
Sun Pharma (from 4 February 2013 at INR718.00 to 10 May 2013 at INR985.55)
Magnit (from 14 March 2013 at USD44.20 to 6 June 2013 at USD54.60)
China State Construction (from 4 February 2013 at HKD10.18 to 14 June 2013 at HKD12.38)
Titan Industries Ltd (from 9 May 2013 at INR276.30 to 14 June 2013 at INR204.55)
Samsung Electronics (from 4 February 2013 at KRW1,448,000.00 to 26 June 2013 at KRW1,313,000.00)
Etihad Etisalat(Mobily) (from 14 March 2013 at SAR79.50 to 16 July 2013 at SAR82.50)
Wal-Mart de Mexico (from 4 February 2013 at MXN41.22 to 29 July 2013 at MXN35.53)
Banco Itau Unibanco (from 4 February 2013 at BRL34.35 to 21 August 2013 at BRL28.90)
Hyundai Department Store (from 10 February 2013 at KRW153,000.00 to 30 August 2013 at KRW151,500.00)
MercadoLibre (from 4 February 2013 at USD88.40 to 30 August 2013 at USD120.94)
Qatar National Bank (from 6 June 2013 at QAR149.00 to 12 September 2013 at QAR169.40)
Kalbe Farma (from 26 June 2013 at IDR1,200.00 to 16 September 2013 at IDR1,340.00)
Casino (from 26 April 2013 at EUR81.44 to 27 September 2013 at EUR76.55)
MediaTek (from 4 February 2013 at TWD323.00 to 21 October 2013 at TWD394.00)
PetroChina (from 30 August 2013 at HKD8.27 to 23 October 2013 at HKD9.10)
Emaar Properties PJSC (from 7 May 2013 at AED5.50 to 29 October 2013 at AED6.10)
CIB (from 4 February 2013 at EGP35.42 to 6 November 2013 at EGP42.75)
Experian Ltd (from 16 July 2013 at GBP12.10 to 4 December 2013 at GBP11.15)
Sberbank RF (from 12 September 2013 at RUB96.79 to 8 January 2014 at RUB98.63)
Abu Dhabi Comm Bank (from 29 October 2013 at AED4.90 to 8 January 2014 at AED7.13)
Huaneng Power Internation (from 14 June 2013 at HKD7.24 to 13 January 2014 at HKD7.20)

9
EQUITY STRATEGY GLOBAL EMERGING MARKETS
2 September 2016
Samsung Electronics (from 30 August 2013 at KRW1,309,000.00 to 13 January 2014 at KRW1,291,000.00)
Astra International (from 16 September 2013 at IDR6,150.00 to 13 January 2014 at IDR6,800.00)
Sun Pharma (from 14 June 2013 at INR980.70 to 13 January 2014 at INR600.90)
TMG (from 6 November 2013 at EGP5.60 to 13 February 2014 at EGP7.25)
Kotak Mahindra Bank (from 13 January 2014 at INR712.90 to 19 February 2014 at INR650.75)
Impala Platinum (from 21 August 2013 at ZAR112.60 to 28 February 2014 at ZAR112.00)
Cash in EGP (from 13 February 2014 to 4 March 2014)
Qatar National Bank (from 7 January 2014 at QAR172.90 to 4 March 2014 at QAR195.00)
Kazmunaigas EP (from 19 February 2014 at USD15.52 to 12 March 2014 at USD13.20)
Vale (from 29 July 2013 at USD14.45 to 2 April 2014 at USD13.79)
Taiwan Semiconductor (from 21 October 2013 at TWD107.00 to 4 April 2014 at TWD118.50)
Kalbe Farma (from 13 January 2014 at IDR1,300.00 to 5 May 2014 at IDR1,545.00)
Jarir Marketing Co (from 28 February 2014 at SAR177.75 to 14 May 2014 at SAR201.25)
Public power corp (from 4 December 2013 at EUR11.30 to 6 June 2014 at EUR11.85)
Grupo Televisa (from 26 April 2013 at USD25.74 to 4 July 2014 at USD34.95)
Pegatron Corp (from 4 April 2014 at TWD46.20 to 9 July 2014 at TWD59.60)
Grupo Pao de Acucar (from 27 September 2013 at BRL104.99 to 17 July 2014 at BRL104.25)
National Bank of Greece (from 6 June 2014 at EUR2.60 to 23 July 2014 at EUR2.48)
Ayala Land (from 12 March 2014 at PHP29.30 to 12 August 2014 at PHP31.05)
CIB (from 4 March 2014 at EGP35.94 to 20 August 2014 at EGP46.60)
Rabigh Refining And Petro (from 8 January 2014 at SAR27.50 to 20 August 2014 at SAR34.60)
MercadoLibre (from 4 July 2014 at USD95.52 to 4 September 2014 at USD115.30)
Charoen Pokphand Foods PC (from 12 August 2014 at THB29.00 to 23 September 2014 at THB31.25)
Catcher Technology (from 9 July 2014 at TWD284.00 to 30 September 2014 at TWD276.00)
Samba Financial Group (from 23 July 2014 at SAR39.60 to 15 October 2014 at SAR45.75)
Cash in EGP (from 20 August 2014 to 27 October 2014)
Magnit (from 14 May 2014 at USD52.10 to 11 November 2014 at USD60.25)
BM&F Bovespa (from 4 September 2014 at BRL13.90 to 13 November 2014 at BRL9.93)
Commercial Bank Of Qatar (from 4 March 2014 at QAR77.00 to 15 December 2014 at QAR66.20)
Asustek (from 30 September 2014 at TWD283.50 to 6 January 2015 at TWD346.50)
Public Power Corporation (from 15 December 2014 at EUR5.50 to 6 January 2015 at EUR5.10)
Alibaba Group (from 13 November 2014 at USD114.54 to 19 January 2015 at USD96.30)
Bank Central Asia Tbk (from 5 May 2014 at IDR11,000.00 to 16 February 2015 at IDR13,900.00)
Baidu.com Inc. (from 13 January 2014 at USD181.79 to 27 February 2015 at USD203.53)
Credicorp Ltd (from 23 October 2013 at USD139.90 to 27 February 2015 at USD147.70)
EQUITY STRATEGY GLOBAL EMERGING MARKETS
2 September 2016
10
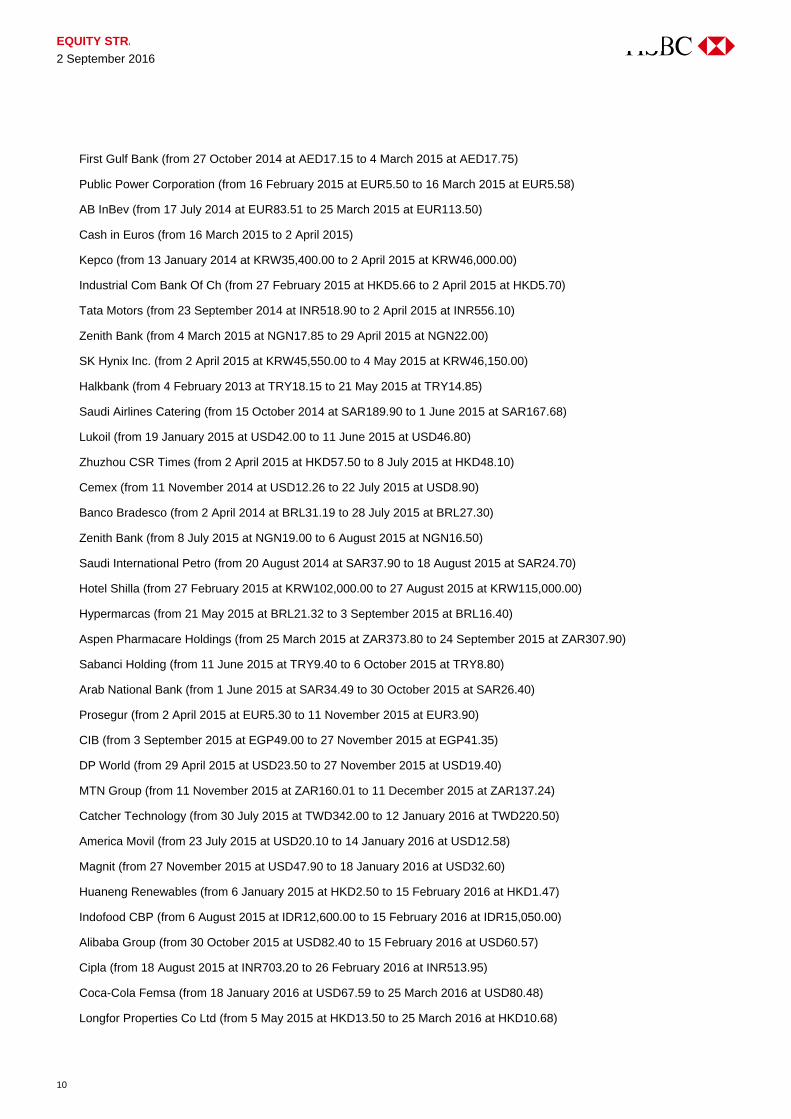
First Gulf Bank (from 27 October 2014 at AED17.15 to 4 March 2015 at AED17.75)
Public Power Corporation (from 16 February 2015 at EUR5.50 to 16 March 2015 at EUR5.58)
AB InBev (from 17 July 2014 at EUR83.51 to 25 March 2015 at EUR113.50)
Cash in Euros (from 16 March 2015 to 2 April 2015)
Kepco (from 13 January 2014 at KRW35,400.00 to 2 April 2015 at KRW46,000.00)
Industrial Com Bank Of Ch (from 27 February 2015 at HKD5.66 to 2 April 2015 at HKD5.70)
Tata Motors (from 23 September 2014 at INR518.90 to 2 April 2015 at INR556.10)
Zenith Bank (from 4 March 2015 at NGN17.85 to 29 April 2015 at NGN22.00)
SK Hynix Inc. (from 2 April 2015 at KRW45,550.00 to 4 May 2015 at KRW46,150.00)
Halkbank (from 4 February 2013 at TRY18.15 to 21 May 2015 at TRY14.85)
Saudi Airlines Catering (from 15 October 2014 at SAR189.90 to 1 June 2015 at SAR167.68)
Lukoil (from 19 January 2015 at USD42.00 to 11 June 2015 at USD46.80)
Zhuzhou CSR Times (from 2 April 2015 at HKD57.50 to 8 July 2015 at HKD48.10)
Cemex (from 11 November 2014 at USD12.26 to 22 July 2015 at USD8.90)
Banco Bradesco (from 2 April 2014 at BRL31.19 to 28 July 2015 at BRL27.30)
Zenith Bank (from 8 July 2015 at NGN19.00 to 6 August 2015 at NGN16.50)
Saudi International Petro (from 20 August 2014 at SAR37.90 to 18 August 2015 at SAR24.70)
Hotel Shilla (from 27 February 2015 at KRW102,000.00 to 27 August 2015 at KRW115,000.00)
Hypermarcas (from 21 May 2015 at BRL21.32 to 3 September 2015 at BRL16.40)
Aspen Pharmacare Holdings (from 25 March 2015 at ZAR373.80 to 24 September 2015 at ZAR307.90)
Sabanci Holding (from 11 June 2015 at TRY9.40 to 6 October 2015 at TRY8.80)
Arab National Bank (from 1 June 2015 at SAR34.49 to 30 October 2015 at SAR26.40)
Prosegur (from 2 April 2015 at EUR5.30 to 11 November 2015 at EUR3.90)
CIB (from 3 September 2015 at EGP49.00 to 27 November 2015 at EGP41.35)
DP World (from 29 April 2015 at USD23.50 to 27 November 2015 at USD19.40)
MTN Group (from 11 November 2015 at ZAR160.01 to 11 December 2015 at ZAR137.24)
Catcher Technology (from 30 July 2015 at TWD342.00 to 12 January 2016 at TWD220.50)
America Movil (from 23 July 2015 at USD20.10 to 14 January 2016 at USD12.58)
Magnit (from 27 November 2015 at USD47.90 to 18 January 2016 at USD32.60)
Huaneng Renewables (from 6 January 2015 at HKD2.50 to 15 February 2016 at HKD1.47)
Indofood CBP (from 6 August 2015 at IDR12,600.00 to 15 February 2016 at IDR15,050.00)
Alibaba Group (from 30 October 2015 at USD82.40 to 15 February 2016 at USD60.57)
Cipla (from 18 August 2015 at INR703.20 to 26 February 2016 at INR513.95)
Coca-Cola Femsa (from 18 January 2016 at USD67.59 to 25 March 2016 at USD80.48)
Longfor Properties Co Ltd (from 5 May 2015 at HKD13.50 to 25 March 2016 at HKD10.68)

11
EQUITY STRATEGY GLOBAL EMERGING MARKETS
2 September 2016
Bank Central Asia Tbk (from 12 January 2016 at IDR13,000.00 to 1 April 2016 at IDR13,125.00)
NTPC (from 2 April 2015 at INR146.85 to 8 April 2016 at INR126.20)
Qatar Electricity & Water (from 27 August 2015 at QAR199.30 to 8 April 2016 at QAR203.00)
Garanti Bankasi (from 15 February 2016 at TRY7.05 to 25 April 2016 at TRY8.65)
Yue Yuen Industrial (from 14 January 2016 at HKD24.35 to 25 April 2016 at HKD26.85)
Sberbank RF (from 11 December 2015 at RUB100.66 to 11 May 2016 at RUB120.64)
CIB (from 8 April 2016 at EGP39.48 to 17 May 2016 at EGP43.80)
Gazprom (from 11 May 2016 at USD4.74 to 19 May 2016 at USD4.68)
Banco do Brasil (from 25 March 2016 at BRL19.64 to 2 June 2016 at BRL16.47)
Cash in USD (from 2 June 2016 to 8 June 2016)
Hypermarcas (from 8 June 2016 at BRL29.14 to 6 July 2016 at BRL24.40)
Cash in EGP (from 19 May 2016 to 6 July 2016)
CP All (from 15 February 2016 at THB40.75 to 18 July 2016 at THB51.75)
Is Bankasi (from 25 April 2016 at TRY4.95 to 27 July 2016 at TRY4.42)
Cash in USD (from 27 July 2016 to 29 July 2016)
Samsonite Intl SA (from 27 November 2015 at HKD23.45 to 11 August 2016 at HKD21.45)
Amorepacific (from 15 February 2016 at KRW393,500.00 to 11 August 2016 at KRW377,000.00)
BAT Malaysia (from 18 July 2016 at THB54.16 to 11 August 2016 at THB50.26)
Magnit (from 19 May 2016 at USD36.39 to 15 August 2016 at USD41.35)
Cash in USD (from 15 August 2016 to 24 August 2016)
Standard Bank (from 25 March 2016 at ZAR129.53 to 24 August 2016 at ZAR149.83)
MSCI Disclaimer
The MSCI sourced information is the exclusive property of MSCI Inc. (MSCI). Without prior written permission of MSCI, this
information and any other MSCI intellectual property may not be reproduced, redisseminated or used to create any financial
products, including any indices. This information is provided on an “as is” basis. The user assumes the entire risk of any use
made of this information. MSCI, its affiliates and any third party involved in, or related to, computing or compiling the information
hereby expressly disclaim all warranties of originality, accuracy, completeness, merchantability or fitness for a particular purpose
with respect to any of this information. Without limiting any of the foregoing, in no event shall MSCI, any of its affiliates or any
third party involved in, or related to, computing or compiling the information have any liability for any damages of any kind. MSCI
and the MSCI indexes are services marks of MSCI and its affiliates.
Production & distribution disclosures
1 This report was produced and signed off by the author on 01 Sep 2016 12:19 GMT.
2 In order to see when this report was first disseminated please see the disclosure page available at
https://www.research.hsbc.com/R/34/G7BGD7n

EQUITY STRATEGY GLOBAL EMERGING MARKETS
2 September 2016
12
Disclaimer
Legal entities as at 1 July 2016
‘UAE’ HSBC Bank Middle East Limited, Dubai; ‘HK’ The Hongkong and Shanghai Banking Corporation Limited, Hong
Kong; ‘TW’ HSBC Securities (Taiwan) Corporation Limited; 'CA' HSBC Bank Canada, Toronto; HSBC Bank, Paris Branch;
HSBC France; ‘DE’ HSBC Trinkaus & Burkhardt AG, Düsseldorf; 000 HSBC Bank (RR), Moscow; ‘IN’ HSBC Securities and
Capital Markets (India) Private Limited, Mumbai; ‘JP’ HSBC Securities (Japan) Limited, Tokyo; ‘EG’ HSBC Securities
Egypt SAE, Cairo; ‘CN’ HSBC Investment Bank Asia Limited, Beijing Representative Office; The Hongkong and Shanghai
Banking Corporation Limited, Singapore Branch; The Hongkong and Shanghai Banking Corporation Limited, Seoul
Securities Branch; The Hongkong and Shanghai Banking Corporation Limited, Seoul Branch; HSBC Securities (South
Africa) (Pty) Ltd, Johannesburg; HSBC Bank plc, London, Madrid, Milan, Stockholm, Tel Aviv; ‘US’ HSBC Securities (USA)
Inc, New York; HSBC Yatirim Menkul Degerler AS, Istanbul; HSBC México, SA, Institución de Banca Múltiple, Grupo
Financiero HSBC; HSBC Bank Australia Limited; HSBC Bank Argentina SA; HSBC Saudi Arabia Limited; The Hongkong
and Shanghai Banking Corporation Limited, New Zealand Branch incorporated in Hong Kong SAR; The Hongkong and
Shanghai Banking Corporation Limited, Bangkok Branch
Issuer of report
HSBC Securities and Capital Markets (India) Private
Limited
Registered Office
52/60 Mahatma Gandhi Road
Fort, Mumbai 400 001, India
Telephone: +91 22 2267 4921
Fax: +91 22 2263 1983
Website: www.research.hsbc.com
SEBI Reg No. INH000001287
CIN: U67120MH1994PTC081575
This document has been issued by HSBC Securities and Capital Markets (India) Private Limited ("HSBC") for the information of its customers only. HSBC Securities and Capital Markets (India)
Private Limited is registered as "Research Analyst" (Reg No. INH000001287), Merchant Banker (Reg No. INM000010353) and Stock Broker (Reg. No. NSE Cash -INB230791734, NSE F & O-
INF230791734, BSE Cash- INB010791730, BSE F & O- INF010791730) and regulated by the Securities and Exchange Board of India. If it is received by a customer of an affiliate of HSBC, its
provision to the recipient is subject to the terms of business in place between the recipient and such affiliate. This document is not and should not be construed as an offer to sell or the
solicitation of an offer to purchase or subscribe for any investment. HSBC has based this document on information obtained from sources it believes to be reliable but which it has not
independently verified; HSBC makes no guarantee, representation or warranty and accepts no responsibility or liability as to its accuracy or completeness. Expressions of opinion are those of
the Research Division of HSBC only and are subject to change without notice. From time to time research analysts conduct site visits of covered issuers. HSBC policies prohibit research
analysts from accepting payment or reimbursement for travel expenses from the issuer for such visits. HSBC and its affiliates and/or their officers, directors and employees may have positions
in any securities mentioned in this document (or in any related investment) and may from time to time add to or dispose of any such securities (or investment). HSBC and its affiliates may act
as market maker or have assumed an underwriting commitment in the securities of companies discussed in this document (or in related investments), may sell them to or buy them from
customers on a principal basis and may also perform or seek to perform investment banking or underwriting services for or relating to those companies and may also be represented in the
supervisory board or any other committee of those companies. Details of Associates of HSBC Securities and Capital Markets (India) Private Limited can be obtained from Compliance Officer:
Mudit Tayal, Email: [email protected] The information and opinions contained within the research reports are based upon publicly available information and rates of taxation applicable at
the time of publication which are subject to change from time to time. Past performance is not necessarily a guide to future performance. The value of any investment or income may go down
as well as up and you may not get back the full amount invested. Where an investment is denominated in a currency other than the local currency of the recipient of the research report,
changes in the exchange rates may have an adverse effect on the value, price or income of that investment. In case of investments for which there is no recognised market it may be difficult for
investors to sell their investments or to obtain reliable information about its value or the extent of the risk to which it is exposed.
HSBC Securities (USA) Inc. accepts responsibility for the content of this research report prepared by its non-US foreign affiliate. All U.S. persons receiving and/or accessing this report and wishing to effect
transactions in any security discussed herein should do so with HSBC Securities (USA) Inc. in the United States and not with its non-US foreign affiliate, the issuer of this report.
In the UK this report may only be distributed to persons of a kind described in Article 19(5) of the Financial Services and Markets Act 2000 (Financial Promotion) Order 2005. The protections
afforded by the UK regulatory regime are available only to those dealing with a representative of HSBC Bank plc in the UK. In Singapore, this publication is distributed by The Hongkong and
Shanghai Banking Corporation Limited, Singapore Branch for the general information of institutional investors or other persons specified in Sections 274 and 304 of the Securities and Futures
Act (Chapter 289) (“SFA”) and accredited investors and other persons in accordance with the conditions specified in Sections 275 and 305 of the SFA. This publication is not a prospectus as
defined in the SFA. It may not be further distributed in whole or in part for any purpose. The Hongkong and Shanghai Banking Corporation Limited Singapore Branch is regulated by the
Monetary Authority of Singapore. Recipients in Singapore should contact a "Hongkong and Shanghai Banking Corporation Limited, Singapore Branch" representative in respect of any matters
arising from, or in connection with this report. In Australia, this publication has been distributed by The Hongkong and Shanghai Banking Corporation Limited (ABN 65 117 925 970, AFSL
301737) for the general information of its “wholesale” customers (as defined in the Corporations Act 2001). Where distributed to retail customers, this research is distributed by HSBC Bank
Australia Limited (AFSL No. 232595). These respective entities make no representations that the products or services mentioned in this document are available to persons in Australia or are
necessarily suitable for any particular person or appropriate in accordance with local law. No consideration has been given to the particular investment objectives, financial situation or particular
needs of any recipient. This publication is distributed in New Zealand by The Hongkong and Shanghai Banking Corporation Limited, New Zealand Branch incorporated in Hong Kong SAR.
In Japan, this publication has been distributed by HSBC Securities (Japan) Limited. In Hong Kong, this document has been distributed by The Hongkong and Shanghai Banking Corporation
Limited in the conduct of its Hong Kong regulated business for the information of its institutional and professional customers; it is not intended for and should not be distributed to retail
customers in Hong Kong. The Hongkong and Shanghai Banking Corporation Limited makes no representations that the products or services mentioned in this document are available to
persons in Hong Kong or are necessarily suitable for any particular person or appropriate in accordance with local law. All inquiries by such recipients must be directed to The Hongkong and
Shanghai Banking Corporation Limited. In Korea, this publication is distributed by The Hongkong and Shanghai Banking Corporation Limited, Seoul Securities Branch ("HBAP SLS") for the
general information of professional investors specified in Article 9 of the Financial Investment Services and Capital Markets Act (“FSCMA”). This publication is not a prospectus as defined in the
FSCMA. It may not be further distributed in whole or in part for any purpose. HBAP SLS is regulated by the Financial Services Commission and the Financial Supervisory Service of Korea.
In Canada, this document has been distributed by HSBC Bank Canada and/or its affiliates. Where this document contains market updates/overviews, or similar materials (collectively deemed
“Commentary” in Canada although other affiliate jurisdictions may term “Commentary” as either “macro-research” or “research”), the Commentary is not an offer to sell, or a solicitation of an
offer to sell or subscribe for, any financial product or instrument (including, without limitation, any currencies, securities, commodities or other financial instruments).
© Copyright 2016, HSBC Securities and Capital Markets (India) Private Limited, ALL RIGHTS RESERVED. No part of this publication may be reproduced, stored in a retrieval system, or
transmitted, on any form or by any means, electronic, mechanical, photocopying, recording, or otherwise, without the prior written permission of HSBC Securities and Capital Markets (India)
Private Limited. MCI (P) 094/06/2016, MCI (P) 085/06/2016 and MICA (P) 021/01/2016
[526148]

Global
Global Equity Strategist Ben Laidler +1 212 525 3460 [email protected]
Daniel Grosvenor +44 20 7991 4246 [email protected]
Yevgeniy Shelkovskiy +1 212 525 3035 [email protected]
Europe
Robert Parkes +44 20 7991 6716 [email protected]
Amit Shrivastava +91 80 4555 2759 [email protected]
CEEMEA
Head of Global Emerging Market Equity Strategy John Lomax +44 20 7992 3712 [email protected]
Kishore Muktinutalapati +91 80 4555 2756 [email protected]
Asia
Head of Equity Strategy, Asia Pacific Herald van der Linde +852 2996 6575 [email protected]
Devendra Joshi +852 2996 6592 [email protected]
China
Head of HK/China Equity Research and China Equity Strategy Steven Sun +852 2822 4298 [email protected]
Bruce Pang +852 2996 6916 [email protected]
Singapore
Head of Research, ASEAN Ismael Pili +852 3941 7008 [email protected]
Taiwan
Head of Taiwan Research John Chung +8862 6631 2868 [email protected]
Eric Chen +8862 6631 2870 [email protected]
India
Devendra Joshi +852 2996 6592 [email protected]
Korea
Head of Research, Korea Brian Cho +822 3706 8750 [email protected]
Latin America
LatAm Equity Strategist Nicholas D Smithie 1 212 525 5350 [email protected]
Erika Lucchesi 54 11 4323 4715 [email protected]
Southern Cone & Andean Equity Strategist Francisco Schumacher, CFA +1 212 525 4430 [email protected]
Yevgeniy Shelkovskiy +1 212 525 3035 [email protected]
Mexico Equity Strategist Jaime Aguilera +52 55 5721 2379 [email protected]
Global Equity Strategy Research Team