Embed Size (px)
Citation preview
Gender and Community Management of Water Infrastructure:Evidence from a Randomized Evaluation in Kenya*
Jessica Leino†
University of California Berkeley Economics and Science, Environment and Development Group at Harvard’s Center for International Development
This Draft: October 2007First Draft: August 2007
Abstract
Despite a wide consensus that women’s participation is important for managing local public goods, little evidence exists on whether gender advocacy is effective at boosting participation and improving outcomes. I examine how advocacy efforts can affect the participation of women and how women’s participation in turn may affect water infrastructure maintenance among usergroups responsible for maintaining newly improved water sources in western Kenya. Half the communities were randomly selected to receive an intervention verbally encouraging them to increase female participation on their user committees. This intervention increased the number of women on committees by an average of 20 percent and more than doubled the probability that the chairperson was female, with these differences persisting over time. However, increasing women’s participation did not impact maintenance outcomes or maintenance quality. There is also no evidence that increases in women’s participation on water user committees altered other outcomes in the community. These results suggests that gender advocacy can be a useful means of boosting female participation, with little distortion in the effectiveness of these committees in delivering public goods.
* This research is supported by the USDA/Foreign Agricultural Service, Swedish International Development Agency, the Finnish Fund for Local Cooperation in Kenya, Google.org, the UCB Institute of Business and Economics Research, a Graduate Research Fellowship from the National Science Foundation, the Science, Environment and Development Group at Harvard’s Center for International Development, and the Institute of Business and Economic Research at Berkeley. I thank the staff of ICS, IPA, and NYG for their assistance in the field. I thank Saumitra Jha, Marit Rehavi and especially Edward Miguel, Michael Kremer, and Alix Zwane for their support and helpful comments. Preliminary draft, comments welcome. All errors are my own.† 549 Evans Hall #3880, Department of Economics, University of California, Berkeley, CA 94720-3880, USA, [email protected].
1
The World Bank views the third Millennium Development Goal—to promote gender equality and empower women—as a central component to its overall mission to reduce poverty and stimulate economic growth. (World Bank 2006)
Specific interventions to address gender inequality should be an intrinsic part of all MDG-based investment packages. They should also address systemic challenges such as … increased representation at all levels of governance.(UNDP 2005)
Promoting gender equity and increasing women’s participation is now seen as both a key goal in
its own right and a crucial component of projects designed to meet the targets of the Millennium
Development Goals. Development agencies and funders are increasingly emphasizing the role
of women in all facets of development (World Bank 2001, UNDP 2005, World Bank 2006,
World Bank 2007). One major area where women’s participation is a key focus for both equity
and efficiency reasons is the management of local public goods, including infrastructure projects
in the water sector. 1 Progress in the water sector is needed to meet another Millennium
Development Goal of halving the proportion of people without sustainable access to safe
drinking water and basic sanitation, and “women play a central part in the provision,
management, and safeguarding of water” (Declaration of the International Conference on Water
and the Environment, 1992; quoted in Brooks 2002). Indeed, increasing women’s participation
in community development projects in this sector has become a central project outcome: for
instance, in the World Bank’s Ghana Second Community Water and Sanitation Project, “the
number of gender-balanced water and sanitation committees is a key performance measure”
(World Bank, Gender and Development Group, 2002).
Despite a wide consensus that women’s participation is important for managing local
public goods, little evidence exists on whether commonly advocated policies—such as gender
advocacy and quota systems—are effective at boosting female participation and improving other
outcomes and whether tradeoffs arise in attempts to meet these dual objectives simultaneously.
In this paper, I use data collected from a water quality improvement project in rural Kenya to
1 In addition, many service delivery projects in developing countries now explicitly target women as the primary beneficiaries of programs. Mexico’s Oportunidades program is one well-known example; in this program, women receive cash transfers if their children attend school and receive regular health checkups. The decision to direct transfers exclusively to women was “motivated by growing evidence that when women control household resources, children’s health and nutrition improve” (IFPRI 2001). An example of a study that provides such evidence is Duflo’s (2000) examination of the extension of an old-age pension in South Africa; she finds large and significant gains in child nutrition for the female grandchildren of grandmothers who received the pension.
2
examine whether encouraging women to participate on local water management committees
increases active female participation and alters the effectiveness of the committees in managing
the water resource. I also examine how the intervention to boost female participation interacts
with the structure of financial support offered to communities. The project took place in 334
communities that were participating in NGO projects that provided infrastructure to improve
local drinking water sources. The NGOs provided training in how to manage and maintain the
source to a committee of water users elected by the community, and then handed the
infrastructure over to the water user committee to manage. I worked with the NGOs to design
and implement an intervention that aimed to boost female membership on committees and
encourage women to take up leadership positions on the committees. 2 The intervention
consisted of several components: advance efforts to encourage women to attend the community
meeting at which user committees would be selected, holding the meetings at a convenient time
for women to attend, and speeches by NGO facilitators on the importance of women’s
participation. This intervention was cross-cut with another set of interventions that provided
various forms of financial support to a randomly selected subset of communities. Communities
were randomly selected to receive the interventions; the sample of communities participating in
the infrastructure project was stratified on baseline community characteristics, which NGO was
overseeing the infrastructure and committee training, and the year in which the project would be
implemented and randomly assigned to receive a package of interventions. After the
interventions were implemented, data was collected on user committees and infrastructure
maintenance over a three year period.
I use the exogenous variation created by the random assignment of the female
participation intervention and financial support to communities to identify the effects of
increased women’s involvement on user committee composition and maintenance outcomes. I
estimate the reduced-form average treatment effect of receiving the intervention and use an
instrumental variables approach to identify the local average treatment effect of the participation
of women who became committee members due to the intervention. I also use non-parametric
estimation techniques to explore whether the effects of the interventions differs over the
2 I designed and implemented the local water management committee intervention as a separate component of a larger study (joint with Michael Kremer, Ted Miguel and Alix Zwane) that examines the health effects of improvements in source water quality.
3
distribution of gender ratios on user committees. I further compare the results of the randomized
evaluation to non-experimental estimates of the effects of female participation.
I find that the female participation intervention increased the number of women on
committees by an average of 20 percent. Women occupy almost one additional leadership
position and are more than twice as likely to chair committees on the average committee that
received the intervention. Differences in the gender composition of user committees are
persistent nearly three years after the intervention. These results suggest that interventions to
improve female participation can be successful, even when the intervention is non-binding. The
female participation intervention did not lead to differential selection on the user committees:
there are no differences in the average wealth, education, social connectedness or other
characteristics of either men or women on committees that received the intervention (though
there are differences between the average man and the average woman committee member).
However, increasing women’s participation does not significantly impact maintenance outcomes
or maintenance quality in this setting. In this context, increasing women’s participation has no
negative impact on project outcomes; I can reject negative impacts greater than about five
percent. It seems that the intervention was able to successfully overcome social costs to female
participation and that any negative impacts of the lower average education and experience of
female committee members is offset by other factors in which women might have a comparative
advantage, such as monitoring costs or information about the resource. I also find no evidence
that increases in women’s participation on user committees have spillover impacts on other
outcomes in the community (such as income-generating activities or other activities such as tree
planting). These results suggests that gender advocacy can be a useful means of boosting female
participation, with little distortion in the effectiveness of these committees in delivering public
goods.
Section II provides a more detailed motivation for the paper that draws on the relevant
literature on local public goods management and gender. Section III describes the data and the
project from which the data is collected. Section IV presents the empirical strategy and Section
V discusses the results. Section VI concludes.
4
II. Motivation for Promoting Female Participation in LPG Management
In order to meet the dual objectives of increasing women’s participation and improving
the effectiveness of local public goods delivery, a social planner might choose the level of
participation and other inputs to maximize a social welfare function in which female
participation enters the utility function both directly and as an input into the production function
for management outcomes, subject to budget and other constraints. The project outcomes about
which the social planner cares are the quantity and quality of the public good provided by the
project. In this paper, which examines water infrastructure projects, I focus on outcome
measures that are correlated with the ultimate outcomes of interest for the social planner and that
community resource managers can impact: water quality and the life span of the infrastructure
project.3 How any tradeoffs between increasing women’s participation and these project
outcomes should be valued is a normative question, but examining the direction and magnitude
of how changes in participation affect project outcomes provides useful information for assessing
policy choices.
Some discussion of the existing literature is useful at this point. Several policy papers
argue that improving equity will improve outcomes, so there is no tradeoff between increasing
women’s participation and project quality (e.g., Pandolfelli et al. 2007, IDA 2007). Though the
empirical evidence on which such claims are based is limited, a number of arguments have been
proposed for the channels through which female participation might impact project outcomes and
these arguments can generate useful hypotheses that can be tested empirically. The most
commonly-cited motivation for boosting female participation is based on a case study literature
that suggests that women and men may value public goods (or their by-products) differently, and
in some cases, women’s preferences are more aligned with the preferences of a benevolent social
planner. For example, if women value the health of their children more than men, and unclean
water is responsible for a large fraction of infant death and illness due to diarrheal diseases,
women may have a greater incentive to ensure that a local water source is maintained and kept
clean. A further reason why women’s participation may improve the management of natural
resources is because women’s social networks provide them with prior experience with
3 For a given budget, the project cost will determine how much of the good can be provided. In the case of infrastructure projects with high up-front construction costs, if management inputs can extend the lifespan of the project, the amortized cost of the infrastructure decreases and more of the public good can be provided over a longer time period for a given budget.
5
collective action (Agarwal 2000). In addition, since women are major users of these goods,
women’s involvement in creating rules for managing the resource may be especially important
for ensuring long-term compliance within the community (Zwarteveen and Meinzen-Dick 2001).
The gender of the primary users and managers of a resource may also impact how it is
managed because traditional gender roles facilitate different costs of information and monitoring.
Due to gendered divisions of labor, women are often the primary users of these resources and in
the course of their use acquire specialized knowledge about the resource. They may also have
lower costs to monitoring the resource. For instance, women (who, in many societies, devote
several hours a day to collecting water) may have lower costs of collecting information on the
maintenance status of a water source. In both of these examples, placing women in charge of
managing the resource may lead to better maintenance outcomes. Women may have fewer
outside employment options and may thus be able to devote more time to committee work.
On the other hand, the social position of the resource managers in the community may
interact with gender in determining the effectiveness of resource management. For example, if
women have more social distance from (often male) community leaders, women may be less
effective managers if they are unable to persuade influential community members to ascribe to
their management decisions or to prevent corruption from impacting the provision of the public
good. Alternatively, women, who have lower levels of education on average and are less likely
to work outside the home, may also have less management experience and may be less effective
leaders, at least initially.4
Though existing work has posited several plausible channels through which female
participation might impact outcomes, much of the empirical evidence on the effect of women’s
participation in local governance and public good management is hampered by concerns about
reverse causality and omitted variables bias. Retrospective analyses (e.g., Prokopy 2004,
Weinberger and Jutting 2001) and case studies (e.g., INSTAW-UN 1990, Fortmann and
Rocheleau 1985, Geisler 1993, Stonich 1989, Thomas-Slayter, Sodikoof and Reynolds 1996,
Wijk-Sijbesma 1998, Gross, Wijk, and Mukherjee 2001) cannot convincingly establish a causal
relationship between between womens’ participation in local government and the quality of
4 Of course, this discussion ignores heterogeneity within a gender; wealth, education, and other differences may well be more significant than gender in determining the effectiveness of resource managers.
6
service provision.5 It is difficult to determine whether the inclusion of women causes a
particular outcome to occur or if the fact than an outcome occurs encourages the participation
and inclusion of women. It is also difficult to rule out the possibility that some other factor is
driving both women’s participation and the outcome. Cross-country studies of the relationship
between women’s participation and the quality of governance, usually measured by corruption,
(e.g. Dollar, Fisman and Gatti 2001, Swamy et al. 2001) and meta-analyses of local community-
based projects (e.g., Narayan, 1995; Gross et al., 2001; van Wijk et al, 2002) are particularly
vulnerable to these concerns, as women are more likely to be elected or participate in progressive
areas where outcomes may be better for other reasons.
There is even less work on the mechanisms by which women’s participation might affect
outcomes. The only studies that provide well-identified evidence on the impacts of increased
participation ascribe differences in outcomes to different preferences (Chattopadhyay and Duflo
2004) or to discrimination (Duflo 2006). Both studies utilize the fact that since 1993, one-third
of the seats and presidencies of the rural village councils in India have been reserved for women,
and reserved seats are allocated amongst constituencies randomly. Chattopadhyay and Duflo
(2004) show that village councils headed by women were more likely to invest in public
infrastructure for drinking water, and, more generally, that councils dominated by a particular
gender were more likely to invest in goods important to that gender, where the importance of a
good to a gender was measured by the number of complaints made to the village council by that
gender about that specific public good. In a related paper, Topalova and Duflo (2004) analyze
the outcomes for women village council leaders. They show that, according to objective data
from technical audits of the number and quality of public goods available in the villages, women
provide more and better quality public goods than men do. Moreover they find that, on average,
women take significantly fewer bribes than men. However, subjective data ranks women’s
5 To take one example, Prokopy (2004) examines participation of women in water committees in 45 villages in two Indian states. All committees examined had one third female membership, as mandated by the state reservation system. The author compares committee and project performance four to six months after project initiation, and concludes that women’s participation (as measured by monetary contributions, attendance at committee meetings, and asking questions at meetings) does not matter for project success but that overall community participation does matter. As all committees have the same structure, Prokopy lacks a counterfactual with which to compare the level of female membership. The findings presented may also be vulnerable to omitted variable bias of unknown magnitude, as both participation and project success may be driven by unobserved community specific factors, making her results difficult to interpret.
7
performance as village managers worse than men’s performance. Duflo (2006) attributes the
divergence in results to “the widespread perception that women are not competent leaders.”
In the experimental economics literature, there are some studies that may be helpful in
efforts to understand the underlying mechanisms by which gender might affect project outcomes.
Several experimental studies examine whether women supply differing levels of public goods or
are more cooperative than men (e.g., Solow and Kirkwood 2002, Eckel and Grossman 1998,
Nowell and Tinkler 1994). However, conclusions seem to be sensitive to the form of the
experiment performed and laboratory conditions may be quite different from real-world
situations.
III. Description of Project and Data
This paper uses data from a project implemented by several non-governmental
organizations (NGOs) that provided infrastructure for improved water quality in 334
communities in Western Kenya, facilitated the creation of user committees to manage and
maintain the local infrastructure, and provided additional financial support to a randomly
selected subset of the user committees. Due to administrative and funding constraints, the
project was implemented over a period of three years, with groups of communities phased in to
the project beginning in 2004, with the order of phase-in determined randomly. This paper
examines the impact of an intervention that encouraged women to take on a greater leadership
role in their communities’ user committees on both female participation and committee
performance.
The technology for improving water quality in this project is spring protection. Naturally
occurring springs are an important source of drinking water in East Africa, but when unprotected
this water is vulnerable to contamination, particularly from human and animal fecal matter.
Spring protection seals off the source of a naturally occurring spring and encases it in concrete so
that water flows out from a pipe rather than seeping from the ground, where it is vulnerable to
contamination from surface runoff. In a study of the health impacts of source water quality
improvements, my coauthors and I find that spring protection improves the quality of water at
the source, reducing fecal contamination by approximately three quarters, and has positive health
benefits for households: diarrhea among young children in treatment households falls about one-
fifth after up to thirty months of spring protection (Kremer et al. 2007). We also find that
8
communities value this technology: we estimate willingness to pay (WTP) for improved source
water by analyzing how households change their choice of water source – and in particular, the
distance they are willing to walk to collect water – in response to the improvements generated by
spring protection, in a conditional logit discrete choice model. The revealed preference results
indicate that the average valuation of spring protection is on the order of US$4.52-9.05 per
household per year in an area where per the daily agricultural wage is around $2.20 (Kremer et
al. 2007).
In the project studied in this paper, the NGO coordinates and funds the engineering works
for spring protection, but requires a community contribution of approximately ten percent of the
total cost of protection, typically in the form of locally available materials (e.g., sand and stones)
that can be gathered by the community as well as unskilled labor provided by the community to
excavate the site and dig drainage trenches. After construction, protected springs require little
maintenance relative to wells with mechanical pumps, but some efforts are necessary to maintain
water quality and to extend the life of the protected spring. (Well-maintained springs can last for
up to 50 years, while poorly maintained springs deteriorate in 5 to 10 years.) Maintenance
activities include clearing the drainage ditches surrounding the spring so that the concrete
encasement does not become waterlogged and crack, and keeping the water catchment area for
the spring free of rubbish and the vegetation surrounding the spring slashed to prevent
contamination via seepage and to allow for maximum water flow.
In this area of Kenya, it is common for committees of users to perform these and other
maintenance activities at water sources. When implementing projects like this water quality
improvement program, NGOs typically follows a standard model for transferring control of the
infrastructure to the community. The NGO facilitates a community meeting where community
members elect a group of 9 to 12 users of the water source to form a management committee.
The committee members are provided with training by the NGO and government facilitators on
community leadership and how to manage the water source, but are then typically given no
further financial support in maintaining the water source.
For this particular water quality program, several variants on the standard model of
community management were introduced. First, in a randomly selected half of communities,
NGO staff administered a “female participation intervention” in which NGO facilitators used a
specially designed script to encourage women to participate on the user committees and explain
9
the benefits of women’s leadership in maintaining water resources. Several other steps were also
taken to boost women’s participation at springs selected for the intervention. At these springs,
community meetings were held in the afternoons, when women typically have fewer domestic
tasks. The NGO has found that afternoon meetings are successful in boosting the attendance of
women, and that women are more likely to volunteer to be on the user committee if other women
are present at the community meeting. Prior to the community meetings at springs selected for
the female participation intervention, the local village elders (ligurus) were also informed that
the NGO was particularly interested in having women attend the community mobilization
meeting, and were asked to make a strong effort to notify women about the meeting and
encourage them to attend.
The female participation intervention was cross-cut with another randomized intervention
that varied the level of and delivery mechanism for external financial support for spring
maintenance, so that an equal number of springs in each maintenance intervention group were
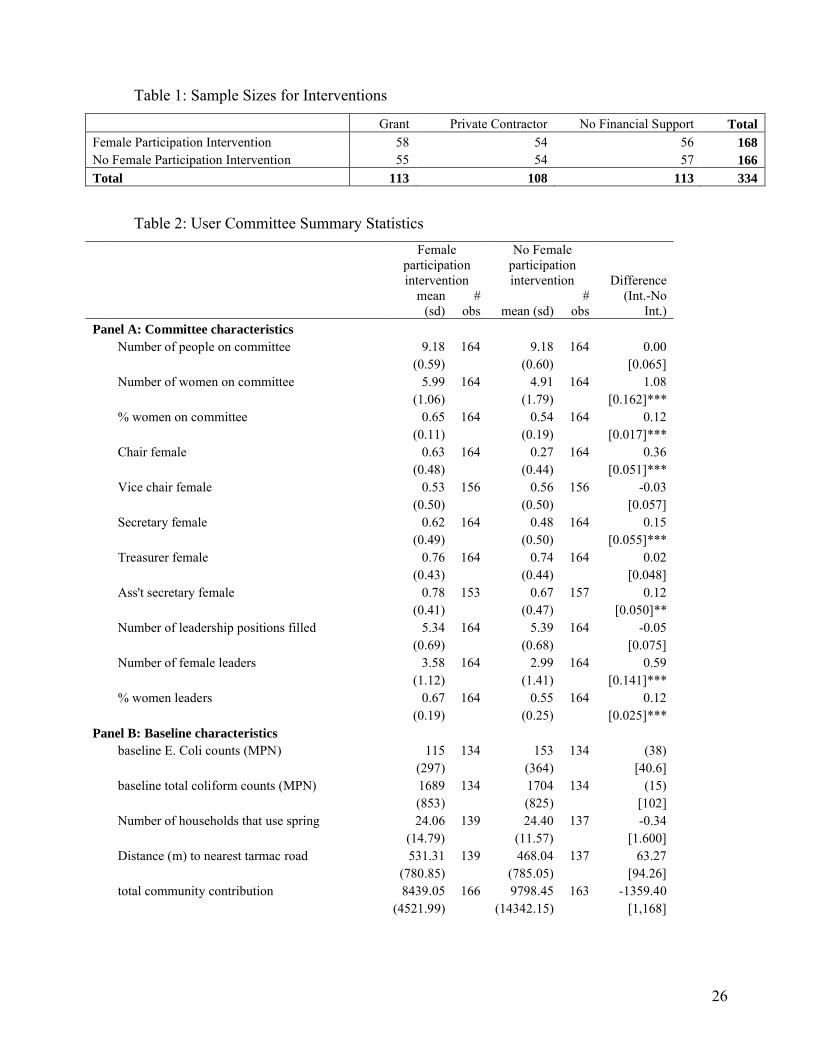
exposed to the participation intervention. (Sample sizes for each of these cells are shown in
Table 1.) Committees also were randomly selected to receive one of three financing
interventions. The status quo model of infrastructure maintenance in this area is for the
government or an NGO to construct the infrastructure in a community; a committee of users is
then responsible for managing and maintaining the infrastructure with no further assistance from
the outside funder. One third of water management committees in this project followed this
financing model. At the second third of committees, the NGO provides a monthly grant to fund
maintenance of the spring. The user committee is responsible for maintenance activities at the
spring, and all maintenance costs above and beyond the NGO grant are the responsibility of the
local community. At the final third of committees, the NGO contracts directly with a spring
maintenance worker from the community to maintain the spring. The user committee and the
NGO jointly monitor the activities of the spring maintenance worker, but decisions on whether to
contract with or renew contracts with the worker is ultimately the responsibility of the NGO.
The monthly payment to the spring maintenance workers is equivalent to two days wages
at the local agriculture day labor rate (approximately $2.20 per day), as the NGOs estimate that
maintenance tasks will take approximately two full days each month. The spring maintenance
worker’s monthly pay is equivalent to the amount of the committee grant.
10
The sample of communities participating in the infrastructure project was stratified on
baseline community characteristics, which NGO was overseeing the infrastructure and
committee training, and the year in which the project would be implemented and then randomly
assigned to receive a package of interventions. Table 1 shows the numbers of committees
receiving each combination of the participation and finance interventions at each of the 334
communities that participated in the project.6 The randomization of springs into the female
participation and finance interventions groups succeeded in creating comparable groups along
observable dimensions; there are no significant differences among groups in baseline water
quality (as measured by total and fecal coliform counts), number of households served, and
distance of the water source from a tarmac road (Table 2, Panel B).
Data
As protection of springs and formation of user committees occurred over a several year
period, some groups of user committees have a longer data collection history. Each committee
has between three and five observations on maintenance outcomes and information on user
committee composition over a two to three year period.
Information on user committee membership and changes in user committee membership
were collected to construct a roster of committee membership over time. A short survey was
administered to all user committee members immediately following their selection to the user
committee. Data collected includes members’ demographic information (e.g. age, education,
ethnicity), individual “social capital” measures (e.g. voluntary associational activities), and
knowledge of current spring maintenance conditions. The NGOs also provided all user
committees with a receipt book and a log book, and encouraged all committees to record
essential project data at all committee meetings. User group records were coded to obtain
information on: community contributions for construction and maintenance (both in cash and in
kind), attendance at committee meetings, financial records, and other committee activities. In
addition to the data from user committee records, field officers also administered a twice yearly
survey to the whole committee to obtain additional information on committee activities,
6 I have complete data for at least one followup round on 314 of the user committees. The 20 committees with incomplete data do not have significantly different baseline characteristics (results not shown).
11
including data on repairs undertaken, income-generating activities implemented, and strategies
for managing financial resources.
To assess the quality of maintenance, enumerators made unannounced visits to the
springs several times each year, where they completed a standard survey instrument in which
they estimated how long it had been since a variety of maintenance tasks were performed and
how well each maintenance task was being performed. These maintenance tasks included: the
estimated number of days since the storm drains were unclogged, the time since the drainage
trenches have been cleaned, and the time since the catchment area surrounding the spring was
last cleared of brush. Enumerators completing the maintenance assessments were unaware of the
package of interventions that a given spring had received. During these visits, spring water
samples were also collected. The water samples were taken to a local laboratory for analysis,
where total coliform counts and e. coli counts (e. coli are an indicator bacteria for the presence of
diarrhea-causing fecal coliforms) were measured using the Colilert testing method (which is
easy-to-use and error-resistant in field laboratory conditions).
IV. Empirical Strategy
To assess the effectiveness of the female participation intervention on maintenance
outcomes at the spring, I examine a number of different measures of committee performance.
Due to the random assignment of the interventions to communities, any differences in outcomes
among the groups can be attributed to the interventions. In the discussion that follows, I focus
on maintenance activities and maintenance quality outcomes observed by trained enumerators, as
self reports seem unreliable (they have a very low correlation with enumerator reports; results
not shown). Regressions of committee actions on water quality measures show that maintenance
activities have a statistically significant impact on water quality, though the specific committee
activities that have in impact differ across the rainy and dry seasons (results not shown). Also,
over the three-year study period, I cannot directly observe the lifespan of the infrastructure.
However, I can look at factors that are plausibly correlated with infrastructure life, such as the
number of unrepaired cracks in the concrete structure of the spring, or eroded pipes. Regressions
of these factors on maintenance actions (such as clearing trenches) are statistically significant
(results not shown).
12
The panel dataset contains between three and five observations on maintenance outcomes
and committee composition for each spring, with each round of data collection spaced
approximately six months apart. I first estimate the average treatment effect for committees that
received the intervention. The basic specification for the maintenance regressions is:
Outcomeit = α + β1Genderi + β2Granti + β3Contractori + ∑tγtroundt +
∑iGroupi*∑itSeasonit + ∑it Seasonit + ∑iGroupi + ∑itδXit + eit
where i indexes springs and t indexes round. Regressions include season-group fixed effects
throughout the analysis to account for seasonal differences in the need for maintenance and
possible differences among groups of springs in construction quality and committee training.
Regressions also include survey-round fixed effects and are clustered at the spring level. The
coefficients of interest are the betas on assignment to the gender and finance intervention groups.
Some specifications also include interaction terms to capture the effects of receiving both
participation and financing interventions. Other specifications also control for a variety of
characteristics of current user committee members (e.g., mean education level, mean age, mean
hygiene knowledge), the Xit in the specification above.
I examine the effects of the interventions on a variety of maintenance outcomes and I also
calculate the mean effect size over several baskets of (not perfectly correlated) maintenance
outcomes. To calculate mean effects, I use a technique that normalizes each of the K outcomes
in a given basket of outcomes by the standard deviation of the outcome, then tests the null
hypothesis of no average effect for all outcomes in the basket.7 I also use instrumental variables
to examine the effect of an exogenous change in the percentage of women on the user committee
on maintenance outcomes. The IV results can be interpreted as the local average treatment
effect: the effect on maintenance that can be attributed to the change in committee composition
caused by the intervention.
7 See Bloom et al. (2006), O’Brien (1984), Tamhane and Logan (2003), and Kling, Katz, Leibman, and Sonbanmatsu (2004) for more details and applications of this method.
13
V. Results on Participation and Maintenance Outcomes
Participation
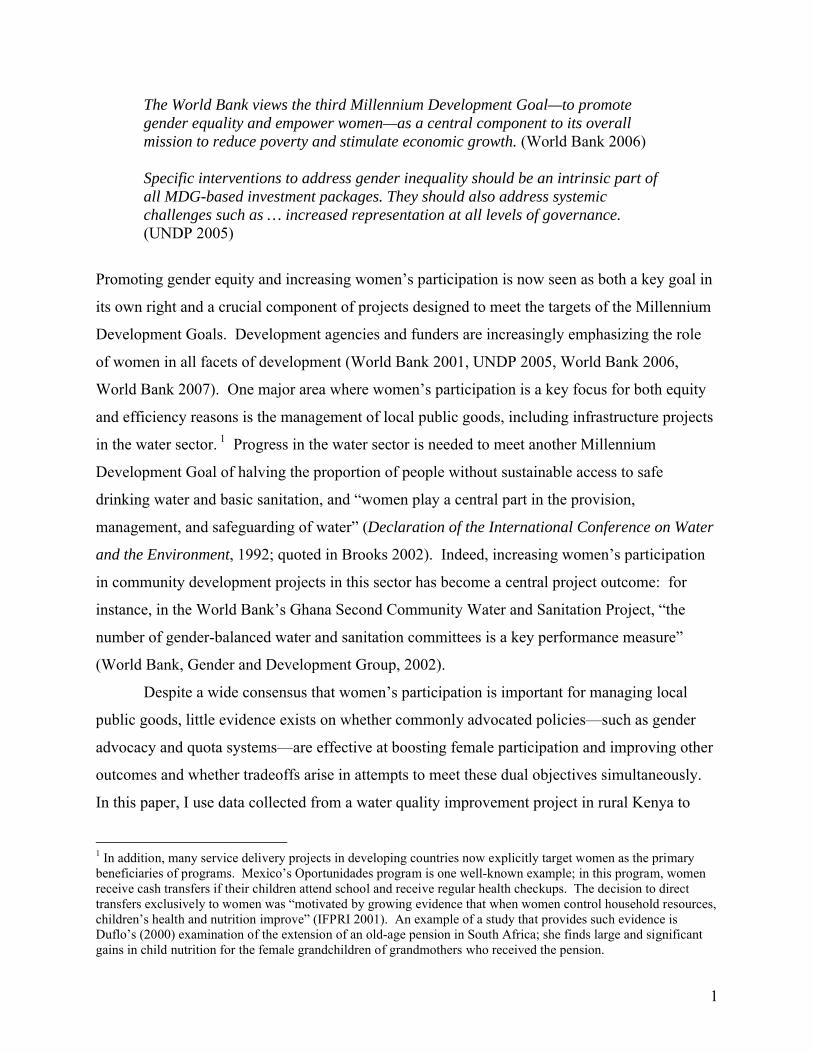
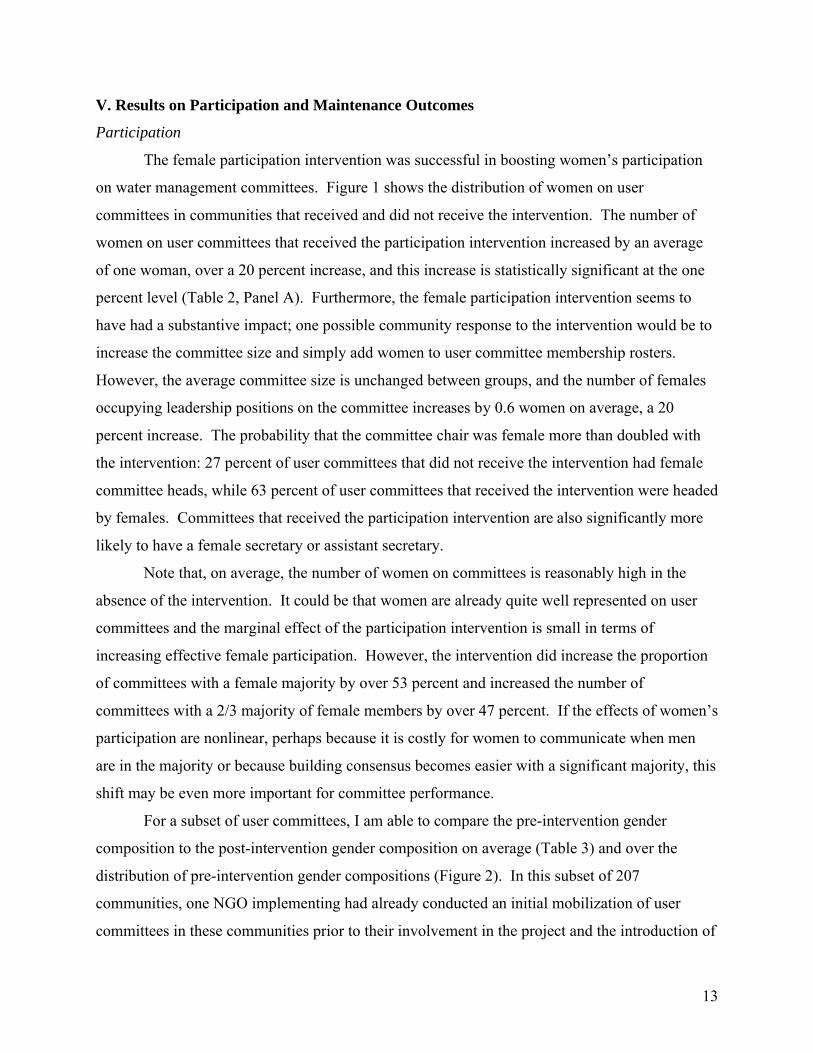
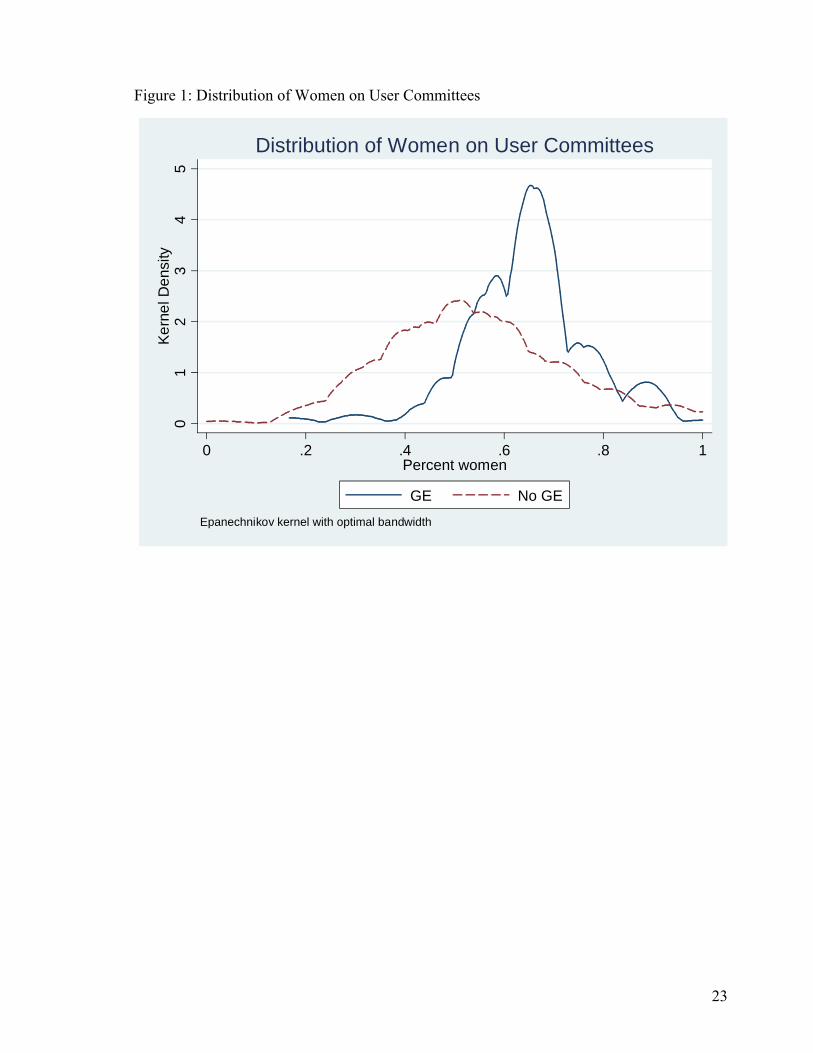
The female participation intervention was successful in boosting women’s participation
on water management committees. Figure 1 shows the distribution of women on user
committees in communities that received and did not receive the intervention. The number of
women on user committees that received the participation intervention increased by an average
of one woman, over a 20 percent increase, and this increase is statistically significant at the one
percent level (Table 2, Panel A). Furthermore, the female participation intervention seems to
have had a substantive impact; one possible community response to the intervention would be to
increase the committee size and simply add women to user committee membership rosters.
However, the average committee size is unchanged between groups, and the number of females
occupying leadership positions on the committee increases by 0.6 women on average, a 20
percent increase. The probability that the committee chair was female more than doubled with
the intervention: 27 percent of user committees that did not receive the intervention had female
committee heads, while 63 percent of user committees that received the intervention were headed
by females. Committees that received the participation intervention are also significantly more
likely to have a female secretary or assistant secretary.
Note that, on average, the number of women on committees is reasonably high in the
absence of the intervention. It could be that women are already quite well represented on user
committees and the marginal effect of the participation intervention is small in terms of
increasing effective female participation. However, the intervention did increase the proportion
of committees with a female majority by over 53 percent and increased the number of
committees with a 2/3 majority of female members by over 47 percent. If the effects of women’s
participation are nonlinear, perhaps because it is costly for women to communicate when men
are in the majority or because building consensus becomes easier with a significant majority, this
shift may be even more important for committee performance.
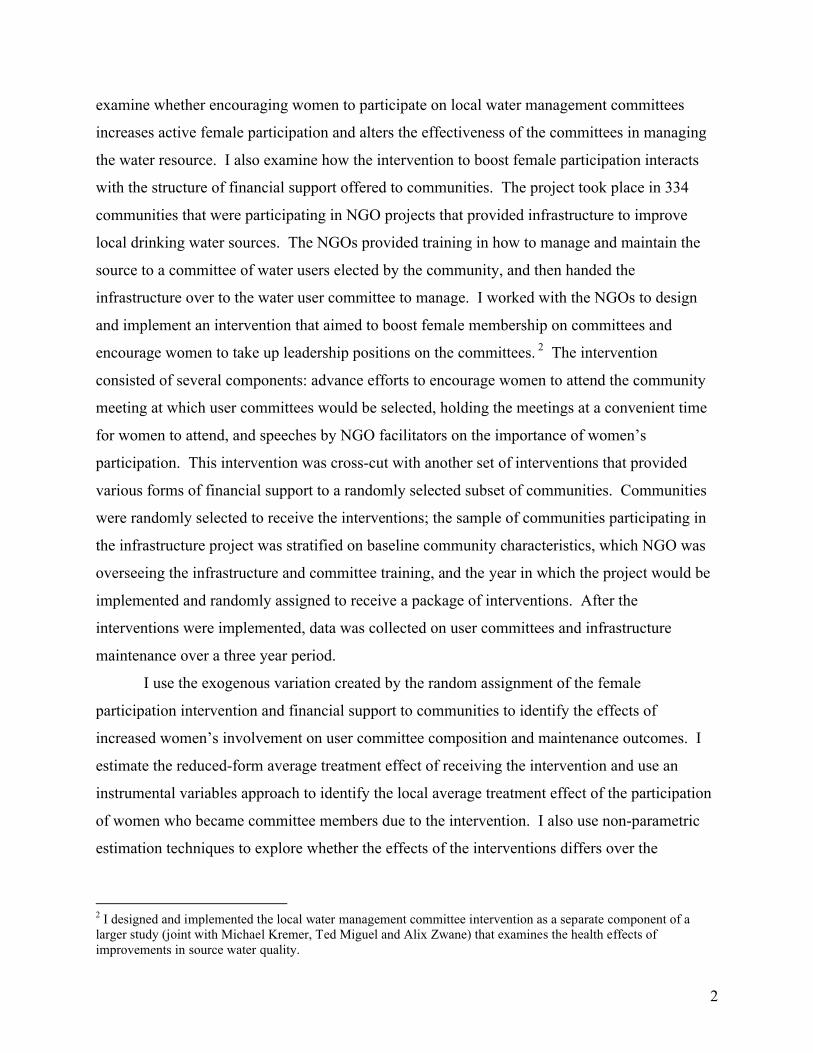
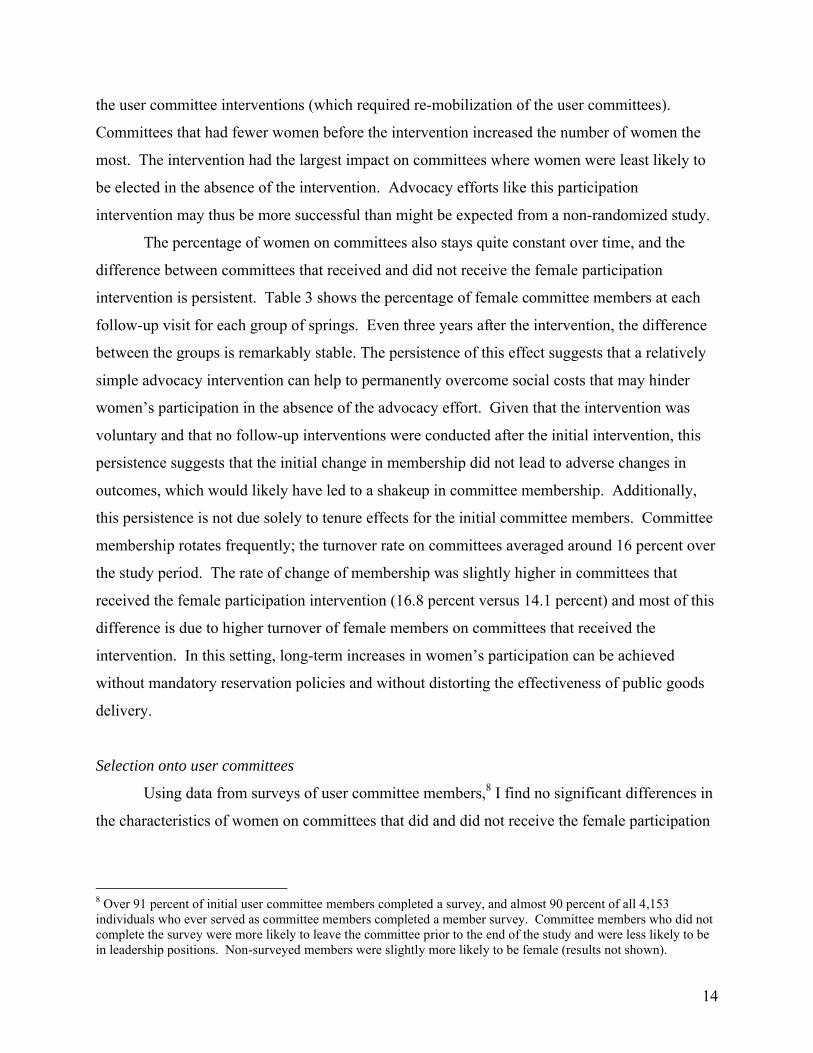
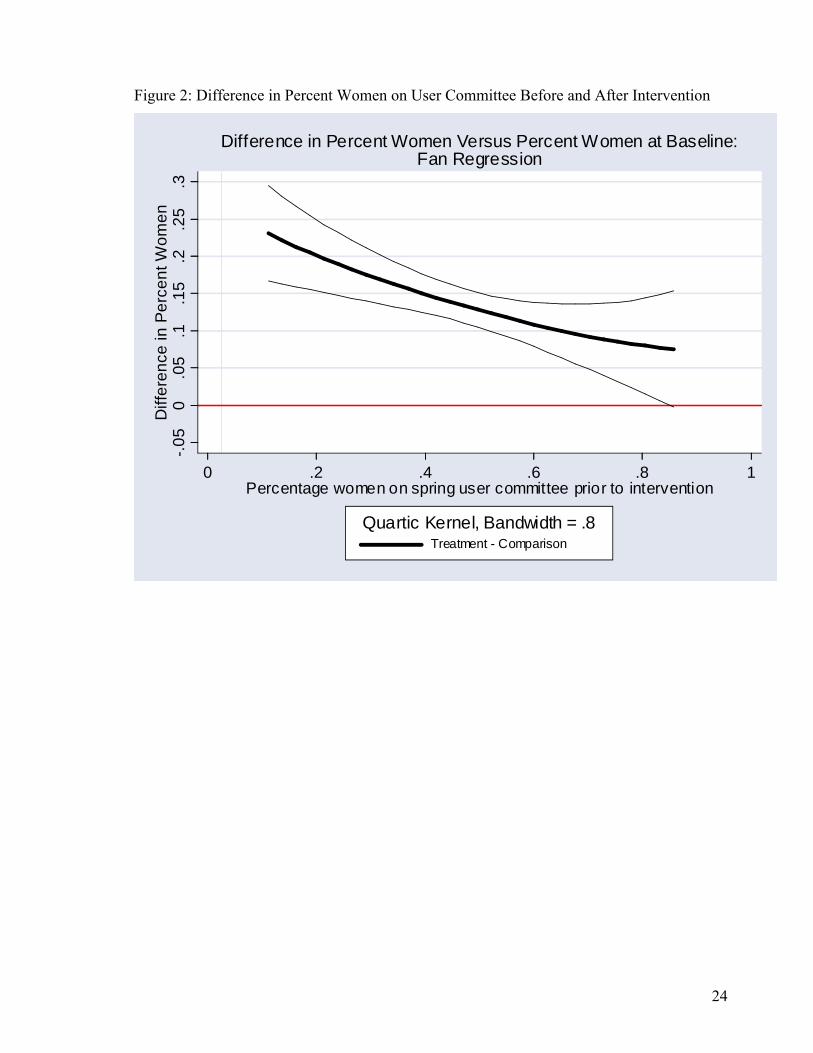
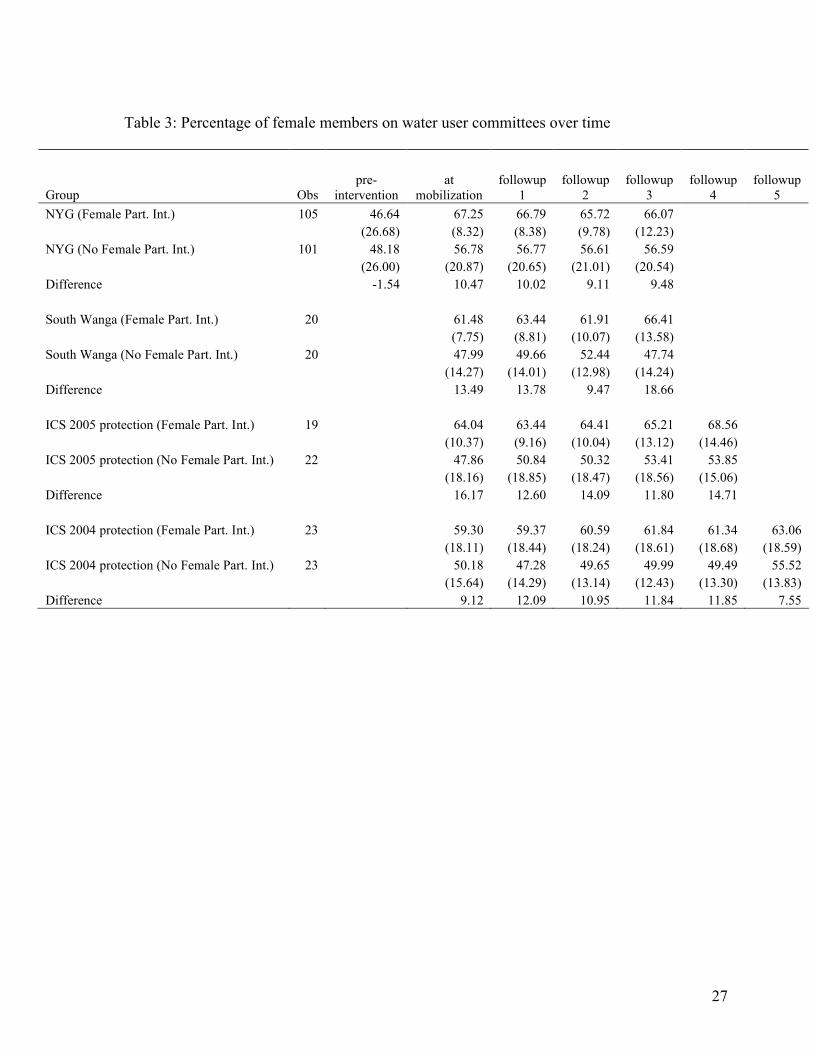
For a subset of user committees, I am able to compare the pre-intervention gender
composition to the post-intervention gender composition on average (Table 3) and over the
distribution of pre-intervention gender compositions (Figure 2). In this subset of 207
communities, one NGO implementing had already conducted an initial mobilization of user
committees in these communities prior to their involvement in the project and the introduction of
14
the user committee interventions (which required re-mobilization of the user committees).
Committees that had fewer women before the intervention increased the number of women the
most. The intervention had the largest impact on committees where women were least likely to
be elected in the absence of the intervention. Advocacy efforts like this participation
intervention may thus be more successful than might be expected from a non-randomized study.
The percentage of women on committees also stays quite constant over time, and the
difference between committees that received and did not receive the female participation
intervention is persistent. Table 3 shows the percentage of female committee members at each
follow-up visit for each group of springs. Even three years after the intervention, the difference
between the groups is remarkably stable. The persistence of this effect suggests that a relatively
simple advocacy intervention can help to permanently overcome social costs that may hinder
women’s participation in the absence of the advocacy effort. Given that the intervention was
voluntary and that no follow-up interventions were conducted after the initial intervention, this
persistence suggests that the initial change in membership did not lead to adverse changes in
outcomes, which would likely have led to a shakeup in committee membership. Additionally,
this persistence is not due solely to tenure effects for the initial committee members. Committee
membership rotates frequently; the turnover rate on committees averaged around 16 percent over
the study period. The rate of change of membership was slightly higher in committees that
received the female participation intervention (16.8 percent versus 14.1 percent) and most of this
difference is due to higher turnover of female members on committees that received the
intervention. In this setting, long-term increases in women’s participation can be achieved
without mandatory reservation policies and without distorting the effectiveness of public goods
delivery.
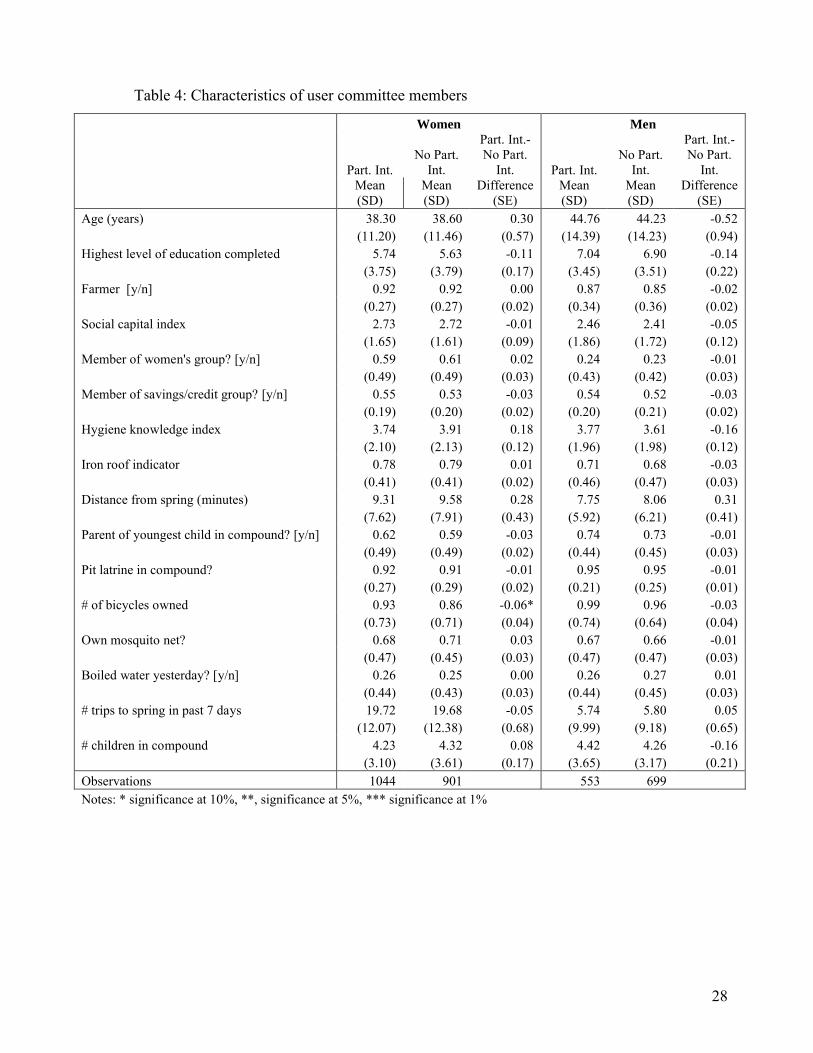
Selection onto user committees
Using data from surveys of user committee members,8 I find no significant differences in
the characteristics of women on committees that did and did not receive the female participation
8 Over 91 percent of initial user committee members completed a survey, and almost 90 percent of all 4,153individuals who ever served as committee members completed a member survey. Committee members who did not complete the survey were more likely to leave the committee prior to the end of the study and were less likely to be in leadership positions. Non-surveyed members were slightly more likely to be female (results not shown).
15
intervention (see Table 4).9 There are also no significant differences between the men on
committees that received and did not receive the intervention. The participation intervention did
not appear to encourage more educated women or women who had a better understanding of
hygiene behavior to join committees, nor did it appear to displace males who were better or
worse qualified than the average male. The lack of differential selection due to the female
participation intervention suggests that the quality of committee members does not appear to be
suffering as a result of the intervention. Further, because there is not differential selection any
effects of the intervention on committee performance can be attributed to the increased female
participation and not to other changes in committee composition.
In general, female committee members have 1.3 fewer years of education than male
members (5.6 versus 6.9 years) and are about six years younger (38 versus 44). Women report
making about three times as many trips to the water sources to collect water than do male
members (20 versus 7 trips in the past week), which is unsurprising given that water collection is
frequently viewed as women’s work in this region. Thus, committees that received the female
participation intervention have slightly lower mean education levels and slightly more existing
monitoring capabilities. Male and female members have similar levels of involvement in the
community (as measured by participation in other community activities) and have similar
knowledge of hygiene behaviors.
There are also very few differences in the characteristics of men and women members of
committees that received grant funding under the financing intervention or committees in
communities where maintenance was conducted by a private contractor (results not shown).
These results contrast with Kremer and Gugerty (2004), who find in their study of women’s
groups in Kenya that financial and other support for groups provided by an NGO program
changed the composition of the groups, drawing in younger and wealthier women who were
more likely to be employed in the formal sector. Perhaps there is less selection in this case
because funds made available to committees were publicly earmarked for a specific purpose
(spring maintenance) and there was less discretion over the use of the funds. In addition, the
funding amounts involved in this study were significantly smaller.
9 Results shown in Table 4 are for members initially selected to user committees, but results including members who joined committees later are very similar (results not shown).
16
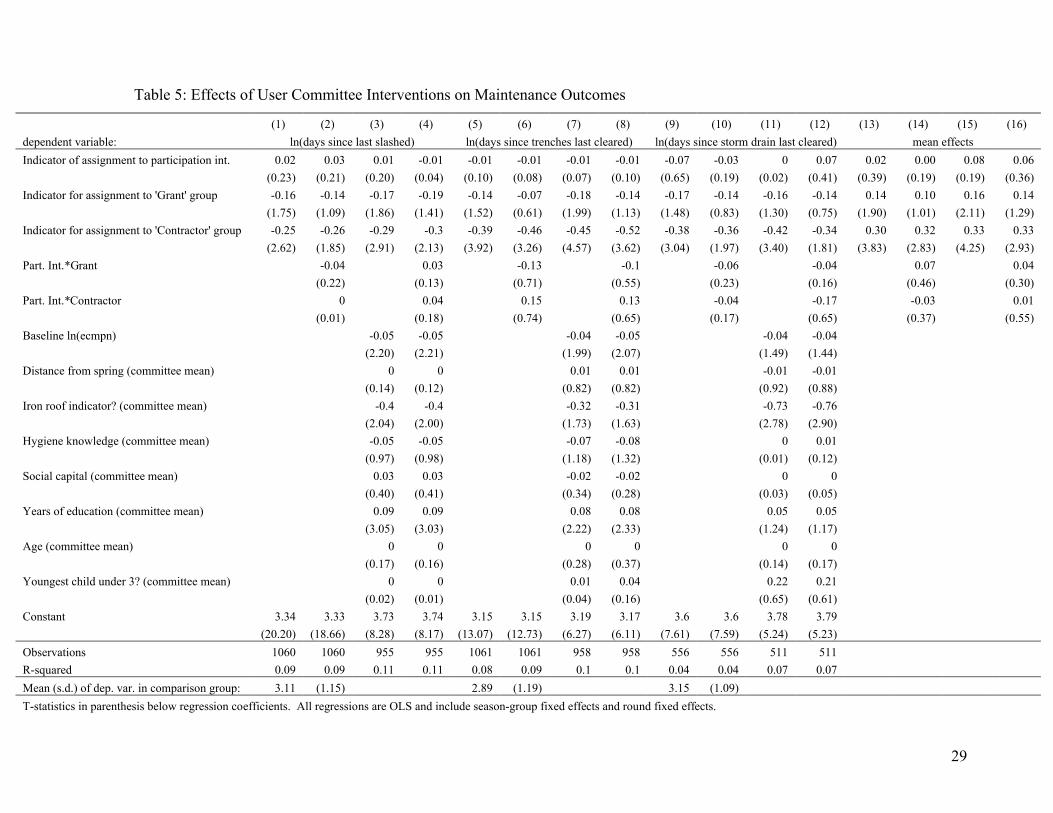
Maintenance outcome results
There is no significant effect on maintenance outcomes from receiving the female
participation intervention. Table 5 shows reduced form estimates for a basket of outcome
measures capturing the natural log of the time (measured in days) since a variety of maintenance
activities were last performed and the mean effect over all outcomes in the basket. The point
estimates on the indicator of assignment to the participation intervention are very close to zero in
all specifications, as are the mean effects. With 95 percent confidence, I can reject differences in
outcomes between committees that received and did not receive the intervention of more than
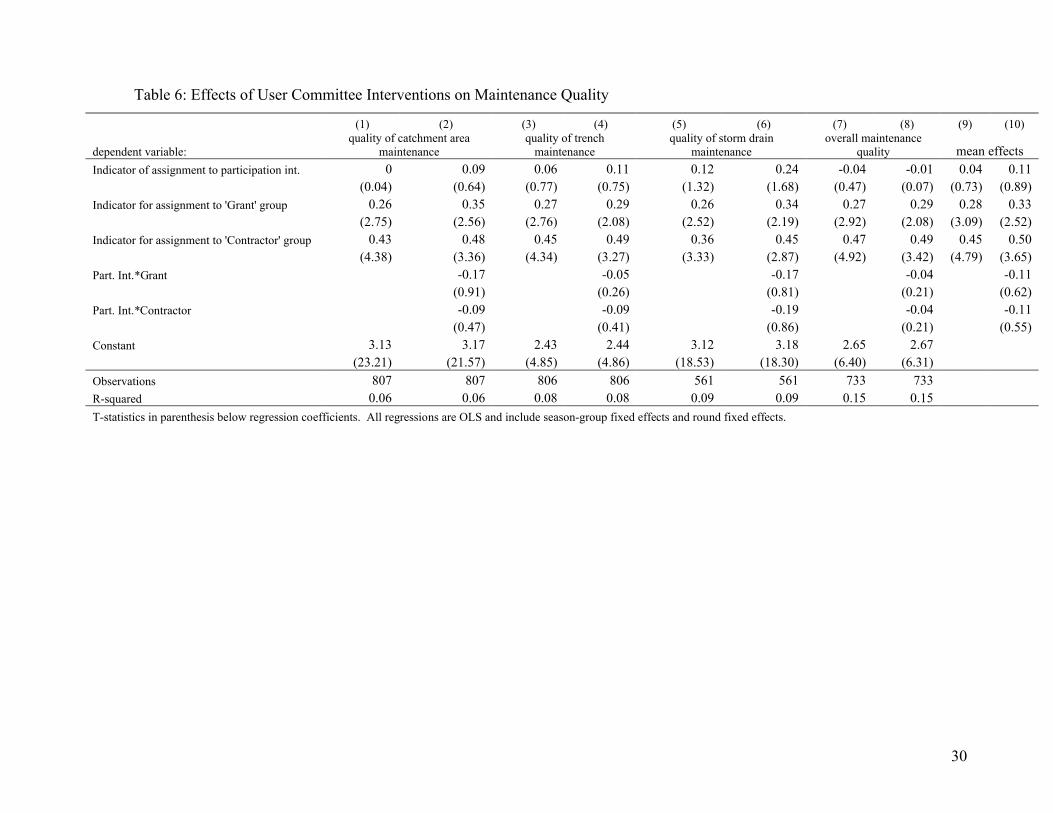
around eight percent (as measured at the mean for the comparison group).10 Table 6 shows the
results for outcome variables that quantify the quality of maintenance at the water source, as
measured on a scale from 1= very poor to 5= excellent. Once again, the point estimates on the
indicator of assignment to the female participation intervention are very close to zero, as are the
mean effects. With 95 percent confidence, I can reject differences in outcomes larger than about
five percent (as measured at the mean for the comparison group).
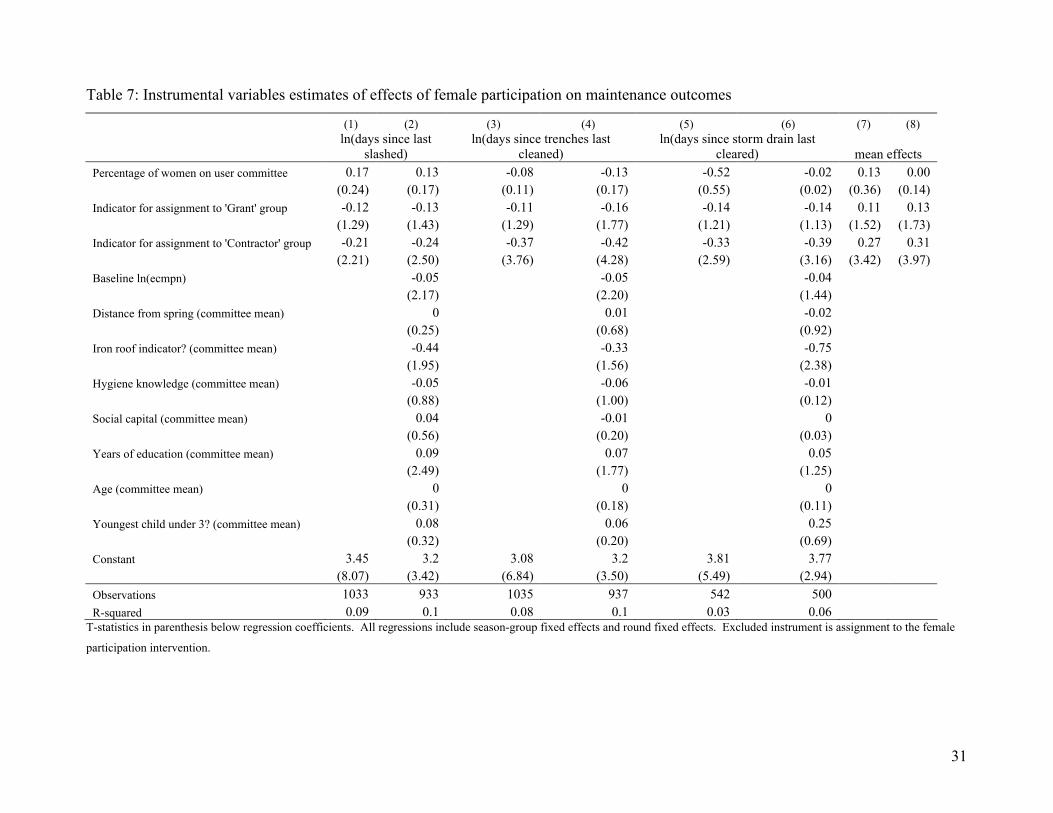
The instrumental variables estimates of the local average treatment effect of the
intervention also show no negative impacts of changes in participation induced by the
intervention (Table 7). As could be expected from Figure 1 and Table 3, the first stage result for
the effect of the female participation intervention on the percentage of women members on the
committee is strong (results not shown). However, the increase in the percentage of women on
the committee due to the participation intervention has no effect on a wide variety of
maintenance outcomes. The IV results are also very similar for committees that have female
chairs due to the intervention (results not shown). Thus, women who joined committees or took
on leadership positions due to the intervention do no worse at maintaining the spring than the
committee members they replaced, though they do not do better either. The results in Tables 5
through 7 imply that we are able to reject the null hypothesis that encouraging women to
participate more in managing community water sources leads to significant declines (or
increases) in maintenance quality. In this context, increasing women’s participation does not
distort the quality of public goods provision in communities.
10 Also note that there is significant variation in all outcome variables, even after accounting for seasonal variation (results not shown). The standard deviations of the outcome variables for the comparison group are shown in Table 5.
17
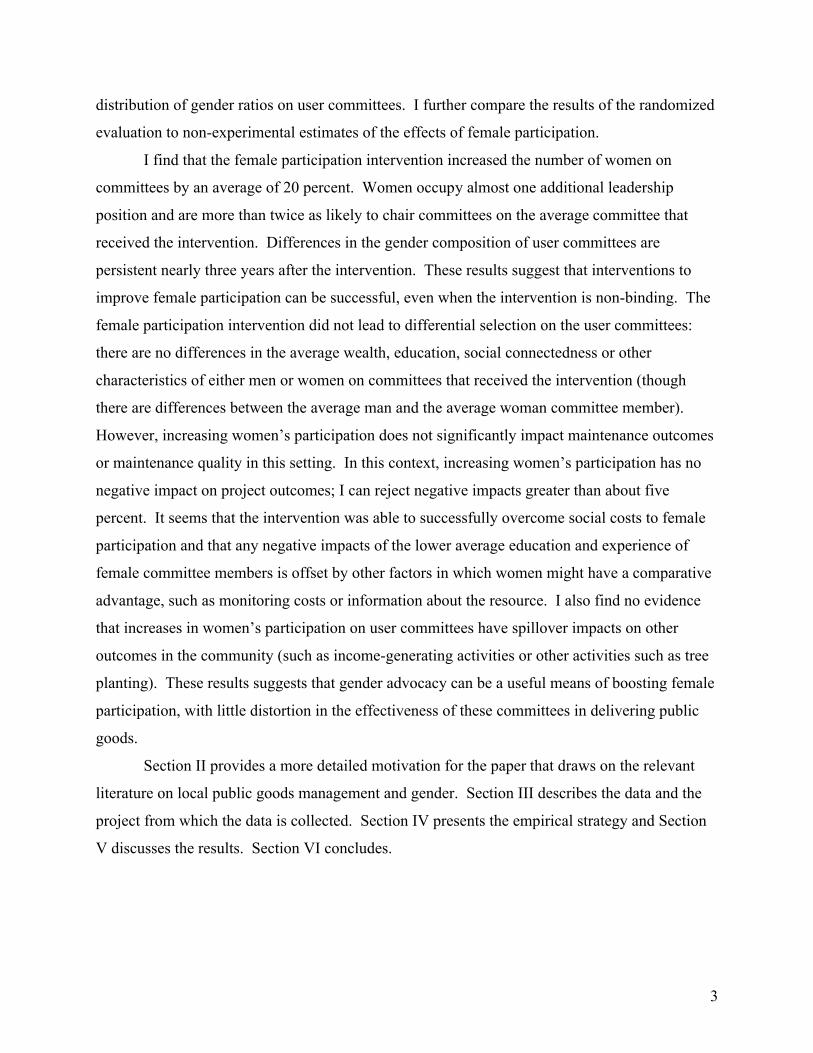
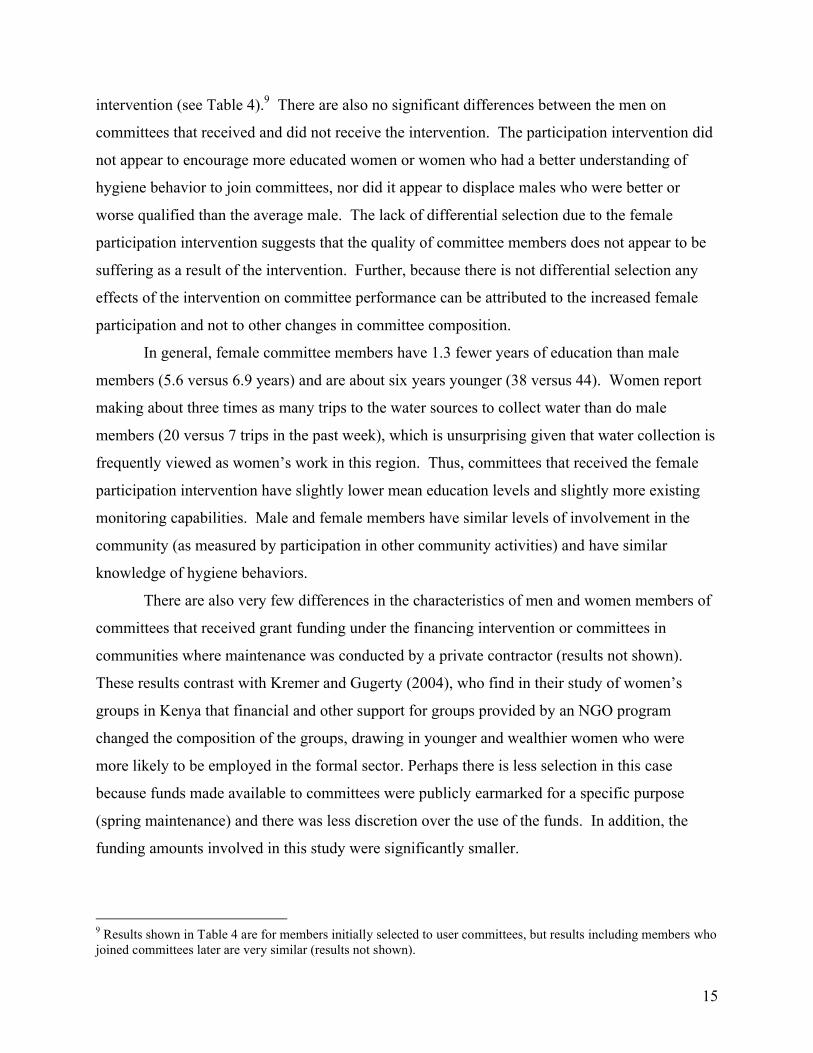
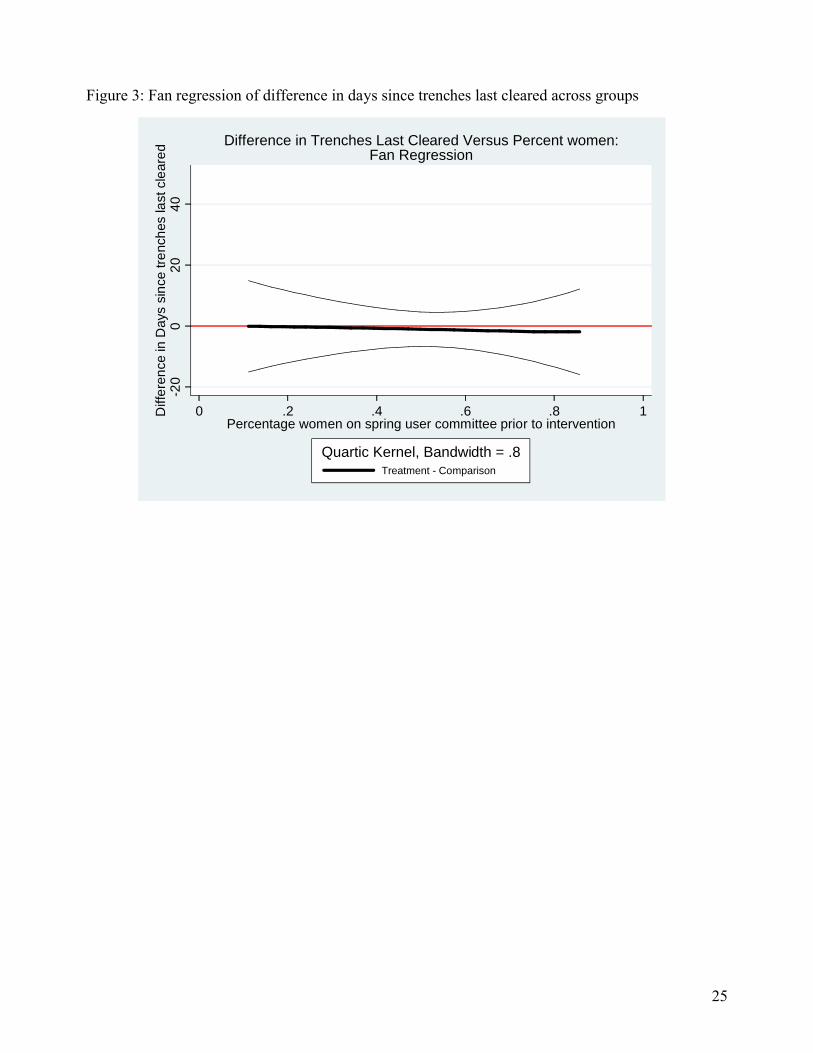
I also use non-parametric Fan regressions to examine whether the effects of these
interventions differs over the distribution of gender ratios on user committees. Figure 3 graphs
the difference in outcomes between committees that received the participation intervention and
committees that did not by pre-intervention gender composition, with bootstrapped standard
errors. There are not significant differences in outcomes for any part of the distribution, which
suggests that committees on which participation changed the most due to the intervention are
able to maintain the same level of effectiveness of public goods provision.
Financing interventions and interactions
It is useful to compare the results on maintenance outcomes from the female participation
intervention to the results of other user committee interventions to provide a benchmark for the
observed effect sizes. On average, there seems to be some improvement in maintenance
outcomes and maintenance quality at water sources where the committee received a grant. In
communities where private contractors were responsible for maintenance, there is a large and
significant impact on maintenance outcomes and maintenance quality (Tables 5 and 6).
However, this effect seems sensitive to monitoring effort; from January 2007, the implementing
NGOs began working with government water officers to monitor private contractors on a
monthly basis. In a specification in which round is interacted with assignment to the grant and
contractor groups to allow for differential effects over time, I find that outcomes improve
substantially in the last round of data collection after the increases in monitoring effort began
(results not shown).
Committees that were randomly selected to receive both the female participation
intervention and either the grant or the private contractor intervention did not perform
significantly differently. Conditional upon assignment to the gender and financing groups, there
is no differential effect of providing financial assistance to groups that received the participation
intervention. Thus, committees with higher female participation do as well on average at
managing resources and supervising workers as other committees.
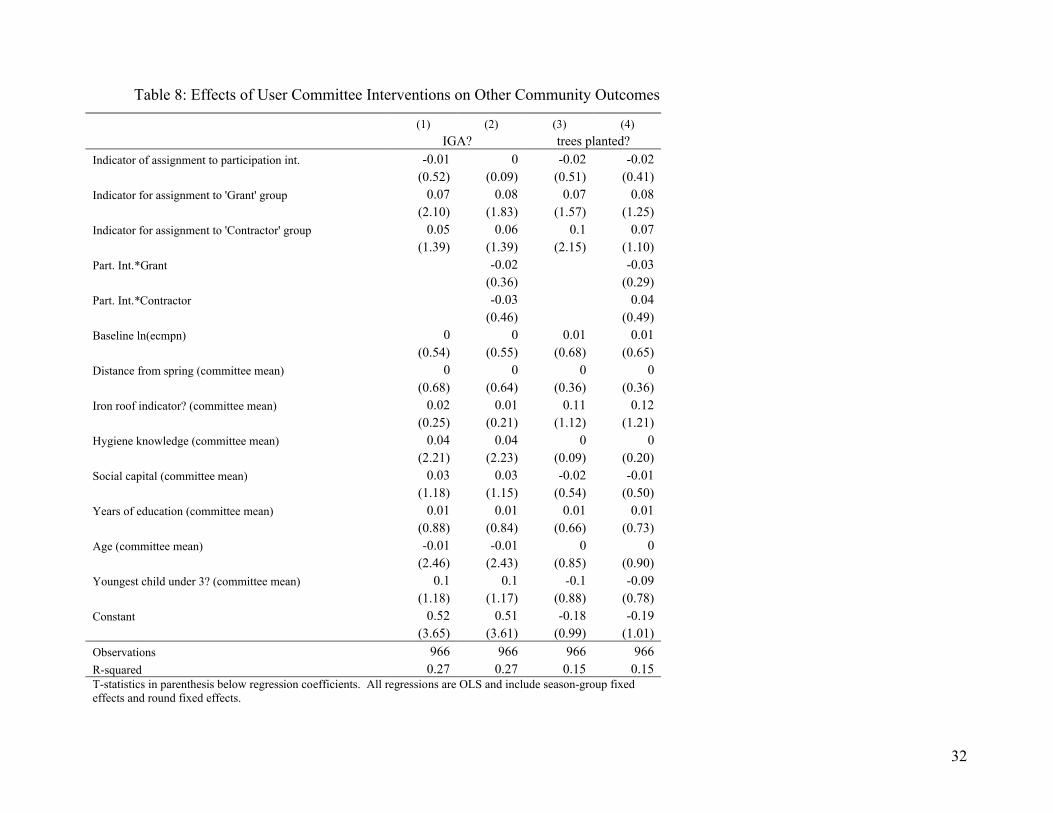
Community spillovers
Even though increasing female participation does not impact maintenance outcomes,
such advocacy efforts may have spillover effects elsewhere in the community, for instance due to
18
increased female leadership capacities. I can also use the exogenous variation in committee
membership generated by the female participation intervention to explore whether ‘social capital
externalities’ exist for participation on user committees. Externalities could occur at both the
individual level and for the community level.11 User committees are often springboards for other
economic activities: for instance, user committees may band together for income generating
activities (IGA) to cover maintenance expenses for the spring and distribute extra profits among
themselves, and user committees might also become rotating savings and credit associations
(ROSCAs). Membership on a user committee might thus bring access to additional income for
an individual. User committees might also perform a ‘bridging’ function, wherein committee
members gain access to either other committee members who are highly placed in society or to
outsiders (e.g., government representatives, local chiefs, etc.) with whom they might not have
come into contact in the absence of being a committee member. Such connections could
generate positive benefits to committee members such as leads on jobs or prestige. At the
community level, spring user committees might also assist with the development of other local
public goods. For instance, a committee could assist other groups with organizing a fundraiser
(called a harambee in Kiswahili) for improving a school compound.
I find no evidence that committees that received the participation intervention participate
in more income generating activities, or engage in more activities that are beneficial to the
community (such as tree planting). I do, however, find suggestive evidence that committees that
receive grants are more likely to engage in income generating activities, likely because they use
the grant money as startup funds for the activity (Table 8).12
VI. Discussion and Conclusions
Using data from a unique randomized evaluation of community-managed water projects,
I evaluate the effects of interventions to encourage female participation on user committees and
interventions to provide different forms of financial support for maintenance activities. I find
that encouraging women to take up management roles on user committees works to increase
11 Participating on local user committees may be quite costly for members, as they may involve a significant time commitment with no salary. The time commitment makes it less likely that community members with full time, formal sector employment will become committee members. However, if there are externality benefits that accrue to committee members, the costs of participation may be altered. 12 It is difficult to investigate effects of community participation on individual members at this time, as I only have individual-level data on committee members at the time they joined the committee.
19
women’s participation. To the extent that this is a desirable outcome in and of itself, the
intervention was successful. In this context, it is possible to increase women’s participation
without sacrificing the quality of project outcomes: there is no tradeoff in meeting the dual
objectives of increasing female participation and having well-managed local public goods.
Further, depending on the relative costs of men’s and women’s time and the quantities of time
needed, increased women’s participation may lead to greater social efficiency if the total cost of
time spent on management activities for local public goods is decreased for the same level of
management output. There is no evidence of spillovers to other areas of community
development from increased women’s participation. Gender advocacy can thus be a useful
means of increasing female participation, with little distortion in the effectiveness of these
committees in delivering public goods.
20
References
Agarwal, B. 2000. “Conceptualizing Environmental Collective Action: Why Gender Matters.” Cambridge Journal of Economics 24 (3): 283–310.
Alesina, Alberto and Eliana LaFerrara. 2000. “Participation in Heterogeneous Communities.” Quarterly Journal of Economics. Vol. 115, No. 3, pages 847-904.
Alesina, Alberto, and Eliana La Ferrara. (2005). “Ethnic diversity and economic performance,” Journal of Economic Literature.
Bardhan, Pranab. 2002. “Decentralization of Governance and Development.” The Journal of Economic Perspectives. Vol. 16, No. 4, pp. 185-206.
Bardhan, Pranab. 2000. “Irrigation and Cooperation: An Empirical Analysis of 48 Irrigation Communities in South India.” Economic Development and Cultural Change. Vol. 48, No. 4, pp. 847-865.
Bloom, Erik, et al. 2006. “Contracting for Health: Evidence from Cambodia.” Harvard University Working Paper.
Chattopadhyay, Raghabendra and Esther Duflo (2004), “Women as Policy Makers: Evidence from a Randomized Policy Experiment in India,” Econometrica 72(5): 1409-1443.
Dayton-Johnson, Jeff. 2000. “The determinants of collective action on the commons: A model with evidence from Mexico.” Journal of Development Economics. Vol. 62, pages 181-208.
Alesina, Alberto, and Eliana La Ferrara. (2004). “Ethnic diversity and economic performance,” Forthcoming, Journal of Economic Literature.
Duflo, Esther. 2005. “Why Political Reservations” Journal of the European Economic Association 3(2-3), pp. 668-678.
Duflo, Esther. 2003. “Grandmothers and Granddaughters: Old Age Pension and Intra-household Allocation in South Africa,” World Bank Economic Review 17(1), pp. 1-25.
Duflo, Esther and Raghabendra Chattopadhyay. “Women as Policy Makers: Evidence from a Randomized Policy Experiment in India,” Econometrica 72(5), 2004, pp. 1409-1443.
Duflo, Esther and Petia Topalova. 2005. “Unappreciated Services: Performance, Perceptions, and Women Leaders in India,” MIMEO, MIT.
Durlauf, S and M. Fafchamps. (2004). “Social Capital”, forthcoming in the Handbook of Economic Growth.
Eckel, Catherine C. and Philip J. Grossman. 1998. “Are Women less Selfish than Men? Evidence from Dictator Experiments” May. Economic Journal.
Fortmann, Louise and D. Rocheleau. 1985. “Women and Agroforestry: Four Myths and Three Case Studies.” Agroforestry Systems, 2: 253-272.
21
Geisler, Gisela. 1993. “Silences Speak Louder than Claims: Gender, Household and Agricultureal Development in Southern Africa.” World Development, 21(12): 1965-1980.
Gross, Bruce, Wijk, Christine van, & Mukherjee, Nilanjana (2001). Linking sustainability with demand, gender and poverty: A study in community-managed water supply projects in 15 countries. Washington, D.C.: World Bank Water and Sanitation Program.
Gugerty, Mary Kay and Michael Kremer. 2004. “The Rockefeller Effect.” Poverty Action Lab Working Paper.
Habyarimana, James, Macartan Humphreys, Daniel Posner, and Jeremy Weinstein. 2006. “Why Does Ethnic Diversity Undermine Public Goods Provision? An Experimental Approach.” University of California, Los Angeles. Mimeo.
INSTRAW-UN, (1990), “Women, water and sanitation,” in S. Sontheimer (Ed.), Women and the environment: A reader, New York, NY: Monthly Review Press, 119-132.
Isham, J. and S. Kahkonen (1999), “What determines the effectiveness of community-based water projects? Evidence from central Java, Indonesia on demand responsiveness, service rules, and social capital,” Social Capital Initiative Paper 14, World Bank, Environmentally and Socially Sustainable Development Network, Washington, DC.
Katz, Travis and Jennifer Sara. 1998. “Making Rural Water Supply Sustainable: Recommendations from a Global Study.” UNDP-World Bank Water and Sanitation Program. Available at: http://www.wsp.org/publications/global_ruralstudy.pdf.
Khwaja, Asim Ijaz. 2004a. “Can good projects succeed in bad communities? Collective Action in Public Good Provision.” Mimeo: Harvard University, Cambridge, MA.
Khwaja, Asim Ijaz. 2004b. “Is Increasing Community Participation Always a Good Thing?” Journal of the European Economic Association, Apr- May 2(2-3):427-436.
Kleemeier, E. (2000), “The impact of participation on sustainability: an analysis of the Malawi rural piped scheme program,” World Development, 28(5), 929-944.
Kremer, Michael and Edward Miguel. 2003. “The Illusion of Sustainability.” Mimeo: UC Berkeley, Berkeley, CA.
Lam, Wai Fung. (1998). Governing Irrigation Systems in Nepal: Institutions, Infrastructure and Collective Action, Oakland, California: ICS Press.
Mansuri, Ghazala, and Vijayendra Rao. 2004. “Community-Based and –Driven Development: A Critical Review.” The World Bank Research Observer, Vol. 19, No. 1.Miguel E., and M.K. Gugerty (2004), “Ethnic divisions, social sanctions, and public goods in Kenya,” Journal of Public Economics.
Narayan, Deepa (1995). The contribution of people.s participation: Evidence from 121 rural water supplyprojects. (Environmentally sustainable development occasional paper series No. 1). Washington, DC: World Bank.
22
Newman, John, Menno Pradhan, Laura B. Rawlings, Geert Ridder, Ramiro Coa, and Jose Luis Evia. 2002. “An Impact Evaluation of Education, Health, and Water Supply Investments by the Bolivian Social Investment Fund.” World Bank Economic Review, 16: 241-274.
Nowell, Clifford and Sarah Tinkler, 1994, The Influence of Gender on the Provision of a Public Good, Journal of Economic Behavior and Organization 25, 25-36.
Pandolfelli, Laura, Stephan Dohrn, and Ruth Meinzen-Dick. 2007. “Gender and Collective Action: Policy Implications from Recent Research.” Policy Brief Number 5, January. www.capri.cgiar.org.
Prokopy, L.S. (2004), “Women’s participation in rural water supply projects in India: Is it moving beyond tokenism and does it matter?” Water Policy 6(2), 103-116.
Robinson, P. M. (1988). “Root -consistent semiparametric regression”, Econometrica 56: 931-954.
Solow, John L. and Nicole Kirkwood. 2002. “Group Identity and Gender in Public Goods Experiments,” Journal of Economic Behavior and Organization 48, pp. 403-412.
Stonich, Susan C. 1989. “The Dynamics of Social Processes and Environmental Destruction: A Central American Case Study.” Population and Development Review, 15(2): 269-296.
Thomas-Slayter B., G Sodikoof and E. Reynolds. 1996. Gender, Equity and Effective Resource management in Africa. ECOGEN Project. Worcester: Clark University.
Thomas-Slayter, B. and D. Rocheleau 1995. Gender, Environment and Development in Kenya: A Grassroots Perspective. Boulder: Lynne Reinner. Van Wijk, C. and Garcia, M. (2002). Having it both ways: Local participatory learning informing global policy and programme management. In C. Leeuwis and R. Pyburn, eds. Wheelbarrows full of frogs: Social learning in rural resource management. Assen: Koninklijke van Gorcum BV, p. 271-288
Van Wijk, Christine (1998). Gender in water resources management, water supply and sanitation: Roles and realities revisited. Technical paper No. 33-E). The Hague: IRC International Water and Sanitation Centre.
Vigdor, Jacob. (2004). “Community Composition and Collective Action: Analyzing Initial MailResponse to the 2000 Census”, Review of Economics and Statistics, 86(1), 303-312.
Wade, Robert. (1987). Village Republics: Economic Conditions for Collective Action in South India, Cambridge, U.K: Cambridge University Press.
World Bank. 2002. Water, Sanitation and Gender Equality. Gender and Development Briefing Notes, Gender and Development Group. Washington, DC: World Bank.
World Bank. 2003. Gender Equality and the Millennium Development Goals. Washington, DC: World Bank.
World Bank. 2004. World Development Report: Making services work for poor people. Washington, DC: World Bank.
World Bank. 2007. Gender: Working Towards Greater Equality. Washington, DC: World Bank.
23
Figure 1: Distribution of Women on User Committees
01
23
45
Ke
rne
l De
nsity
0 .2 .4 .6 .8 1Percent women
GE No GE
Epanechnikov kernel with optimal bandwidth
Distribution of Women on User Committees
24
Figure 2: Difference in Percent Women on User Committee Before and After Intervention
-.0
50
.05
.1.1
5.2
.25
.3D
iffe
ren
ce in
Pe
rce
nt
Wo
me
n
0 .2 .4 .6 .8 1Percentage women on spring user committee prior to intervention
Treatment - Comparison
Quartic Kernel, Bandwidth = .8
Difference in Percent Women Versus Percent Women at Baseline:Fan Regression
25
Figure 3: Fan regression of difference in days since trenches last cleared across groups
-20
02
04
0D
iffe
ren
ce in
Day
s si
nce
tre
nch
es la
st c
lear
ed
0 .2 .4 .6 .8 1Percentage women on spring user committee prior to intervention
Treatment - Comparison
Quartic Kernel, Bandwidth = .8
Difference in Trenches Last Cleared Versus Percent women:Fan Regression
26
Table 1: Sample Sizes for Interventions
Grant Private Contractor No Financial Support TotalFemale Participation Intervention 58 54 56 168No Female Participation Intervention 55 54 57 166Total 113 108 113 334
Table 2: User Committee Summary Statistics
Female participation intervention
No Female participation intervention Difference
mean (sd)
# obs mean (sd)
# obs
(Int.-No Int.)
Panel A: Committee characteristicsNumber of people on committee 9.18 164 9.18 164 0.00
(0.59) (0.60) [0.065]Number of women on committee 5.99 164 4.91 164 1.08
(1.06) (1.79) [0.162]***% women on committee 0.65 164 0.54 164 0.12
(0.11) (0.19) [0.017]***Chair female 0.63 164 0.27 164 0.36
(0.48) (0.44) [0.051]***Vice chair female 0.53 156 0.56 156 -0.03
(0.50) (0.50) [0.057]Secretary female 0.62 164 0.48 164 0.15
(0.49) (0.50) [0.055]***Treasurer female 0.76 164 0.74 164 0.02
(0.43) (0.44) [0.048]Ass't secretary female 0.78 153 0.67 157 0.12
(0.41) (0.47) [0.050]**Number of leadership positions filled 5.34 164 5.39 164 -0.05
(0.69) (0.68) [0.075]Number of female leaders 3.58 164 2.99 164 0.59
(1.12) (1.41) [0.141]***% women leaders 0.67 164 0.55 164 0.12
(0.19) (0.25) [0.025]***Panel B: Baseline characteristics
baseline E. Coli counts (MPN) 115 134 153 134 (38)(297) (364) [40.6]
baseline total coliform counts (MPN) 1689 134 1704 134 (15)(853) (825) [102]
Number of households that use spring 24.06 139 24.40 137 -0.34(14.79) (11.57) [1.600]
Distance (m) to nearest tarmac road 531.31 139 468.04 137 63.27(780.85) (785.05) [94.26]
total community contribution 8439.05 166 9798.45 163 -1359.40(4521.99) (14342.15) [1,168]
27
Table 3: Percentage of female members on water user committees over time
Group Obspre-
interventionat
mobilizationfollowup
1followup
2followup
3followup
4followup
5
NYG (Female Part. Int.) 105 46.64 67.25 66.79 65.72 66.07(26.68) (8.32) (8.38) (9.78) (12.23)
NYG (No Female Part. Int.) 101 48.18 56.78 56.77 56.61 56.59(26.00) (20.87) (20.65) (21.01) (20.54)
Difference -1.54 10.47 10.02 9.11 9.48
South Wanga (Female Part. Int.) 20 61.48 63.44 61.91 66.41 (7.75) (8.81) (10.07) (13.58)
South Wanga (No Female Part. Int.) 20 47.99 49.66 52.44 47.74 (14.27) (14.01) (12.98) (14.24)
Difference 13.49 13.78 9.47 18.66
ICS 2005 protection (Female Part. Int.) 19 64.04 63.44 64.41 65.21 68.56 (10.37) (9.16) (10.04) (13.12) (14.46)
ICS 2005 protection (No Female Part. Int.) 22 47.86 50.84 50.32 53.41 53.85 (18.16) (18.85) (18.47) (18.56) (15.06)
Difference 16.17 12.60 14.09 11.80 14.71
ICS 2004 protection (Female Part. Int.) 23 59.30 59.37 60.59 61.84 61.34 63.06 (18.11) (18.44) (18.24) (18.61) (18.68) (18.59)
ICS 2004 protection (No Female Part. Int.) 23 50.18 47.28 49.65 49.99 49.49 55.52 (15.64) (14.29) (13.14) (12.43) (13.30) (13.83)
Difference 9.12 12.09 10.95 11.84 11.85 7.55
28
Table 4: Characteristics of user committee members
Women Men
Part. Int.No Part.
Int.
Part. Int.-No Part.
Int. Part. Int.No Part.
Int.
Part. Int.-No Part.
Int.Mean (SD)
Mean (SD)
Difference(SE)
Mean (SD)
Mean (SD)
Difference(SE)
Age (years) 38.30 38.60 0.30 44.76 44.23 -0.52(11.20) (11.46) (0.57) (14.39) (14.23) (0.94)
Highest level of education completed 5.74 5.63 -0.11 7.04 6.90 -0.14(3.75) (3.79) (0.17) (3.45) (3.51) (0.22)
Farmer [y/n] 0.92 0.92 0.00 0.87 0.85 -0.02(0.27) (0.27) (0.02) (0.34) (0.36) (0.02)
Social capital index 2.73 2.72 -0.01 2.46 2.41 -0.05(1.65) (1.61) (0.09) (1.86) (1.72) (0.12)
Member of women's group? [y/n] 0.59 0.61 0.02 0.24 0.23 -0.01(0.49) (0.49) (0.03) (0.43) (0.42) (0.03)
Member of savings/credit group? [y/n] 0.55 0.53 -0.03 0.54 0.52 -0.03(0.19) (0.20) (0.02) (0.20) (0.21) (0.02)
Hygiene knowledge index 3.74 3.91 0.18 3.77 3.61 -0.16(2.10) (2.13) (0.12) (1.96) (1.98) (0.12)
Iron roof indicator 0.78 0.79 0.01 0.71 0.68 -0.03(0.41) (0.41) (0.02) (0.46) (0.47) (0.03)
Distance from spring (minutes) 9.31 9.58 0.28 7.75 8.06 0.31(7.62) (7.91) (0.43) (5.92) (6.21) (0.41)
Parent of youngest child in compound? [y/n] 0.62 0.59 -0.03 0.74 0.73 -0.01(0.49) (0.49) (0.02) (0.44) (0.45) (0.03)
Pit latrine in compound? 0.92 0.91 -0.01 0.95 0.95 -0.01(0.27) (0.29) (0.02) (0.21) (0.25) (0.01)
# of bicycles owned 0.93 0.86 -0.06* 0.99 0.96 -0.03(0.73) (0.71) (0.04) (0.74) (0.64) (0.04)
Own mosquito net? 0.68 0.71 0.03 0.67 0.66 -0.01(0.47) (0.45) (0.03) (0.47) (0.47) (0.03)
Boiled water yesterday? [y/n] 0.26 0.25 0.00 0.26 0.27 0.01(0.44) (0.43) (0.03) (0.44) (0.45) (0.03)
# trips to spring in past 7 days 19.72 19.68 -0.05 5.74 5.80 0.05(12.07) (12.38) (0.68) (9.99) (9.18) (0.65)
# children in compound 4.23 4.32 0.08 4.42 4.26 -0.16(3.10) (3.61) (0.17) (3.65) (3.17) (0.21)
Observations 1044 901 553 699Notes: * significance at 10%, **, significance at 5%, *** significance at 1%
29
Table 5: Effects of User Committee Interventions on Maintenance Outcomes
(1) (2) (3) (4) (5) (6) (7) (8) (9) (10) (11) (12) (13) (14) (15) (16)
dependent variable: ln(days since last slashed) ln(days since trenches last cleared) ln(days since storm drain last cleared) mean effects
Indicator of assignment to participation int. 0.02 0.03 0.01 -0.01 -0.01 -0.01 -0.01 -0.01 -0.07 -0.03 0 0.07 0.02 0.00 0.08 0.06
(0.23) (0.21) (0.20) (0.04) (0.10) (0.08) (0.07) (0.10) (0.65) (0.19) (0.02) (0.41) (0.39) (0.19) (0.19) (0.36)
Indicator for assignment to 'Grant' group -0.16 -0.14 -0.17 -0.19 -0.14 -0.07 -0.18 -0.14 -0.17 -0.14 -0.16 -0.14 0.14 0.10 0.16 0.14
(1.75) (1.09) (1.86) (1.41) (1.52) (0.61) (1.99) (1.13) (1.48) (0.83) (1.30) (0.75) (1.90) (1.01) (2.11) (1.29)
Indicator for assignment to 'Contractor' group -0.25 -0.26 -0.29 -0.3 -0.39 -0.46 -0.45 -0.52 -0.38 -0.36 -0.42 -0.34 0.30 0.32 0.33 0.33
(2.62) (1.85) (2.91) (2.13) (3.92) (3.26) (4.57) (3.62) (3.04) (1.97) (3.40) (1.81) (3.83) (2.83) (4.25) (2.93)
Part. Int.*Grant -0.04 0.03 -0.13 -0.1 -0.06 -0.04 0.07 0.04
(0.22) (0.13) (0.71) (0.55) (0.23) (0.16) (0.46) (0.30)
Part. Int.*Contractor 0 0.04 0.15 0.13 -0.04 -0.17 -0.03 0.01
(0.01) (0.18) (0.74) (0.65) (0.17) (0.65) (0.37) (0.55)
Baseline ln(ecmpn) -0.05 -0.05 -0.04 -0.05 -0.04 -0.04
(2.20) (2.21) (1.99) (2.07) (1.49) (1.44)
Distance from spring (committee mean) 0 0 0.01 0.01 -0.01 -0.01
(0.14) (0.12) (0.82) (0.82) (0.92) (0.88)
Iron roof indicator? (committee mean) -0.4 -0.4 -0.32 -0.31 -0.73 -0.76
(2.04) (2.00) (1.73) (1.63) (2.78) (2.90)
Hygiene knowledge (committee mean) -0.05 -0.05 -0.07 -0.08 0 0.01
(0.97) (0.98) (1.18) (1.32) (0.01) (0.12)
Social capital (committee mean) 0.03 0.03 -0.02 -0.02 0 0
(0.40) (0.41) (0.34) (0.28) (0.03) (0.05)
Years of education (committee mean) 0.09 0.09 0.08 0.08 0.05 0.05
(3.05) (3.03) (2.22) (2.33) (1.24) (1.17)
Age (committee mean) 0 0 0 0 0 0
(0.17) (0.16) (0.28) (0.37) (0.14) (0.17)
Youngest child under 3? (committee mean) 0 0 0.01 0.04 0.22 0.21
(0.02) (0.01) (0.04) (0.16) (0.65) (0.61)
Constant 3.34 3.33 3.73 3.74 3.15 3.15 3.19 3.17 3.6 3.6 3.78 3.79
(20.20) (18.66) (8.28) (8.17) (13.07) (12.73) (6.27) (6.11) (7.61) (7.59) (5.24) (5.23)
Observations 1060 1060 955 955 1061 1061 958 958 556 556 511 511
R-squared 0.09 0.09 0.11 0.11 0.08 0.09 0.1 0.1 0.04 0.04 0.07 0.07
Mean (s.d.) of dep. var. in comparison group: 3.11 (1.15) 2.89 (1.19) 3.15 (1.09)
T-statistics in parenthesis below regression coefficients. All regressions are OLS and include season-group fixed effects and round fixed effects.
30
Table 6: Effects of User Committee Interventions on Maintenance Quality
(1) (2) (3) (4) (5) (6) (7) (8) (9) (10)
dependent variable:quality of catchment area
maintenancequality of trench
maintenancequality of storm drain
maintenanceoverall maintenance
quality mean effects
Indicator of assignment to participation int. 0 0.09 0.06 0.11 0.12 0.24 -0.04 -0.01 0.04 0.11(0.04) (0.64) (0.77) (0.75) (1.32) (1.68) (0.47) (0.07) (0.73) (0.89)
Indicator for assignment to 'Grant' group 0.26 0.35 0.27 0.29 0.26 0.34 0.27 0.29 0.28 0.33(2.75) (2.56) (2.76) (2.08) (2.52) (2.19) (2.92) (2.08) (3.09) (2.52)
Indicator for assignment to 'Contractor' group 0.43 0.48 0.45 0.49 0.36 0.45 0.47 0.49 0.45 0.50(4.38) (3.36) (4.34) (3.27) (3.33) (2.87) (4.92) (3.42) (4.79) (3.65)
Part. Int.*Grant -0.17 -0.05 -0.17 -0.04 -0.11(0.91) (0.26) (0.81) (0.21) (0.62)
Part. Int.*Contractor -0.09 -0.09 -0.19 -0.04 -0.11(0.47) (0.41) (0.86) (0.21) (0.55)
Constant 3.13 3.17 2.43 2.44 3.12 3.18 2.65 2.67(23.21) (21.57) (4.85) (4.86) (18.53) (18.30) (6.40) (6.31)
Observations 807 807 806 806 561 561 733 733R-squared 0.06 0.06 0.08 0.08 0.09 0.09 0.15 0.15
T-statistics in parenthesis below regression coefficients. All regressions are OLS and include season-group fixed effects and round fixed effects.
31
Table 7: Instrumental variables estimates of effects of female participation on maintenance outcomes
(1) (2) (3) (4) (5) (6) (7) (8)ln(days since last
slashed)ln(days since trenches last
cleaned)ln(days since storm drain last
cleared) mean effects
Percentage of women on user committee 0.17 0.13 -0.08 -0.13 -0.52 -0.02 0.13 0.00(0.24) (0.17) (0.11) (0.17) (0.55) (0.02) (0.36) (0.14)
Indicator for assignment to 'Grant' group -0.12 -0.13 -0.11 -0.16 -0.14 -0.14 0.11 0.13(1.29) (1.43) (1.29) (1.77) (1.21) (1.13) (1.52) (1.73)
Indicator for assignment to 'Contractor' group -0.21 -0.24 -0.37 -0.42 -0.33 -0.39 0.27 0.31(2.21) (2.50) (3.76) (4.28) (2.59) (3.16) (3.42) (3.97)
Baseline ln(ecmpn) -0.05 -0.05 -0.04(2.17) (2.20) (1.44)
Distance from spring (committee mean) 0 0.01 -0.02(0.25) (0.68) (0.92)
Iron roof indicator? (committee mean) -0.44 -0.33 -0.75(1.95) (1.56) (2.38)
Hygiene knowledge (committee mean) -0.05 -0.06 -0.01(0.88) (1.00) (0.12)
Social capital (committee mean) 0.04 -0.01 0(0.56) (0.20) (0.03)
Years of education (committee mean) 0.09 0.07 0.05(2.49) (1.77) (1.25)
Age (committee mean) 0 0 0(0.31) (0.18) (0.11)
Youngest child under 3? (committee mean) 0.08 0.06 0.25(0.32) (0.20) (0.69)
Constant 3.45 3.2 3.08 3.2 3.81 3.77(8.07) (3.42) (6.84) (3.50) (5.49) (2.94)
Observations 1033 933 1035 937 542 500R-squared 0.09 0.1 0.08 0.1 0.03 0.06
T-statistics in parenthesis below regression coefficients. All regressions include season-group fixed effects and round fixed effects. Excluded instrument is assignment to the female
participation intervention.
32
Table 8: Effects of User Committee Interventions on Other Community Outcomes
(1) (2) (3) (4)
IGA? trees planted?
Indicator of assignment to participation int. -0.01 0 -0.02 -0.02(0.52) (0.09) (0.51) (0.41)
Indicator for assignment to 'Grant' group 0.07 0.08 0.07 0.08(2.10) (1.83) (1.57) (1.25)
Indicator for assignment to 'Contractor' group 0.05 0.06 0.1 0.07(1.39) (1.39) (2.15) (1.10)
Part. Int.*Grant -0.02 -0.03(0.36) (0.29)
Part. Int.*Contractor -0.03 0.04(0.46) (0.49)
Baseline ln(ecmpn) 0 0 0.01 0.01(0.54) (0.55) (0.68) (0.65)
Distance from spring (committee mean) 0 0 0 0(0.68) (0.64) (0.36) (0.36)
Iron roof indicator? (committee mean) 0.02 0.01 0.11 0.12(0.25) (0.21) (1.12) (1.21)
Hygiene knowledge (committee mean) 0.04 0.04 0 0(2.21) (2.23) (0.09) (0.20)
Social capital (committee mean) 0.03 0.03 -0.02 -0.01(1.18) (1.15) (0.54) (0.50)
Years of education (committee mean) 0.01 0.01 0.01 0.01(0.88) (0.84) (0.66) (0.73)
Age (committee mean) -0.01 -0.01 0 0(2.46) (2.43) (0.85) (0.90)
Youngest child under 3? (committee mean) 0.1 0.1 -0.1 -0.09(1.18) (1.17) (0.88) (0.78)
Constant 0.52 0.51 -0.18 -0.19(3.65) (3.61) (0.99) (1.01)
Observations 966 966 966 966R-squared 0.27 0.27 0.15 0.15T-statistics in parenthesis below regression coefficients. All regressions are OLS and include season-group fixed effects and round fixed effects.