Embed Size (px)
Citation preview
Running Head: Attitudes and Personality Correlates
Gender and Personality Correlates Influence on Attitudes towards the Elderly in Indigenous
People
Nakita-Rose Morrisseau
Undergraduate Honours Thesis
Laurentian University
Running Head: Attitudes and Personality Correlates 2
Acknowledgements
First and foremost, I would like to thank Dr. Paul Valliant for the all the supervision and
support throughout the entire process. Thank you for always taking the time to edit presentations,
to hear my ideas out and add any input when necessary. I would also like to thank Sarah
Mansfield-Green for all the encouragement and guidance in times of stress and always answering
my questions no matter how busy you were. A special thank you goes to Mona-Rose Morrisseau
and Adam Ali because of you two data collection would not have been as successful as it was.
And finally I would like to thank the community members of Couchiching First Nation for
taking time out to complete the testing package, Gitchi-Miigwetch.
Running Head: Attitudes and Personality Correlates 3
Table of Contents
Abstract ........................................................................................................................................... 5
Gender and Personality Correlates Influence on Attitudes towards the Elderly in Indigenous
People .............................................................................................................................................. 6
Gender and Attitudes Towards the Elderly ................................................................................ 7
Cross-Cultural Perspective on Attitudes Towards the Elderly.................................................... 7
Aboriginal ancestry and attitudes towards the Elderly................................................................ 8
Personality Profiles and Attitudes Towards the Elderly ............................................................. 9
Present Study .................................................................................................................................. 9
Purpose ........................................................................................................................................ 9
Methods......................................................................................................................................... 10
Participants ................................................................................................................................ 10
Procedure ...................................................................................................................................... 10
Participants ................................................................................................................................ 10
Measures.................................................................................................................................... 11
Kogan’s attitudes towards old people scale ........................................................................... 11
Cattell’s 16 Personality Factor .............................................................................................. 12
Results ........................................................................................................................................... 12
General Attitudes Towards the Elderly ..................................................................................... 12
Gender Differences in Indigenous Attitudes towards the Elderly ............................................. 13

Running Head: Attitudes and Personality Correlates 4
Step-wise Multiple regression of 16 PF factors and Kogan’s Total Scores .............................. 13
Kogan’s Total and 16 PF correlations ....................................................................................... 13
Discussion ..................................................................................................................................... 14
References ..................................................................................................................................... 17
Running Head: Attitudes and Personality Correlates 5
Abstract
Previous literature indicates that there are cultural differences in attitudes towards the
elderly; however there are very few if any that examine Indigenous peoples of Canada’s
attitudes towards the elderly. The current study aims to understand the influence of
gender and personality factors on attitudes towards the elderly. The Kogan’s attitude
towards old people scale and Cattell’s 16 Personality Factor measures were used. Results
indicated that Indigenous people have positive attitudes towards the elderly. There was
no significant difference between genders. Low tension was the only predictive factor for
positive attitudes towards the elderly; and vigilance was the only correlated variable with
Kogan negative valance items.
Keywords: Indigenous, attitudes, elderly, age, personality
Running Head: Attitudes and Personality Correlates 6
Gender and Personality Correlates Influence on Attitudes towards the Elderly in Indigenous
People
Previous literature has indicated that gender has an influence on attitudes towards the
elderly, with females holding more positive attitudes (Allan & Johnson, 2008; Randler, Wilhelm,
Flessner & Hummel, 2014). A relationship between personality traits and attitudes towards the
elderly has also been implicated (Mansfield-Green, Morrisseau, Caswell, & Valliant, submitted
manuscript; Thorson & Perkins, 1980). There have been previous research examining cross-
cultural comparisons in attitudes towards the elderly (All & Terms, 2014; Gullahorn, 1957;
McGrath, 2007), however, there have been no studies to the current study’s knowledge that
examine Indigenous people’s attitudes towards the elderly. It is important to understand
attitudes towards the elderly as attitudes can influence thoughts, feelings and behaviours (Lee,
2009). Understanding attitudes can help to promote positive attitudes towards the elderly, which
in turn will reduce stigma towards the elderly and increase quality of care.
The population of Elderly people in Canada is rapidly increasing as a result of the baby
boomers (Edwards & Aldous, 1996; Lanting, Crossley, & Morgan, 2011). According to
Statistics Canada, the population of seniors (65 and Older) in 2011 makes up 14.4% of the
population (Statistics Canada, 2011). This statistics has been rapidly increasing by 1-2 plus%
every ten years since 1971 (Statistics Canada, 2011). It is projected that by 2031 the elderly
population will make up 22.8% of the population and by 2061 will consist of 25.5% of the
population (Statistics Canada, 2011). These rapidly increasing statistics are significant due to
the lack of resources currently in place for elderly peoples in Canada (McKinlay & Cowan,
2003; Wade, 1999).
Running Head: Attitudes and Personality Correlates 7
Aboriginal Peoples of Canada currently represent 4.3% of the population, and is rapidly
increasing (Lanting, Crossley, Morgan, & Cammer, 2011; Wilson, Rosenberg, & Abonyi, 2011).
Further, 1.3% of the Aboriginal population is considered Elderly (Statistics Canada, 2011).
There are significant lack of social, health and economic resources in many Aboriginal
communities (McGrath, 2007). With elder care being given the least amount of funding
(Wilson, Rosenberg, & Abonyi, 2011).
Gender and Attitudes Towards the Elderly
In the literature gender has consistently been found to influence attitudes towards the
elderly. A study done by Allan and Johnson, found that females tend to have more positive
attitudes than males (2009). Randler and colleagues, found using the Kogan’s attitudes towards
old people scale that females tend to have more positive attitudes than males (2014). Speculation
was made that gender socialization could be contributing to the previous results. Females tend to
be socialized to have compassion, and attentive to caregiving roles compared to males
(McKinlay & Cowan, 2003; Ryan, Melby, & Mitchell, 2007). Females also tend to report more
desire to participate in professions that care for the elderly (Soderhamn, Lindencrona, &
Gustavsson, 2011). Additionally, geriatric professions tend to be more heavily populated with
females (McKinlay & Cowan, 2003). Based on previous literature it is expected that gender will
have an influence on indigenous peoples’ attitudes towards the elderly.
Cross-Cultural Perspective on Attitudes Towards the Elderly
Runkawatt, Gustafsson, and Engstrong, found using the Kogan’s attitudes towards old
people scale that Swedish students tend to have more positive attitudes compared to Thai peers.
(2013). It was also found in a cross-cultural study of attitudes towards the elderly comparing
Caucasian, Chinese, Filipino, Portuguese, Polynesian, Japanese, and Hispanic that ethnicity had
Running Head: Attitudes and Personality Correlates 8
an influence on attitudes towards the elderly according the Kogan’s attitudes towards old people
scale (All & Terms, 2014). Significant differences were found between Caucasian, Chinese, and
Pilipino. Caucasians tend to have more positive attitudes towards the elderly (All & Terms,
2014). Cross-cultural comparisons of attitudes towards the elderly are important because a
culture gives insight into shared values, and the common experience of the people (Chi, 2011).
The literature indicates that there are cultural differences in attitudes towards the elderly,
however the attitudes of Indigenous people towards the elderly have yet to be addressed in the
literature.
Aboriginal ancestry and attitudes towards the Elderly
Currently there is limited information in the literature that focuses on Aboriginal peoples’
attitudes towards the elderly. Jervis, Boland, and Fickenschner wanted to measure response to
burden and satisfaction among Aboriginal caregivers. They found that caregivers respond low
on burden and high on satisfaction (2010). This study provides insight into the attitudes of
Indigenous peoples towards the elderly, however it does not measure attitude as a construct.
Through qualitative interviews common themes were observed by Jervis, Boland, and
Fickenscher. They found that traditional value and belief system instilled from childhood
promotes respect for the Elderly (2010). This study provides insight into positive attitudes
towards the elderly among Indigenous people. It can be inferred that Indigenous people will
have positive attitudes towards the elderly because of the traditional value the elderly have in the
culture.
Running Head: Attitudes and Personality Correlates 9
Personality Profiles and Attitudes Towards the Elderly
Attitudes can be thought of as the expression of personality structures (Eysenck, 1961).
Thorson and Perkins wanted to examine the relationship between personality and attitudes
towards the elderly. They used the Kogan’s attitudes towards old people scale, and the Edwards
Personal Preference Schedule to examine the correlation between attitudes towards the elderly
and personality traits. They found that attitudes towards the elderly were positively correlated
with nurturance and endurance. Attitudes towards the elderly were negatively correlated with
aggression. Thus suggesting that there is a relationship between personality and attitudes (1980).
Mansfield-Green and colleagues sought to examine undergraduate students’ attitudes
towards the elderly, and personality correlates. To address this, the Kogan’s attitudes towards
old people scale and Cattell’s 16 PF was used. Results indicated that Factor A (Warmth), Factor
C (Emotional Stability), Factor G (Rule-Consciousness) and Factor Q4 (Tension) were predictive
factors for positive attitudes towards the elderly. A significant difference was obtained where
females had more positive attitudes than males. Further suggesting that there is a relationship
between attitudes towards the elderly and personality traits.
Present Study
Purpose
The current study aims to understand Indigenous peoples attitudes towards the elderly,
and the influence of gender and personality traits. The current study hypothesizes that
indigenous people will have positive attitudes towards the elderly (Jervis, Boland, &
Fickenschner, 2010). Based on research done by Allan and Johnson (2009) it is hypothesized
that females will have more positive attitudes than males. It is expected that Factor A (Warmth),
Running Head: Attitudes and Personality Correlates 10
Factor C (Emotional Stability) and Factor Q4 (tension) will be predictive factors for positive
attitudes towards the elderly, consistent with Mansfield-Green et al., submitted manuscript.
Methods
Participants
Those identifying as Indigenous people (Status, Non-status, Métis, and Inuit) were
recruited for the study (n=60). Both males (n=13) and females (n=47) were recruited for the
study. Participants were to be between the ages of 18-55 years (M=33.78). Participants must
identify from Indigenous ancestry to participate in the study. Participants were recruited from
various agencies and community centres located on First Nation reserves. Participation was
strictly voluntary. Completion of the questionnaire packing took approximately 1.5 hours. The
study was approved by ethics.
Procedure
Participants
Participants were given a questionnaire package that contained consent forms, a
demographics sheet, the Kogan’s attitudes towards old people scale, the 16 PF testing booklet
and the corresponding bubble sheet. Participants where then guided to complete the
demographics questionnaire and Kogan’s attitudes towards old people scale directly on the page.
Participants were informed to answer the Cattell’s 16 PF questions on the corresponding bubble
sheet. They were instructed to answer the questions while trying to avoid the “I don’t know” or
“?” option.
Running Head: Attitudes and Personality Correlates 11
Measures
Demographics Form
A three page demographics questionnaire containing general questions relating to
ethnicity, age, gender, contact with the elderly and social roles of the elderly and past and current
attitudes towards the elderly.
Kogan’s attitudes towards old people scale
The Kogan’s attitudes towards old people scale holds 34 items on a likert scale ranging
from strongly agree (1) to strongly disagree (6). There are 17 paired statements consisting of one
positive (even numbered statements) and one negative (negative numbered statements). For
example, when addressing elderly individual’s capability to change the positive statement is
“Most elderly people are capable of new adjustments when the situation demands it” and the
negative paired statement being “Most elderly people get set in their ways and are unable to
change”.
To obtain scores for the Kogan’s attitudes towards old people scale, odd numbered items
were reversed scored. Each individual item’s value was tallied to create the Kogan’s Total.
Kogan’s Total can range from 34-204 and scores over 120 indicate positive attitudes towards the
elderly.
Kogan’s attitudes towards old people scale measures negative and positive attitudes
towards the elderly that are reflected by common stereotypes surrounding personal hygiene and
appearance, cognitive capabilities, personality traits and comfort with the elderly (Ryan, Melby,
& Mitchell, 2007). The Kogan’s is a reliable and valid measured, used consistently in the
Running Head: Attitudes and Personality Correlates 12
literature. The measure has produced a reliability coefficient ranging from 0.66 to 0.85 and
interscale item correlations ranging from 0.46 to 0.52 (Kogan, 1961a).
Cattell’s 16 Personality Factor
Personality correlates was measured by Cattell’s 16 Personality Factor Scale (16 PF,
Cattell, Cattel, 1993). This measure produces personality factors on a bipolar scale from one to
ten. The scores are computed from raw scores that are converted into sten scores. The sten
scores are the number that indicates where the individual falls on bipolar scale. The measure
consists of true/false questions, reasoning and 3-point preference items. There are 16 factors that
are address in the measure (i.e., Warmth, Reasoning, Emotional Stability, Dominance,
Liveliness, Rule-Consciousness, Social Boldness, Sensitivity, Vigilance, Abstractedness,
Privateness, Apprehension, Openness to Change, Self-Reliance, Perfectionism, and Tension).
With each factor the participant falls on any point (one to ten) on the bipolar scale which
indicates how much or how little they can be characterized by the personality factor. Example:
Factor A is Warmth. Someone who is low in warmth is described as someone who is
impersonal, distant, reserved or detached, someone who is high in this factor may be described as
outgoing, attentive to others, kindly and easy going (Cattell, R.B., Cattel, A.k., & Cattell, H.E.P.,
1993). The 16 PF is a valid and reliable measure with alpha coefficients ranging from 0.69 to
0.87 (IPAT, 2009).
Results
General Attitudes Towards the Elderly
Overall, the current sample of indigenous people (n=60) tended to have positive attitudes
towards the elderly with mean of the Kogan’s total being 140.65. Kogan’s total scores over the
Running Head: Attitudes and Personality Correlates 13
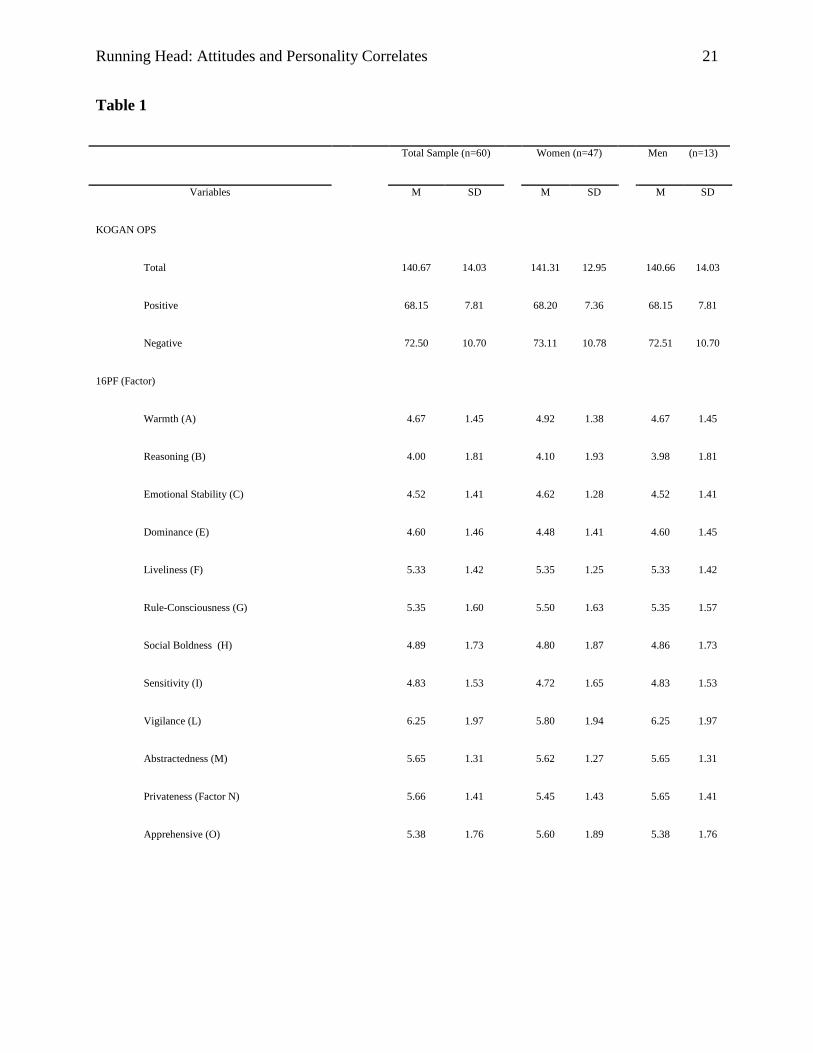
sum of 120 indicate positive attitudes towards the elderly (Kogan, 1961). See table 1 for means
and standard deviations for Kogan Total scores (negative, positive and total valance items) and
16 PF personality factors.
Gender Differences in Indigenous Attitudes towards the Elderly
An independent t-test was ran to see if there were differences between males and females
in attitudes towards the elderly. It was found that males (M=140.08, SE=5.34) and females
(M=141.31, SE=1.93) do not significantly differ in attitudes towards the elderly t(55)=-
.268,p>.05, r=0.04; however it did represent a small effect size.
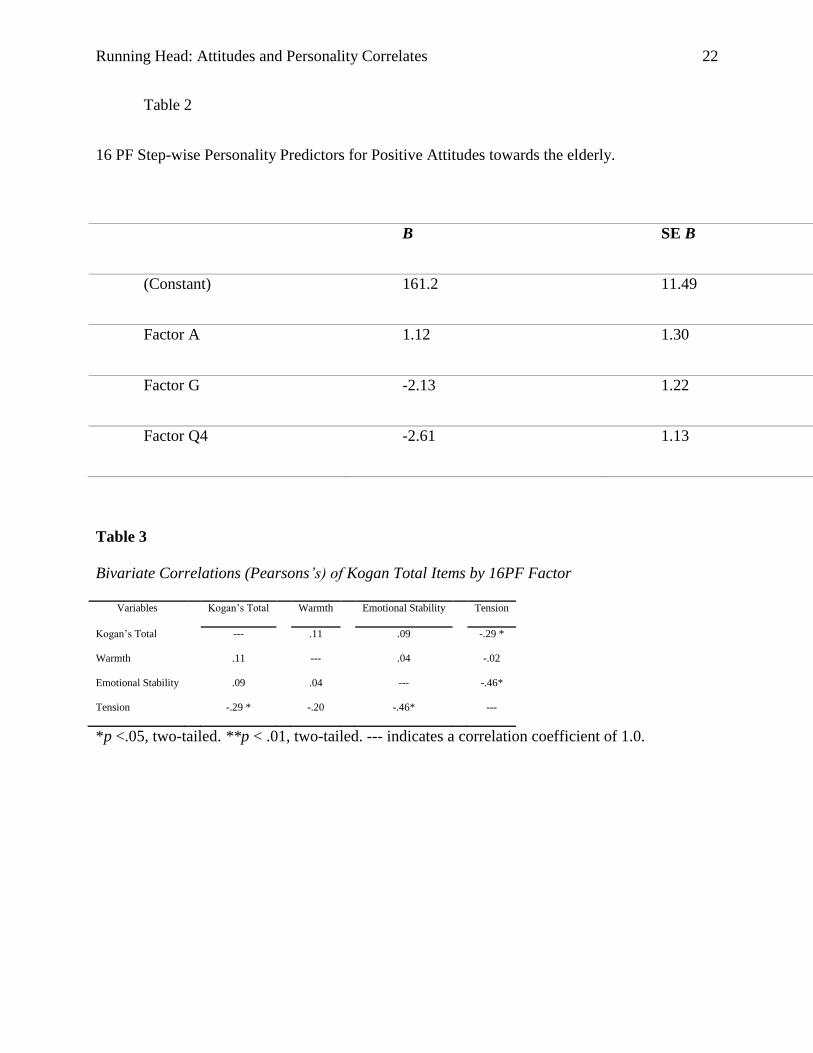
Step-wise Multiple regression of 16 PF factors and Kogan’s Total Scores
A step-wise multiple regression was computed to comprehend if personality factors
significantly predicted positive attitudes towards the elderly. Stepwise variable revealed a
significant model f(3,47) = 2.68, p<.05 with an adjusted R2
=.09, with low tension as a single
predictor variable β= -.32, p<.05 (See table 2). Durbin-Watson statistic which was found to be
within the generally accepted range (1.59).
Kogan’s Total and 16 PF correlations
A correlation matrix was examined for relationships between Kogan’s total and 16 PF
factors. Pearson correlation was conducted to see if the relationship’s fit a linear model. A
significant correlation was found with factor Q4 (tension) r= -.28, p <.05 (see Table 3).
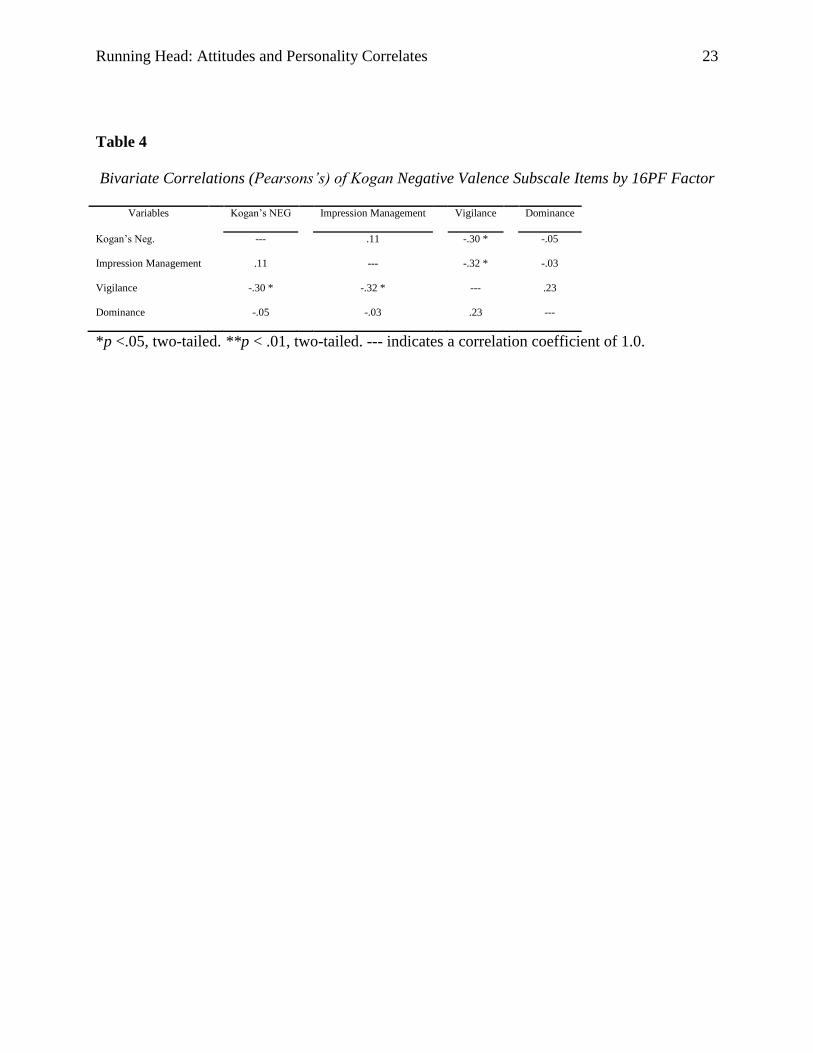
Negative valance items on the Kogan’s attitudes toward old people scale and the responses on
the 16 PF produced a significant correlation with Factor L (vigilance) r= -.30, p <.05 (See table
4).
Running Head: Attitudes and Personality Correlates 14
Discussion
The current study sought to understand indigenous people of Canada’s attitudes towards
the elderly, and the influence of gender and personality traits on attitudes towards the elderly. It
was hypothesized that indigenous people will have positive attitudes towards the elderly, and that
females will hold more positive attitudes towards the seniors. It was expected that factor A
(warmth), factor C (emotional stability) and factor Q4 (tension) will be predictive factors for
positive attitudes.
Results indicated that indigenous people hold positive attitudes towards the elderly
(Kogan total = 140.65). The results were congruent with research done by Jervis, Boland &
Fickenscher (2010) where they examined caregivers among Aboriginal communities. The
current study adds to the research previously conducted as it measures attitudes as a construct.
From the results of the current study we can make inferences that Indigenous people tend to have
positive attitudes towards the elderly.
Previous literature indicates that gender differences are present in attitudes towards the
elderly, with females holding more positive attitudes (Allan & Johnson, 2008; Mansfield et al.,
submitted manuscript; Randler, Wilhelm, Flessner, & Hummel, 2014). The current study did not
find similar results. The previous literature examining gender differences in attitudes towards
the elderly did not examine indigenous people of Canada. The culture perspective Indigenous
people hold are unique and currently still deep rooted in traditional beliefs, despite the effects of
colonialism (Brown & Vercoe, 2006). The cultural perspective of Indigenous peoples hold a
positive regard for the elderly, regardless of gender. The elderly in Indigenous communities
have a significant role as advisors (Jervis, Boland, & Fickenscher, 2010). Indigenous people
Running Head: Attitudes and Personality Correlates 15
have respect for the elderly as a traditional value, and this is taught to children and is a value that
transcends to adulthood. The elderly are viewed to have wisdom, and often share wisdom to
others as it is part of the oral tradition in indigenous cultures (Jervis, Boland, & Fickenscher,
2010). This could explain the results of the current study.
Previous literature has indicated that there is a relationship between attitudes towards the
elderly and personality correlates (Mansfield-Green et al., submitted manuscript; Thorson &
Perkins, 1980). The current study found that low tension was the only predictive variable with
the overall Kogan’s total score which is consistent with previous research conducted by
Mansfield-Green et al., submitted manuscript. Those who are low on the tension scale are
described as individuals who are relaxed, tranquil and patient (Cattell, R. B., Cattell, A.k., &
Cattell, H.E.P.,1993). These individual may have more of the qualities that allow them to more
compatible with the high demands working with the elderly. Factor L (Vigilance) was also
negatively correlated with Kogan negative valance items. Those who score high on vigilance are
described as individuals who are distrustful, skeptical and oppositional (Cattell, R. B., Cattell,
A.k., & Cattell, H.E.P., 1993). It is likely that those who score high on vigilance do not have the
adequate appreciation for societal rules based on the quality of being oppositional; and therefore
do not appreciate the social role of the elderly in the community as other members do.
Although it was hypothesized that factor A (Warmth) and factor C (Emotional Stability)
would be significantly correlated with positive attitudes towards the elderly, the current study did
not yield such results. It should be considered that Cattell’s 16 PF was normed on 22, 500
individuals, and of this number only 2.3% represented those of Indigenous people (Cattell, R. B.,
Cattell, A.k., & Cattell, H.E.P., 1993). There could be a cultural bias in the measure itself. With
Running Head: Attitudes and Personality Correlates 16
only 2.3% being normed on Indigenous people the measure is not representative of Indigenous
people, and significant results were not obtained.
It is important to understand the attitudes of individuals towards the elderly because their
attitudes can contribute to behaviours and thoughts (Lee, 2009). Further, attitudes can influence
the quality of care that the elderly are receiving. The results of the current study can be used to
implement cultural integration programs to promote positive attitudes to a more general
population. Results of the current study can also be beneficial in choosing which individuals are
best suited to receive employment in geriatric professions.
The absence of a cultural entrenchment measure was a limitation of the current study.
Without the information from the cultural entrenchment measure the current study was not able
to measure culture as a construct.
Future studies should consider including a cultural entrenchment measure to address the
relationship between cultural influence and attitudes towards the elderly, as a limitation of the
current study is that one was not used. It would be of interest to examine the differences
between urbanized indigenous peoples and those residing on Indigenous reserve in terms of the
influence of cultural entrenchment and attitudes towards the elderly.
Running Head: Attitudes and Personality Correlates 17
References
All, P. M., and Terms, J. (2014). Old and Towards Well-being and the Spiritual, 35(1), 21-32.
Allan, L. and Johnson, J. (2008). Undergraduate Attitudes towards the Elderly: The role of
Knowledge, contact and aging anxiety. Journal of Educational Gerontology, 35, pp.1-14. DOI:
10.1080/03601270802299780
Ajzen, I. (2005). Attitudes, personality, and behavior. McGraw-Hill International.
Browne, A. J., & Varcoe, C. (2006). Critical cultural perspectives and health care involving
Aboriginal peoples. Contemporary Nurse, 22(2), 155-168.
Cattell. R,B., Cattell, A.k., & Cattel, H. E. B., (1993). Sixteen Personality factor questionnaire,
(5th
Edition) Champaign, IL: Institute for personality and ability testing.
Cattell, R. B., Cattell, A. K., & Cattell, H. E. P. (1993). Sixteen personality factor questionnaire,
(5th ed.) Champaign, IL: Institute for Personality and Ability Testing.
Chi, I. (2011). Cross-Cultural gerontology research methods: challenges and solutions. Ageing
and Society, 31(03), 371-385.
Edwards, M. J. J., and Aldous, I.R. (1984). Attitudes to and knowledge about elderly people: a
comparative analysis of students of Medicine, English and Computer Science and their Teachers,
(197), 221-225.
Eysenck, H.J. (1961). Personality and social attitudes. Journal of Social Psychology, 53, 243-
248.
Francis, L. J. (1991). Personality and attitude towards religion among adult churchgoers in
England. Psychological Reports, 69(3), 791-794.
Running Head: Attitudes and Personality Correlates 18
IPAT (2009). The 16PF Fifth Edition Questionnaire Manual. Champaign, IL: Institute
for Personality and Ability Testing.
Jervis, L., Boland, M. and Fickenscher, A. (2010). American Indian Family Caregiver's
Experiences with Helping Elders. Journal of Cross Cultural Gerontology, 25, pp.355-369. DOI:
10.1007/s10823-010-9131-9
Kogan, N., Scott, B., Shelton, F.C., & Judith, W. (1981). Attitudes towards old people in an
older sample. Journal of Abnormal and Social Psychology 62(3), 616-622.
Kogan, N. (1961b). Attitudes Towards Old People: The development of a scale and an
examination of correlates. Journal of abonormal and Social Psychology, 62(1), 44-54. doi:
10.1037/h0048053
Kogan, N. (1961a). Attitudes Toward Old People: The development of a scale and an
examination of correlates. Journal of Abnormal and Social Psychology, 62(1), 44–54.
doi:10.1037/h0048053
Lanting, S., Crossley, M., Morgan, D., & Cammer, A. (2011). Aboriginal experiences of aging
and dementia in a context of sociocultural change: qualitative analysis of key informant group
interviews with Aboriginal Seniors. Journal of Cross-Cultural Gerontology, 26(1), 103-17. Doi.
10.1007/s10823-010-0136-4
Lee, Y.S (2009). Measures of students attitudes on aging. Educational Gerontology. 30(2), 121-
134.
McGrath, P. (2007). “I don’t want to be in that big city; this is my country here: research
findings on Aboriginal peoples’ preference to die at home. The Australian Journal of Rural
Health, 15(14), 264-8. Doi: 10.1111/j.1440-1584.2007.00904.x
Running Head: Attitudes and Personality Correlates 19
Mansfield-Green, S., Morrisseau, N., Caswell, J. and Valliant, P. (2014). Personality Correlates
and Attitudes Towards the Elderly of Undergraduate Students. In Review.
McKinlay, A., & Cowan, S. (2003). Student nurses’ attitudes towards working with older
patients. Journal of Advanced Nursing, 43(3), 298-309. Doi: 10.1046/j/1365-2648.2003.02713.x
Park, H. (1982). Care of the Aged and to a Career with Elderly Patients among students Attached
to a Geriatric and medical profession. (1982). Age and Ageing (11) 196-202.
Pursey, A., and Bnurs, R. G. N. (1995). Attitudes and Stereotypes: nurses’s work with older
people. Journal of Advanced nursing 547-555.
Riemann, R., Grubich, C., Hempel, S., Mergl, S., & Richter, M. (1993). Personality and attitudes
towards current political topics. Personality and individual differences, 15(3), 313-321.
Runkawatt, V., Gustafsson, C. and Engstrom, G. (2013). Different Cultures but Similar Positive
Attitudes: A comparison between Thai and Swedish Nursing Student's Attitudes towards Older
People. Journal of Educational Gerontology, 39, pp.92-102. DOI:
10.1080/03601277.2013.802187
Ryan, A., Melby, V., and Mitchell, L. (2007). An evaluation of the effectiveness of an
educational and experiential intervention on nursing students attitudes towards older people.
International Journal of Older People Nursing, 2(2), 93-101.
Sahin, H. A., Gurvit, I. H., Emre, M., Hanagasi, H.A., Biligic, B., and Harmanci, H. (2006). The
attitude of elderly lay people towards the symptoms of dementia. International
Psychogeriatrics/IPA, 18(2), 251-258. Doi: 10.1017/S1041610205002784
Running Head: Attitudes and Personality Correlates 20
Soderhamn, O., Lindencrona, C., and Gustavsson, S. M (2001). Attitudes towards older people
among nursing students and registered nurses in Sweden. Nurse Education Today, 21(3), 225-
229. Doi: 1054/nedt.2000.0546
Statistics Canada. (2011). Population projections for Canada, provinces, and territories, 2000-
2026. (Catalogue number 91-520 XIB). Retrieved June 25, 2014 from Statistics Canada:
http://www.statcan.gc.ca/daily-quotidien/010313/dq010313a-
eng.htm
Trehame, G., and Rgn, H. (1990). Attitudes towards the care of elderly people: are they getting
better? Journal of Advanced Nursing 777-781.
Ulleberg, P., & Rundmo, T. (2003). Personality, attitudes and risk perception as predictors of
risky driving behaviour among young drivers. Safety science,41(5), 427-443.
Wade, S. (1999) Promoting quality of care for older people: developing positive attitudes to
working with older people. Journal of Nursing Management, 7(6) 339-347. Doi:
10.1046/j.1365-2834.1999.00143.x
Yildrim, S., and Cam, O. Nursing academicians’ attitudes towards work life and their personality
traits. Journal of Psychiatric and Mental Health Nursing, 19(8), 709-714. Doi: 10.1111/j.1365-
2850.2011.01835.x
Running Head: Attitudes and Personality Correlates 21
Table 1
Total Sample (n=60) Women (n=47) Men (n=13)
Variables M SD M SD M SD
KOGAN OPS
Total 140.67 14.03 141.31 12.95 140.66 14.03
Positive 68.15 7.81 68.20 7.36 68.15 7.81
Negative 72.50 10.70 73.11 10.78 72.51 10.70
16PF (Factor)
Warmth (A) 4.67 1.45 4.92 1.38 4.67 1.45
Reasoning (B) 4.00 1.81 4.10 1.93 3.98 1.81
Emotional Stability (C) 4.52 1.41 4.62 1.28 4.52 1.41
Dominance (E) 4.60 1.46 4.48 1.41 4.60 1.45
Liveliness (F) 5.33 1.42 5.35 1.25 5.33 1.42
Rule-Consciousness (G) 5.35 1.60 5.50 1.63 5.35 1.57
Social Boldness (H) 4.89 1.73 4.80 1.87 4.86 1.73
Sensitivity (I) 4.83 1.53 4.72 1.65 4.83 1.53
Vigilance (L) 6.25 1.97 5.80 1.94 6.25 1.97
Abstractedness (M) 5.65 1.31 5.62 1.27 5.65 1.31
Privateness (Factor N) 5.66 1.41 5.45 1.43 5.65 1.41
Apprehensive (O) 5.38 1.76 5.60 1.89 5.38 1.76
Running Head: Attitudes and Personality Correlates 22
Table 2
16 PF Step-wise Personality Predictors for Positive Attitudes towards the elderly.
B SE B β
(Constant) 161.2 11.49
Factor A 1.12 1.30 .12
Factor G -2.13 1.22 -.24
Factor Q4 -2.61 1.13 -.32 *
Table 3
Bivariate Correlations (Pearsons’s) of Kogan Total Items by 16PF Factor
Variables Kogan’s Total Warmth Emotional Stability Tension
Kogan’s Total --- .11 .09 -.29 *
Warmth .11 --- .04 -.02
Emotional Stability .09 .04 --- -.46*
Tension -.29 * -.20 -.46* ---
*p <.05, two-tailed. **p < .01, two-tailed. --- indicates a correlation coefficient of 1.0.
Running Head: Attitudes and Personality Correlates 23
Table 4
Bivariate Correlations (Pearsons’s) of Kogan Negative Valence Subscale Items by 16PF Factor
Variables Kogan’s NEG Impression Management Vigilance Dominance
Kogan’s Neg. --- .11 -.30 * -.05
Impression Management .11 --- -.32 * -.03
Vigilance -.30 * -.32 * --- .23
Dominance -.05 -.03 .23 ---
*p <.05, two-tailed. **p < .01, two-tailed. --- indicates a correlation coefficient of 1.0.