Embed Size (px)
Citation preview
Fergusson DM, Horwood LJ. Gender differences in educational achievement in a NewZealand birth cohort. New Zealand Journal of Educational Studies, 1997; 32(1): 83-96.
Gender Differences in Educational Achievement in a New Zealand Birth Cohort
David M Fergusson Ph.D. Executive Director
L John Horwood, B.A., M.Sc. Research Fellow
Christchurch Health and Development Study
Department of Psychological Medicine
Christchurch School of Medicine
PO Box 4345
Christchurch
New Zealand
2
ABSTRACT
Gender differences in educational outcomes were examined in a birth cohort of over 1,000
Christchurch born children studied from the point of school entry to the age of 18. This
analysis suggested three major conclusions:
i) Throughout the school career of this cohort males achieved less well than females.
Gender differences were evident in the results of standardised testing, teacher ratings of
school performance and in the school leaving outcomes of the cohort. At no point of the
school career of this cohort was there evidence to suggest that females performed less well
than males.
ii) Gender differences in educational achievement could not be explained by gender
differences in intelligence since boys and girls had very similar IQ test scores.
iii) However, the higher rate of educational under-achievement in males was adequately
explained by gender related differences in classroom behaviours with males being more prone
to disruptive and inattentive classroom behaviours that appeared to impede male learning and
lead to a male educational disadvantage.
It is concluded that the traditional educational disadvantage shown by females has largely
disappeared and has been replaced by an emerging male disadvantage. The implications of
these findings for contemporary educational policies are discussed.
3
INTRODUCTION
Over the last two decades there has been an increasing emphasis placed on issues of gender
equity in the classroom. This interest has been motivated by observations suggesting that
girls were at a disadvantage within the New Zealand education system. Two lines of
evidence supported this conclusion. First, historical evidence suggested that girls had lower
success rates in school leaving examinations and were less likely to enter tertiary education
with these differences being particularly marked in the areas of science and mathematics
(Forbes, 1987; NZCER, 1988). Second, studies of classroom interaction patterns suggested
that males are more prominent and dominant in both teacher/pupil and pupil/pupil interactions
(Middleton, 1988; NZCER, 1988). This evidence has been interpreted as suggesting that
male classroom behaviour may act to discourage female educational achievement. The most
comprehensive review of these issues, as they apply to the New Zealand educational system,
was reported in the analysis given in the report of the 1988 Royal Commission on Social
Policy. The report concluded that:
“The major findings of the research are limitations on the aspirations and life chances of most
young women at their completion of secondary school and their limited participation in
tertiary education .... The research shows clearly that the New Zealand education system does
not offer the majority of girls a fair chance to develop their abilities.” (NZCER, 1988, p181).
There were, however, two potential limitations of this review. First the review failed to
quantify the extent to which there were gender differences in educational achievement or to
examine the extent to which these differences had been reducing. Second, much of the report
was based on research findings reported by the early 1980s. Both features suggest that the
report may have been somewhat out of date as an account of gender differences in the New
Zealand education system in the late 1980s. This view is supported by recent evidence that
4
suggests the traditional female educational disadvantage has disappeared and has been
replaced by an emerging male educational disadvantage. For example, the 1995 Minister of
Education’s report on the New Zealand school system (Minister of Education, 1995) showed
that females tended to: have higher rates of participation and success in School Certificate and
University Bursary examinations; have higher rates of school retention to the sixth and
seventh forms and that fewer girls than boys left school without educational qualifications. It
was also clear that in School Certificate examinations the traditional disadvantage of females
in mathematics and science subjects had all but disappeared: males tended to do slightly
better in mathematics than females whereas females did slightly better than males in science
subjects. Examination of participation and success rates at Bursary level however, suggests
the presence of gender preferences with females more often participating in non-science
subjects and males more often participating in science subjects. The trends in this report
clearly suggest that the traditional educational disadvantage of females has largely
disappeared and may have been replaced by an emerging male disadvantage that is
particularly evident in School Certificate participation and success rates, retention in school
and in the proportion of young people leaving school without educational qualifications.
In this paper we examine these issues by reporting on the educational achievement of a
birth cohort of Christchurch born children who were studied from the point of school entry to
the age of 18 years. This cohort is of particular interest since its members received their
schooling over an historical period (1982 - 1995) during which there was a growing emphasis
on female educational disadvantage and gender equity in the classroom. The aims of the
analysis are twofold. First, the analysis aims to examine the extent and nature of gender
differences in educational achievement over the school career of this cohort. As we will show
later, there was consistent evidence of male educational disadvantage from middle childhood
to the point of school leaving. Second, the paper presents an analysis of the origins of male
5
educational disadvantage. Specifically, it is proposed that gender differences in educational
achievement largely reflect gender differences in classroom behaviour with males being more
prone to disruptive, distractable and inattentive behaviours that impair learning opportunities
and act to impede educational achievement.
METHOD
The data described in this study were gathered over the course of the Christchurch Health and
Development Study. The Christchurch Health and Development Study is a longitudinal study
of a birth cohort of 1,265 Christchurch born children that has been studied from birth to the
age of 18 years using a combination of data collection methods including parental interviews,
teacher assessments, standardised testing and interviews with the children. The data were
gathered in the following ways.
Standardised Testing. From the age of 8 to the age of 13 years children in this cohort
were assessed using a series of standardised tests. These included:
a) Intelligence: At ages 8 and 9 years cohort members were assessed using the
revised version of the Wechlser Intelligence Scale for Children (WISC-R, Wechsler, 1974)
modified for New Zealand conditions. At each age performance IQ, verbal IQ and total IQ
scores were computed using the method described in the test manual. The reliabilities of
these measures were assessed by using split half methods and ranged from .87 to .95.
b) Word recognition: At age 8 years cohort members were assessed using the New
Zealand revision of the Burt Word Reading Test (Gilmore, Croft & Reid, 1981). The child’s
test score was given by the number of words correctly identified out of a possible total of 110.
Test reliability assessed by coefficient alpha was .98.
6
c) Reading comprehension: At ages 10 and 12 years reading comprehension in the
cohort was assessed using tests based around the Progressive Achievement Test of Reading
Comprehension (Elley & Reid, 1969). For the 10 year measure test items were chosen to
span an 8 year old to a 12 year old reading level. For the 12 year measure test items spanned
an 8 year old to a 14 year old reading level. The reliability of both measures was .83.
d) Mathematical reasoning: At age 11 children were administered a mathematical
reasoning test based around the Progressive Achievement Test (PAT) of Mathematical
Reasoning (Reid & Hughes, 1974). This test spanned items with difficulty levels from the 8
year age group to the 13 year age group. The subject’s test score was given by the number of
correct responses to the test. Reliability of the test assessed by coefficient alpha was .87.
e) Scholastic ability: At age 13 cohort members were administered the Test of
Scholastic Abilities (TOSCA, Reid, Jackson, Gilmore & Croft, 1981). This test was scored as
recommended in the test manual to give a total scholastic ability score. The reliability of this
score assessed by coefficient alpha was .95.
Teacher Ratings. Results from standardised test scores were supplemented by teacher
ratings of academic performance in relation to same aged peers based on a five point scale
with 1 denoting very good and 5 very poor at ages 8-12 years. Ratings were obtained for
reading, written expression, mathematics and spelling. Assessment of the reliability of
teacher ratings using an auto-regressive modelling method suggested that these were of
moderate reliability, with reliabilities ranging from .66 to .78 (Fergusson, 1988).
Outcomes at Age 18. To assess educational outcomes at age 18 a series of measures
were collected. These included:

7
a) Measures of word recognition based on the New Zealand revision of the Burt
Word Reading Test (Gilmore, Croft & Reid, 1981). This measure was scored in two ways.
First, for each subject a total test score representing the number of correct responses was
computed. Second, a dichotomous measure of reading delay was constructed by classifying
subjects with a test score that was below the mean score of the cohort at age 12 as being
reading delayed.
b) School Certificate success: Each subject was asked about the number of School
Certificate subjects that s/he had sat and the number of these subjects for which a C grade or
better was obtained. A measure of the extent of achievement in School Certificate
examinations was constructed from the number of subjects sat for which the subject reported
a C grade or better.
c) Leaving school without qualifications: Using data gathered at ages 16 and 18
years it was possible to identify cohort members who had: i) left school by the age of 18 years
and ii) failed to obtain any educational qualifications.
The above measures were selected for analysis as they provided an account of the
scholastic achievements of the cohort measured at different ages and from different
perspectives including standardised testing, teacher ratings and levels of achievement at
around the point of school leaving.
Measures of Classroom Behaviour. From the age of six years to the age of 12 years,
teachers were requested to provide reports of classroom behaviours based on a behaviour
inventory that combined the Rutter (Rutter, Tizard & Whitmore, 1970) and Conners (1969)
teacher questionnaires. Factor analyses of these questionnaires (Fergusson, Horwood &
Lloyd, 1991) have suggested that they measure two correlated dimensions of child

8
behaviours: a) conduct problems - the extent to which children exhibit antisocial, aggressive
and oppositional behaviours in the classroom and b) attentional problems - the extent to
which children exhibit inattentive, hyperactive or distractable behaviours in the classroom.
At each age conduct problem and attentional problem scores were obtained by an unweighted
sum of teacher ratings. These scores have been shown to be of good reliability with reliability
coefficients ranging from .88 to .95.
Sample Size
The analyses in this report are based on all available data for cohort members at the time a
given outcome was assessed. Sample sizes ranged from as high as 1110 to as low as 784.
There were two reasons for these variations in sample size. First, over the period of the study
there was an attrition in the sample owing to the combined effects of subject refusal, subject
outmigration from New Zealand and death. The result of this attrition was that the original
cohort was reduced to 982 subjects at age 16 with these subjects representing 78% of the
original cohort and 88% of subjects resident in New Zealand. For standardised testing sample
size was further reduced owing to the fact that for logistic reasons it was necessary to confine
standardised tests to those cohort members resident in Canterbury. Canterbury residents of
the cohort represented approximately 80% of the cohort.
It is very unlikely that sample size variations will influence the validity of the findings
reported in this study. It can be shown that to threaten such validity, any sample losses need
to be correlated with the child’s gender. Throughout the course of this study sample losses
were consistently unrelated to gender.
9
RESULTS
Gender differences in educational achievement
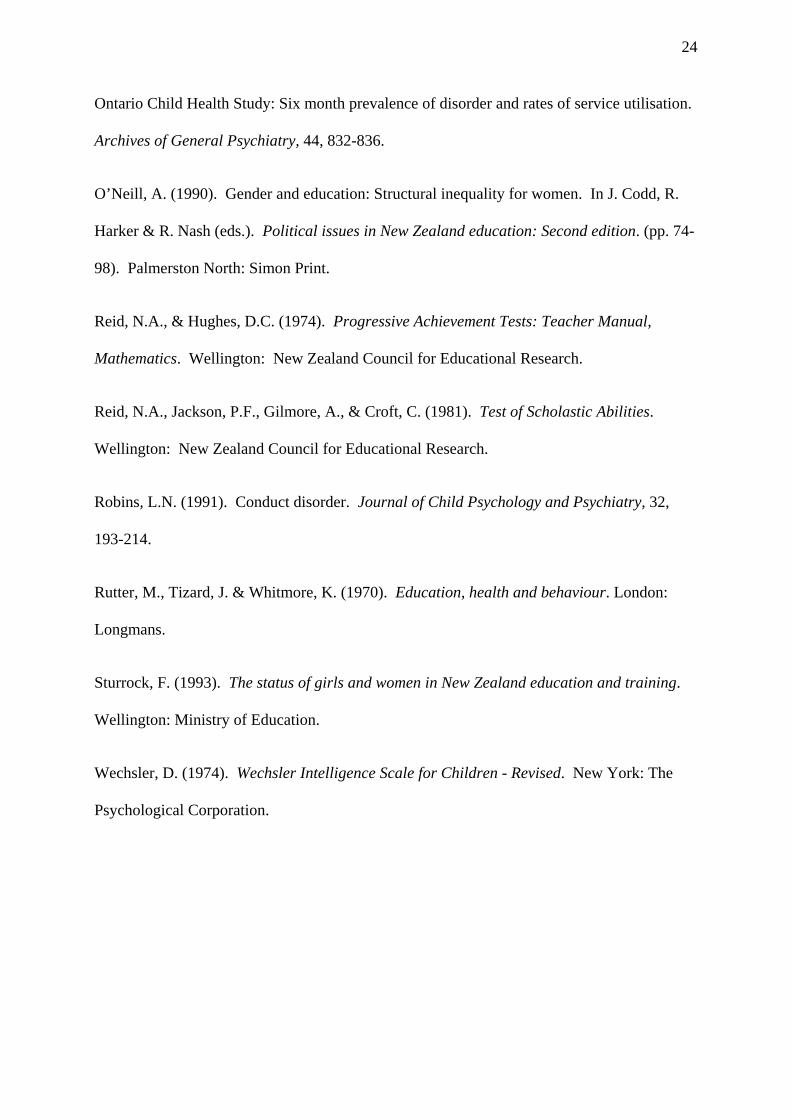
Table 1 shows the cohort stratified by gender and for each gender group outcomes on a series
of measures of educational achievement assessed over the period from age 8 to 18 are shown.
The measures of academic achievement used are of three types: a) scores on standardised
tests of word recognition, reading comprehension, mathematical, reasoning and scholastic
ability; b) teacher ratings of school performance in the areas of reading, written expression,
spelling and mathematics; c) measures of educational outcomes at age 18 years including
levels of achievement in School Certificate examinations, reading delay and leaving school
without qualifications. Each comparison is tested for statistical significance: for continuously
scored measures t tests for independent samples were computed whereas for dichotomous
measures, significance was assessed using the chi square test of statistical independence.
INSERT TABLE 1. HERE
The table shows evidence of pervasive differences in the school achievement of males
and females with males having lower scores on all standardised tests; being uniformly rated
as performing less well in the areas of reading, written expression, mathematics and spelling,
and at age 18, having lower success rates in School Certificate examinations, higher rates of
reading delay and more often leaving school without qualifications. It is notable that of the
18 comparisons made in Table 1 in all cases there is evidence of better female achievement
and in all but one case (mathematical reasoning at age 11) these differences are statistically
significant (p<.05). The table provides generally compelling evidence to suggest that
throughout the school career of this cohort, boys were educationally disadvantaged when
compared with girls.
10
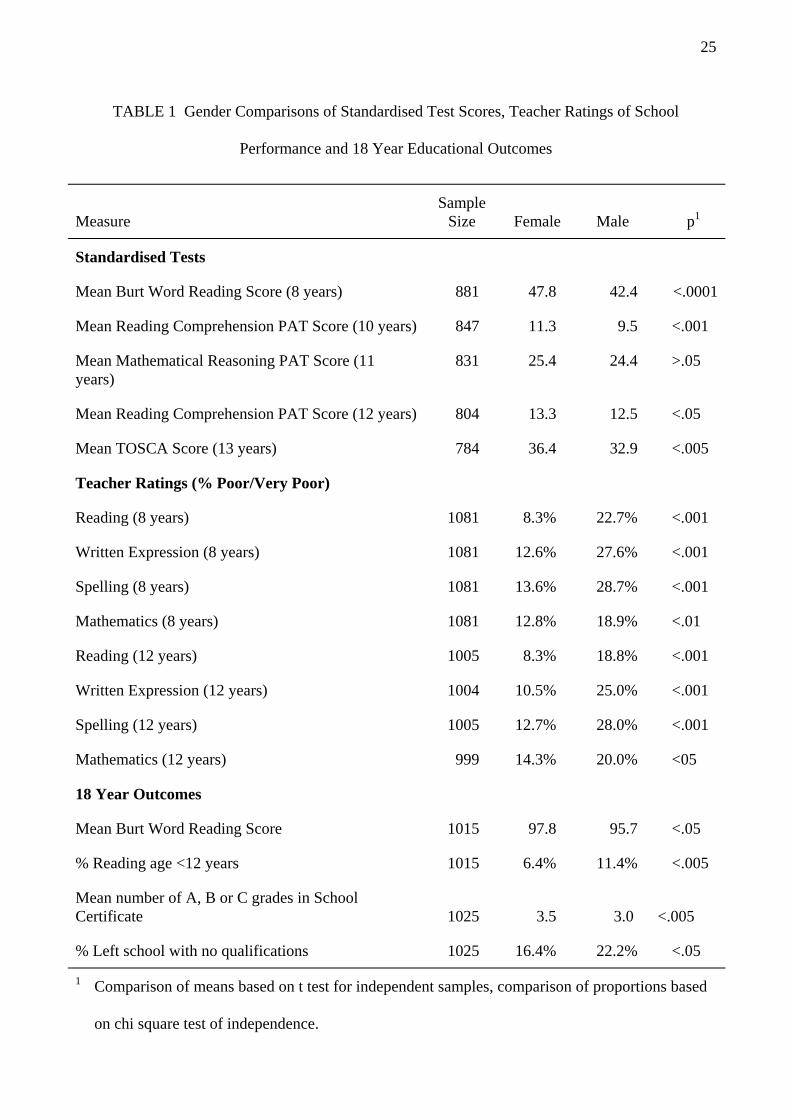
Gender differences in cognitive ability
It could be proposed that the consistently poorer academic performance of males was due to
the fact that males were cognitively less able than females. This issue is examined in Table 2
which shows scores on the performance, verbal and total scales of the WISC-R IQ test at ages
8 and 9. These comparisons show that, in contrast to the pervasive differences in academic
achievement that were present for males and females, there were no differences between
males and females in terms of IQ scores. In no case were the mean IQ scores for boys lower
than the mean IQ scores for girls and in all cases there were no significant gender differences
in IQ. The clear interpretation of the results in Tables 1 and 2 is that males and females were
populations of very similar cognitive ability but were distinguished by females having better
academic achievement.
INSERT TABLE 2. HERE
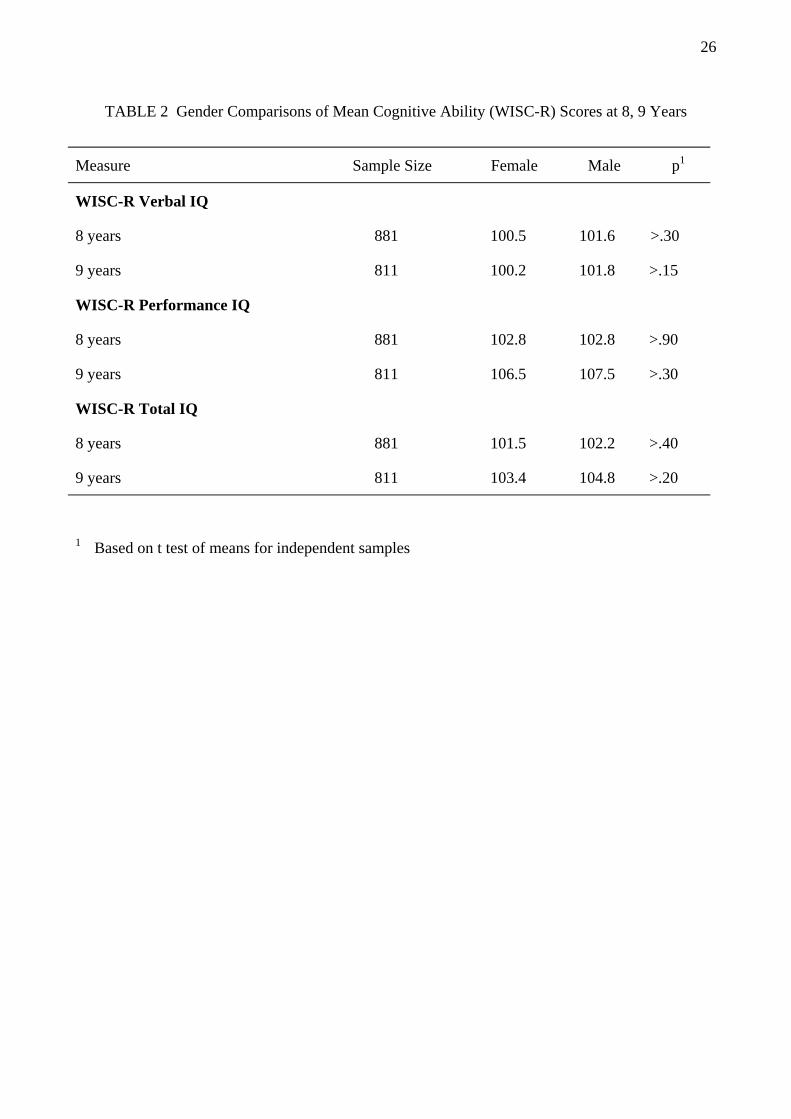
Gender differences in classroom behaviours
The findings above suggest the presence of some set of factors that operate largely
independently of cognitive ability to either disadvantage males or advantage females. One
explanation is that the poorer academic achievement of males may reflect the presence of
gender differences in classroom behaviour. In particular, it might be proposed that males are
more prone to disruptive, inattentive or distractable behaviours that act to impair learning
within the classroom and to impede male academic achievement (Fergusson, Lloyd &
Horwood, 1991). This issue is examined in Table 3 which compares the mean scores of boys
and girls on two measures of teacher rated classroom behaviour: a) conduct problems - the
extent to which the child was described as engaging in aggressive, antisocial or oppositional
behaviours in the classroom and b) attention problems - the extent to which the child was
11
described as engaging in inattentive, restless or distractable classroom behaviours. These
measures span the ages from six to 12 years and in all cases have been scaled to a mean of
100 and a standard deviation of 10. These conventions make it possible to make all
comparisons on the same scale units and also make it possible to interpret gender differences
in mean scores in terms of standard deviation units.
The Table shows that at all ages considered, males had significantly higher (p<.0001)
rates of both conduct problems and attentional problems with male mean scores being
between .4 to .6 standard deviations higher than female mean scores.
INSERT TABLE 3. HERE
The relationships between gender and achievement after adjustment for gender
differences in classroom behaviour
The above evidence provides a prima facie case for the view that the gender differences in
educational achievement shown in Table 1 may have arisen from the gender differences in
classroom behaviours shown in Table 3. To address this issue further the relationships
between gender and academic achievement shown in Table 1 were adjusted for the gender
differences in classroom behaviour shown in Table 3. These adjustments were achieved by
fitting regression models in which each of the educational outcomes in Table 1 was modelled
as a linear function of: a) the child’s behaviour and b) the child’s classroom behaviour
assessed at age 6 and concurrently with the outcome measure. For continuously scored
outcomes, adjustments were obtained using multiple linear regression methods, whereas for
dichotomous outcomes, multiple logistic regression was used. More formally the analysis
was as follows:
1. For continuously scored outcomes the model fitted was:
12
Yi = βo + β1 X1 + Σj βj Zj + Ui
Where Yi was the ith measure of academic achievement; X1 was a dummy variable
representing gender and Zj were the set of relevant classroom behaviour measures. Using the
ordinary least squares estimates of the coefficients βi, βj it is possible to estimate the
differences in mean male and female achievement scores on the measure Yi adjusted for the
effects of classroom behaviours Zj correlated with gender. The adjusted means are given by:
E(Yia)m = βo + Σj βj Zj
E(Yia)f = βo + β1 + Σj βj Zj
Where E(Yia)m, E(Yia)f are the adjusted mean scores on Yi for males and females respectively
and Zj is the mean score on the measure Zj. The adjusted scores have the counter factual
interpretation of being the mean levels of achievement that would have been observed for
males and females had both gender groups shown an identical distribution of classroom
behaviours. A test of the extent to which gender differences are significant after adjustment
for behavioural differences is given by testing the null hypothesis β1 = 0.
2. For dichotomously scores measures, the model fitted was:
Logit [Pr(Yi = 1)] = βo + β1 X1 + Σj βj Zj
Where Logit [Pr(Yi = 1)] is the log odds of a rating of poor achievement for the ith
dichotomous outcome and the other variables in the model have a similar interpretation to the
multiple linear regression model above. From this model it is possible to obtain estimates of
the rates of poor achievement ratings for males and females adjusted for the correlated effects
of classroom behaviour. An account of the method for producing adjusted estimates in
logistic regression models has been given by Lee (1981). As is the case for the linear
13
regression model, a test of the extent to which gender differences are statistically significant
after adjustment for behavioural differences is given by testing the null hypothesis β1 = 0.
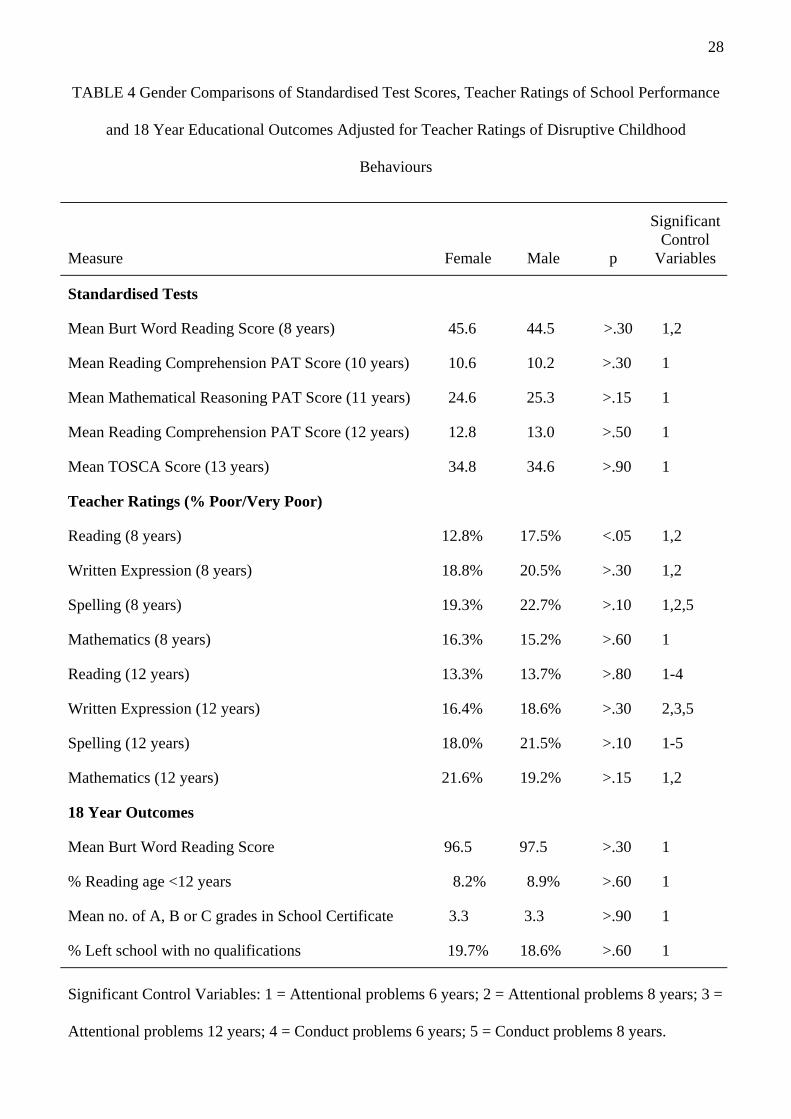
The results of this analyses are summarised in Table 4 which compares gender
differences in school achievement for males and females after adjustment for gender
differences in classroom behaviour. The Table shows that the effects of this adjustment were
to eliminate any consistent gender difference in achievement and, with one exception, there
were no significant differences in mean levels of achievement for males and females. These
findings have the substantive interpretation that had boys and girls behaved in similar ways in
the classroom setting there would have been no evidence of consistent gender related
differences in school achievement.
The Table also shows the behaviour factors that were significant in each regression
model. This Table suggests that the critical factor that explained gender differences in
educational achievement related to rates of attentional problems and, particularly attentional
problems present by the age of six years.
Collectively these findings clearly suggest that gender and school achievement were
linked by a causal chain process in which:
1. Gender acted to influence classroom behaviours with boys being more prone to
distractable, disruptive and inattentive behaviours from the point of school entry.
2. Classroom behaviour and, particularly attentional problems, influenced the child’s
level of academic achievement throughout his/her school career.
3. By virtue of 1. and 2. boys showed small but consistent deficits in educational
achievement throughout their school career.
14
INSERT TABLE 4. HERE
DISCUSSION
In this study we have examined gender differences in educational achievement amongst a
birth cohort of New Zealand children who spent their school career in an historical period
(1982 - 1995) during which there was an increasing emphasis on the educational
underachievement of girls and the need for gender equity in education. The major findings of
this analysis are reviewed below.
Contemporary Gender Differences in Educational Achievement
The findings of this study show that from middle childhood up to the age of 18 years males
were at a small but consistent educational disadvantage: boys tended to perform less well on
standardised tests of achievement including reading, mathematics and scholastic ability; they
were more frequently rated by teachers as performing poorly in the areas of reading, written
expression, spelling and mathematics and, at age 18, males were more often reading delayed,
had lower success rates in School Certificate examinations and more often left school without
educational qualifications. It is unlikely that these results reflect measurement artefacts or are
specific to this cohort for two reasons. First, it has been possible to show that boys were
educationally disadvantaged using a number of different methods of assessment including
standardised testing, teacher evaluations and outcomes at age 18. On all of these indices there
were consistent tendencies for boys to perform less well than girls. Second, the findings of
the present study are consistent with recent findings reported in the 1995 Minister of
Education’s report that showed higher rates of educational success amongst females than
amongst males. These comparisons suggest that the findings reported in this study are
unlikely to be specific to this cohort and are likely to apply equally to other contemporary
15
cohorts. There can be little doubt on the basis of these findings that any gender bias within
the contemporary New Zealand education system, up to the age of school leaving is in the
direction of leading to male under achievement rather than to female educational
disadvantage.
The Origins of Contemporary Gender Differences in Education
Whilst it is possible to show that males were at an educational disadvantage, a more important
question centres around the origins of male educational disadvantage. It could be suggested
that the better educational performance of females reflects an intrinsic female academic
superiority that has become evident as a result of contemporary gender equity policies in
education. The evidence from this research does not support this conclusion. In particular,
when members of this cohort were assessed on IQ tests at ages 8 and 9 years, there was no
evidence to suggest that males were of lesser cognitive ability than females: in no comparison
were mean IQ scores for males poorer than those of females. To the extent that measures of
IQ are likely to give measures of the individual cognitive ability that are less affected by prior
learning and classroom conditions than tests of academic achievement, these results strongly
suggest that males and females were populations of equivalent cognitive ability that were
distinguished by superior female academic achievement.
One explanation of gender differences in educational achievement is that these may
arise from gender differences in classroom behaviour with the higher rates of disruptive,
inattentive behaviours in boys impairing male learning and leading to lower rates of academic
success for boys (Fergusson, Lloyd & Horwood, 1991). The results of this study strongly
support this explanation. Comparison of males and females showed that from the point of
school entry onwards, males were more prone to engage in both disruptive and inattentive
classroom behaviours. Furthermore, adjustment of gender differences in educational
16
achievement for gender differences in classroom behaviours revealed that after this
adjustment there were no systematic gender differences in educational achievement. These
results clearly suggest that had boys and girls behaved in the same way in the classroom their
level of educational achievement would have been similar or conversely, that the poorer
levels of male achievement were a reflection of the fact that boys were more prone to
disruptive and inattentive classroom behaviours.
These findings are consistent with a large body of evidence from the developmental
literature which has consistently reported higher rates of disruptive behaviour problems in
boys (Anderson, Williams, McGee & Silva, 1987; Cohen, Velez, Kohn, Schwab-Stone &
Johnson, 1987; Fergusson, Horwood & Lynskey, 1993; Offord et al, 1987; Robins, 1991).
Furthermore, there is considerable evidence to suggest that children who exhibit disruptive
behaviour problems and particularly attentional problems or attention deficits are at increased
risks of academic under achievement and difficulties (Anderson, Williams, McGee & Silva,
1989; Fergusson & Horwood, 1995; Fergusson, Lynskey & Horwood, in press; Frick et al,
1991; Hinshaw, 1992a; Hinshaw, 1992b). This relationship has been shown to persist when
measures of cognitive ability and social background are taken into account (Fergusson &
Horwood, 1995; Fergusson et al, in press). These findings clearly suggest the presence of
gender related differences in behaviour that are likely to conspire to place males at an
educational disadvantage because of their classroom behavioural patterns. The association
between gender and academic achievement found in this study appears to be a special case of
a more general tendency for children prone to disruptive and inattentive classroom behaviour
to be at increased risks of educational under achievement.
17
Policy Implications
The preceding results and conclusions have a number of implications for contemporary
educational policy and policy directions. First, previous writing on gender differences has
left the New Zealand education system with an intellectual legacy in which it has been widely
assumed that girls are educationally disadvantaged. For example a 1993 Ministry of
Education report commented on these issues in the following ways:
“Over the past two decades there has been growing recognition of the fact that women
and girls are not necessarily offered the same range of educational opportunities, occupational
options and life chances as their male counterparts. A number of overview reports has
identified substantial gender differences in participation, attainment and outcomes in
education as well as differential employment patterns”. (Sturrock, 1993, page 11).
Similar claims have been made in a growing number of publications and analyses that
have emphasised various aspects of female educational disadvantage but which have seldom
addressed the possibility of male educational disadvantage (Middleton, 1990; Middleton &
Jones, 1992; New Zealand Council for Educational Research, 1988; O’Neill, 1990; Sturrock,
1993). The present analysis suggests that this emphasis on female educational disadvantage
is very much out of date and that for cohorts of children entering the school system since the
mid 1980s any gender bias in educational achievement within the New Zealand school system
has been in the direction of male under achievement rather than female educational
disadvantage. Furthermore, it is likely that these differences will be perpetuated in the area of
tertiary education as successive cohorts entering the school system since the mid 1980s move
into the tertiary education system. There seems little doubt that the pervasive emphasis that
has been placed on female educational disadvantage is likely to have obscured and rendered
invisible an emerging male educational disadvantage. These considerations clearly suggest
18
the need for more balanced treatments of gender issues in education that examine the
disadvantages faced by both males and females rather than an approach that focuses
exclusively on perceived issues of female disadvantage.
It might be thought that the findings of the present study suggest the need for explicit
policies that focus on males and attempt to reduce male education disadvantage. Further
reflection however, suggests that approaches which begin with gender as a key policy
variable are likely to be both inefficient and potentially inequitable. As we have noted earlier,
the tendency for males to have poorer achievement emerges as a special case of a more
general tendency for children prone to disruptive and inattentive classroom behaviours to be
at risk of later educational under achievement. Accordingly, the appropriate policies are not
those centred around the politics of gender in the school system but rather policies that
develop practical classroom management practices to address the issue of children with
disruptive and inattentive classroom behaviours in a way which minimises the risks of
educational under achievement faced by these children. There is a very important difference
between policies that address male disadvantage and policies that address the issue of
disruptive classroom behaviours. In particular, whilst the majority of children with disruptive
classroom behaviours are male there is nonetheless a minority of females who present with
these problems and who are at risk of educational under achievement (Anderson et al, 1987;
Cohen et al, 1987; Fergusson et al, 1993; Offord et al, 1987). Policies that focus on male
disadvantage would, in effect, ignore the difficulties faced by these at risk girls. All of these
considerations suggest the need for policies and debates about educational achievement to
move away from the narrow confines of gender based theory and toward a more broad based
developmental model that takes into account the wide range of individual and social factors
that impinge on individual academic achievement.
19
Finally, we believe that this study provides a case history of the way that enthusiastic
extrapolation of research findings in education may mislead rather than enlighten. We have
been aware of a discrepancy between the claims that females were educationally
disadvantaged and the school performance of this cohort for over a decade. However, in an
intellectual climate which was dominated by strong claims that females were educationally
disadvantaged it has been difficult to convince others of the discrepancy between educational
theory and classroom reality. Indeed, on the occasion on which we pointed out evidence of
male educational disadvantage (Fergusson, Lloyd & Horwood, 1991) it was argued that our
results were due to methodological error and analytic imprecision (McDonald, 1994). It is
clear now that our cohort has ceased its secondary schooling that this was not the case and
that, in fact, from the point of school entry to the point of school leaving, males in this (and
other contemporary) cohorts have been at a small but consistent educational disadvantage.
The irony of this situation is that over the entire school career of our cohort, views of gender
differences in education have been dominated by a model that has promoted the view that
girls were being unfairly treated and disadvantaged by the New Zealand education system.
This may well have been so up to the mid 1980s but it is clear that by the mid 1990s, any
female educational disadvantage (up to the point of school leaving) has largely disappeared
and has been replaced by an emerging male educational disadvantage

20
AUTHOR NOTES
This research was funded by grants from the Health Research Council of New Zealand, the
Canterbury Medical Research Foundation, the National Child Health Research Foundation
and Lottery Health.
21
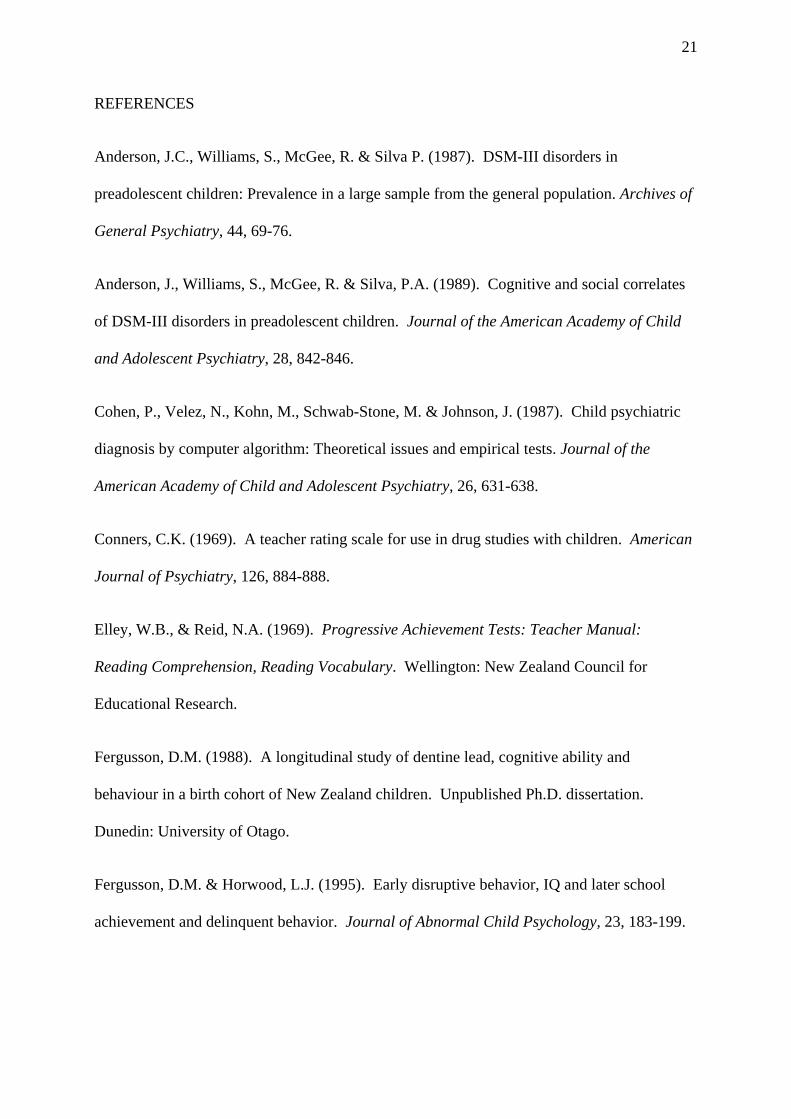
REFERENCES
Anderson, J.C., Williams, S., McGee, R. & Silva P. (1987). DSM-III disorders in
preadolescent children: Prevalence in a large sample from the general population. Archives of
General Psychiatry, 44, 69-76.
Anderson, J., Williams, S., McGee, R. & Silva, P.A. (1989). Cognitive and social correlates
of DSM-III disorders in preadolescent children. Journal of the American Academy of Child
and Adolescent Psychiatry, 28, 842-846.
Cohen, P., Velez, N., Kohn, M., Schwab-Stone, M. & Johnson, J. (1987). Child psychiatric
diagnosis by computer algorithm: Theoretical issues and empirical tests. Journal of the
American Academy of Child and Adolescent Psychiatry, 26, 631-638.
Conners, C.K. (1969). A teacher rating scale for use in drug studies with children. American
Journal of Psychiatry, 126, 884-888.
Elley, W.B., & Reid, N.A. (1969). Progressive Achievement Tests: Teacher Manual:
Reading Comprehension, Reading Vocabulary. Wellington: New Zealand Council for
Educational Research.
Fergusson, D.M. (1988). A longitudinal study of dentine lead, cognitive ability and
behaviour in a birth cohort of New Zealand children. Unpublished Ph.D. dissertation.
Dunedin: University of Otago.
Fergusson, D.M. & Horwood, L.J. (1995). Early disruptive behavior, IQ and later school
achievement and delinquent behavior. Journal of Abnormal Child Psychology, 23, 183-199.
22
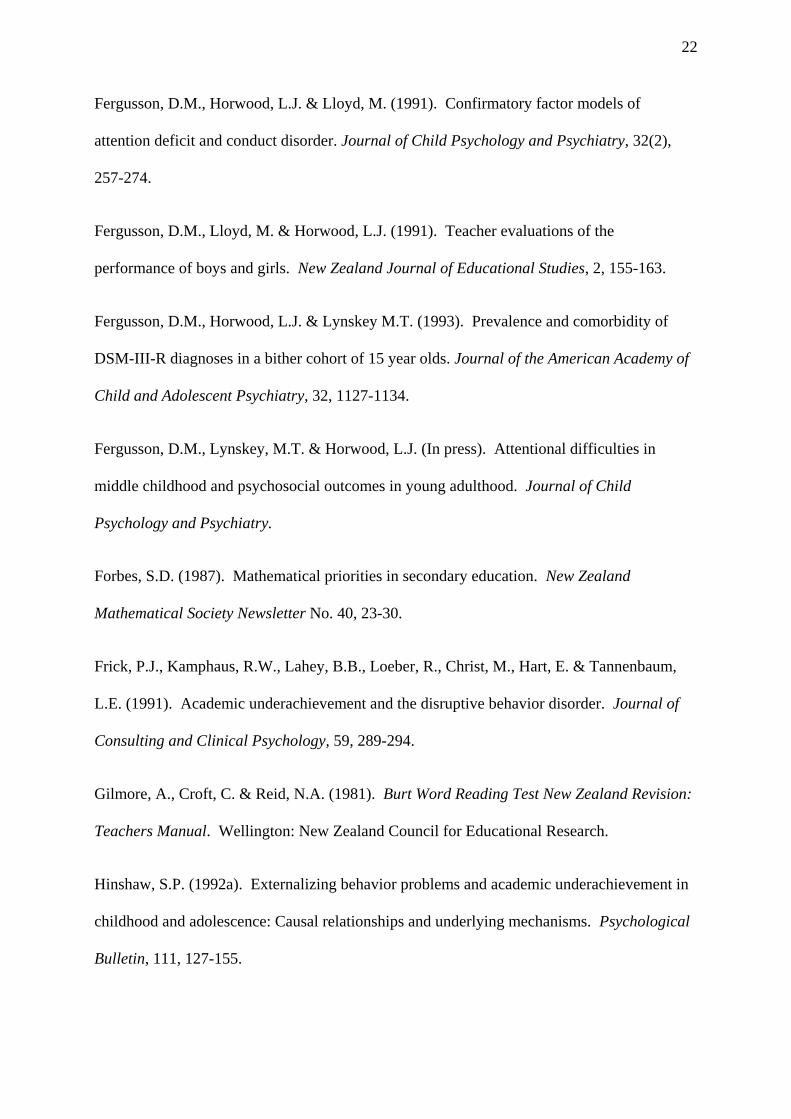
Fergusson, D.M., Horwood, L.J. & Lloyd, M. (1991). Confirmatory factor models of
attention deficit and conduct disorder. Journal of Child Psychology and Psychiatry, 32(2),
257-274.
Fergusson, D.M., Lloyd, M. & Horwood, L.J. (1991). Teacher evaluations of the
performance of boys and girls. New Zealand Journal of Educational Studies, 2, 155-163.
Fergusson, D.M., Horwood, L.J. & Lynskey M.T. (1993). Prevalence and comorbidity of
DSM-III-R diagnoses in a bither cohort of 15 year olds. Journal of the American Academy of
Child and Adolescent Psychiatry, 32, 1127-1134.
Fergusson, D.M., Lynskey, M.T. & Horwood, L.J. (In press). Attentional difficulties in
middle childhood and psychosocial outcomes in young adulthood. Journal of Child
Psychology and Psychiatry.
Forbes, S.D. (1987). Mathematical priorities in secondary education. New Zealand
Mathematical Society Newsletter No. 40, 23-30.
Frick, P.J., Kamphaus, R.W., Lahey, B.B., Loeber, R., Christ, M., Hart, E. & Tannenbaum,
L.E. (1991). Academic underachievement and the disruptive behavior disorder. Journal of
Consulting and Clinical Psychology, 59, 289-294.
Gilmore, A., Croft, C. & Reid, N.A. (1981). Burt Word Reading Test New Zealand Revision:
Teachers Manual. Wellington: New Zealand Council for Educational Research.
Hinshaw, S.P. (1992a). Externalizing behavior problems and academic underachievement in
childhood and adolescence: Causal relationships and underlying mechanisms. Psychological
Bulletin, 111, 127-155.
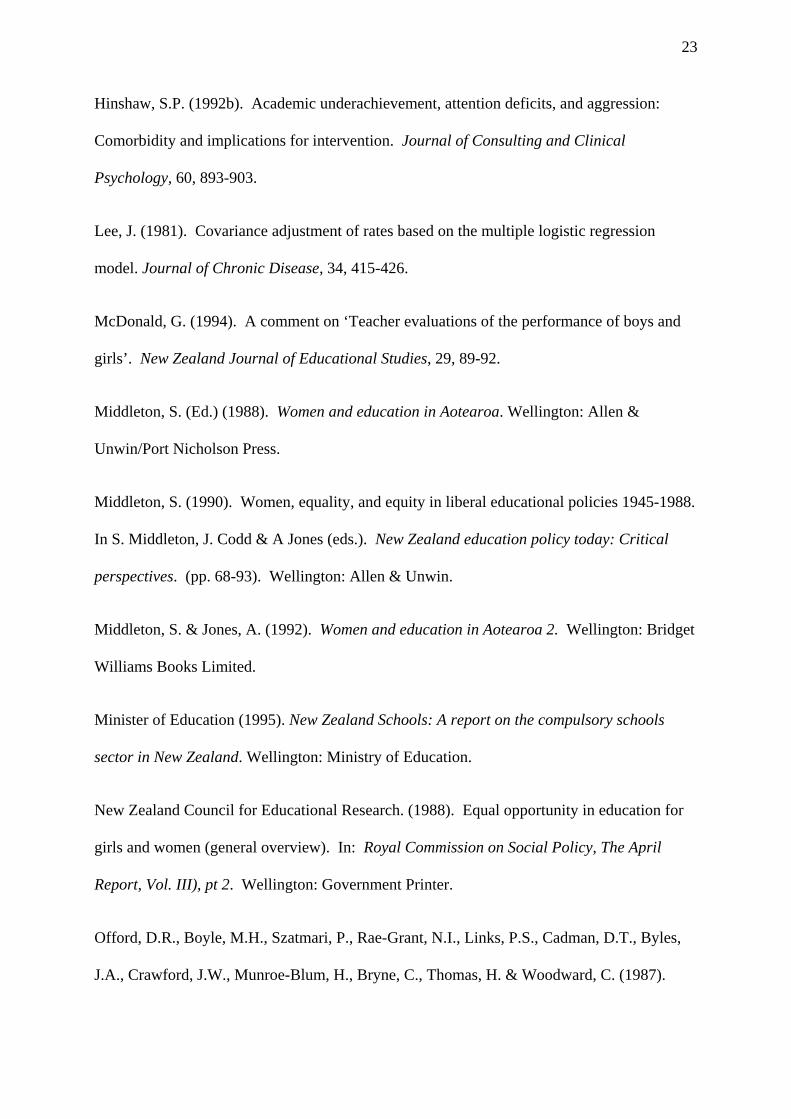
23
Hinshaw, S.P. (1992b). Academic underachievement, attention deficits, and aggression:
Comorbidity and implications for intervention. Journal of Consulting and Clinical
Psychology, 60, 893-903.
Lee, J. (1981). Covariance adjustment of rates based on the multiple logistic regression
model. Journal of Chronic Disease, 34, 415-426.
McDonald, G. (1994). A comment on ‘Teacher evaluations of the performance of boys and
girls’. New Zealand Journal of Educational Studies, 29, 89-92.
Middleton, S. (Ed.) (1988). Women and education in Aotearoa. Wellington: Allen &
Unwin/Port Nicholson Press.
Middleton, S. (1990). Women, equality, and equity in liberal educational policies 1945-1988.
In S. Middleton, J. Codd & A Jones (eds.). New Zealand education policy today: Critical
perspectives. (pp. 68-93). Wellington: Allen & Unwin.
Middleton, S. & Jones, A. (1992). Women and education in Aotearoa 2. Wellington: Bridget
Williams Books Limited.
Minister of Education (1995). New Zealand Schools: A report on the compulsory schools
sector in New Zealand. Wellington: Ministry of Education.
New Zealand Council for Educational Research. (1988). Equal opportunity in education for
girls and women (general overview). In: Royal Commission on Social Policy, The April
Report, Vol. III), pt 2. Wellington: Government Printer.
Offord, D.R., Boyle, M.H., Szatmari, P., Rae-Grant, N.I., Links, P.S., Cadman, D.T., Byles,
J.A., Crawford, J.W., Munroe-Blum, H., Bryne, C., Thomas, H. & Woodward, C. (1987).
24
Ontario Child Health Study: Six month prevalence of disorder and rates of service utilisation.
Archives of General Psychiatry, 44, 832-836.
O’Neill, A. (1990). Gender and education: Structural inequality for women. In J. Codd, R.
Harker & R. Nash (eds.). Political issues in New Zealand education: Second edition. (pp. 74-
98). Palmerston North: Simon Print.
Reid, N.A., & Hughes, D.C. (1974). Progressive Achievement Tests: Teacher Manual,
Mathematics. Wellington: New Zealand Council for Educational Research.
Reid, N.A., Jackson, P.F., Gilmore, A., & Croft, C. (1981). Test of Scholastic Abilities.
Wellington: New Zealand Council for Educational Research.
Robins, L.N. (1991). Conduct disorder. Journal of Child Psychology and Psychiatry, 32,
193-214.
Rutter, M., Tizard, J. & Whitmore, K. (1970). Education, health and behaviour. London:
Longmans.
Sturrock, F. (1993). The status of girls and women in New Zealand education and training.
Wellington: Ministry of Education.
Wechsler, D. (1974). Wechsler Intelligence Scale for Children - Revised. New York: The
Psychological Corporation.
25
TABLE 1 Gender Comparisons of Standardised Test Scores, Teacher Ratings of School
Performance and 18 Year Educational Outcomes
MeasureSample
Size Female Male p1
Standardised Tests
Mean Burt Word Reading Score (8 years) 881 47.8 42.4 <.0001
Mean Reading Comprehension PAT Score (10 years) 847 11.3 9.5 <.001
Mean Mathematical Reasoning PAT Score (11years)
831 25.4 24.4 >.05
Mean Reading Comprehension PAT Score (12 years) 804 13.3 12.5 <.05
Mean TOSCA Score (13 years) 784 36.4 32.9 <.005
Teacher Ratings (% Poor/Very Poor)
Reading (8 years) 1081 8.3% 22.7% <.001
Written Expression (8 years) 1081 12.6% 27.6% <.001
Spelling (8 years) 1081 13.6% 28.7% <.001
Mathematics (8 years) 1081 12.8% 18.9% <.01
Reading (12 years) 1005 8.3% 18.8% <.001
Written Expression (12 years) 1004 10.5% 25.0% <.001
Spelling (12 years) 1005 12.7% 28.0% <.001
Mathematics (12 years) 999 14.3% 20.0% <05
18 Year Outcomes
Mean Burt Word Reading Score 1015 97.8 95.7 <.05
% Reading age <12 years 1015 6.4% 11.4% <.005
Mean number of A, B or C grades in SchoolCertificate 1025 3.5 3.0 <.005
% Left school with no qualifications 1025 16.4% 22.2% <.05
1 Comparison of means based on t test for independent samples, comparison of proportions based
on chi square test of independence.
26
TABLE 2 Gender Comparisons of Mean Cognitive Ability (WISC-R) Scores at 8, 9 Years
Measure Sample Size Female Male p1
WISC-R Verbal IQ
8 years 881 100.5 101.6 >.30
9 years 811 100.2 101.8 >.15
WISC-R Performance IQ
8 years 881 102.8 102.8 >.90
9 years 811 106.5 107.5 >.30
WISC-R Total IQ
8 years 881 101.5 102.2 >.40
9 years 811 103.4 104.8 >.20
1 Based on t test of means for independent samples
27
TABLE 3 Gender Comparisons of Mean Teacher Ratings of Disruptive Behaviours
at 6,8,10,12 Years
Measure Sample Size Female Male p1
6 Years
Attentional problems 1110 97.1 102.8 <.0001
Conduct problems 1110 98.3 101.7 <.0001
8 Years
Attentional problems 1083 97.1 102.8 <.001
Conduct problems 1083 97.8 102.1 <.0001
10 Years
Attentional problems 1056 96.9 103.1 <.0001
Conduct problems 1056 97.6 102.3 <.0001
12 Years
Attentional problems 1007 97.1 102.9 <.0001
Conduct problems 1007 98.2 101.8 <.0001
1 Based on t test of means for independent samples
28
TABLE 4 Gender Comparisons of Standardised Test Scores, Teacher Ratings of School Performance
and 18 Year Educational Outcomes Adjusted for Teacher Ratings of Disruptive Childhood
Behaviours
Measure Female Male p
SignificantControl
Variables
Standardised Tests
Mean Burt Word Reading Score (8 years) 45.6 44.5 >.30 1,2
Mean Reading Comprehension PAT Score (10 years) 10.6 10.2 >.30 1
Mean Mathematical Reasoning PAT Score (11 years) 24.6 25.3 >.15 1
Mean Reading Comprehension PAT Score (12 years) 12.8 13.0 >.50 1
Mean TOSCA Score (13 years) 34.8 34.6 >.90 1
Teacher Ratings (% Poor/Very Poor)
Reading (8 years) 12.8% 17.5% <.05 1,2
Written Expression (8 years) 18.8% 20.5% >.30 1,2
Spelling (8 years) 19.3% 22.7% >.10 1,2,5
Mathematics (8 years) 16.3% 15.2% >.60 1
Reading (12 years) 13.3% 13.7% >.80 1-4
Written Expression (12 years) 16.4% 18.6% >.30 2,3,5
Spelling (12 years) 18.0% 21.5% >.10 1-5
Mathematics (12 years) 21.6% 19.2% >.15 1,2
18 Year Outcomes
Mean Burt Word Reading Score 96.5 97.5 >.30 1
% Reading age <12 years 8.2% 8.9% >.60 1
Mean no. of A, B or C grades in School Certificate 3.3 3.3 >.90 1
% Left school with no qualifications 19.7% 18.6% >.60 1
Significant Control Variables: 1 = Attentional problems 6 years; 2 = Attentional problems 8 years; 3 =
Attentional problems 12 years; 4 = Conduct problems 6 years; 5 = Conduct problems 8 years.


![Class Differences in Achievement[1]](https://img.pdfslide.net/doc/110x75/552f05784a7959195e8b4b6c/class-differences-in-achievement1.jpg)