Embed Size (px)
Citation preview
3
Gender Issues in Human Capital
Introduction
A nation’s stock of human capital influences economic growth, productivity, and, ulti-mately, poverty reduction. Investing in the building blocks of human capital—educa-tion and health—has both direct and indirect effects on economic growth, but also on poverty reduction. The socialist legacy of investment in education and health for both men and women in Europe and Central Asia has provided an important foundation for the majority of the countries as they have embarked on a significant transformation and liberalization of their economies and on global integration. This stock of human capital is all the more valuable now because of the demographic transition occurring in the region and the decline in population in 21 of the 30 countries. The shrinking popula-tion underscores the importance of using available human resources more effectively in terms of the share of the population that is economically active, as well as the productiv-ity of the population.
Recent analytical work has laid the foundation of knowledge on the broad edu-cation and demographic issues facing the region. The report “From Red to Gray: The Third Transition of Aging Populations in Eastern Europe and the Former Soviet Union” (Chawla, Betcherman, and Banerji 2007) analyzes the implications of the aging popula-tions and relatively weak institutions in low- and middle-income countries. The study “Skills, Not Just Diplomas: Managing for Results in Education Systems in Eastern Eu-rope and Central Asia” (Sondergaard and Murthi 2012) discusses the lagging perfor-mance of the education sector, primarily in terms of the quality and flexibility of cur-ricula to facilitate lifelong learning, an important characteristic of education systems in rapidly changing economic environments. The analysis in this chapter adds a gender
1

Opportunities for Men and Women: Emerging Europe and Central Asia4
emphasis to some of the conclusions reached in these reports.
The chapter contains three main messages, as follows:
◆ The countries of Europe and Central Asia have achieved gender parity in primary edu-cation and, to a lesser degree, in secondary education. However, there are gender gaps in tertiary education that are large and show the potential to widen.
◆ The demographic transitions in the region are dramatic. The aging of the population will lead to large numbers of elderly women. In countries with growing populations, there will be proportionately more women of working age, which should provide an oppor-tunity to these countries to expand the pool of educated labor.
◆ Several health indicators in the countries of the region are better than the correspond-ing indicators in many developing countries at similar levels of income, especially the in-dicator on maternal mortality. Yet, other in-dicators show a lag, such as male life expec-tancy, which is exceptionally low in selected countries considering the income levels. Moreover, a gender imbalance has begun to emerge in some countries among young chil-dren, and this is cause for concern.
The rest of the chapter is structured as fol-lows. The next section provides an overview of primary, secondary, and tertiary outcomes in edu-cation. The third section discusses demographic transitions. The fourth section reviews key health indicators, such as life expectancy, mortality rates, fertility, and missing women. The health and edu-cation indicators cover the current situation, but also trends over time so as to capture changes in the gender gap. Where possible, a comparison is made between Europe and Central Asia and other regions of the world, including the high-income countries of the Organisation for Economic Co-operation and Development (OECD). The final section offers an analysis of the implications for a policy response.
Gender Differences in Education
Education plays an important role in raising the quality of human capital and helping people be-come more productive in their personal and profes-sional lives. The countries of Europe and Central Asia invest heavily in the education of their citizens at all levels of schooling. The governments and the citizenry in these countries have an established tra-dition of educating both girls and boys. In the past, this set the region apart from the rest of the world through narrow gender gaps in literacy rates, but the situation is now changing, and the gender gaps in education are narrowing in all regions.4
This section provides a description of the successes and challenges in gender equality in the educational systems in the region. There have been significant and broadly based successes, but subtle challenges are also emerging. In the discussion, we review the status of male and female outcomes at the primary, secondary, and tertiary levels. In ad-dition, several of the countries in the region par-ticipate in an international assessment of students that allows us to examine the presence of a gender gap in capabilities. Finally, we focus especially on developments in tertiary education, including en-trenched and emerging trends.
Primary EducationThe region continues to perform well in providing primary education to both girls and boys. Though there are concerns about selected countries (for example, Azerbaijan and the Kyrgyz Republic) in which almost a fifth of the relevant population is not enrolled in primary school and other countries in which completion rates are not universal (for ex-ample, Albania), these problems do not appear to reflect a gender bias. Despite the importance placed on education in the region and the significant eco-nomic growth experienced for much of the last
4 Literacy rates among men and women in Europe and Central Asia are 97 and 99 percent, respectively, com-pared with the corresponding world averages of 79 and 83 percent.

Gender Issues in Human Capital 5
decade, there is a substantial share of working chil-dren, especially boys, in some countries (the former Yugoslav Republic of Macedonia and Ukraine). The scarcity of data makes it difficult to draw conclu-sions on the prevalence of this problem or the nega-tive long-term consequences for children who carry the dual burden of work and school.
Primary enrollment rates among girls and boys are high in the region and comparable with the world average. The region’s net primary enrollment rates are comparable with the world average (see figure 1.1). In the region, the net primary enrollment rates among girls and boys are 92 percent; they show no significant gender gap. The region’s traditional ad-vantage in this area is eroding because the gap in net primary enrollment rates by gender has been closing in most parts of the world, including in low-income regions. The world averages of net primary enrollment rates among girls and boys are 87 and 89 percent, respectively, indicating that the next generation of women and men in many parts of the world will be as well educated as their counterparts in Europe and Central Asia. Only the quality and the relevance of education will set any country or region apart from others.5
Even in countries with below average primary enrollment rates, the gender gap is small. In many countries, low primary rates are driven by a lack of female enrollments; however, this is not the case in Europe and Central Asia. The countries with the lowest net primary enrollment rates among girls in 2009 were Albania, Armenia, Azerbaijan, the Kyrgyz Republic, FYR Macedo-nia, Moldova, and Uzbekistan (83–86 percent range). Primary enrollment rates among boys in these countries fall in the same low range. The average gender gap in primary enrollment rates is negligible, and the standard deviation is small. The countries with the largest gaps are Tajikistan and Uzbekistan, though the differences are small (between 2 and 4 percentage points). At the oth-er extreme are Armenia and the Czech Republic,
FIGURE 1.1 Primary Education: A Regional Comparison
ECA
a. Primary net enrollment rates, 2009percentage
b. Enrollment rates by income quintile%, by gender
40
60
50
70
80
90
100
60
70
80
90
100
Female Male
Bottom Second Third Fourth Top
Population quintile by consumption per capita
ECA
Female
ECA
Male
Bulgaria
Female
Bulgaria
Male
OECD LAC MNA SAS SSA WLD
Sources: World Development Indicators Database, World Bank, Washington, DC, http://data.worldbank.org/data-catalog/world-development-indicators/; Europe and Central Asia Data (database), World Bank, Washington, DC, http://data.worldbank.org/region/ECA.Note: ECA = Europe and Central Asia. LAC = Latin America and the Caribbean. MNA = Middle East and North Africa. OECD = high-income OECD countries. SAS = South Asia. SSA = Sub-Saharan Africa. WLD = World. All regional data are for developing countries only. Data for South Asia is for 2008. The Europe and Central Asia region average enrollment rates by income quintile are based upon the latest available data. Data for Bulgaria and Hungary are for 2007, and data for Albania, Azerbaijan, and Lithuania are for 2008. The rest of the countries are Kazakhstan, Latvia, Moldova, FYR Macedonia, Poland, the Russian Federation, Tajikistan, and Ukraine (all 2009).
5 In countries where many children enter school late or repeat grades, gross enrollment rates are high (and can exceed 100 percent). In Europe and Central Asia, net enrollment rates are high, but gross enrollment rates do not indicate whether most children in school are at the age-relevant grade levels. Net enrollment rates are reported less often.

Opportunities for Men and Women: Emerging Europe and Central Asia6
where the gender gap of 3 percentage points is caused by lower male enrollment rates.
The average gender gap in primary comple-tion rates in the region is small, though, in a hand-ful of countries, there does appear to be some disparity between boys and girls. The average pri-mary completion rates for girls and boys were 95 and 96 percent, respectively, in the region in 2009. This gap is comparable with the gap in Latin America and the Caribbean. Though the average difference between the completion rates among girls and boys is small, Georgia and Latvia stand out in terms of the gender gap, which is about 6 percentage points.6 In Lithu-ania, Tajikistan, and Turkey, boys lead girls by about 4 percentage points in primary school completion rates, while, in Armenia, the oppo-site is true (figure 1.2). Though the gap in any year is small, this inequity will lead to illiteracy among a limited, but significant share of the adult female population.
The region shows little variation in school en-rollment rates among young children across income groups. The difference in enrollment rates be-tween the bottom and top deciles among boys and girls (ages 7–12 years) is small, at 1 and 2 percentage points, respectively, for the region as
a whole (figure 1.1). This equitable trend across genders and income groups occurs in most coun-tries; the exceptions are Albania, Bulgaria, and FYR Macedonia. For example, Bulgaria exhibits both income disparities and gender disparities. Almost 20 percent more 7- to 14-year-old girls in the highest income quintile attend school rela-tive to the lowest quintile. Albania exhibits the opposite trend, with 13 percent more girls in the lowest quintile attending school relative to the top quintile. To understand the causes of these variations, one must see whether these children who were out of school were economically active, and one must also examine the attitudes of the parents of these children toward schooling.
Young boys are more likely than young girls to be economically active. The data on child em-ployment are limited, and only a few countries report these statistics. The largest gender gaps are found in Albania and FYR Macedonia (fig-ure 1.2). The countries in the region with the highest proportion of economically active chil-
FIGURE 1.2 Primary Enrollment Rates and Working Children by Gender, Selected Countries
a. Primary completion rates, 2009percentage point difference in male and female rates b. Economically active children
Female Male
–6
–4
–2
0
2
4
6
8A
rmen
ia
Esto
nia
Mac
edon
ia,
FYR
Turk
ey
Lith
uani
a
Tajik
ista
n
Geo
rgia
Latv
ia
05
10152025303540
Turk
ey
Kaz
akhs
tan
Aze
rbai
jan
Kyr
gyz
Rep
ublic
Uzb
ekis
tan
Ser
bia
Mac
edon
ia,
FYR
Tajik
ista
n
Bos
nia
and
Her
zego
vina
Bel
arus
Ukr
aine
Alb
ania
Geo
rgia
Source: World Development Indicators Database, World Bank, Washington, DC, http://data.worldbank.org/data-catalog/world-development-indicators/.Note: Panel a: data are for 2009 for all observations except 2007 for Belarus and 2008 for Turkey. Panel b: data are for the most recent year available (2005 or 2006).
6 However, this should be seen against the backdrop of strong improvements over the last decade among both boys and girls: the rates have grown by 16 and 12 per-centage points in Georgia, respectively.

Gender Issues in Human Capital 7
dren (ages 7–14 years) are Georgia and Ukraine, where 32 and 17 percent of children are work-ing, respectively.7 Over 90 percent of children who are economically active are also studying, except in Turkey, where only 60 percent of these children also attend school. In most coun-tries for which data are available, boys are more likely to work than girls; the exception is Ta-jikistan.8 Yet, this may be an incomplete picture since girls may be engaged in household chores and other unpaid family work elsewhere as well.
Secondary EducationSecondary education enhances a population’s social and economic opportunities. It provides students with marketable skills and increases their productiv-ity in the workplace. Economies that are more so-phisticated in terms of the production or the com-plexity of institutions require higher levels of human capital input. Secondary education also prepares students to continue on to college and university. Thus, a gender gap at the secondary school level has large implications for the long-term career opportu-
nities of students and, consequently, for the income and household welfare of these young people.
Girls are falling behind in secondary enrollment in Europe and Central Asia relative to the high-income OECD countries. The decades of the 1990s and 2000s saw an increase in secondary enrollment rates among girls, though this was outpaced by the growth in enrollment rates among boys. The gender gap was relatively small as measured by the ratio between the respective gross secondary enrollment rates among girls and boys, which was 0.96, meaning that, for every 100 boys in school, there were 96 girls. This compares unfavorably with the high-income OECD countries, in which gross enrollment rates are 101 and 102 for girls and boys, respectively (figure 1.3). Though the gender gap in the region is not large and the changes over a decade appear small, they have accumulated over time rather than reversed. A broader concern is the fact that school enrollments
FIGURE 1.3 Secondary School Enrollment and Academic Performance, 2009
a. Gross enrollment rates by genderpercent
b. PISA, Europe and Central Asiascores
0
20
40
60
80
120
100
Female Male
ECA OECD EAP LAC WLD300
320
340
360
380
400
420
440
460
480
Reading Math Science
Sources: World Development Indicators Database, World Bank, Washington, DC, http://data.worldbank.org/data-catalog/world-development-indicators/; PISA 2009 Profiles by Country/Economy (database), Programme for International Student Assessment, OECD, Paris, http://stats.oecd.org/PISA2009Profiles/#.Note: EAP = East Asia and the Pacific. ECA = Europe and Central Asia. LAC = Latin America and the Caribbean. OECD = high-income OECD countries. WLD = World. For a description of PISA, see the text. Panel b: PISA scores are for the EU10 (the 10 European Union countries of Central and Eastern Europe, that is, Bulgaria, the Czech Republic, Estonia, Hungary, Latvia, Lithuania, Poland, Romania, the Slovak Republic, and Slovenia), Albania, Azerbaijan, Croatia, Kazakhstan, the Kyrgyz Republic, Montenegro, Russia, Serbia, and Turkey.
7 This assertion is based on 2005 data, which are the lat-est available data.
8 In recent years, this gap has likely widened because of migration and poverty in rural areas.

Opportunities for Men and Women: Emerging Europe and Central Asia8
in general are not rising to converge with the high-income OECD countries among boys or girls.
Secondary enrollment rates among girls and boys are high in the countries of the region relative to other low- and middle-income countries, and the gender gap in secondary schools is relatively small, which is similar to other regions of the world. The gross secondary en-rollment rates in the region are 87 and 91 percent for girls and boys, respectively. Though these rates are below the gross enrollment rates among girls in Latin America and the Caribbean, this is somewhat misleading. When we compare net secondary school enrollment rates in Europe and Central Asia and in Latin America and the Caribbean, we find that not only does Europe and Central Asia perform com-paratively better, but that the gender gap narrows additionally.9 The net enrollment rates among girls and boys in Europe and Central Asia are 80 and 82, respectively, compared with 76 and 71 percent, re-spectively, in Latin America and the Caribbean.
The low-income countries in Central Asia show higher secondary enrollment rates among girls relative to other low-income countries. In the Kyrgyz Republic and Tajikistan, enrollment rates among girls were 85 and 78 percent, respectively, in 2009. These are significantly higher than the average female second-ary gross enrollment rate in low-income countries, which was 34 percent in 2009. Furthermore, the average ratio of male to female enrollment rates in low-income countries was 1.36, whereas, for the Kyrgyz Republic and Tajikistan, the ratios were 0.99 and 1.15, respectively, indicating a greater degree of gender equality in these countries.
Tajikistan and Turkey are the two outliers in terms of the gender gap in secondary enrollment rates. In almost all the countries in the region, there is a strong correlation between male and female sec-ondary school enrollment rates, with the exception of Tajikistan and Turkey. The gender gap in both of these countries is between 7 and 10 percentage points in favor of boys. In Tajikistan, net secondary school enrollment rates among girls and boys are 77 and 88 percent, respectively, while, in Turkey, the respective rates are 70 and 77 percent. In Tajiki-stan, the lower enrollment rates among girls may be caused by the lack of an adult male presence (aris-ing from out-migration), large families, and above
average adolescent fertility rates; however, more re-search needs to be conducted to determine the main correlates.
Among 15- to 17-year-olds, though poor children have lower enrollment rates than richer children, the average gender gap by income quintile is low in the re-gion. The gender gaps in each income quintile are negligible in the region, indicating that the disad-vantage of poor children is the same irrespective of whether they are girls or boys (see the case of Alba-nia in figure 1.4). This is, indeed, largely true across the region, though there are exceptions. In three countries, there is at least a 10 percentage point dif-ference between the enrollment rates of girls and boys in the first quintile: Bulgaria, FYR Macedonia, and Tajikistan. The gender gap in Bulgaria and Ta-jikistan—where poor girls are less likely than boys to attend secondary school—is the opposite of the gender gap in FYR Macedonia. However, the gen-der gap is not at the same magnitude, if it exists at all, in the top quintile in these same countries.
In the region, girls perform better than boys in learning outcomes in reading, but have similar scores in mathematics and science. The OECD Programme for International Student Assessment (PISA) sur-veys test 15-year-olds in three subject areas. In the 2009 round, 65 countries were surveyed, includ-ing 18 countries in Europe and Central Asia. These were a diverse group of low- and middle-income countries.10 The average score of girls on reading was 11 percent higher than the corresponding aver-age for boys, a significant difference. The average scores for boys and girls on mathematics and sci-ence were similar.11 This differential pattern in gen-der scores is not unique to the region.
9 Net enrollment rates are available only for Europe and Central Asia, Latin America and the Caribbean, and the Middle East and North Africa.
10 The countries in the region participating in the 2009 PISA were Albania, Azerbaijan, Bulgaria, Croatia, the Czech Republic, Estonia, Hungary, Kazakhstan, the Kyrgyz Republic, Latvia, Lithuania, Montenegro, Poland, Romania, Serbia, the Slovak Republic, Slove-nia, and Turkey.
11 The ratios for boys to girls in mathematics and science were 0.99 and 1.02, respectively. The difference is not statistically significant.

Gender Issues in Human Capital 9
Tertiary EducationTertiary education extends the period of educa-tion and learning among students. It allows young adults to acquire more specialized knowledge, while continuing to develop their cognitive and in-tellectual skills, all of which combines to improve their productivity in the work force. Yet, one gener-ally does not strive to make tertiary education, un-like the primary and secondary levels, universally available to the population, nor is the content of curricula uniform.
Tertiary enrollments are growing at a rapid pace, raising the question of the impact on quality and on the returns to education, especially among women. During the decade of 1998–2009, there was a rap-id increase in tertiary enrollment rates in general in the region. Gross tertiary enrollment rates grew, on average, by 25 and 15 percentage points among women and men, respectively. Though it appears that women are investing more in education over time (in both absolute and relative terms), it is not clear whether the resources and the quality of tertiary education can keep pace with the rapid in-crease in enrollments.
In the vast majority of countries in the region, fe-male tertiary enrollment rates outstrip male tertiary enrollment rates. The three countries that are the ex-
ception are Tajikistan, Turkey, and Uzbekistan, in which the ratio of female to male rates ranges from 41 to 70. On average in the region, tertiary gross en-rollment rates among women and men are 60 and 44 percent, respectively, and the average ratio is 129 women for every 100 men attending colleges and universities. This pattern of disproportionately higher female enrollment in tertiary education is global, including in the high-income OECD coun-tries. However, women are less likely than men to pursue postgraduate work.
The richer the country, the more likely women will be disproportionately more well represented than men in tertiary education. In the region, the tertiary enroll-ment rates grow as gross domestic product (GDP) per capita increases (figure 1.5). However, relative to the male enrollment rate, the female enrollment rate is more strongly correlated with a country’s GDP per capita. As figure 1.5 reveals, there is significant varia-tion among countries, and some clustering at the up-per end of the distribution. This pattern also occurs at the global level. In low-income countries, tertiary enrollment rates are low, and female enrollment rates are much lower than male enrollment rates. In lower-middle-income countries, the gender gap in enrollment rates is negligible, while it grows dramati-cally among upper-middle-income countries.
FIGURE 1.4 School Enrollment Rates among 15- to 17-Year-Olds by Income Quintile, 2009
b. Gender gaps, bottom and top quintilespercentage points
a. By genderpercent of 15- to 17-year-olds
40
50
60
70
80
90
100
Bottom quintile Top quintile
Bottom Second Third Fourth Top
Population quintile by consumption per capita Population quintile by consumption per capita
ECA
Female
ECA
Male
Bulgaria
Female
Bulgaria
Male
–30
–20
–10
0
10
20
30
Macedonia,FYR
Moldova Latvia Albania Bulgaria Tajikistan
Source: Europe and Central Asia Data (database), World Bank, Washington, DC, http://data.worldbank.org/region/ECA.Note: The gender gap is the difference between the enrollment rates of boys and girls. ECA = Europe and Central Asia. The data are the latest available data between 2007 and 2009. Panel a: ECA average includes Albania, Azerbaijan, Bulgaria, Hungary, Kazakhstan, Latvia, Lithuania, Moldova, FYR Macedonia, Poland, Russia, Tajikistan, and Ukraine.

Opportunities for Men and Women: Emerging Europe and Central Asia10
The gender gap in tertiary education has been widening steadily over the last decade. The differen-tial in gross enrollment rates by gender in the early years of the transition appeared to be relatively nar-row, though this cannot be verified because of the sparseness of the data. However, since 1998, time series statistics on tertiary enrollment rates disag-gregated by gender have been available for 23 coun-tries in the region. Over the period 1998–2008, the gender ratio (in favor of girls) grew from 113 to 128 in the region. This was the result of the higher pace of tertiary enrollments among women rela-tive to men (7 versus 5 percent per annum). This feminization of tertiary education is occurring at a more rapid pace in Europe and Central Asia than in high-income OECD countries, where the ratio increased from 116 to 129 over this same period. In only three countries—Azerbaijan, Tajikistan, and Uzbekistan—did male tertiary enrollments outpace female tertiary enrollments.
At the tertiary level, women constitute almost half the science and engineering students in Europe and Central Asia. This regional average is compa-rable with women’s participation in these fields in the United Kingdom and the United States, where 50 and 43 percent, respectively, of all science and
engineering students are women. In Europe and Central Asia, the average is 46 percent; the high-est participation rates are in Albania, Estonia, and Latvia. Almost half the women in the region pur-sue degrees in the social sciences, business, and law; health care, education, and welfare-related subjects are the second largest category.
The gender differential in fields of study related to education has an effect on occupational segregation and the gender wage gap. A recent study by Flabbi (2011), which was prepared as a background paper for World Development Report 2012 (World Bank 2011a), examines the impact of the choice of the field of study on future labor market outcomes in 13 European countries, including the Czech Re-public and Estonia. Three of the main conclusions of the study are relevant to Europe and Central Asia. First, women tend to choose education, the humanities, and health care as their field of study, while men choose the sciences, mathematics, ag-riculture, and veterinary medicine. In the social sciences, business, and law, the gender differen-tial varies by country: for the two countries in the Europe and Central Asia region that are included in the study, there is no gender differential. Sec-ond, the gender differential in the field of study
FIGURE 1.5 Tertiary Education by Gender, 2009
Science& eng
Socialsciences
Educ, health,welf
Other
a. Enrollment rates by GNI per capita%, by gender
b. Students% of students, by gender
0
20
40
60
80
120
100
Female MaleFemale Male
0
5
10
15
20
25
30
Log of GNI per capita, PPP
3.0 3.5 4.0 4.5
7
26
14
10
15 15
4
9
Sources: World Development Indicators Database, World Bank, Washington, DC, http://data.worldbank.org/data-catalog/world-development-indicators/; UNECE Statistical Database, United Nations Economic Commission for Europe, Geneva, http://w3.unece.org/pxweb/.Note: GNI = gross national income. PPP = purchasing power parity. Eng = engineering. Educ = education. Welf = Welfare. Social sciences includes business and law. Other = agriculture, the humanities, services, and unspecified fields. Panel b: the data are for 2009 or the latest available year.

Gender Issues in Human Capital 11
is not explained by (observable) individual char-acteristics. The only difference between men and women is the effect of ability on the probability of choosing the sciences or mathematics. Persons of high ability (measured by top grades in secondary school) are more likely to pursue study in these fields, and the effect of ability is larger among men than among women. Third, the field of study is im-portant in future labor market outcomes, particu-larly in the choice of occupation and in the gender gap in earnings.
Demography
Though the pace of changes in population profiles may appear relatively slow, the changes have large implications for the societies in which they occur. Demographic shifts can easily be overlooked be-cause the age and gender profile of a population remains relatively stable over the period in which most policies are designed and implemented. How-ever, this prevents policy makers from reorienting public expenditures gradually, but systematically to meet the transformation in the needs of citizens. An understanding of demographic shifts can help governments shape public expenditures across a wide range of areas, most obviously in the social
sectors of health and education, but also in physi-cal infrastructure.
The dramatic demographic changes in the majority of countries in Europe and Central Asia have brought this issue to the forefront. Many pol-icy makers are aware of these changes, but much remains to be done at the national level to incor-porate the implications of the demographic transi-tion for public expenditures and policies. Medium- and long-term national economic development plans and strategies should reflect this information, though it is not clear that this is being done con-sistently in any country in the region. This section discusses some of the key changes pertaining to women and men as separate groups. Demographic changes can have different implications for men and women given their frequently different roles in the private and public spheres.
The demographic transition represents the shift from high fertility rates and high death rates to low fertility rates and low death rates over a pe-riod of decades or centuries (see table 1.1). The countries in Europe and Central Asia are experi-encing different stages of the demographic transi-tion, though at a far more rapid rate than Western Europe and North America. The demographic changes in the region have different implications for men and women, which are magnified because
TABLE 1.1 | Demographic Profiles and Fertility
Profile
High fertility and window of opportunity
Low fertility and window of opportunity
Sex imbalance at birth
Large increase in the share of elderly women
Moderate increase in the share of elderly women
Young population; population pyramid with large base and skinny top
Kyrgyz Republic, Tajikistan, Turkmenistan, Uzbekistan
Aging population; population pyramid with balanced age structure
Armenia; Bosnia and Herzegovina; Kazakhstan; Macedonia, FYR; Moldova
Armenia; Azerbaijan; Macedonia, FYR
Aged population; population pyramid with small base and wide top
Belarus, Bulgaria, Estonia, Hungary, Latvia, Lithuania, Russian Federation, Ukraine
Croatia, Czech Republic, Georgia, Montenegro, Poland, Romania, Serbia, Slovak Republic, Slovenia
Source: Chawla, Betcherman, and Banerji (2007).Note: Window of opportunity refers to an increase in the number of the potentially economically active population (between the ages of 20 and 59).

Opportunities for Men and Women: Emerging Europe and Central Asia12
many of these societies—even the wealthier soci-eties—have incomes per capita that are relatively modest. Each stage of the demographic transition poses challenges that need to be addressed in the near future to benefit from the window of opportu-nity or to manage more effectively the consequenc-es of large structural changes.12
Yet, the various demographic transitions will lead, in the next two decades, to a higher proportion of elderly persons, particularly elderly women. Dur-ing the next several decades, though the total pop-ulation of the region is not expected to change (a −0.1 percentage decrease), there will be a dramatic change in the age structure of the population. The share of the population above 60 years of age will rise sharply, from 15 percent in 2009 to 25 percent in 2025 and 35 percent in 2050. Moreover, this change in the age structure will not be gender neu-tral (figure 1.6).
The demographic transition in most of Central Asia is characterized by growth in the share of the population of prime age, providing an opportunity for greater economic growth. The four countries that fall into this category are the Kyrgyz Republic, Tajikistan, Turkmenistan, and Uzbekistan. These countries are moving rapidly from the population explosion phase, with a proportionately large share of children, to the window of opportunity phase, with more working-age persons. The proportion of the population between 20 and 40 years of age will rise from 30 to 33 percent between 2000 and 2025. Consequently, the demands on key public services such as maternal and child health, as well as the continued demand for education services at all levels will continue. The working population be-tween 40 and 60 years of age will more than double among men (110 percent) and women (114 per-cent) during 2000–25.
Yet, for Central Asia to benefit from the demo-graphic window of opportunity, women of prime age need government support to facilitate their entry into the labor market, and especially into productive jobs. Sev-eral of the Central Asian countries have seen large out-migrations of working-age men and the resulting feminization of the population. However, because of the lack of incentives and economic opportuni-ties, many women remain either economically inac-
tive or in low-productivity jobs, such as subsistence farming. One key area of support in this high-fertility subregion would be the provision of some type of childcare services, combined with social assistance for low-income single-parent households.
In a diverse group of countries in Europe and Central Asia, there will be more working-age women and fewer children in absolute terms. The countries in the demographic window of opportunity are Al-bania, Armenia, Azerbaijan, Bosnia and Herzegovi-na, Kazakhstan, FYR Macedonia, and Moldova. For this group of countries, the number of children will fall by 1.9 million during 2000–25, while the num-ber of women between 20 and 59 years of age will increase by 0.98 million during the same period. Though these societies will experience declining fertility, the needs of the growing share of work-ing women for family-friendly policies and services (for example, childcare) will remain equally rel-evant compared with Central Asia and, possibly, even more relevant depending on the strength of informal family safety nets.
The decline in fertility in some of the countries showing the demographic window of opportunity has been accompanied by a substantial sex imbalance at birth. Three of the countries characterized by a shift toward the demographic window of opportu-nity show unbalanced sex ratios at birth. In Arme-nia, Azerbaijan, and FYR Macedonia, the number of missing girls is extremely high and comparable with the levels in China, India, and the Republic of Korea. Missing girls at birth reflect covert discrimi-
12 Demographers classify population pyramids according to four types, as follows: (a) demographic explosion in young populations, (b) demographic window of oppor-tunity, (c) demographic implosion, and (d) demographic hourglass. The demographic explosion is the pyramid with a large base and skinny top, while the demographic implosion is the opposite, a pyramid with a small base and a wide top. The demographic window is character-ized by a high proportion of the working-age popula-tion while the demographic hourglass has parts of the working-age population missing and a large elderly pop-ulation. Countries described by the demographic hour-glass show a rising dependency ratio, which reduces the potential of economic growth and increases the vulner-ability of households to poverty.

Gender Issues in Human Capital 13
nation in the household, resulting from a combina-tion of strong preferences for sons, declining fertil-ity, and prenatal sex determination. This problem has not been sufficiently studied in the region and calls for greater attention.
In the countries in the window of opportunity phase of the demographic transition, the aging of the population has begun, and this has important conse-quences for elderly women. In 2009, the proportion of the population above the age of 60 years was 11
FIGURE 1.6 Population Pyramids, Selected Countries and the Region, 2000, 2025, 2050
a. ECA – all countries but Turkey, 2000
0–4
–20,0
00
–10,0
00 0
10,0
00
20,0
00
10–14
20–24
30–34
40–44
50–54
60–64
70–74
80–84
90–94
100+
b. ECA – all countries but Turkey, 2025
0–4
–20,0
00
–10,0
00 0
10,0
00
20,0
00
10–14
20–24
30–34
40–44
50–54
60–64
70–74
80–84
90–94
100+
c. ECA – all countries but Turkey, 2050
0–4
–20,0
00
–10,0
00 0
10,0
00
20,0
00
10–14
20–24
30–34
40–44
50–54
60–64
70–74
80–84
90–94
100+
d. ECA – young population countries, 2000
0–4
–3,0
00
–2,0
00
–1,0
00 0
2,0
00
1,0
00
3,0
00
10–14
20–24
30–34
40–44
50–54
60–64
70–74
80–84
90–94
100+
e. ECA – young population countries, 2025
0–4
–3,0
00
–2,0
00
–1,0
00 0
1,0
00
3,0
00
2,0
00
–3,0
00
–2,0
00
–1,0
00 0
1,0
00
3,0
00
2,0
00
10–14
20–24
30–34
40–44
50–54
60–64
70–74
80–84
90–94
100+
f. ECA – young population countries, 2050
0–4
10–14
20–24
30–34
40–44
50–54
60–64
70–74
80–84
90–94
100+
Female Male
g. ECA – aging population countries, 2000
0–4
–3,0
00
–2,0
00
–1,0
00 0
1,0
00
2,0
00
10–14
20–24
30–34
40–44
50–54
60–64
70–74
80–84
90–94
100+
h. ECA – aging population countries, 2025
0–4
–2,0
00
–1,0
00 0
1,0
00
2,0
00
10–14
20–24
30–34
40–44
50–54
60–64
70–74
80–84
90–94
100+
j. ECA – aging population countries, 2050
0–4
–2,0
00
–1,0
00 0
1,0
00
2,0
00
10–14
20–24
30–34
40–44
50–54
60–64
70–74
80–84
90–94
100+
(Continues to next page)

Opportunities for Men and Women: Emerging Europe and Central Asia14
percent in the region, of which almost two-thirds (59 percent) were women. Because of the acceler-ated aging, the proportion of the elderly will rise to 22 percent, of which 57 percent will be women by 2025. The higher proportion of elderly women has potential fiscal ramifications through the pension and social protection systems.
The majority of countries in Europe and Cen-tral Asia are aging rapidly, and the number of em-ployable persons is falling. A total of 17 countries in the region are experiencing a demographic implo-sion.13 The number of persons between the ages of 20 and 60 years will fall from 182 million to 162 million between 2000 and 2025, equal to an 11 percent decrease. To prevent a sharp decline in economic activity, one might try to maintain the size of the labor force by attracting temporarily or permanently inactive women and retaining work-ing women in the labor force for a longer period of time by delaying retirement (so that it is equal to men’s retirement age). Yet, to achieve higher female labor force participation, the supporting institutional infrastructure (for example, child-
care and appropriate parental leave) needs to be in place, and there need to be changes in retire-ment laws.
Health
Along most health indicators, the region is converging toward the high-income OECD countries. In most of the indicators on demography and health, the re-gion performs well compared with Latin America or East Asia. Though the region lagged behind the OECD at the beginning of the transition, most in-dicators have converged during the past decade. However, there is significant diversity in the region: selected countries show health indicators similar to those in other, less-developed regions.
FIGURE 1.6 Population Pyramids, Selected Countries and the Region, 2000, 2025, 2050. (Continued)
j. ECA – aged population countries, 2000
Female Male
0–4
–15,0
00
–10,0
00
–5,0
00 0
10,0
00
5,0
00
15,0
00
10–14
20–24
30–34
40–44
50–54
60–64
70–74
80–84
90–94
100+
k. ECA – aged population countries, 2025
0–4
–15,0
00
–10,0
00
–5,0
00 0
10,0
00
5,0
00
15,0
00
–15,0
00
–10,0
00
–5,0
00 0
10,0
00
5,0
00
15,0
00
10–14
20–24
30–34
40–44
50–54
60–64
70–74
80–84
90–94
100+
l. ECA – aged population countries, 2050
0–4
10–14
20–24
30–34
40–44
50–54
60–64
70–74
80–84
90–94
100+
Source: World Bank staff calculations based on UN (2009a).Note: Young countries include the Kyrgyz Republic, Tajikistan, Turkmenistan, and Uzbekistan. The aging countries are Albania, Armenia, Azer-baijan, Bosnia and Herzegovina, Kazakhstan, FYR Macedonia, and Moldova. Aged countries are Belarus, Bulgaria, Croatia, the Czech Republic, Estonia, Georgia, Hungary, Latvia, Lithuania, Montenegro, Poland, Romania, Russia, Serbia, the Slovak Republic, Slovenia, and Ukraine. Each bar represents a five-year age-group. Women are indicated in blue; men are indicated in red.
13 The countries are Belarus, Bulgaria, Croatia, the Czech Republic, Estonia, Georgia, Hungary, Latvia, Lithuania, Montenegro, Poland, Romania, the Russian Federation, Serbia, the Slovak Republic, Slovenia, and Ukraine.

Gender Issues in Human Capital 15
Life Expectancy and MortalityTwo drivers are determining the forecasted demo-graphic transition: changes in mortality rates and changes in fertility rates. Mortality rates and health outcomes have dramatically improved in the re-gion; in particular, during the last decade, the mor-tality rate has somewhat improved among men, leading to a contraction of about a year in the gen-der gap in life expectancy. However, the high male mortality rate relative to the female mortality rate is persisting in many countries. This is associated with a variety of factors, including alcohol abuse.
The gender gap in life expectancy in the region is larger than the global average, including Western Eu-rope, and varies greatly across countries within the re-gion. As a general average, women can be expected to outlive men by four years, but, in Europe and Central Asia, this difference is seven years (figure 1.7). In all the countries in the region, the differ-ence in life expectancy surpasses the world average of four years. In the countries in which the gap is smaller (Azerbaijan, FYR Macedonia, Montenegro, Serbia, and Turkey), the difference is only slightly more than four years. However, the gap is three times larger in Belarus, Kazakhstan, Lithuania, and
the Russian Federation. The large gap in life expec-tancy may be driven by the high adult male mortal-ity rate observed in some of these countries.
The gender gap in life expectancy in the coun-tries of the region needs to be narrowed. The average change in the gap in life expectancy in the region has closed by one year; however, the variability in the change in the gap in life expectancy is large (measured by statistical variance) (figure 1.8). In Bosnia and Herzegovina, the gap has closed by 12 years, mostly because of a recovery in male life ex-pectancy. At the opposite extreme, the gender gap in life expectancy in Belarus has increased in the past five years: while male life expectancy has in-creased (by 0.3 years), female life expectancy has increased even more (1.8 years).14
During the last decade, the negative trend in male life expectancy that has been common in certain countries of the region has reversed. Although the average trend in life expectancy in the region has been positive for men and women since the beginning
FIGURE 1.7 Women’s Advantage in Life Expectancy, Selected Countries and Regions, 2005–10averages, years
0
2
4
6
8
10
12
14Sub
-Sah
aran
Afr
ica
Sou
th-C
entr
al A
sia
Nor
ther
n A
fric
a
East
ern
Asi
a
Ser
bia
Aze
rbai
jan
Mac
edon
ia, FY
R
Turk
ey
Mon
tene
gro
Bos
nia
and
Her
zego
vina
Tajik
ista
n
Wes
tern
Eur
ope
Cze
ch R
epub
lic
Alb
ania
Uzb
ekis
tan
Arm
enia
Latin
Am
eric
a an
d th
e C
arib
bean
Cro
atia
Agi
ng P
opul
atio
ns
Youn
g Pop
ulat
ions
Geo
rgia
Bul
garia
Rom
ania
Slo
veni
a
Kyr
gyz
Rep
ublic
Mol
dova
Euro
pe a
nd C
entr
al A
sia
Cen
tral
and
Eas
tern
Eur
ope
Slo
vaki
a
Hun
gary
Com
mon
wea
lth o
f In
depe
nden
t Sta
tes
Turk
men
ista
n
Age
d Pop
ulat
ions
Pol
and
Latv
ia
Esto
nia
Ukr
aine
Lith
uani
a
Bel
arus
Kaz
akhs
tan
Rus
sian
Fed
erat
ion
Source: World Bank staff calculations based on UN (2009a).
14 Figure 1.8 shows changes in the gender gap in life expectancy; annex A, table A.1 shows the values.

Opportunities for Men and Women: Emerging Europe and Central Asia16
of the transition, Belarus, Kazakhstan, Montenegro, Russia, and Ukraine experienced a negative trend in life expectancy during the 1990s. Average male life expectancy fell from 64 to 62 years during the 1990s in this set of countries. This negative trend seems to have been associated with alcohol abuse, as discussed
below. During the past decade, all these countries have seen an increase in male life expectancy, despite the continuing high adult mortality rates in Belarus, Rus-sia, and Ukraine (figures 1.9 and 1.10).
The male mortality rate among adults between 20 and 59, although still higher than the correspond-ing female rates, has fallen from the high values ob-served in the 1990s. In the region, the average male mortality rate for adults 20 to 59 years of age fell from 223 in 2000 to 205 in 2006. The female adult mortality rate in the region is considerably lower and has been more stable since the transition at the beginning of the 1990s. However, the male adult mortality rate decreased noticeably in the last de-cade. This decline occurred everywhere except the Kyrgyz Republic and Ukraine, which has shown an increase in the mortality rate equivalent to the one observed in the 1990s. The high male mortality rate countries—Belarus, Lithuania, and Russia—showed some improvement, but remain among the countries with the highest rates compared with the rest of the region (figure 1.10).
Possible determinants of the high mortality rate are associated with alcohol abuse. The high male mortality rate in many of the countries in the region is associated with alcohol abuse and other, related risks. A recent World Bank report concluded that
FIGURE 1.8 Changes in the Gender Gap in Life Expectancy, 1990–2010
Bos
nia
and
Her
zego
vina
Aze
rbai
jan
Latv
ia
Agi
ng P
opul
atio
ns
Tajik
ista
n
Mon
tene
gro
Cro
atia
Wes
tern
Eur
ope
Hun
gary
Cze
ch R
epub
lic
Cen
tral
and
Eas
tern
Eur
ope
Euro
pe a
nd C
entr
al A
sia
Sub
-Sah
aran
Afr
ica
Geo
rgia
Esto
nia
Slo
vaki
a
Slo
veni
a
Pol
and
Kyr
gyz
Rep
ublic
Youn
g Pop
ulat
ions
Age
d Pop
ulat
ions
Ser
bia
Arm
enia
Com
mon
wea
lth o
f In
depe
nden
t Sta
tes
Rom
ania
Bul
garia
Latin
Am
eric
a an
d th
e C
arib
bean
Uzb
ekis
tan
Turk
men
ista
n
Mac
edon
ia, FY
R
Mol
dova
Rus
sian
Fed
erat
ion
Alb
ania
Lith
uani
a
Turk
ey
Ukr
aine
Nor
ther
n A
fric
a
East
ern
Asi
a
Bel
arus
Sou
th-C
entr
al A
sia
Kaz
akhs
tan
–14–12–10–8–6–4–2
024
Source: World Bank staff calculations based on UN (2009a).
FIGURE 1.9 Trends in Life Expectancy, Selected Countries and the Region, 1990–2015
Male - ECA
Male RussianFederation
MaleUkraine
MaleMontenegro
MaleKazkahstan
Female - ECA
50
55
60
65
70
75
80
85
1990–1995 1995–2000 2000–2005 2005–2010 2010–2015
Source: World Development Indicators Database, World Bank, Wash-ington, DC, http://data.worldbank.org/data-catalog/world-develop-ment-indicators/.

Gender Issues in Human Capital 17
Russians, especially men, suffer disproportionately from (1) injury and violence, including traffic ac-cidents, domestic and other violence, and suicide; (2) cardiovascular disease; and (3) cancer (see box 1.1). All these causes are affected by excessive alco-hol, tobacco, and other drug use. The relationship with changes in economic growth suggests that the lack of economic opportunities and the ensuing mental stress continue to play a crucial role.
The high male mortality rate is not a new phe-nomenon in Russia. The average mortality rate among adult Russian males is now on a par with the rates in Ethiopia, Haiti, and Sierra Leone. The Russian male adult mortality rate has shown several spikes over the years, usually associated with the economic and political situation (Nolte, McKee, and Gilmore 2004). The slight increase in male mortality during the 1960s, 1970s, and 1980s reversed in the mid-1980s concurrently with political changes. The male adult mortality rate then fell between the mid-1990s until the Russian economic crisis in 1998. Since then, how-ever, the male mortality rates for ages 25–59 have been rising again, despite high economic growth. Finally, 2007 may turn out to be the beginning of a new decreasing trend.
FIGURE 1.10 The Evolution in Mortality Rates among the 20–59 Age-Group
a. Europe and Central Asia, by gender, 1990–2006 b. Males, selected countries, 1990–2007
Male – ECA Average Male – Selected CountriesFemale – ECA Average Female – Selected Countries Lithuania Belarus Ukraine Russian Federation
0
300
200
100
400
500
600
19
90
19
91
19
92
19
93
19
94
19
95
19
96
19
97
19
98
19
99
20
00
20
01
20
02
20
03
20
04
20
05
20
06
19
90
19
91
19
92
19
93
19
94
19
95
19
96
19
97
19
98
19
99
20
00
20
01
20
02
20
03
20
04
20
05
20
06
20
07
20
08
20
09
50
0
100
150
200
250
300
350
Source: World Bank staff calculations based on UN (2009a).Note: Selected countries are Belarus, Bulgaria, Czech Republic, Estonia, Hungary, Latvia, Lithuania, Poland, Romania, Russia, Slovak Republic, Slovenia, and Ukraine.
Box 1.1: Russia’s Growing Health Crisis
Every day, 100 people die in traffic accidents in Russia, and over 100 people die of acute alcohol poisoning. The excessively high levels of mortality, ill health, and disability among the working-age population have far-reaching demographic, financial, and social consequences. (The evolution in mortality rates in the 20–59 age-group is shown in figure 1.10, for example.) A recent report of the World Bank’s Europe and Central Asia Region con-cluded as follows:
Economic stress, coupled with a tradition of unhealthy life-styles and unhealthy environments, has led to a reversal in life expectancy, especially among adult men. This is worsening the demographic trends in a rapidly aging population.Noncommunicable diseases, notably cardiovascular diseases and cancer, as well as injuries, are the main causes of death in Russia. The mortality rates associated with these diseases and with injuries are three and five times higher, respectively, than the corresponding rates in the European Union. Traffic injuries, suicide, alcohol poisoning, and violence account for the main share of lethal injuries.Alcohol and other drug abuse, as well as heightened tobacco consumption, increases the probability of these diseases, as do poor diets and stress caused by worsening socioeconomic conditions.The ill health and high mortality rates result in fewer produc-tive workers.Regional disparities and even national security risks are growing. Health care costs and the costs associated with the loss of production because of absenteeism or low productiv-ity are high.
Source: World Bank (2005a).

Opportunities for Men and Women: Emerging Europe and Central Asia18
Reproductive Health and Maternal MortalityAt the beginning of the transition, women across the region enjoyed relatively good health and ac-cess to basic health services. The only major area of concern was the lack of access to modern forms of contraception and the heavy reliance on abortion. The change in the trend that began in the 1990s persisted, and a convergence toward OECD coun-try levels is observable today.
The maternal mortality rate in the region has con-verged to the level of the rates in the OECD countries. At the beginning of the 1990s, maternal mortality rates in Europe and Central Asia, though relatively low compared with Latin America and East Asia, were high compared with developed countries. In 1990, the maternal mortality rate in the region was almost two-thirds higher than the rate observed in OECD countries: 49 versus 30 deaths per 100,000 live births, respectively, in Europe and Central Asia and in the OECD.15 However, during the last two decades, the maternal mortality rate has converged toward the levels of the rate in the OECD (figure 1.10). In 2008, the average maternal mortality rate in the region was 27 per 100,000 live births.
However, there is enormous variation in mater-nal mortality rates across the region. The difference in the maternal mortality rates of the countries with the highest and the lowest rates is 75 per 100,000 live births, which is three times the value of the maternal mortality rate in the OECD in 2008. The
Kyrgyz Republic, Tajikistan, and Turkmenistan are the three countries with the highest rates, while Po-land, Serbia, and the Slovak Republic are the three countries with the lowest rates (figure 1.11).
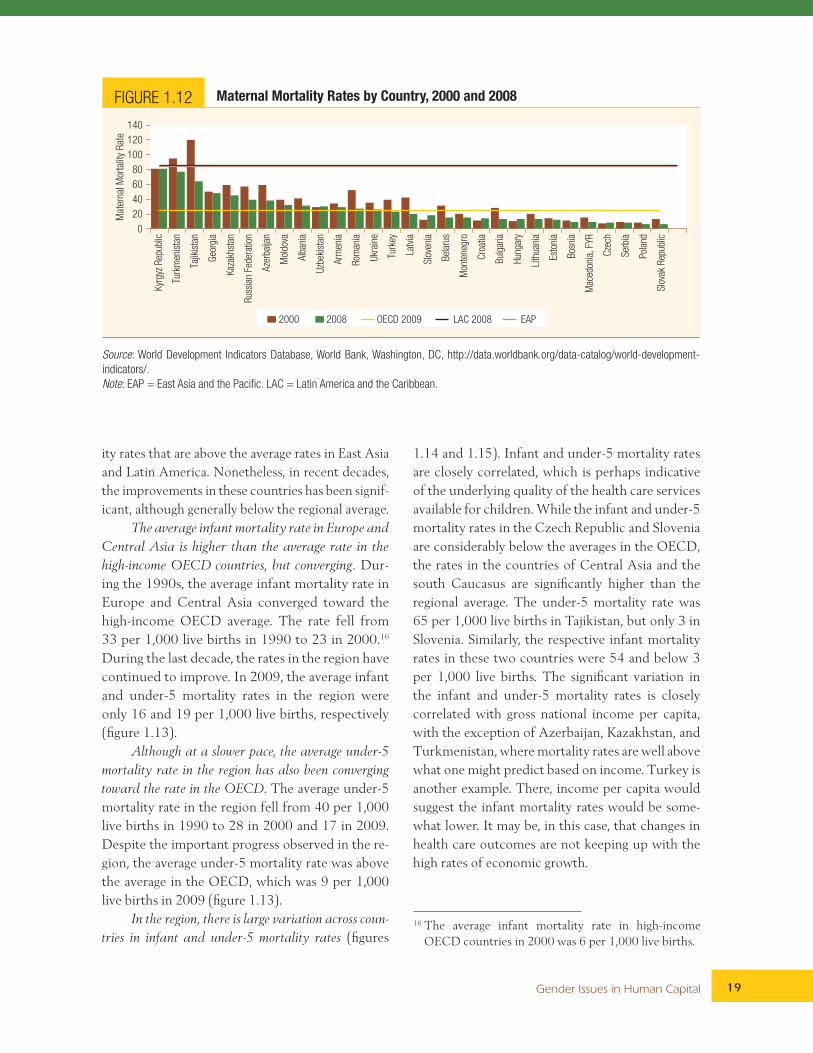
Improvement in the maternal mortality rate has been achieved in selected countries in the region. De-spite the convergence in the 1990s, two countries in Europe and Central Asia still showed higher mater-nal mortality rates in 2000 than the average in Latin America or East Asia. In 2000, the maternal mortali-ty rate was 91 in Turkmenistan and 120 in Tajikistan (figure 1.12). However, significant improvement was observed in other countries of Europe and Central Asia, including Azerbaijan, Kazakhstan, Latvia, Ro-mania, Russia, Turkey, and Ukraine. The improve-ments in these countries were mainly responsible for the convergence of the rates in the region toward the rates in the countries of the OECD.
However, it is not clear why improvements in the maternal mortality rate were not achieved in all coun-tries. In a region in which almost all births are attend-ed by health personnel, why is there such a high level of maternal mortality in some countries? The reasons may range from poverty at the household level (given that the poorest countries in the region experience the highest mortality rates) to the specific character-istics of the health system in each country (given the high share of births attended by skilled health per-sonnel). In the region, Tajikistan has the lowest share of births attended by skilled health personnel; yet, only 12 percent of births occur unattended.
Infant and Under-5 MortalityInfant and under-5 mortality rates in Europe and Central Asia compare well with rates in East Asia, Latin America, and the OECD. However, the varia-tion across countries within the region is high. The Central Asian countries, in particular, show mortal-
15 The maternal mortality rate is the annual number of deaths among women due to pregnancy or child-birth-related causes per 100,000 live births. We use the model estimates. For more details, consult World Development Indicators Database, World Bank, Wash-ington, DC, http://data.worldbank.org/data-catalog/world-development-indicators/ (accessed 2011).
FIGURE 1.11 Maternal Mortality Rates, 1990–2008
ECAOECD
60
50
40
30
20
10
01990 1995 2000 2005 2008
Mat
erna
l mor
talit
y ra
te
Source: World Development Indicators Database, World Bank, Wash-ington, DC, http://data.worldbank.org/data-catalog/world-develop-ment-indicators/.Note: ECA = Europe and Central Asia.
Gender Issues in Human Capital 19
ity rates that are above the average rates in East Asia and Latin America. Nonetheless, in recent decades, the improvements in these countries has been signif-icant, although generally below the regional average.
The average infant mortality rate in Europe and Central Asia is higher than the average rate in the high-income OECD countries, but converging. Dur-ing the 1990s, the average infant mortality rate in Europe and Central Asia converged toward the high-income OECD average. The rate fell from 33 per 1,000 live births in 1990 to 23 in 2000.16 During the last decade, the rates in the region have continued to improve. In 2009, the average infant and under-5 mortality rates in the region were only 16 and 19 per 1,000 live births, respectively (figure 1.13).
Although at a slower pace, the average under-5 mortality rate in the region has also been converging toward the rate in the OECD. The average under-5 mortality rate in the region fell from 40 per 1,000 live births in 1990 to 28 in 2000 and 17 in 2009. Despite the important progress observed in the re-gion, the average under-5 mortality rate was above the average in the OECD, which was 9 per 1,000 live births in 2009 (figure 1.13).
In the region, there is large variation across coun-tries in infant and under-5 mortality rates (figures
1.14 and 1.15). Infant and under-5 mortality rates are closely correlated, which is perhaps indicative of the underlying quality of the health care services available for children. While the infant and under-5 mortality rates in the Czech Republic and Slovenia are considerably below the averages in the OECD, the rates in the countries of Central Asia and the south Caucasus are significantly higher than the regional average. The under-5 mortality rate was 65 per 1,000 live births in Tajikistan, but only 3 in Slovenia. Similarly, the respective infant mortality rates in these two countries were 54 and below 3 per 1,000 live births. The significant variation in the infant and under-5 mortality rates is closely correlated with gross national income per capita, with the exception of Azerbaijan, Kazakhstan, and Turkmenistan, where mortality rates are well above what one might predict based on income. Turkey is another example. There, income per capita would suggest the infant mortality rates would be some-what lower. It may be, in this case, that changes in health care outcomes are not keeping up with the high rates of economic growth.
FIGURE 1.12 Maternal Mortality Rates by Country, 2000 and 2008
40
20
0
60
80
100
120
140
Kyr
gyz
Rep
ublic
Turk
men
ista
n
Tajik
ista
n
Geo
rgia
Kaz
akhs
tan
Rus
sian
Fed
erat
ion
Aze
rbai
jan
Mol
dova
Alb
ania
Uzb
ekis
tan
Arm
enia
Rom
ania
Ukr
aine
Turk
ey
Latv
ia
Slo
veni
a
Bel
arus
Mon
tene
gro
Cro
atia
Bul
garia
Hun
gary
Lith
uani
a
Esto
nia
Bos
nia
Mac
edon
ia, FY
R
Cze
ch
Ser
bia
Pol
and
Slo
vak
Rep
ublic
Mat
erna
l Mor
talit
y R
ate
2000 2008 OECD 2009 LAC 2008 EAP
Source: World Development Indicators Database, World Bank, Washington, DC, http://data.worldbank.org/data-catalog/world-development-indicators/.Note: EAP = East Asia and the Pacific. LAC = Latin America and the Caribbean.
16 The average infant mortality rate in high-income OECD countries in 2000 was 6 per 1,000 live births.

Opportunities for Men and Women: Emerging Europe and Central Asia20
Belarus, Estonia, and Turkey have experienced the biggest drops in infant and under-5 mortality rates over the last decade, but many other countries in the region have seen big improvements as well. Infant and under-5 mortality rates dropped, on average, by one-third in the region during 2000 and 2009, while, in Belarus, Estonia, and Turkey, rates fell by over 50 percent. The decline in the infant and un-
der-5 mortality rates in the countries with the high-est rates in the region has been mostly below the regional average, indicating a lack of convergence between the south Caucuses, Central Asia, and the rest of the region. In Azerbaijan, the infant mortal-ity rate fell from 78 per 1,000 live births in 1990 to 56 in 2000 and 41 in 2009. In Tajikistan, the country with the poorest performance, the under-5
FIGURE 1.14 Under-5 Mortality Rates, 2000 and 2009
2000 2009 OECD 2009 LAC 2009 EAP 2009
Kyr
gyz
Rep
ublic
Uzb
ekis
tan
Tajik
ista
n
Cro
atia
Latv
ia
40
30
20
10
0
60
50
80
70
90
100
Mor
talit
y R
ate,
und
er 5
(pe
r 1000)
Slo
vak
Rep
ublic
Bos
nia
and
Her
zego
vina
Cze
ch R
epub
lic
Ukr
aine
Slo
veni
a
Aze
rbai
jan
Alb
ania
Turk
men
ista
n
Bel
arus
Mol
dova
Bul
garia
Mac
edon
ia,
FYR
Geo
rgia
Pol
and
Rom
ania
Arm
enia
Rus
sian
Fed
erat
ion
Mon
tene
gro
Esto
nia
Turk
ey
Ser
bia
Hun
gary
Lith
uani
a
Kaz
akhs
tan
Source: World Development Indicators Database, World Bank, Washington, DC, http://data.worldbank.org/data-catalog/world-development-indicators/.Note: EAP = East Asia and the Pacific. LAC = Latin America and the Caribbean.
FIGURE 1.13 Infant and Under-5 Mortality Rates, 1990–2009
a. Infant and under-5 mortality ratesper 1,000 live births
b. Infant mortality rates, 2009per 1,000 live births
0
30
20
10
40
50
60
ECA -
IMR
High income
OECD - IMR
ECA -
Child MR
High income
OECD - Child MR GNI per capita, PPP (current intl $)
19
90
19
91
19
92
19
93
19
94
19
95
19
96
19
97
19
98
19
99
20
00
20
01
20
02
20
03
20
04
20
05
20
06
20
07
20
08
20
09
0 5
10 15 20 25 30 35 40 45
10,000 0 20,000 30,000
Source: World Development Indicators Database, World Bank, Washington, DC, http://data.worldbank.org/data-catalog/world-development-indicators/.Note: ECA = Europe and Central Asia.
Gender Issues in Human Capital 21
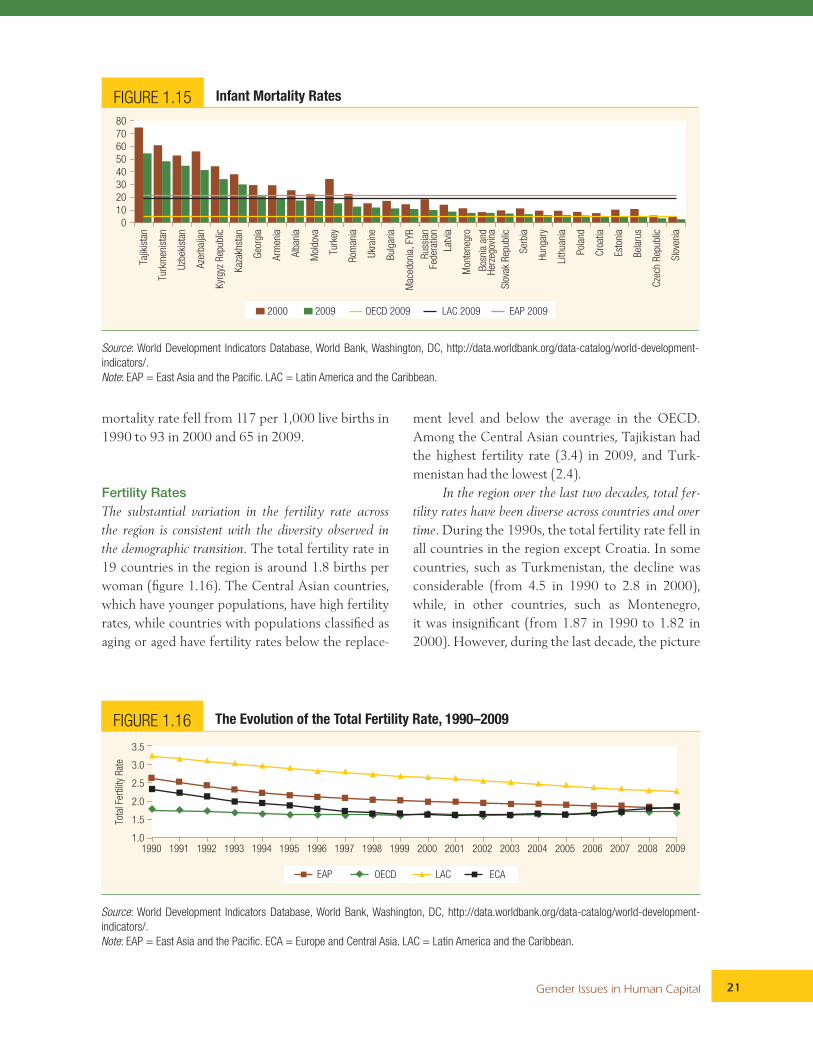
mortality rate fell from 117 per 1,000 live births in 1990 to 93 in 2000 and 65 in 2009.
Fertility RatesThe substantial variation in the fertility rate across the region is consistent with the diversity observed in the demographic transition. The total fertility rate in 19 countries in the region is around 1.8 births per woman (figure 1.16). The Central Asian countries, which have younger populations, have high fertility rates, while countries with populations classified as aging or aged have fertility rates below the replace-
ment level and below the average in the OECD. Among the Central Asian countries, Tajikistan had the highest fertility rate (3.4) in 2009, and Turk-menistan had the lowest (2.4).
In the region over the last two decades, total fer-tility rates have been diverse across countries and over time. During the 1990s, the total fertility rate fell in all countries in the region except Croatia. In some countries, such as Turkmenistan, the decline was considerable (from 4.5 in 1990 to 2.8 in 2000), while, in other countries, such as Montenegro, it was insignificant (from 1.87 in 1990 to 1.82 in 2000). However, during the last decade, the picture
FIGURE 1.15 Infant Mortality Rates
2000 2009 OECD 2009 LAC 2009 EAP 2009
40
30
20
10
0
60
50
80
70Ta
jikis
tan
Turk
men
ista
n
Uzb
ekis
tan
Aze
rbai
jan
Kyr
gyz
Rep
ublic
Kaz
akhs
tan
Geo
rgia
Arm
enia
Alb
ania
Mol
dova
Turk
ey
Rom
ania
Ukr
aine
Bul
garia
Mac
edon
ia, FY
R
Rus
sian
Fede
ratio
n
Latv
ia
Mon
tene
gro
Bos
nia
and
Her
zego
vina
Slo
vak
Rep
ublic
Ser
bia
Hun
gary
Lith
uani
a
Pol
and
Cro
atia
Esto
nia
Bel
arus
Cze
ch R
epub
lic
Slo
veni
a
Source: World Development Indicators Database, World Bank, Washington, DC, http://data.worldbank.org/data-catalog/world-development-indicators/.Note: EAP = East Asia and the Pacific. LAC = Latin America and the Caribbean.
FIGURE 1.16 The Evolution of the Total Fertility Rate, 1990–2009
OECD LAC ECAEAP
Tota
l Fer
tility
Rat
e
1.0
1.5
2.0
2.5
3.0
3.5
1990 1991 1992 1993 1994 1995 1996 1997 1998 1999 2000 2001 2002 2003 2004 2005 2006 2007 2008 2009
Source: World Development Indicators Database, World Bank, Washington, DC, http://data.worldbank.org/data-catalog/world-development-indicators/.Note: EAP = East Asia and the Pacific. ECA = Europe and Central Asia. LAC = Latin America and the Caribbean.

Opportunities for Men and Women: Emerging Europe and Central Asia22
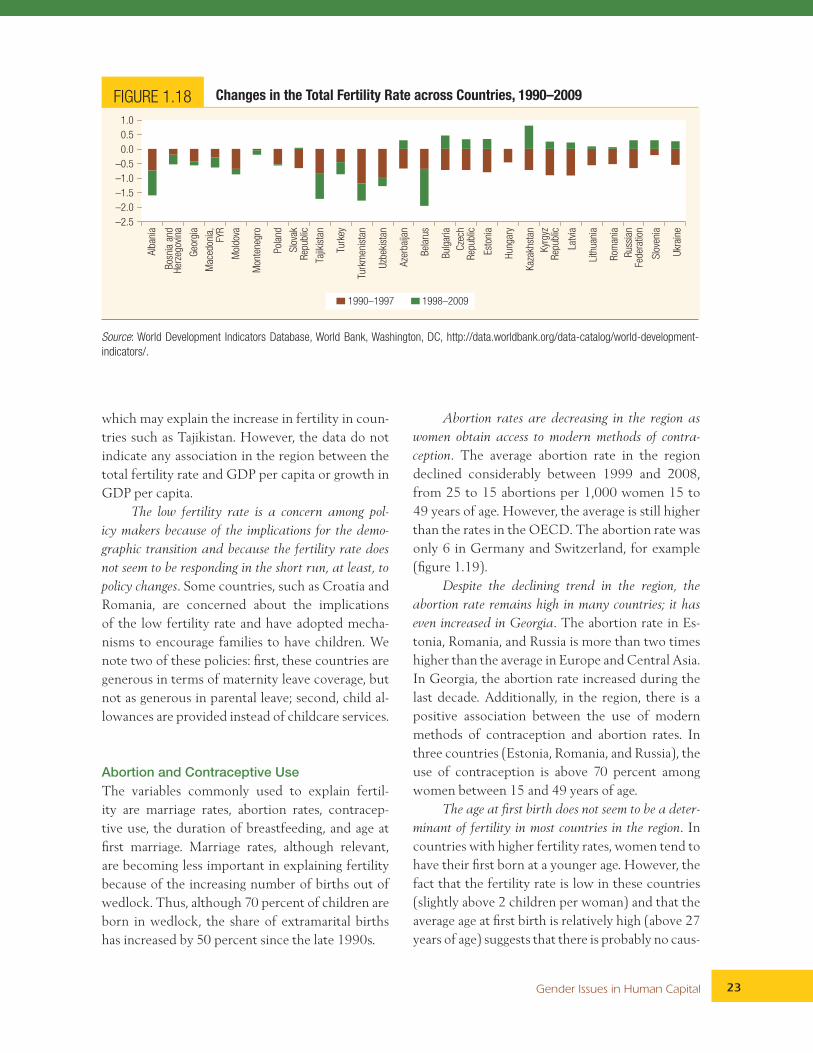
was completely different. In half the countries in the region, there was an increase in the total fertility rate, while, in the other half, there was a decline.17 The magnitude of the decline in the total fertility rate during the 1990s does not seem to have been correlated with the changes in fertility in the 2000s, indicating that many factors, including the econom-ic situation and societal changes, are likely to be in play. For example, in Azerbaijan and Kazakhstan, the total fertility rate decreased by 0.67 and 0.72, respectively, during the 1990s, but has increased by 0.3 and 0.8, respectively, since then. Meanwhile, the total fertility rate fell by 0.8 and 0.9 in Tajikistan during each decade, respectively (figure 1.17).
Thus, the declining trend in the average total fer-tility rate in the region during the 1990s has changed to a steady trend in the new millennium. During the 1990s, there was a drastic decline in the average to-tal fertility rate in Europe and Central Asia, which resulted in a convergence toward the rates in the OECD. The average total fertility rate in Europe and Central Asia fell from 2.4 in 1990 to 1.8 in 2000, the average in the OECD. In 2009, the av-erage rate in Europe and Central Asia was still the same (figures 1.16 and 1.18).
Selected countries in the region are key sources of the children involved in intercountry adoptions. Russia
and Ukraine are among the top five countries in the world in terms of the number of children put up for intercountry adoption.18 Many of the children are the result of unwanted pregnancies, thus suggest-ing that contraceptive methods are not sufficiently widespread and that there may be a social stigma on single motherhood, since most of the mothers giv-ing their children up for adoption are young and un-married. (The abortion rates in Russia and Ukraine are among the highest in the region; see below.)
Income per capita does not seem to be related to changes in the total fertility rate. There are many fac-tors that explain the total fertility rate. One of them is income per capita. Thus, in many countries, an economic boom translates into a boom in fertility,
17 Albania, Bosnia and Herzegovina, Georgia, FYR Mace-donia, Moldova, Montenegro, Poland, Slovak Repub-lic, Tajikistan, Turkey, Turkmenistan, and Uzbekistan showed a decrease in the total fertility rate in both decades, while Azerbaijan, Belarus, Bulgaria, the Czech Republic, Estonia, Hungary, Kazakhstan, the Kyrgyz Republic, Latvia, Lithuania, Romania, Russia, Slovenia, and Ukraine showed a decline in the total fertility rate during the 1990s and a rise during the next decade.
18 The other three countries are China, Guatemala, and the Republic of Korea.
FIGURE 1.17 The Variation in Total Fertility Rates across Countries, 2009
2009 OECD LAC EAP
Tota
l Fer
tility
Rat
e
0.0
0.5
1.0
1.5
2.0
2.5
3.0
3.5
4.0
Tajik
ista
n
Kyr
gyz
Rep
ublic
Kaz
akhs
tan
Uzb
ekis
tan
Turk
men
ista
n
Aze
rbai
jan
Turk
ey
Arm
enia
Mon
tene
gro
Esto
nia
Bul
garia
Geo
rgia
Alb
ania
Lith
uani
a
Rus
sian
Fede
ratio
n
Slo
veni
a
Cze
ch R
epub
lic
Mol
dova
Cro
atia
Ukr
aine
Mac
edon
ia, FY
R
Bel
arus
Slo
vak
Rep
ublic
Pol
and
Rom
ania
Hun
gary
Latv
ia
Bos
nia
and
Her
zego
vina
Source: World Development Indicators Database, World Bank, Washington, DC, http://data.worldbank.org/data-catalog/world-development-indicators/.Note: EAP = East Asia and the Pacific. LAC = Latin America and the Caribbean.
Gender Issues in Human Capital 23
which may explain the increase in fertility in coun-tries such as Tajikistan. However, the data do not indicate any association in the region between the total fertility rate and GDP per capita or growth in GDP per capita.
The low fertility rate is a concern among pol-icy makers because of the implications for the demo-graphic transition and because the fertility rate does not seem to be responding in the short run, at least, to policy changes. Some countries, such as Croatia and Romania, are concerned about the implications of the low fertility rate and have adopted mecha-nisms to encourage families to have children. We note two of these policies: first, these countries are generous in terms of maternity leave coverage, but not as generous in parental leave; second, child al-lowances are provided instead of childcare services.
Abortion and Contraceptive UseThe variables commonly used to explain fertil-ity are marriage rates, abortion rates, contracep-tive use, the duration of breastfeeding, and age at first marriage. Marriage rates, although relevant, are becoming less important in explaining fertility because of the increasing number of births out of wedlock. Thus, although 70 percent of children are born in wedlock, the share of extramarital births has increased by 50 percent since the late 1990s.
Abortion rates are decreasing in the region as women obtain access to modern methods of contra-ception. The average abortion rate in the region declined considerably between 1999 and 2008, from 25 to 15 abortions per 1,000 women 15 to 49 years of age. However, the average is still higher than the rates in the OECD. The abortion rate was only 6 in Germany and Switzerland, for example (figure 1.19).
Despite the declining trend in the region, the abortion rate remains high in many countries; it has even increased in Georgia. The abortion rate in Es-tonia, Romania, and Russia is more than two times higher than the average in Europe and Central Asia. In Georgia, the abortion rate increased during the last decade. Additionally, in the region, there is a positive association between the use of modern methods of contraception and abortion rates. In three countries (Estonia, Romania, and Russia), the use of contraception is above 70 percent among women between 15 and 49 years of age.
The age at first birth does not seem to be a deter-minant of fertility in most countries in the region. In countries with higher fertility rates, women tend to have their first born at a younger age. However, the fact that the fertility rate is low in these countries (slightly above 2 children per woman) and that the average age at first birth is relatively high (above 27 years of age) suggests that there is probably no caus-
FIGURE 1.18 Changes in the Total Fertility Rate across Countries, 1990–2009
1990–1997 1998–2009
–2.5
–2.0
–1.5
–1.0
–0.5
0.0
0.5
1.0
Alb
ania
Bos
nia
and
Her
zego
vina
Geo
rgia
Mac
edon
ia,
FYR
Mol
dova
Mon
tene
gro
Pol
and
Slo
vak
Rep
ublic
Tajik
ista
n
Turk
ey
Turk
men
ista
n
Uzb
ekis
tan
Aze
rbai
jan
Bel
arus
Bul
garia
Cze
chR
epub
lic
Esto
nia
Hun
gary
Kaz
akhs
tan
Kyr
gyz
Rep
ublic
Latv
ia
Lith
uani
a
Rom
ania
Rus
sian
Fede
ratio
n
Slo
veni
a
Ukr
aine
Source: World Development Indicators Database, World Bank, Washington, DC, http://data.worldbank.org/data-catalog/world-development-indicators/.

Opportunities for Men and Women: Emerging Europe and Central Asia24
al relation between age at first birth and fertility. This conclusion is supported by two observations. First, the average age at first birth in the region is slightly lower than the average age in OECD coun-tries, 27.5 versus 28.4 years, respectively. Second, a simple correlation between the average age at first birth and the total fertility rate shows no significant association between these two variables.
The rate of adolescent pregnancy in the region is low and is decreasing over time. In the region, the rate of adolescent pregnancy—the number of live births to women between 15 and 19 years of age per 1,000 women in the age-group—is below the average in the OECD, although it is still above the average in high-income OECD countries. The re-gion’s average rate of adolescent pregnancy was 23 in 2008, while, in the OECD, the rate was 27, and, in the high-income OECD countries, it was 17. The average adolescent pregnancy rate in the region fell by about 30 percent during the last decade given that the rate was 33 in 1998 (figure 1.20).
There is significant variation across the region in the adolescent fertility rate. The adolescent fertility rate is high in the countries of the south Caucasus and in Bulgaria, Moldova, Romania, Ukraine, and Turkey. The difference in the rate between the
countries at the two extremes—Georgia and Slove-nia—is on the order of 10 times (figure 1.21). How-ever, though adolescent fertility should always be a concern, it is low in the region relative to other developing regions.
Adolescent fertility rates are not correlated with total fertility rates at the country level. This is positive because it implies that adolescents are not driving the fertility rates observed in the region. Nonetheless, for health reasons and for the sake of future labor market opportunities, it is not ben-eficial for adolescents to bear or take care of chil-dren. In our case, the lack of correlation between the two rates may imply that adolescent mothers either do not have information about the benefits of delaying birth or do not have access to educa-tion and labor market opportunities. Whatever the explanation, this should be a matter of concern for policy makers not least because it indicates there is room for efficiency gains in labor resources.
Missing WomenThe term missing women refers to the observa-tion that the proportion of girls and women in the population of a country is too low. The indicator is
FIGURE 1.19 Abortion Rates across Countries, 1999 and 2008per 1,000 live births
0
10
20
30
40
50
60P
olan
d
Cro
atia
Aze
rbai
jan
Slo
vak
Rep
ublic
Tajik
ista
n
Geo
rgia
Cze
ch R
epub
lic
Arm
enia
Slo
veni
a
Ser
bia
Kyr
gyz
Rep
ublic
Lith
uani
a
Mol
dova
Alb
ania
Hun
gary
Latv
ia
Kaz
akhs
tan
Bul
garia
Ukr
aine
Esto
nia
Rom
ania
Bel
arus
Rus
sian
Fed
erat
ion
Euro
pe a
ndC
entr
al A
sia
Spa
in
Ger
man
y
Sw
itzer
land
Finl
and
Italy
Icel
and
Nor
way
Sw
eden
Uni
ted
Sta
tes
1999 2008
Source: UNECE Statistical Database, United Nations Economic Commission for Europe, Geneva, http://w3.unece.org/pxweb/.Note: ECA = Europe and Central Asia.

Gender Issues in Human Capital 25
computed using the mortality risk of women and men at every age in a country relative to the mortal-ity risk at the same ages in a group of high-income reference countries.
Armenia, Azerbaijan, and Georgia have the highest sex imbalance at birth in the world after Chi-na. Although most of the attention regarding miss-ing women is focused on China and India, the three countries in Europe and Central Asia show levels
of sex imbalance that are equally high. In China, 118 baby boys are born for every 100 live births of girls, while, in Armenia, Azerbaijan, and Georgia, the corresponding numbers are 116, 115, and 111, respectively (figure 1.22).
GDP growth is not driving the sex imbalance at birth, which means that three other factors may be at play. A simple correlation of GDP per capita (or GDP growth) and sex imbalance at birth indicates
FIGURE 1.20 Adolescent Fertility Rate, Selected Regions, 1998–2009
0
10
20
30
40
1998
1999
2000
2001
2002
2003
2004
2005
2006
2007
2008
2009
ECA OECD High Income OECD EAP
Ado
lesc
ent
fert
ility
rat
e
(15–
19)
Source: World Development Indicators Database, World Bank, Washington, DC, http://data.worldbank.org/data-catalog/world-development-indicators/.Note: EAP = East Asia and the Pacific. ECA = Europe and Central Asia.
FIGURE 1.21 Adolescent Fertility Rates across Countries, 2009
05
1015202530354045
Geo
rgia
Bul
garia
Turk
ey
Arm
enia
Aze
rbai
jan
Mol
dova
Kyr
gyz
Rep
ublic
Rom
ania
Kaz
akhs
tan
Ukr
aine
Tajik
ista
n
Rus
sian
Fed
erat
ion
Ser
bia
Lith
uani
a
Mac
edon
ia,
FYR
Esto
nia
Bel
arus
Slo
vak
Rep
ublic
Hun
gary
Turk
men
ista
n
Bos
nia
Latv
ia
Mon
tene
gro
Alb
ania
Cro
atia
Pol
and
Uzb
ekis
tan
Cze
ch R
epub
lic
Slo
veni
a
High Income OECDEAP
Source: World Development Indicators Database, World Bank, Washington, DC, http://data.worldbank.org/data-catalog/world-development-indicators/.Note: EAP = East Asia and the Pacific.

Opportunities for Men and Women: Emerging Europe and Central Asia26
no association.19 There are three other factors that influence the sex imbalance at birth: first, the de-cline in fertility may contribute to the emergence of the choice of sex in the child; second, ultra-sound technology has became widely available, al-lowing for prenatal sex discrimination; and, third, the preference for sons among some families re-mains strong, at least in selected developing coun-tries. The combination of all these factors under the different models of choice in fertility can be detrimental.20
Disparities within CountriesIt is important to acknowledge that gender differ-ences are usually exacerbated within each country so that poor women are less able than wealthier women to defend themselves against discrimina-tion and the lack of access. In Europe and Central Asia, Roma women offer an example (box 1.2).
The Implications for Policy Design
To close the gender gap in secondary schools, special emphasis needs to be placed on children in poor or minority groups. A significant share of this gender gap can be explained by the low participation of children in poor and minority groups, especially in Central and Eastern Europe. Many schools that
are located in underserved communities may also be of poor quality and possess inadequate human and financial resources. In addition, there may be unaddressed cultural constraints explaining why girls are kept home, while boys are sent to school. To address these challenges, governments need to make a concerted effort to promote access to quality education for poor and minority children, reduce school segregation, train teachers and assis-tants to deal with the special challenges, and, per-haps, introduce incentives to encourage families to send their daughters through schemes such as the conditional cash transfers used by several coun-tries in Latin America and even the western Bal-kans (for example, FYR Macedonia). Finally, it is
19 More details about this association may be found in chapter 3 of World Development Report 2012: Gender Equality and Development (World Bank 2011a).
20 Various models that include a preference for sons may be used to explain fertility. For example, couples may decide, in an initial stage, on the number of children they desire and then use ultrasound technology to real-ize the preference for sons. Thus, ultrasound technol-ogy is making other models of fertility obsolete. An example of a model that might be becoming obsolete is the stopping model, whereby families have children until they produce a son. Under such model assump-tions, the mother may decide on how many children to have. Moreover, there are studies that show that the sex of the second born is related to the sex of the first born.
FIGURE 1.22 Sex Ratio at Birth, 2008
95
100
105
110
115
120
Chi
na
Arm
enia
Aze
rbai
jan
Kor
ea, R
ep.
Mon
tene
gro
Ser
bia
Mac
edon
ia, FY
R
Indi
a
Alb
ania
Bos
nia
and
Her
zego
vina
Bul
garia
Cro
atia
Cze
ch R
epub
lic
Esto
nia
Hun
gary
Kaz
akhs
tan
Kyr
gyz
Rep
ublic
Latv
ia
Lith
uani
a
Pol
and
Mol
dova
Rom
ania
Rus
sian
Fed
erat
ion
Slo
vak
Rep
ublic
Ukr
aine
Slo
veni
a
Tajik
ista
n
Turk
ey
Turk
men
ista
n
Uzb
ekis
tan
Source: UN (2009a).

Gender Issues in Human Capital 27
also important to address the underlying concerns of parents about sending girls to school, which may sometimes be as simple as providing safe transpor-tation for girl students.
The demographic transition that is under way has raised government interest in increasing fertility, although a more realistic alternative may be to focus resources on making the next generation more pro-ductive. Traditionally, a focus on fertility has been considered a policy to mitigate the demographic transition to elderly populations. Most demog-raphers used to recommend replacement-level fertility rates (that is, an average of two surviving children per adult woman). However, today, the world total fertility rate is below this level, and this policy recommendation seems unrealistic. Govern-ment policies geared toward reversing declining fertility have not been widely successful even in the more advanced economies. Thus, policies are moving toward ways of increasing the value gener-ated by newer population cohorts so that children will be able to produce more for a larger popula-tion in a context of environmental sustainability. These types of policies thus advocate raising the human capital of younger cohorts, increasing the
productivity of new entrant workers, and promot-ing research and development in environmentally friendly industries and processes.
The problem of the missing women in the region calls for more attention to provide evidence-based pol-icies. It is important to understand if this problem is common to all households or particular to the bottom of the income distribution. For example, if the gender imbalance at birth is common to all households, one policy used in many countries such as China and India is to ban prenatal screen-ing.21 However, policies should generate incentives to prevent prenatal screening because banning pre-natal screening is debatable on the grounds of free choice, but also because there are plenty of ways to bypass the law. Thus, policies should be de-signed to discourage prenatal screening by raising the associated costs, for example, health insurance might not cover the test for prenatal screening or high tariffs might be placed on medical screening devices by private companies or individuals. If this problem is found only at the bottom of the income distribution, additional instruments such as conditional cash transfers can be used. In the state of Haryana, India, there is such a program whereby families receive an immediate cash com-pensation if they give birth to a daughter and a long-term savings bond redeemable on the daugh-ter’s 18 birthday provided she’s unmarried, with additional bonuses for education. In addition, the problem of missing women accumulates through the life cycle if girls and women have differential access to health and nutrition, leading to a differ-ent set of policies.
To address the maternal mortality resulting from induced abortions, greater emphasis on modern con-
Box 1.2: Health Access among Roma Women
At a population of 12 million (according to some estimates), Roma constitute the largest minority in Europe. The existing evidence suggests that Roma have generally poor health out-comes and face significant barriers to adequate health care, including discrimination on the basis of their ethnicity.
Roma women have less access to health services com-pared with non-Roma women. The lack of access to health ser-vices among Roma women is more significant in birth delivery than in prenatal care: 95 percent of Roma women in FYR Mace-donia and 89 percent in Serbia received prenatal care in 2006 compared with 99 percent of non-Roma women. In birth at-tendance, the difference between groups is similar: on average, 82 percent of Roma women in FYR Macedonia and 93 percent in Serbia give birth with the assistance of skilled personnel, while the average among non-Roma women in these countries is 99 percent.
Abortion rates are higher among Roma women. In survey studies conducted in Serbia, half of all Roma women reported having had at least one abortion in their lifetimes, and 7 percent of all Roma women reported undergoing more than 10 abor-tions. These rates are extremely high compared with the na-tional average, which is about 10 percent. Moreover, anecdotal evidence indicates cases of unsafe abortion (WHO 2010).
21 Austria, the Republic of Korea (Asia), New Zea-land (Oceania), Switzerland, and Vietnam fully pro-hibit prenatal screening. Australia, Belgium, Bosnia and Herzegovina, Bulgaria, Canada, China, Croatia, Cyprus, Denmark, Estonia, Finland, France, Germany, Greece, Hungary, Iceland, India, Israel, Italy, Latvia, Lithuania, the Netherlands, Norway, Portugal, Russia, San Marino, Singapore, Turkey, and the United King-dom prohibit prenatal screening for social reasons (Darnovsky 2009).
Opportunities for Men and Women: Emerging Europe and Central Asia28
traception methods is necessary. The government will need to consider launching information campaigns that demystify the unintended effects of contracep-tives, training practitioners to offer a wider range of contraceptives to clients, understanding the needs and preferences of clients, increasing the availabil-ity of modern contraceptives free of charge or for a nominal price, and diminishing the coverage sup-plied by public health systems for abortion costs. Evidence suggests there is partial knowledge about modern contraceptives among both clients and health care providers. Clients perceive oral contra-ception as unreliable and are more likely to inter-rupt the use of this method, which will result in unwanted pregnancies. Health practitioners in the region recommend condoms, intrauterine devices, and oral contraceptives and do not recommend other methods (such as injectables, Norplant, and sterilization). In addition, although all contracep-tive methods are legal, availability is limited to the more traditional methods. Finally, contraceptive methods are not always available through public health services, nor are they necessarily supplied free of charge. Moreover, the quality of available contraception is poor and should be improved and even fostered through research and development on new methods. Increasing the use of modern contraceptive methods is key in the region because of the high abortion rates. The purpose would be not only to reduce maternal morbidity and ma-ternal mortality, but also to focus on the fact that modern contraception is a more cost-effective way of family planning than abortion, particularly given the limited physical availability of hospitals in some countries.
Many of the male mortality factors can be rem-edied at low cost. The evidence appears to indicate that the excessively high rates of deaths among prime age males are largely a result of noncommu-nicable diseases (of the circulatory system) and, to a secondary degree, traffic accidents. To address this, a comprehensive national program operat-ing at all levels of government (federal, regional, and municipal) is necessary. At the regional level (especially, in the larger countries such as Russia), new programs need to be developed. First, prima-ry prevention programs that undertake interven-
tions in the areas of alcohol and tobacco abuse, changes in diet, and the promotion of physical activity need to be developed. The secondary pre-vention programs should address hypertension, cholesterol, and diabetes control. In addition, it is important to pursue improved road safety, as well as emergency medical services. These need to be complemented at the federal level by (1) adopt-ing appropriate legislation, policies, and strategies to support the program interventions, (2) build-ing institutional capacity, and (3) assuring federal oversight and accountability.
The aging of the population may require sig-nificant changes to social pension programs in the region. Although, at present, a significant share of the elderly receive benefits through pension pro-grams, this may no longer be the case in the future given the increased informality in the labor mar-ket. However, many governments in the region do provide social pensions, that is, cash transfer pro-grams that help the elderly who have no recourse to any other form of income. An expansion of these programs may be necessary in the future, though these programs will be competing with other public expenditures. Depending upon the coverage of the existing pension systems, govern-ments may need to rethink their public pension systems to determine the optimal (and afford-able) way to ward off old age poverty. According to one proposal, all elderly would receive a small social pension that would be affordable and pro-vide some small income to all elderly. However, this would need to be developed in coordination with revisions to the public pension system, as well as the social assistance system.
The long-term care requirements of an aging population call for innovative responses to compen-sate women family members who provide the major-ity of this care. Throughout Europe, but also in the region, the majority of long-term care is provided through informal home care arrangements rather than by public or private state institutions. In the future, reforms in the financing and delivery of long-term care will need to be addressed, especial-ly in the case of informal caregivers. Because the burden of the care of the elderly will only increase in the future, there is a strong possibility that the

Gender Issues in Human Capital 29
current practice of unpaid informal caregivers may not be sustainable. Some countries, such as Austria, Germany and selected Nordic countries, provide pension credits to informal caregivers given that these are women who have forfeited the opportunity of employment. In addition, in-
formal caregivers may need the support of profes-sionals because some tasks associated with these activities may be well beyond their capability. In the Netherlands, informal and formal long-term care is provided, although this requires strong in-stitutional capacity.


![Outline Human capital theory by C. Echevarriahomepage.usask.ca/~ece220/econ221/4-HC [Compatibility Mode].pdf · Human capital theory by C. Echevarria ... Human capital Human capital](https://img.pdfslide.net/doc/110x75/5ae0d5467f8b9a6e5c8df29c/outline-human-capital-theory-by-c-ece220econ2214-hc-compatibility-modepdfhuman.jpg)