Embed Size (px)
Citation preview

Injury Surveillance Course Draft Outline
ContentsGeneral Comments......................................................................................................................................2
Course Introduction – 1 hour......................................................................................................................3
Objective I: Understand the Conceptual Model of Injury Prevention – 1 hour...........................................4
Objective 2: Identify and Assess Existing Data Sources – 4 hours...............................................................9
Objective 3: Build a Coalition or Committee to Support the Injury Surveillance System – 1 hour............16
Objective 4: Determine the Appropriate Methodology for the SS – 3.5 hours.........................................19
Objective 5: Define and Develop and Analysis Plan for Sureillance Data – 4 hours..................................28
Objective 6: Use Surveillance Data to Inform Injury Prevention – 5.5 hours............................................36
Objective 7: Define an Evaluation Plan for the SS and Monitor Prevention Activities – 1.5 hour.............40
1
Injury Surveillance Course -- Draft Outline General Comments
General Comments 1. This is an outline for a course manual. All the other materials – presentation, handouts,
exercises – will be based on this. 2. The Objective for each section you are reviewing can be found in the header3. These outlines have been edited to reflect the changes suggested in the previous review by each
of the smaller workgroups4. Please review this outline for the following
a. Flow of each objectiveb. Flow of the course in generalc. Any content that is missing d. Any content that is repetitive
5. It was suggested that the San Carlos Apache Motor Vehicle Injury Prevention Program could serve as an example of a successful surveillance system and could be woven throughout the course to illustrate many of the points made in the course. I have tried to weave information from the program into various spots in the outline, but please feel free to suggest a more appropriate spot for the information if you feel it is misplaced or to suggest other places where information from the program would serve as an example. Another approach would be to detail the entire SC program in the appendix and make reference to it as appropriate. Below are links to information about the program. PowerPoint presentation about the San Carlos Apache Motor Vehicle Prevention ProgramUsing Evidence Based Strategies to Reduce Motor Vehicle Related Injuries on San CarlosEconomic Costs of Motor Vehicle Crashes and Economic Benefit of Prevention for San CarlosMADD Nomination Letter
6. The time estimates for each objective are based on the time allotted for each objective plus in the CDC course plus extra time for exercises. They do not reflect the fact that additional material has been added to the course from IHS Level 2, but in some cases that material was used to replace materials in the manual. Please feel free to suggest changes to the timeframe based on your experience with teaching or taking the Level 2 Course. Total time for the course, based on the estimates here is 21.5 hours. A 3-day course, based on 6 hours of teaching time each day, would be 18 hours.
7. We will review the outline on January 10, 2013, 1-2:30 p.m. EST via WebEx.
MEETING REVIEW OUTLINE: January 10, 2013 is
2

Injury Surveillance Course -- Draft Outline Course Introduction
Course Introduction – 1 hour1. What is a surveillance system
a. Gather thoughts from participants as part of an ice-breakerb. Define surveillance systemc. Show examples of surveillance systems used in Indian Country, including the San Carlos
Apache surveillance system, which should be woven throughout the course when appropriate.
2. Explain the purpose of the course3. Explain the process for creating the course4. General outline for the course – list of objectives5. Agenda including timeframe for covering each objective6. Other information …
a. Instructor’s guide will include a list of materials within the manual or other course materials that need to be updated
b. Instructor’s guide will a guide to time frame for each exercise so he or she can decide whether it should be included or not
c. Instructor’s guide will include a list of any additional materials or equipment that may be needed, such as AV, paper, post-its, flip charts, etc.
d. Other information that will be helpful for instructors …
3
Injury Surveillance Course -- Draft Outline Objective 1-Understand the Conceptual Model of Injury Prevention
Objective I – 1 hourUnderstand the conceptual model of injury prevention
Understand the concepts, definitions, and classification of injuries Know the differences between violence related injury and unintentional injury Describe the burden and cost of injuries Know the conceptual models for understanding and preventing injuries Know the steps to develop an injury surveillance system Review the ethical considerations
1. Introductiona. Description of what the section covers
i. Review of key conceptsii. Definition of injury
iii. Magnitude of injury problem in Indian Countryiv. Conceptual Model for understanding and preventing injuryv. Steps to develop and maintain an injury surveillance system
vi. Ethical considerations2. Injury definition
a. Damage inflicted on the body by an external force. Uncontrolled release of mechanical energy
i. About three fourths of all injuries, including motor vehicle crashes, are caused by uncontrolled release of mechanical energy
b. Injury vs. Disease i. Some experts think that an injury is distinguished by immediate damage to the
body from an external force. ii. Others think that the interval between the exposure and the damage can be
relatively long, such as in poisoning from carbon monoxide, alcohol abuse or lead poisoning.
iii. Chart – Injury vs. Disease modified to include Indian Country examplesc. Injury vs. Accident
i. Experts believe the widespread use of the word “accident” in place of injury has caused confusion and inhibits efforts to reduce injuries. Injuries are not accidents.
ii. They do not happen by chance. For many people, an accident is something unpredictable. Actually events that injure people are not random and have identifiable risk factors.
iii. Injuries are caused by events that involve people, equipment, vehicles, processes, and the physical and social environment. Avoid the use of the word “accident” when referring to injuries.
d. NOTE: 1 and 2 can be pared down.3. Injury Classification
a. Unintentional injuriesi. Physical damage to the body
4

Injury Surveillance Course -- Draft Outline Objective 1-Understand the Conceptual Model of Injury Prevention
ii. Occur without the intent of anyone involved, it’s not deliberateiii. Can be caused by excessive force to the body, as in an auto accident or a fall or
when the body is deprived of something essential, such as air, as in drowning or smoke inhalation.
iv. Mechanisms of unintentional injury – the source of the energy that causes an injury
1. An impact with a moving or stationary object (mechanical)2. Ultraviolet radiation (Radiant)3. Air or water that is too hot or too cold (Thermal)4. Electrical5. Chemical
v. Unintentional Injuries Chart1. Draw comparisons based on ethnicity using WISCARS data2. The Mechanism of Unintentional Injury3. Place of Occurrence
b. Intentional Injuries/Violence-relatedi. Occur because of a person’s deliberate actions to harm another person, oneself
or a group of peopleii. Can be divided into categories based on the person who commits the violence
and the nature of the violenceiii. Specific types of violence based on person who commits the violence
1. Self-directed – suicidal behavior, self-abuse2. Interpersonal violence inflicted by one person or a small group on
another3. Collective violence is committed by governments or organized groups
iv. The nature of violent acts1. Physical 2. Sexual3. Psychological4. Deprivation or neglect
v. Paragraph on impact of violence in Indian Countryvi. Injury Pyramid from IHS (Burden of Injury: United States 2002, NCHS)
1. Deaths: 161,2692. Hospital Discharges: 1,835,7133. Emergency Department Visits: 32,981,0004. Outpatient and Physician Office Visits: 82,343,000
4. The Cost of Injuriesa. Physical
i. Unintentional injuries are the leading cause of death for AI/AN ages 1-44 (47.1%)
ii. Much higher than those of the general population, in some cases, 2 to 3 times higher
b. Financiali. Nationally injuries cost $224 Billion annually, including direct medical care,
rehabilitation costs, and the cost of lost wages and productivity (Source: CDC, National Center for Injury Prevention)
1. Who Pays
5

Injury Surveillance Course -- Draft Outline Objective 1-Understand the Conceptual Model of Injury Prevention
a. Private Sources, such as insurance pay about 72% of cost ($161 Billion)
b. Public Sources, such as state, local and federal government pay about 28% ($63 Billion)
c. The federal share of the $63 Billion is about $12.6 Billion annually in medical costs and $18.4 Billion in disability and death benefits
ii. Injury Costs for American Indian and Alaska Native Communities for year 200 was $2.1 Billion. Each year more than $2 billion is withdrawn from health care and economic development resources that would have been available had the injury not occurred.
1. Chart –Lifetime Costs of AI/AN Injuries according to 2000 data ($ millions) other statistical information. From: Piland, Neil F. and Lawrence R. Burger. “The Economic Burden of Injuries Involving American Indians and Alaska Natives: A Critical Need for Prevention.” IHS Primary Care Provider 32.9 (September 2007) 269-271.
c. Emotionald. Example: Economic impact of motor vehicle crashes for the San Carlos Apache Tribe
5. Financial Benefits of Injury Preventiona. Brief introduction to benefits of injury preventionb. Interventions that Save Money Bulleted list to include the following
i. DUI Lawsii. Personal Floatation Devices
iii. Smoke Detectorsiv. Gun Locksv. Bike Helmets
vi. Seat Beltsvii. Livestock Control
viii. Othersc. How Intervention benefited the San Carlos Apache
6. Cost Outcome Analysis of Interventions – information to be taken from Cost/Outcomes Analysis of Intervention updated in 2010
6

Injury Surveillance Course -- Draft Outline Objective 1-Understand the Conceptual Model of Injury Prevention
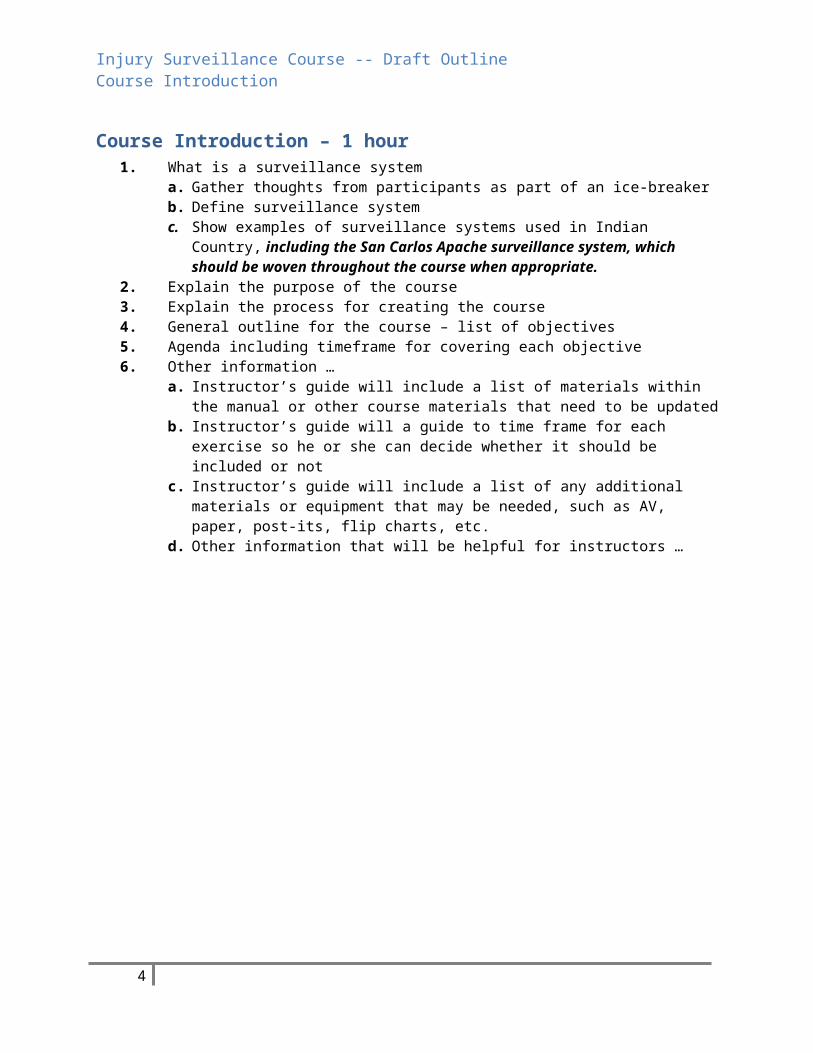
7. Conceptual Models for Understanding and Preventing Injury
a. The Public Health Approach to Injury Prevention using the Medicine Wheel as a Model, pictured above.
i. Define the Problem through surveillanceii. Identify the Risk Factors – who and/or what
iii. Find out what works to prevent the problem iv. Implement and Evaluate Prevention Programs
b. Brief Review of the Epidemiological Triad in the development of disease – host, agent, and environment and how William Haddon applied it to unintentional injuries. The Haddon Matrix and Haddon Counter Measures
c. Brief review of the Ecological Model to address the violence prevention using graph below
Figure 5. Ecological Model for Understanding Violence
Societal Community Relationship Individual
Source: Krug E, Dahlberg L, Mercy J, Zwi A, Lozano R. World Report on Violence and Health. Geneva: WorldHealth Organization; 2002.
7

Injury Surveillance Course -- Draft Outline Objective 1-Understand the Conceptual Model of Injury Prevention
1.2.3.4.5.6.7. Development of a Surveillance System
a. Brief introductionb. Introduce the 7-step plan which incorporates the IHS 10-step plan from level 2 and
models the flow of the course .1. Understand the conceptual model of injury prevention2. Identify existing data sources, determine the strengths and weaknesses of those
data sources, consider linkage with other data sources, describe injury problem with preliminary data analysis.
3. Build a coalition or committee to support the injury surveillance system, data collection and prevention activities
4. Determine the appropriate methodology for the surveillance system, define objectives, perform validation studies, re-evaluate objectives as needed.
5. Define and develop an analysis plan for the surveillance data, develop a plan for disseminating analysis results
6. Use injury surveillance data to inform injury prevention, tie surveillance to action and funding
7. Define an evaluation plan for the surveillance system and monitor prevention activities. Reevaluate objectives/system.
c. Mention that each step will be addressed in detail later in the course/manual8. Ethical considerations
a. Confidentialityb. Privacy – small communities make it possible to identify people even when precautions
have been taken.c. Brief mention of HIPAA, which will be covered laterd. Process of obtaining data and procedures for using data from tribes may be different
from other governments or organizations. May differ from tribe to tribe.9. Summary: Now that you’ve completed this objective you should:
a.Understand the concepts, definitions, and classification of injuriesb.Know the differences between violence related injury and unintentional injuryc. Describe the burden and cost of injuriesd.Know the conceptual models for understanding and preventing injuriese.Know the steps to develop an injury surveillance systemf. Review the ethical consideration
8
Injury Surveillance Course -- Draft Outline Objective 2 – Identify and assess data sources, consider linkage and describe injury problem
Objective 2 – 4 hours Identify and assess existing data sources, consider linkage with other data sources, and describe injury problem with preliminary data analysis.
Identify the injury data sources strength and weaknesses Identify the available data sources that can provide information to the surveillance system Describe the size of the injury problem Compare the frequency of injuries calculated with data from different sources
1. Introductiona. Overview of data sources in an injury surveillance system
i. Death certificatesii. Police reports
iii. Reports on occupational injuriesiv. Local newspaper accounts
b. Linked Databasesi. Useful, but difficult to do. It would be ideal if you could validate the data, but
just getting data in the first place is hard enough. This is a case where you have to let the ideal give way to the reality
ii. May be Costlyiii. May have Limited accessiv. Technical difficulties
2. Determining the Strengths and Weaknesses of a Databasea. Judging Strengths and weaknesses
i. Usefulness for injury surveillance, research and practiceii. Estimate the accuracy, completeness and representativeness
iii. Timelinessiv. Resource and Requirementsv. Simplicity
b. Data Collection Strategy Exercise – 15 minutesi. Imagine you have recently learned the state health department has an injury
hospitalization database. You have a meeting with the lead epidemiologist to learn more about this database and whether or not it might help you in your surveillance effort. What questions would you ask to determine the strengths or weaknesses of this database? Keep the above considerations in mind. Debrief by writing the questions down and discussing.
c. Questions to Consider – possible answers for exercise above. This will be in the appendix
9
Injury Surveillance Course -- Draft Outline Objective 2 – Identify and assess data sources, consider linkage and describe injury problem
i. What is the quality of data?ii. Are the data computerized or must they be manipulated manually?
iii. What period of time do the records span?
iv. How often are data collected: annually, monthly, continuously, periodically?v. Are the data disseminated regularly?
vi. How are data disseminated?vii. Are the data available on the internet or CD-ROM?
viii. What is the most recent year of available data?ix. Is there a report available with the latest results?x. Is reporting of data voluntary?
xi. How complete is the data?xii. How much time is there between the date of the injury and its availability for
surveillance purpose?xiii. Is there a code book that defines variables and coding of variables?xiv. Are analyses available on request?xv. Can custom tabulation be done?
xvi. Is access to original documents possible?xvii. Are there any restrictions on access to records?
xviii. Is a memorandum of understanding required for access?xix. Is there a fee for the data?xx. To what level of geographic specificity are the data available: national, regional,
state, county, city, census tract, zip code?xxi. What type of data is obtained: mortality, morbidity, incidence, prevalence,
nature of injury, severity of injury, body region affected, treatment, length of hospitalization, level of impairment or disability, expected source of payment, cost/charge information, surgical and medical procedures performed?
xxii. What demographic information is available: age (actual years or group categories), date of birth, sex, race, ethnicity, marital status, occupation, industry, education, income, place of residence? When is information collected?
xxiii. What data are available on the circumstances surrounding the injury event: date of injury, time of injury, place of occurrence (home, school, work), intent, product involved, type of weapon involved, and external cause of injury code?
xxiv. What activities were associated with the injury: sports, work, day care, boating, home, recreation, farm, domestic violence, child neglect or abuse?
xxv. Is a narrative description available?xxvi. Area data included on contributing behaviors: seatbelt use, airbag installation,
smoke detector installation, drug and alcohol involvement, riding with a drinking driver, bicycle helmet use, motorcycle helmet use, protective equipment for sports, unsupervised swimming, swimming pool fencing, swimming ability, firearm storage, weapons carrying, physical fighting, mental health treatment, previous suicide attempt?
xxvii. What other barriers are there to the use of these data?xxviii. What is the quality of the data
d. Graphic of common data sources for a fatal injury surveillance system in Indian Countryi. Forensic Medicine
ii. Transportation office
10

Injury Surveillance Course -- Draft Outline Objective 2 – Identify and assess data sources, consider linkage and describe injury problem
iii. BIA Law Enforcementiv. Transportation Officev. EMS
vi. District Attorneyvii. Police
viii. Tribal Resources: registry, burial fund registry, enrollment records3. Describe Data Collection Method and Data Flow
a. Data Collection Methods i. Record Abstraction
ii. Surveysiii. Personal Interviewsiv. Focus Groups
b. General information to includei. General description of data flow when a death occurs every state different
c. Three types of death certificate datai. Death Certificate may be available within 30 days
ii. Preliminary electronic data iii. Final death certificate data – clean and fully coded may take up to a year or
mored. Process for investigating an injury death in IC. Open it up to the class for discussion
because every tribe is different. Include a paragraph or two about some general investigative practices.
4. Identify Data Sources to Include in a Surveillance Systema. Take advantage of existing data sources. There may be some limitations depending on
the intent of the data collection, but almost all data sources have limitations. Existing data sources can save you time and resources.
b. Injury events determine which data sources are necessary to provide information.c. Table: Possible Data Sources in an Injury Surveillance System – these entities may have
data at the national, state or local level.d. National data provides the big picture in the US and may be in the states. Generally not
sufficient for community program development.e. State and local data more likely to reflect a local injury problem. Problems: not always
computerized, lag time, race not always specified. f. WISQARS a source of data, allows mapping, etc. – more explanation needed, sum this
up in a paragraph or two. Fully explain what WISQARS is, what information is available, and mention new features and tutorial that is being developed.
g. Data Source Matrix for IC – needs to be developed
11

Injury Surveillance Course -- Draft Outline Objective 2 – Identify and assess data sources, consider linkage and describe injury problem
Possible Data Sources by Event
Events Police ForensicMedicine
PublicHealth CHR/
Health care
Delivery
Family/Community
Child Protecti
ve Services Tribal
ResourcesResources
FatalHomicideSuicideTransport -Related deathsOtherUnintentionalDeaths
Non- FatalHomicideAttemptSuicideAttemptTransport-RelatedInjuriesOtherUnintentionalInjuriesDomesticViolenceChildMaltreatmentElderly Abuse
5. Linkage with other data sourcesa. It is unlikely for a single source to contain all the information desired for your
surveillance system.b. It would be ideal to be able to compare data sources, but form most in Indian Country it
would not be practical or achievable. c. Advantages
i. Supplemental dataii. Comprehensive description
iii. Highlights completeness from each sourceiv. Improve data quality
d. Disadvantagesi. Personal identifiers needed/confidentiality
ii. Interagency politicsiii. Different storage mediaiv. Data quality
e. Conduct Preliminary Data Analysis
12

Injury Surveillance Course -- Draft Outline Objective 2 – Identify and assess data sources, consider linkage and describe injury problem
i. To understand the finer nuances of a data source’s completeness and adequacy it is often necessary to carry out data analysis
ii. Data identifies patterns and trendsiii. Observation data documents behavioriv. Start with an analysis of a broad category, such as interpersonal violence, then
go more in depth as possible, (for example domestic violence among women)v. Seek the assistance of epidemiologist. Seek them out from such places as state
health departments, epi centers, academic institutions and graduate students (in the appendix provide a list of Epi Centers in Indian Country)
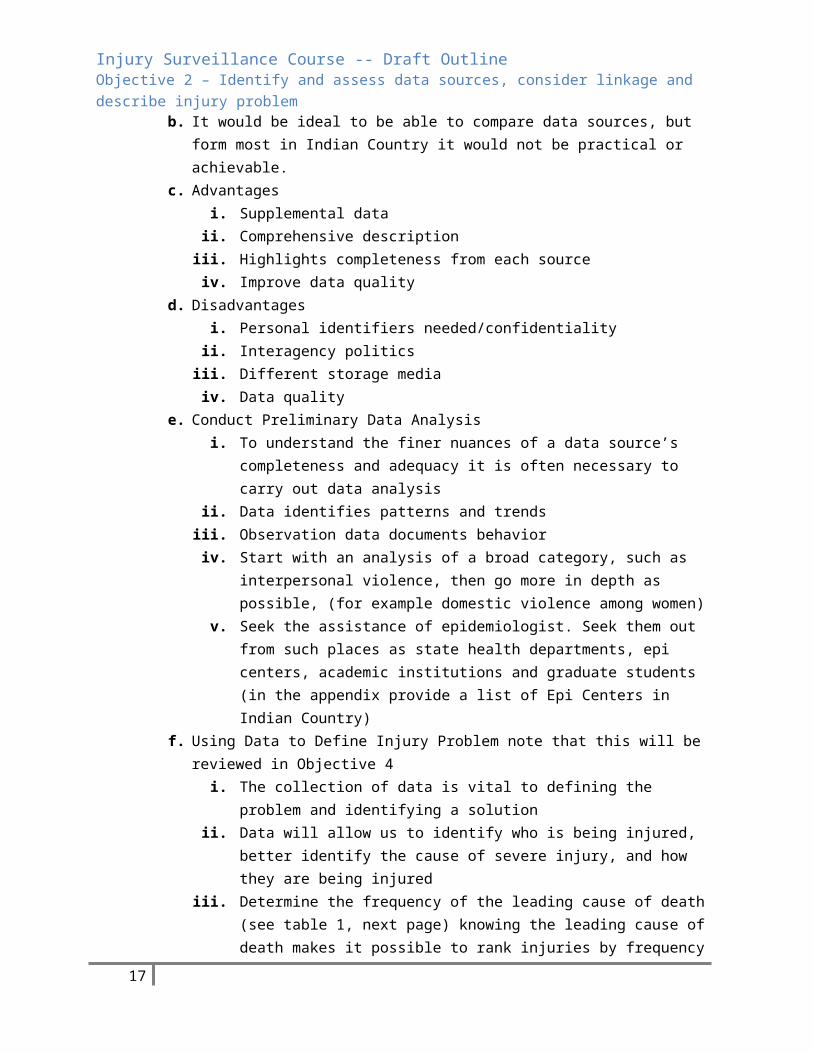
f. Using Data to Define Injury Problem note that this will be reviewed in Objective 4i. The collection of data is vital to defining the problem and identifying a solution
ii. Data will allow us to identify who is being injured, better identify the cause of severe injury, and how they are being injured
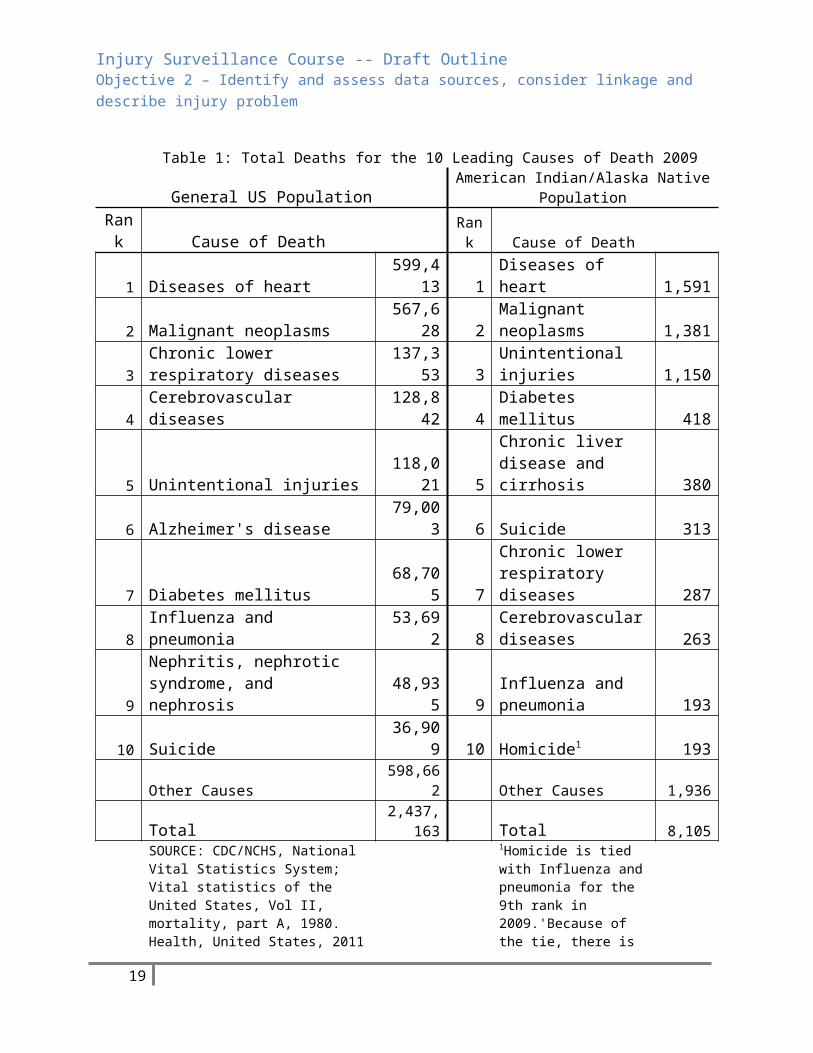
iii. Determine the frequency of the leading cause of death (see table 1, next page) knowing the leading cause of death makes it possible to rank injuries by frequency
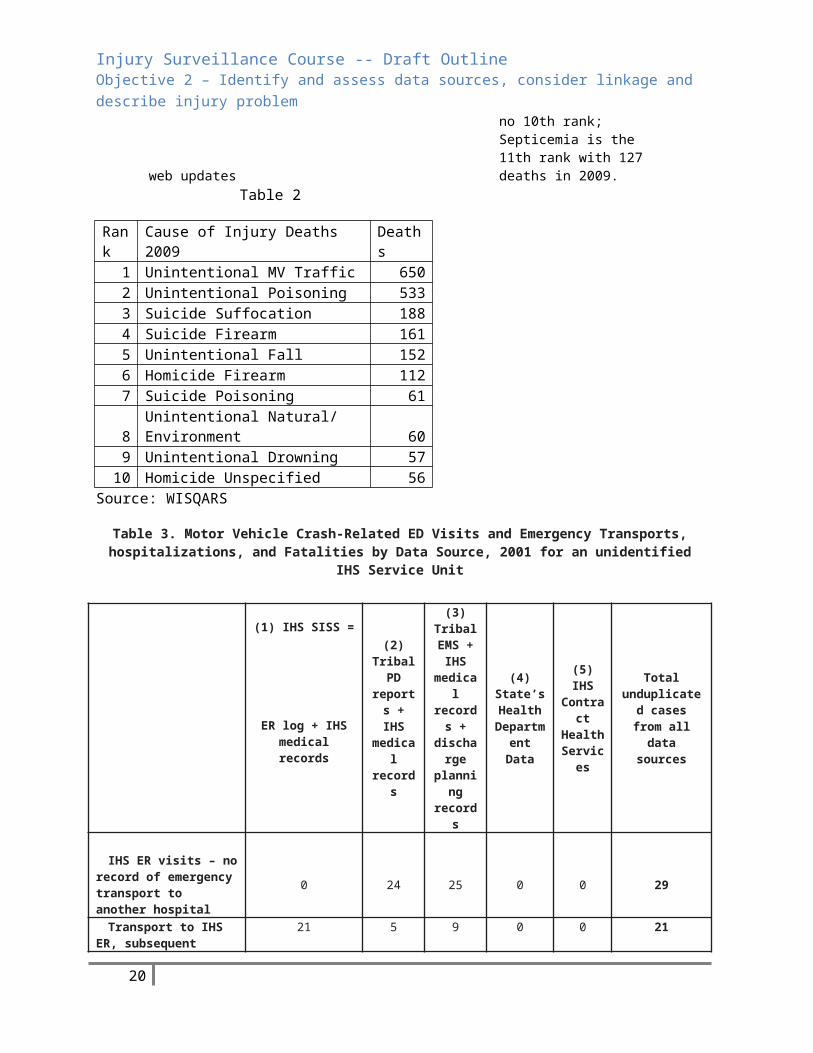
iv. Determine the frequency of leading cause of Injury Deaths. (table 2 next page)v. Compare the frequency of injuries calculated with data from different sources
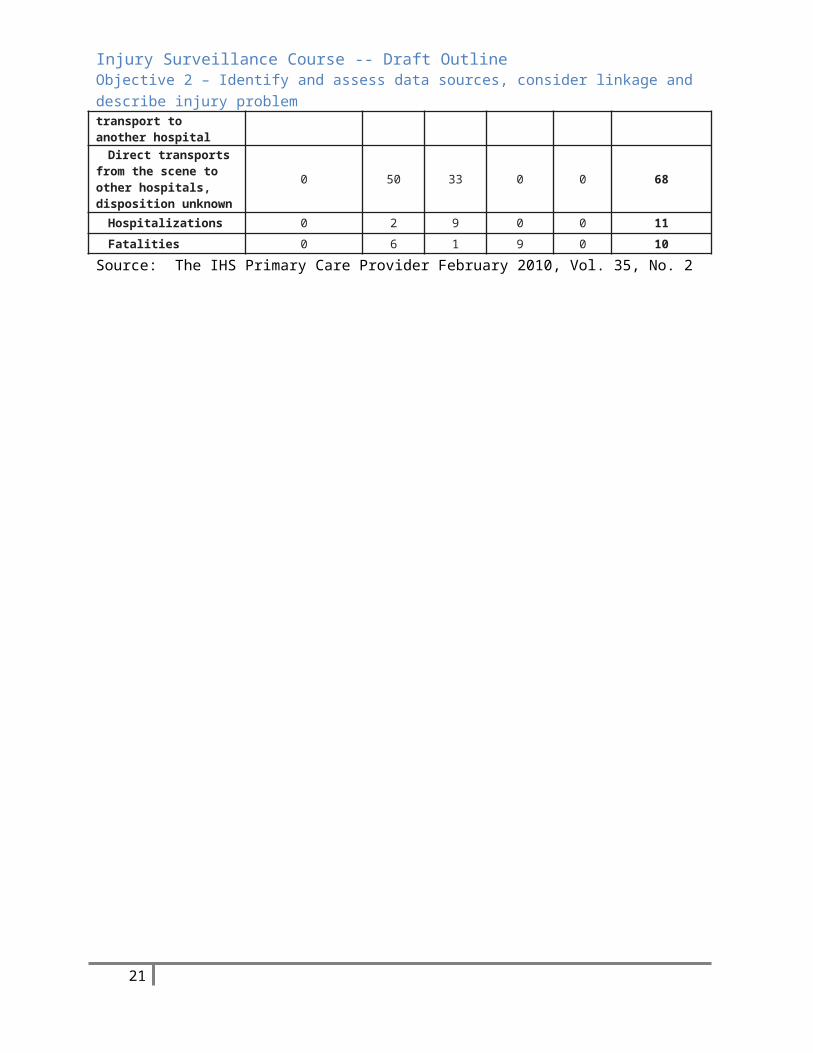
Injury data are commonly collected for different purposes according to the mission of each institution. Identifying the goal behind each and comparing the goals with the objectives of the surveillance system will help explain differences in numbers. (mention racial misclassifications in some data bases) See Table 3 Page 7 (note: even though this table does not compare suicides reported from different data sources, it does compare mv crashes reported from different data sources. Please let me know if you think it is a suitable replacement for the table on page 35 of objective 2)
6. Summary now that you’ve completed section you should be able to:a. Identify Injury Sources and the strength and weaknesses of eachb. Identify available data sources that can provide information to the systemc. Describe the size of the injury problem
13

Injury Surveillance Course -- Draft Outline Objective 2 – Identify and assess data sources, consider linkage and describe injury problem
Table 1: Total Deaths for the 10 Leading Causes of Death 2009General US Population American Indian/Alaska Native Population
Rank Cause of Death Rank Cause of Death
1 Diseases of heart 599,413 1 Diseases of heart 1,5912 Malignant neoplasms 567,628 2 Malignant neoplasms 1,381
3Chronic lower respiratory diseases 137,353 3 Unintentional injuries 1,150
4 Cerebrovascular diseases 128,842 4 Diabetes mellitus 418
5 Unintentional injuries 118,021 5Chronic liver disease and cirrhosis 380
6 Alzheimer's disease 79,003 6 Suicide 313
7 Diabetes mellitus 68,705 7Chronic lower respiratory diseases 287
8 Influenza and pneumonia 53,692 8Cerebrovascular diseases 263
9Nephritis, nephrotic syndrome, and nephrosis 48,935 9
Influenza and pneumonia 193
10 Suicide 36,909 10 Homicide1 193Other Causes 598,662 Other Causes 1,936
Total2,437,16
3 Total 8,105
SOURCE: CDC/NCHS, National Vital Statistics System; Vital statistics of the United States, Vol II, mortality, part A, 1980. Health, United States, 2011 web updates
1Homicide is tied with Influenza and pneumonia for the 9th rank in 2009.'Because of the tie, there is no 10th rank; Septicemia is the 11th rank with 127 deaths in 2009.
Table 2
Rank Cause of Injury Deaths 2009 Deaths
1 Unintentional MV Traffic 6502 Unintentional Poisoning 5333 Suicide Suffocation 1884 Suicide Firearm 1615 Unintentional Fall 1526 Homicide Firearm 1127 Suicide Poisoning 618 Unintentional Natural/ Environment 60
14

Injury Surveillance Course -- Draft Outline Objective 2 – Identify and assess data sources, consider linkage and describe injury problem
9 Unintentional Drowning 5710 Homicide Unspecified 56
Source: WISQARS
Table 3. Motor Vehicle Crash-Related ED Visits and Emergency Transports, hospitalizations, and Fatalities by Data Source, 2001 for an unidentified IHS Service Unit
(1) IHS SISS =(2)
Tribal PD
reports + IHS
medical records
(3) Tribal EMS +
IHS medical records
+ dischar
ge plannin
g records
(4) State’s Health
Department Data
(5) IHS Contra
ct Health Service
s
Total unduplicated cases from all data sourcesER log + IHS
medical records
IHS ER visits – no record of emergency transport to another hospital
0 24 25 0 0 29
Transport to IHS ER, subsequent transport to another hospital
21 5 9 0 0 21
Direct transports from the scene to other hospitals, disposition unknown
0 50 33 0 0 68
Hospitalizations 0 2 9 0 0 11Fatalities 0 6 1 9 0 10
Source: The IHS Primary Care Provider February 2010, Vol. 35, No. 2
15

Injury Surveillance Course -- Draft Outline Objective 3 – Build a coalition or committee to support the injury surveillance system, data collection and prevention activities
Objective 3 – 1 hour Build a coalition or committee to support the injury surveillance system, data collection and prevention activities
Identify partners to include in the coalition and recruiting strategies for involving them Identify local and national organizations working on injury prevention and control in the region Define the existing social, legal and political framework in which an injury surveillance system
and prevention activities may be established
1. Introduction: A coalition is an alliance of organizations working together for a common purpose. Ideally an injury surveillance system would include individuals from different sectors. Integrating the expertise of professionals from multiple disciplines might prove valuable in addressing injury problems. This may not be practical for every tribe or community.
a. Circumstances vary from one community to the next but, consider these issues when forming a coalition
i. Commitment of lead agencyii. Effective core planning group
iii. Planned recruitment of coalition membersiv. Coalition structurev. Staff roles
vi. Missions and goalsvii. Leadership
viii. Education of coalition membersix. Ownership and commitment of coalition membersx. Successful implementation of pilot project
xi. Recognition of coalition members2. Identify Partners to Include in the Coalition, considerations
a. The different roles that might be necessary to the success of your surveillance system. For Example: someone from the health center who can provide information on HIPAA or guidelines that have been developed for that facility
b. People who have access to different data sources – tribal Police department, Health Personnel (Community Health Reps, EMS, tribal clinic staff) tribal police department, tribal court staff,
c. What support do you need and which organizations can provide that supportd. Whose objectives overlap with yourse. What role will the organization members fulfill in the coalitionf. What kind of data do they collectg. Why do they collect datah. Are there mutual benefitsi. Can you share or link data
16
Injury Surveillance Course -- Draft Outline Objective 3 – Build a coalition or committee to support the injury surveillance system, data collection and prevention activities
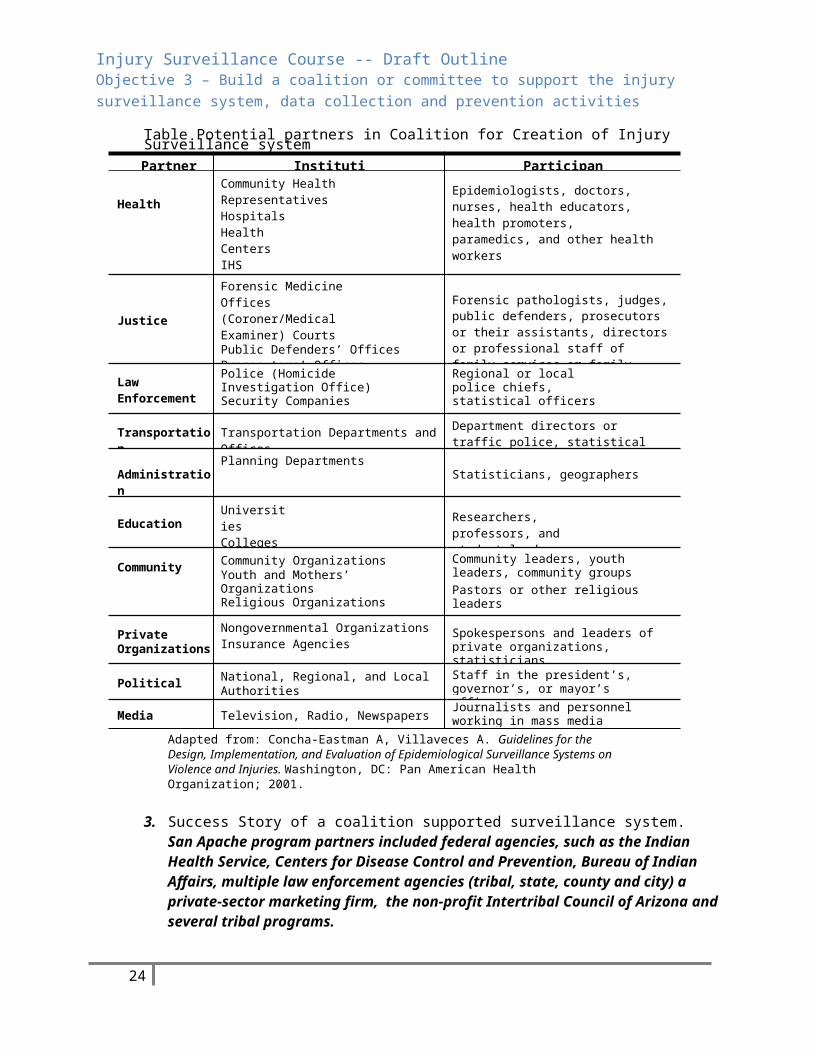
Table Potential partners in Coalition for Creation of Injury Surveillance systemPartner Institutions Participants
HealthCommunity Health RepresentativesHospitals Health CentersIHS Hospital, tribal clinicTrauma registry
Epidemiologists, doctors, nurses, health educators, health promoters, paramedics, and other health workers
Justice
Forensic Medicine Offices (Coroner/Medical Examiner) CourtsPublic Defenders’ OfficesProsecutors’ OfficesFamily Services or Counseling
Forensic pathologists, judges, public defenders, prosecutors or their assistants, directors or professional staff of family services or family counseling
Law Enforcement
Police (Homicide Investigation Office) Security Companies
Regional or local police chiefs, statistical officers
Transportation Transportation Departments and Offices Department directors or traffic police, statistical officers
AdministrationPlanning Departments
Statisticians, geographers
EducationUniversities Colleges Schools
Researchers, professors, and student leaders
Community Community OrganizationsYouth and Mothers’ OrganizationsReligious Organizations
Community leaders, youth leaders, community groupsPastors or other religious leaders
PrivateOrganizations
Nongovernmental OrganizationsInsurance Agencies Spokespersons and leaders of private
organizations, statisticians
Political National, Regional, and LocalAuthorities
Staff in the president’s, governor’s, or mayor’s offices
Media Television, Radio, Newspapers Journalists and personnel working in mass media
Adapted from: Concha-Eastman A, Villaveces A. Guidelines for the Design, Implementation, and Evaluation of Epidemiological Surveillance Systems on Violence and Injuries. Washington, DC: Pan American Health Organization; 2001.
3. Success Story of a coalition supported surveillance system. San Apache program partners included federal agencies, such as the Indian Health Service, Centers for Disease Control and Prevention, Bureau of Indian Affairs, multiple law enforcement agencies (tribal, state, county and city) a private-sector marketing firm, the non-profit Intertribal Council of Arizona and several tribal programs.
4. Identify local, county and state organizations working in injury prevention and controla. Give example after each … local i.p. coalition; county ip coalition; State, death
review team or trauma registry
17

Injury Surveillance Course -- Draft Outline Objective 3 – Build a coalition or committee to support the injury surveillance system, data collection and prevention activities
5. Determine the existing political, social and legal framework within which the surveillance system and prevention strategies will be established.
a. Data drives policy in IC (for IHS in particular). Politically it helps with leverage for budget negotiations.
b. Illustrates the benefits of a surveillance system (maybe move this information to that section)
6. Be aware of what’s going on socially, legally and politically in a tribe when you’re doing surveillance.
7. Summary – Now that you’ve completed this section you should be able to a. Identify partners to include in the coalition and recruiting strategies for involving
themb. Identify local and national organizations working on injury prevention and control in
the regionc. Define the existing social, legal and political framework in which an injury
surveillance system and prevention activities may be established
18
Injury Surveillance Course -- Draft Outline Objective 4 –Determine the appropriate methodology for the surveillance system, define objectives, perform validation, re-evaluate objectives
Objective 4 – 3.5 hoursDetermine the appropriate methodology for the surveillance system, define objectives, perform validation studies, re-evaluate objectives as needed.
Define the Injury events and data elements to be included in the system Develop the data collection instrument and determine data collection frequency Plan for Systemization, Maintenance and Data Security Define Key positions
1. Introduction (will touch briefly on the following topics) a. Discussion of what people want in their system. – Comprehensive or specific – i.e. suicide,
domestic violence, etc.b. Discuss ideal versus reality - tailored locally based on resourcesc. Size and type of injury problemd. Available data sourcese. Feasibility of getting informationf. Political aspects of getting informationg. Potential for defining interventionsh. Planning Summary for Data Collection
i. Identify the Topicii. Narrow your Focus
iii. Identify a Specific Questioniv. Anticipate Data Needsv. Develop and Pre-Test your Instrument
i. Working with Small Data Sets2. Define the injury events and determine the data elements to include in the system
a. Case Definition (Pages 32-41)i. Injury pyramid
1. Death (the tip)a. Data Readily accessibleb. Cause of death from injury Consistently reportedc. Rare eventd. Not a good guide to ascertain the overall injury problem or medical
consequencese. Influenced by small numbers, especially populationf. Race/ethnicity information is usually available
2. Hospitalizations (below deaths)a. When combined with mortality data, provides a much better picture
of injury problem
19
Injury Surveillance Course -- Draft Outline Objective 4 –Determine the appropriate methodology for the surveillance system, define objectives, perform validation, re-evaluate objectives
b. Disability and health care costs can be better describedc. Access to data more difficult (privacy, HIPAA, manual records)d. Incomplete or inconsistent coding of injury causation.e. Data collection consumes human resourcesf. Race/ethnicity is sometimes available
3. ED visits (below Hospitalizations)a. When combined with death and hospitalization data, helps provide
the big pictureb. Small populations with limited injury mortality & hospitalization
may benefit by casting the net wider to include ED visitsc. ED visits data can be useful for specialized studyd. Large number of cases may be difficult to managee. Access to data may be difficult – manual recordsf. Inconsistent or incomplete identification of injury causationg. Race/ethnicity information not as readily available from non-local
sources4. Outpatient visits – Bottom of the pyramid
a. May be good for specialized injuries (sports related, eye injuries)b. Might be good supplemental information, but in general not the
place to start with injury surveillancec. Difficult access (data highly protected by practitioners)d. Race/ethnicity information not readily available
5. Summarya. Don’t try to do everything at onceb. Start small with deaths and most severe injuriesc. Plan to expand or phase-in other levels of severity as your resources
permitd. You can work on prevention projects without knowing everything
about every injury in your communityb. The use of e-codes in your system
1. E-codes – the value of e-codesa. Allow the ability to identify tendsb. Allows the ability to describe the specific causes and contributing
factors associated with an injury.c. ICD 10 and injury coding
2. Limitations of e-codea. Records not always codedb. Miscoding or inconsistent codingc. Poor Chart info results in non-specific e-coded. Don’t always provide the desired specificitye. Must stay apprised of updates
20
Injury Surveillance Course -- Draft Outline Objective 4 –Determine the appropriate methodology for the surveillance system, define objectives, perform validation, re-evaluate objectives
f. Not required for billing so they are seen by some coders as unnecessary
3. Reading an e-code and coding data -- exercise – Note: 30 minutes was allotted for this exercise in IHS Course. If time is a concern use fewer examples.The examples below were taken from IHS Material. Using ICD-9 (or 10?) code book, participants are asked to code the following events.
a. Pedestrian run over by motor vehicle while walking in crosswalk at corner of Main Street and 3rd Avenue.
b. Unrestrained passenger of pickup truck ejected when tire blew, driver lost control, ran off road, and overturned.
c. 36 year old female diagnosed with depression attempted suicide by hanging.
d. Boy admitted to hospital with BB gun shot to eye.e. Intoxicated individual fell out of bed of stationary pickup truck.f. Wife was assaulted and stabbed with knife by husband.g. Severe allergic reaction due to scorpion bite.h. Smoke inhalation from house fire that was caused by faulty wiring.
There was no smoke detector in the home.i. Neck injury due to diving and striking head against bottom of
swimming pool.j. Fall off bull during rodeo.
ii. Case definition exercise page 40 – Time ?1. Use the provided scenario to develop a case definition based on a real
concern of someone in your group.2. The primary data you intend to use is hospital ED records and patient
medical charts3. Considerations: person, place, time, intent, severity4. Debrief points:
a. Do you think you will capture all injuries meeting case definitionb. What additional data sources should you considerc. Group comments
iii. Case definition chart page 42 -- chart compares case definitions from the public health perspective (using ICD-10 codes) vs. the law enforcement perspective.
c. Defining Variablesi. General Discussion
1. Keep the goal in mind – goal is intervention, prevention activity2. Be mindful of ideal vs. reality3. The simple form more likely to yield information, although it may not be
everything you want to know.4. Consider subsequent forms to gather more details
21

Injury Surveillance Course -- Draft Outline Objective 4 –Determine the appropriate methodology for the surveillance system, define objectives, perform validation, re-evaluate objectives
5. The variables you choose to include will depend on your locality, culture, availability in the data sources, etc. – rodeo injury related variables vs. snowmobile injury related variables
ii. Name – often not available, not used or not collected. Use hospital case number or DOB in lieu of name. Privacy/HIPAA issues.
iii. Age and sex – iv. Education Level – consider the need for the information. Will the education level
impact your intervention activitiesv. Employment Level – Same consideration as Education Level. Will it impact
intervention. Why you might want it: Could help determine work related injuries. vi. BAC – important variable, but not always available. May have to settle for Alcohol
involved (needs to be defined) and Alcohol related (needs to be defined), both terms are often locally defined
vii. Occupant Protection for Transportation – horses, skateboards, motorized vehicles, such as snow mobiles, boats – seat belts, helmets, life jackets, etc.
viii. Time Related variable: 1. Date and time of injury event, ideally time the injury occurred. Realistically
most of the time you only know the time of medical treatment. Choose one variant and go with it, even if it’s not the most accurate indication of when the injury occurred.
a. A drawback: in some cases people don’t seek medical treatment until much later. For example, A Navajo clinic was getting a lot of people coming in for fall related injuries on Monday morning, but the injuries were occurring over the weekend.
ix. Place Related Variables:1. Place where injury occurred, residence of injured person.
a. Injuries often occur when people travel to places for activities – hunting, fishing, drinking -- ideally you collect both. But sometimes the information is very general – such as the nearest village. Specifics are great, but if you can’t get them you work with what you have.
x. Variables related to the event circumstances1. Relationship of victim to aggressor2. Mechanism3. Context4. Criminal history of victim and/or aggressor5. Example: Phase 1/Phase 2 -- There’s value in collecting as much information
as possible, but the more information you try to collect, the likely your form will be filled out accurately or at all. Some IHS areas have used a two phased approach. -- Phase 1 form used to collect basic information about injury,
22

Injury Surveillance Course -- Draft Outline Objective 4 –Determine the appropriate methodology for the surveillance system, define objectives, perform validation, re-evaluate objectives
Phase 2 used to collect more detailed information based on the specific injury
xi. Chart showing variables collected-- use forms supplied by group members as example of what variables are collected. Stress that each should customize forms to fit the needs of their community and available data. Give the example of white river having to re-do their entire system based on changes out in the real world.
xii. You must define what you want in your system and that leads to the creation of a form.
xiii. System protocol examples – show what decisions you made in determining how to run the system.
3. Develop Data Collection Instrument and Determine Data Collection Frequencya. Now must determine how design a form to capture the data/variables, we’ve decided to
include.b. Data Collection Planning – most data is record abstraction, gathering data from somebody,
recording what you need. on-going surveillance – Maybe the place for Data Collection Buzz group if there is time – See Learn How to Obtain data item 1.
c. Discussion of length – page 50i. Keep it simple
ii. Only include the data you need and then use analysis to answer case definition questions later.
iii. The simpler the form, the greater its usefulness over a long period of time, the more likely you’ll be able to collect that data over a long time. There’s no right or wrong approach, but length is a consideration.
iv. Keep the form easy on the eyev. Decide whether or not to precode the form. Provide a precoded list of possible
answers to a question as opposed to open-ended questions. When possible use numbers rather than letters. Numbers are easier to process and less prone to error.,
vi. Examples of forms from different area offices available in the appendixvii. Each surveillance system is unique and will have access to different data sources.
viii. No such thing as a perfect system, find something that works for your needsd. Pre-test - page 51
i. Very importantii. Pretesting done with a draft form of the instrument to allow changes to be made
prior to a full investigation.iii. Pretesting helps identify if the questions and format are appropriate, clear, relevant,
and result in the appropriate data. Help determine if the case definition is accurate. It’s done with a draft form of the instrument to allow changes to be made prior to a full investigation.
iv. Not unusual to change a form two or three times or more before implementing it.v. Data Collection Planning Summary –Learn how to Obtain data items 1&2
1. Decide what you want out of surveillance
23
Injury Surveillance Course -- Draft Outline Objective 4 –Determine the appropriate methodology for the surveillance system, define objectives, perform validation, re-evaluate objectives
2. Identify your case definition3. Define your variables4. Develop your form5. Consider how HIPAA/Privacy considerations impact your 6. Test it 7. Include discussion of when to change or abandon your form8. Include discussion of quality control in general for the surveillance system
e. Frequency of Data Collection up to each locality to determine. Some considerations: i. The protocol for your system,-- Your needs
ii. Your resources – human and financialiii. The requirements of the stakeholdersiv. The magnitude of the injury problem in your area
f. Active versus passive collection. Active collection where a patient is sought out and interviewed about his or her injury is not done as a rule. Most information comes from police reports, ER logs, etc. Patients are not usually questioned because it’s not practical in most cases. Most surveillance in IC is passive in that the data was extracted from forms that were filled out by health care providers in the course of doing their job – for example death certificates or ER logs filled in by doctors. See the list of possible data sources in the appendix.
g. How confidentiality laws may impact your efforts – You should be familiar with HIPAA – the Health Insurance Portability and Accountability Act. This law, passed in 1996 safeguard’s an individual’s private health information (PHI) and it may impact your surveillance efforts. Consult with your local Institutional Review Board if your area has one or with the medical records coordinator at facility where you are gather data regarding your surveillance efforts and federal privacy laws. For more information on HIPAA visit http://www.hhs.gov/ocr/privacy/index.html or check the appendix for a list of classes.
4. Determine the type of Surveillance System -- there are several ways of setting up a surveillance system depending on the objectives to be met, budgetary considerations, the size of your staff, your locality. The Pan Am Health Organization describes several types of Surveillance systems some of which may not be appropriate for your needs.
a. Universal surveillance: Most commonly used system and the one most likely to work for Indian Country. The total number of cases occurring within a defined population is included in the system. This population-based surveillance accounts for all cases that occur. This is the preferred method of monitoring the occurrence of fatal injuries because rates of injuries and injury risk factors can be calculated and generalized to the population. Most surveillance in Indian Country is an attempt to capture all data. The methods below may be done as a follow up to capture more data on specific injuries.
b. Surveillance based on samples of cases: The information is obtained from a portion of the total number of cases or events. The sample must be representative so that inferences can be made regarding all possible cases occurring in the population. This method can be used to collect information about nonfatal injuries or as follow up to collect more data on specific injuries.
24

Injury Surveillance Course -- Draft Outline Objective 4 –Determine the appropriate methodology for the surveillance system, define objectives, perform validation, re-evaluate objectives
c. Surveillance based on a review of institutional registries: Institutional registries are reviewed periodically to analyze and identify variables of interest. When using this method, it is important to properly identify the institutions and the sources within institutions, such as clinical and emergency records, hospital discharges, or complaints filed with police or family welfare institutions. It is useful for monitoring specific injuries.
d. Survey-based surveillance: Information is obtained through questionnaires focused on a specific topic, within a predefined period of time, and at predefined intervals. In the United States, for example, self-reported seat belt and safety seat use is measured at the state level by household surveys conducted for the Behavioral Risk Factor Surveillance System (BRFSS), by school-based surveys conducted for the Youth Risk Behavior Surveillance System (YRBSS), and by direct observation of passenger vehicle occupants for the National Occupant Protection Use Survey.11
e. Sentinel surveillance: One or more institutions are chosen to monitor trends, target surveillance activities, and suggest preventive interventions. In general, surveillance systems of this type are not representative of the population, but are useful for calling special attention to risk situations and thus fulfill a key function for injury prevention decision-making. One example of this type of surveillance is the approach taken by child death review teams, which gather and analyze data on the circumstances surrounding all causes of child deaths. Sentinel surveillance systems complement other sources of information for injury prevention.
5. Describe San Carlos system as an example. Show examples of forms, protocol etc. if possible?6. Plan for Systemization, Maintenance and Data Security – Quality control issues and protocol
i. If you don’t have an electronic database set up, seek the assistance of a programmer, an epidemiologist or a statistician. Epi Info 2002 is free software available through the CDC. For an overview of the software and installation and use instructions visit http://wwwn.cdc.gov/epiinfo/7/index.htm. Any paper records associated with the system – original data sources, forms, etc. -- need to be kept in locked storage if there are personal identifiers
ii. Data maintenance should focus on the following1. Reducing errors that may be introduced through flaws in the design. 2. Improving the systems scope and services through routine maintenance,
emergency maintenance and requests for special reports. Should be based on local needs. consider some of the following
a. Backing up data and system files according an established schedule. b. Maintaining records in a secure environmentc. Requiring requests for emergency maintenance to be in writing and
entered into a logd. Assigning priorities for special requests on the basis of urgency of
need and time and resources required for fulfillmente. Institutionalizing routine maintenance f. Documenting maintenance that is conducted
3. Safeguarding your system. Should be based on local circumstances.a. Consider limiting access to one person
25

Injury Surveillance Course -- Draft Outline Objective 4 –Determine the appropriate methodology for the surveillance system, define objectives, perform validation, re-evaluate objectives
b. Consider installing the database on two computers. A primary computer and one reserved for testing changes to the system. The second computer can also serve as a backup in case the first one fails.
c. Consider keeping a second copy of the database off site. Routine updates of the offsite copy must be done.
d. Threats to a databasei. Human error
ii. Mechanical failureiii. Malicious damageiv. Cyber Crimev. Invasion of privacy
vi. Computer viruses4. Protocol – Successful surveillance systems will have clearly written protocol
Include examples provided by Workgroup. Will vary with needsa. Include procedures for obtaining and securing datab. Maintenance c. Rules for data storaged. Rules for password protection and passwords
7. Define staff and key positions necessary a. Ideally a surveillance system will have a core staff, both part time and full time, that would
include program manager, data manager, research analyst and coordinator. This is seldom if ever possible in Indian Country. In Indian Country it is more like that your staff will consist of one or two people who will fulfill all of the functions of the system. Some of the key staff functions include:
i. Coordinate system activitiesii. Establish contact with data sources and stakeholders
iii. Data entryiv. Quality Control v. Analysis
vi. Preparation of Reportsb. Advisory Board/Coalition – Just as with coalitions mentioned early an advisory board if
possible could be helpful for offering technical advice, strategic planning and support for the surveillance system, but the reality is that often you will be working with just a few people. Within the IHS, sometimes district or area IP staff can fill some of the functions of an advisory board. A tribal health director of tribal epidemiologist can assist you as well by providing information or answering specific questions. This may be more realistic than an advisory board or coalition. Whether your advisors are a board or just a few people, it may be necessary from time to time to seek a group or an individual’s assistance with the following
i. Obtaining the data necessary for the injury surveillance system
26
Injury Surveillance Course -- Draft Outline Objective 4 –Determine the appropriate methodology for the surveillance system, define objectives, perform validation, re-evaluate objectives
ii. Review and Advice on policy and procedures for data collection, linkage, publications, and mechanisms for implementing a reporting system
iii. Identifying the best use of dataiv. Strategizing about how to remove obstacles and inefficiencies v. Providing speaking opportunities with professional organizations
vi. Obtaining data sharing agreementsvii. Showing broad, high-level support for the system.
viii. Getting local approval to start a surveillance systemix. Navigating tribal politics or resistance to surveillance, data collection or data sharing
c. Explain staffing and partners for San Carlos 8. Summary now that you’ve completed this section you should be able to:
a. Define the Injury events and data elements to be included in the systemb. Develop the data collection instrument and determine data collection frequencyc. Plan for Systemization, Maintenance and Data Securityd. Define Key positions
27

Injury Surveillance Course -- Draft Outline Objective 5 – Define and develop an analysis plan for the surveillance data, develop a plan for disseminating analysis results
Objective 5 – 4 hoursDefine and develop an analysis plan for the surveillance data, develop a plan for disseminating analysis results
Calculate injury indicators such as frequency, percentages and crude, specific and adjusted rates
Calculate years of Potential Life Lost Describe the geographical analysis of the data Define a plan to disseminate and communicate the data
1. Introductiona. In the previous session we discussed the collection of data. In this session we will talk
about what to do with data once it is collected. Data requires analysis. Analysis tells us the who, what, when, why and how of injury.
b. Review of concepts and terms associated with data analysis (from level 2 injury prevention class) the following terms are reviewed in separate slides
i. Epidemiology as it applies to injury prevention is the study of trends and patterns of injury in a community. The who, what, when, where, why and how of injury. “The study of the distribution and determinants of health-related states or events in specified populations and the application of this study to control health problems.” A Dictionary of Epidemiology
ii. Population-Based – Epidemiology is population based, concerned with the community not the individual. Some injuries, such a shark attack, may get the headlines. But real numbers tell a different story. If IP efforts were based on headlines, you might fail to address the leading causes of injuries, such as MVCs, Poisoning, falls, drowning or suffocation. Headlines, emotions and politics can and sometimes will influence injury prevention efforts, but utilizing data will help you discover the leading causes of injury and keep things in perspective.
iii. Injuries are not random – There are causes for injuries and a way to reduce them
iv. Risk is the probability that an event will occur. v. Risk Factor is an attribute or exposure that could increase the probability of a
specific outcome. A risk factor can sometimes be modified by an intervention, which would reduce the probability of the specific outcome. Some risk factors, such as age, sex, race and family history are often major determinants of risk. These types of risk factors cannot be changed. Other risk factors, such as seat belt use, drinking and driving, personal protective equipment can be modified to reduce risk.
vi. Endemic vs. Epidemic 2. Data Analysis – General Concepts
a. To Analyze1. to separate into elements or constituent parts2. Separate parts of a whole so as to reveal their relation to one another3. Examine critically or methodically
28

Injury Surveillance Course -- Draft Outline Objective 5 – Define and develop an analysis plan for the surveillance data, develop a plan for disseminating analysis results
ii. No set formula/rule/ methodology … analysis is as much an art as a scienceiii. Start with simple frequencies/counts of data variablesiv. Look for patterns, clusters, the unusual, the unexpectedv. As necessary, progress to more complex analysis
b. Analysis involves basic statistics (the counting) and Interpretation (what does it mean)c. Basic rules to consider
i. Indicate “N” (number of data items in the data set) or “n” (number of items ins the data subset)
ii. Small numbers ≠ “bad” results … you simply need to qualify/acknowledge the N upfront.
d. Two common misconceptions to avoid: i. the computer does not think for you. It does the counting, but you have to
interpret what the numbers mean.ii. A correlation does not necessarily imply a causation
3. Basic Statisticsa. Intro: There are numerous ways to analyze data. The level of analysis will depend on
what you are trying to determine from the data (e.g. descriptive study, grants evaluation) and your technical abilities to analyze the data. You don’t need to be a statistician, to utilize basic statistics to help you better describe and understand injury data.
b. Numeric Value – Simply presenting the numeric value of a data variable is one data analysis method. Data from an injury surveillance system provides information about the number of cases in a given event. This method is very common and the information is easy to understand. Numeric value of one variable cannot be compared to that of the same variable in a different population. As a result, numeric values do not indicate risk.
c. Midpoint – Measure of central tendenciesi. Mode -- value that appears most often in a set of data
ii. Median – middle most number in a set of dataiii. Mean – the average
d. Proportional distribution – the percent of the total number of events in a data set which occurred in each of the categories (or subgroups) of that set. Percentages are commonly used and simple to calculate. For any given data set, the sum of all the values must equal 100 %. When data sets are small, percentages can be misleading and may not be an indicator of risk. Review of numerator and denominator
e. Ratesi. Comparing apples to oranges – This phrase applies when comparing the number
of injury deaths in different communities without considering population size; or comparing the number of crashes on different roadways without considering traffic volume. To adjust for variations in exposure, such as population size or traffic volume, rates are calculated.
ii. An expression of the frequency with which an event occurs in a defined population over a specific period and converted to a whole number by multiplying by some power of 10 (usually 10,000 or 100,000).
iii. Components of a rate are 1. denominator (the number of events in a specific time period 2. denominator (generally the population exposed: sometimes related to
other expression of exposure, such as traffic volume)
29

Injury Surveillance Course -- Draft Outline Objective 5 – Define and develop an analysis plan for the surveillance data, develop a plan for disseminating analysis results
3. a power of teniv. Different types of rates
1. Incidence Rate – new cases in a defined period of time … most commonly used with injury
2. Prevalence – new and existing cases – not commonly used with injury3. Specific rates –
v. Calculation for determining rate
1.Number of casesPopulationat risk
(sameexposure period)
x10 ⁿ∨(K )
2. Possible sources for the denominator:a. Tribal enrollmentb. Censusc. Traffic volumed. User population
3. Sometimes denominators are not people. For example if you’re measuring crashes -- the denominator may be landings and takeoffs, for MVCs it may be number of vehicle miles traveled. It’s best to consult a statistician or local injury prevention specialist if you’re unsure about the appropriate denominator.
4. K is usually expressed as 10,000 or 100,000. Just as we multiply by 100 in determining percentages, we multiply by 10,000 or 100,000 in calculating rates.
5. Important to remember that when you are calculating the rate for multi-year period the population should be the combined period for each year. For example, the injury death rate for a community for a 3-year period 2008-2010 is calculated as the # of cases in 2008 + # of cases in 2009 + # cases in 2010 divided by the population in 2008 + the population in 2009 + the population in 2010 times K
6. Important to use common sense when selecting K – a small number of cases with small K may result in a fraction per K. The may not make sense to a lay person. Any number of cases per 100,000 population may not make sense to a person with a 150 population
vi. Selected types of Rates1. Crude rate:
a. based on the actual number of events in a total population over given period of time
b. First step because information about a population must be obtained and compared.
2. Specific rate: based on the actual number of events in a subgroup of a population over a given period of time. Sometimes the overall rate may not provide a clear picture of injury. For example, in the United States injury mortality rates are higher among men than women, greater among AI/AN population than among whites. If only overall rates are calculated, you will not discover the variations and the magnitude of the problem in subgroups. Awareness of such differences can guide the
30

Injury Surveillance Course -- Draft Outline Objective 5 – Define and develop an analysis plan for the surveillance data, develop a plan for disseminating analysis results
development of injury prevention programs among populations at the greatest risk.
Chart: Specific Rates of Suicide for AI/AN Population by Age Group 2010. Source: CDC WISQARS Fatal Injury Reports
Age Group Suicide Deaths Population Crude Rate0 to 4 0 393,726 05 to 9 0 377,904 010 to 14 14 372,896 3.7515 to 19 70 393,320 17.820 to 24 88 362,892 24.2525 to 29 51 340,576 14.9730 to 34 49 311,098 15.7535 to 39 37 292,412 12.6540 to 44 38 280,013 13.5745 to 49 45 283,889 15.8550 to 54 32 253,858 12.6155 to 59 20 197,306 10.1460 to 64 8 148,434 5.3965 to 69 6 97,909 6.1370 to 74 5 66,019 7.5775 to 79 2 43,090 4.6480 to 84 3 26,959 11.1385+ 1 21,237 4.71
All Ages 469 4,263,538 11
3. Adjusted Rate: rates are constructed to permit fair comparison between groups differing in some important characteristic. For example: adjusted rates for the miscoding of Indian race or adjusted rates to account for variation in age among different populations (the large number of retirees in Florida or the large number of youth in AI/AN population. Calculating an adjusted rate is complicated. If an adjusted rate is needed, seek the assistance of a statistician or an epidemiologist.
vii. Some general consideration for rates1. The numerator should be accurate2. The denominator is typically estimated3. The denominator isn’t always population based. It could be some other
indicator of exposure such as vehicle miles or work hours.4. Rates are primarily used to compare different groups (like communities)
or different subgroups (like age groups within a community)
31

Injury Surveillance Course -- Draft Outline Objective 5 – Define and develop an analysis plan for the surveillance data, develop a plan for disseminating analysis results
5. Rates indicate the probability or risk of an event, such as an injury, occurring
f. Years of Potential Life Lost – YPLLi. The burden of injury falls disproportionately on the young. It is important to
consider how the deaths of so many young people affect the future of a community. The effect of this premature mortality is reflected in the measurement of YPLL
ii. YPLL measures the potential life lost for people between the ages of 1 and 65 at the time of death.
iii. The calculation is simple: 65 - age at the time of death=YPLL. For example, for a person who dies in a car crash at age 25 the YPLL is 40. Use the life expectancy of your population. AI/AN populations have a shorter life expectancy than the general population. Note that if a person dies at an age greater than the life expectancy you’re using, you ignore it. WISQARS allows for YPLL calculations for AI/AN population.
iv. The chart below shows the YPLL in Indian Country for 2010 using age 65 as the base number. Note where injury ranks in comparison to other causes of death. In Indian Country, 66,612 years of potential life were lost because of unintentional and intentional injuries. More potential years of life were lost because of injury than all the other seven identified causes of death combined.
Years of Potential Life Lost Before Age 65American Indian/Alaska Native Population
2010 United States*
Cause of Death YPLL PercentAll Causes 167,928 100.0%Unintentional Injury 43,055 25.6%Suicide 14,730 8.8%Heart Disease 14,689 8.7%Malignant Neoplasms 14,524 8.6%Liver Disease 11,290 6.7%Homicide 8,827 5.3%Perinatal Period 7,604 4.5%Congenital Anomalies 7,209 4.3%Diabetes Mellitus 4,307 2.6%Influenza & Pneumonia 2,340 1.4%All Others 39,353 23.4%
*Source CDC WISQARS YPLL Reports
g. Describe the Geographic Analysis of Datai. Depicting data using maps is a valuable exercise that provides a clear and quick
method for grasping data, particularly with people who are familiar with the geographic area. There are software packages that can create maps and WISQARS allows for mapping as well. Even if you do not have the software or
32
Injury Surveillance Course -- Draft Outline Objective 5 – Define and develop an analysis plan for the surveillance data, develop a plan for disseminating analysis results
the necessary equipment to produce a digital map, you can create a spot map by placing a pin on a printed map where each injury occurred.
ii. The following are some common types of mapping1. Spot Map: produced by placing a dot or other symbol on the map where
an injury occurred. Different symbols can be used for multiple events at the same location. A spot map is useful for displaying the geographic distribution of an even, but it does not provide a measure of risk, since population size is not taken into account.
2. Area or Choropleth Map: On an area or choropleth map regions are shaded or marked proportionally to the data being depicted. For example, population density or per capita income. Area maps are useful for depicting rates of injury in specific areas. The map below is an example of an area or choropleth map generated using the CDC WISQARS map program.
3. Pin or Cluster Map: This is a way of indicating road traffic hazards or crash prone locations along roads. Identifying “black spots” help to pinpoint specific hazards that can often be corrected in a cost-effective manner.
33

Injury Surveillance Course -- Draft Outline Objective 5 – Define and develop an analysis plan for the surveillance data, develop a plan for disseminating analysis results
4. Plan to disseminate and communicate results. Surveillance can only achieve results if the information is communicated to the appropriate people or stakeholders. Effectively disseminated data can lead to support for continued data collection; prioritization of injury interventions; implementation of interventions; visibility for the problem of injury and your program. Below are some steps to take in developing a dissemination plan.
a. Check with each tribe within your surveillance system regarding the review and approval of your plans to publicize the information you’ve collected.
b. Develop the message. This is where the interpretation aspect of analysis is very important. You need to give context to the information, not just numbers. Be aware that low numbers can skew things up or down, even when you’re well within standard deviation.
c. Determining who will get the information will depend on your location. Depending on where you are it could be members of your coalition in addition to decision makers at the tribal, village government, state or national level. It’s also important to get information to the organizations or agencies that provide services so they can tailor their services to address the issues presented by the data.
d. Select the format for presenting the information. Different audiences may require different formats. Use an appealing format. Use language the public would understand. Keep it simple, provide only the most important facts.
i. Some format considerations1. Summary vs. detailed2. Narrative graphs3. How often the material will be produced and how it will distributed4. Electronic or paper5. Web based
e. Market the messagef. Evaluate the impactg. Surveillance system report. A means to convey the results of the surveillance system to
all the stakeholders. Consider the needs of the stake holders when making decisions about design and frequency.
i. The specifics may vary depending on your location, but here are some things to consider including in an injury surveillance system report
1. Introduction: Offer a brief description of the injury surveillance system, the purpose, related prevention activities and the objective of the report
2. Leading causes of death, frequency and proportion and rank of injuries among all causes.
3. Leading causes of injury mortality, frequency, proportions, and crude rates, emphasizing the highest indicators.
4. Leading causes of injury morbidity, if the information is available.5. YPLL6. Cost of injuries, comparing local data if available. 7. Priority injuries identified in the region, summarizing those with the
highest number, percentage, rates, costs and YPLL8. Recommendations for prevention strategies. This is the most important
step because it helps stakeholders decide what actions to take.ii. Recipients
34

Injury Surveillance Course -- Draft Outline Objective 5 – Define and develop an analysis plan for the surveillance data, develop a plan for disseminating analysis results
1. Stakeholders, decision makers, law enforcement, public health directors, school officials, etc.
2. Hospital, emergency departments, health clinics3. Health professionals in the scientific community4. Scientific/academic researchers5. Grassroots organizations.
iii. Delivery method:1. Health department newsletters2. PSAs3. Press releases4. Flyers5. Periodicals/annual reports6. Presentations7. Newspapers8. Websites
h. Exercise at the discretion of the instructor, if time permits discuss the following. 30 minutes
i. Which information is most important to present to stakeholdersii. Which indicators would best show the size of the problem
iii. Do you think cost data is important to stakeholdersiv. Should you include recommendations about prevention strategies in your
surveillance report.5. Summary Now that you’ve completed this section you should be able to
a. Calculate injury indicators such as frequency, percentages and crude, specific and adjusted rates
b. Calculate years of Potential Life Lostc. Describe the geographical analysis of the datad. Define a plan to disseminate and communicate the data
35

Injury Surveillance Course -- Draft Outline Objective 6 – Use surveillance data to inform injury prevention, tie surveillance to action and funding
Objective 6 – 5.5 hoursUse Surveillance Data to Inform Injury Prevention, Tie Surveillance to Action and Funding
Using surveillance data to identify injuries in your region Identify potential causal factors of injuries Tie Surveillance to Action and Funding
1. Introductiona. Surveillance is not done for surveillance sake. The data collected can be used to help
paint a picture of the injury problem in the population you are observing. Surveillance data can help you determine the magnitude and severity of injury events, the trend of injury events over time or place and the cost of injury, both financially and in terms of life lost.
b. Establishing injury priorities is a necessary and increasingly difficult task. To define injury priorities you need to keep in mind factors such as the magnitude of the problem. The disability, that it causes, the direct and indirect costs and the availability of resources for injury prevention (moved from below)
c. We look at the severity and magnitude of injuries because it’s important that prevention efforts focus on the most severe because there are limited resources. It’s impossible to address every injury. Prevention efforts should be focused on those injuries that are most costly to the tribe or community. and that reduce the quality of life for the victim or community.
d. Examples of why we look at the severity and the magnitude of injuries. For example: Headlines may tell one story that would lead you to believe a certain injury, such as shark bite is prevalent, but in reality, shark attacks only impact a small number of people each year. A wide scale effort to prevent injuries from shark attacks would be inappropriate.
e. Surveillance to document the existence and magnitude of a health condition and the extent to which its burden is increasing or decreasing
f. Once you have identified the injury priorities you should define some strategies to prevent them. In this session you will learn to identify injury priorities, identify the causal factors for these injury priorities and tie injury surveillance to action and funding.
2. Use of surveillance data a. Identify Priority Injury considering the followingb. Magnitude of the problemc. Severity of the problemd. Disability adjusted life yearse. Trend of the eventf. The possibility to control with existing resources
36

Injury Surveillance Course -- Draft Outline Objective 6 – Use surveillance data to inform injury prevention, tie surveillance to action and funding
g. Local interests and importanceh. Interests of national or local organizationsi. Costsj. Identify the causal factors of priority injuries for the tribe or the region
3. Identify and Select Potential Interventions to Prevent Priority Injuriesa. Priority Injuries – Injuries that require urgent attention as identified previously. To
define risk groups and characteristics, you will need the followingb. Homicide: crude and specific rates by age group and sex and mechanismc. Motor vehicle related deaths: crude and specific rates by age group, sex and road
user (pedestrian, vehicle occupant, motorcyclist or cyclist)d. Leading causes of injury morbidity: crude rates by age group, sex and nature of
injury, lethality rate, admission rate and disabilitye. Potential causal factor for those injuries using one of the models described below
and detailed in the Appendix. f. Recommendations about proven and promising injury prevention strategies detailed
in the appendix.i. Review effective injury prevention strategies
1. Review the strategies applied to prevent injuries in your community. 2. Review national and international strategies.3. Injury Prevention Strategy guide for unintentional and intentional injury.
A combination of two tables in the CDC manual: Guide to Community Preventive Services (The Community Guide) Table on Proven or Promising Strategies to Prevent Motor Vehicle Related Injuries – (mention, update and put chart in the appendix http://www.thecommunityguide.org/mvoi/index.html ) and Proven and Promising Violence Prevention programs.
4. Table: Strategies to prevent injury classified by sector. This table is based on Table 5 -- Strategies to Prevent Violence classified by Sector. This will be expanded to include other injuries common to Indian Country, such as falls, motor vehicle crashes, suicides, drowning. It will be in the Appendix
4. Models to Help Identify and Organize Potential Causal Factors and Intervention Strategies for Injuries
a. The Haddon Matrix: The Haddon Matrix is used both to conceptualize causal factors and to identify potential prevention strategies. The Haddon Matrix is built using columns and rows. In the columns, Haddon identifies – host, agent and environment (brief description of each). In the rows he identifies phases of the event – pre-event, event and post event. By filling in the cells of the matrix, one can identify a range of potential risk factors. You can then use the matrix to address the risk factors by filling in the cells with strategies or ideas for prevention that are directed at each of
37

Injury Surveillance Course -- Draft Outline Objective 6 – Use surveillance data to inform injury prevention, tie surveillance to action and funding
the factors (columns) and that have an influence on each of the phases (rows). An example of the matrix used in this way can be found in the Appendix.
b. The Ecological Model: Ecological Model to Identify and Organize potential causal factors for violence-related injury. Ecological model helps to identify and organize the multiple levels of influence that affect behavior. Violence is considered the product of the interaction between these multiple levels. The strength of the model is its ability to distinguish among the multitude of influences on violence while providing a framework for understanding the interaction. To use the Ecological Model to identify causal behavior and intervention strategies consider potential interventions aimed at each level: Individual, Relationship, Community, Society. Example in the appendix
i. Individual. The first level of the model focuses on the characteristics of the individual the increase the likelihood of being a perpetrator or victim.
ii. Relationship. The second level explores relationships, such as relationship with peers, intimate partner or family, can increase the risk of violence.
iii. Community. The third level of the model examines how community in which the relationships are embedded.
iv. Society. The final level examines the societal factors that influence behavior. c. Decision Matrix: The Intervention Decision Matrix is a tool designed to help people
Identify and choose among the interventions options. This tool is applied after the priority injury problem has been identified. There are five elements to consider: Effectiveness; Cost; Sustainability; Social and Political acceptability; Possible unintended consequences . Each element is given a score from 1 to 3 The sum of the score will help you rate your intervention options. See example in the appendix.
d. Multifaceted Injury Prevention Program attempts to regulate human behavior on various levels, including legal and cultural. Tie this back to San Carlos Apache Crash Prevention Strategy. Table: San Carlos Apache Multifaceted Motor Vehicle Crash prevention Strategy
5. Tie Surveillance to Action and Fundinga. No particular “recipe” to translate data to action.b. Discuss with class their experience where data has translated to action or funding.c. Some examples:
i. Improved data systemsii. Policy changes
iii. Funding through grantsiv. Interventions (e.g., highway safety improvements)
1. Documents and Web Sites that provide information on Injury prevention Update and provide Indian specific websites and documents
d. San Carlos Actions: i. Mass Media Campaign
38

Injury Surveillance Course -- Draft Outline Objective 6 – Use surveillance data to inform injury prevention, tie surveillance to action and funding
ii. Community eventsiii. DUI task forceiv. DUI checkpointsv. Data collection
vi. Seek funding from IHSvii. Tribe passed 0.08 BAC
viii. Tribe passed Primary Seat Belt Law6. Summary: Now you’ve reviewed and should
a. Understand the use of surveillance data to identify priority injuriesb. Identifying the most appropriate interventions for the injuries in for your tribe or
community.c. Understand models that help identify causal factors and intervention strategies for
priority injuries. d. Tie Surveillance to action and funding
39

Injury Surveillance Course -- Draft Outline Objective 7 – Define an evaluation plan for the surveillance system and monitor prevention activities.
Objective 7 – 1.5 hoursDefine an evaluation plan for the surveillance system and monitor prevention activities.
Know the steps to evaluating an injury surveillance system Review public health indicators proposed for monitoring injuries Use surveillance data to monitor prevention activities
1. Introductiona. Surveillance systems should meet their objectives as efficiently as possible. For this
reason it is necessary to obtain continuous feedback on the operation of the system. The CDC has published the Guidelines for Evaluating Surveillance Systems. These guidelines were updated in 2001 and published in the MMWR. In this objective we will discuss some of the steps outlined in those guidelines and offer some o.
2. Evaluation processa. Engage stakeholders in the Evaluation if practical
i. This is the ideal, but it may not always be practical. Coalition members, if you were able to establish one, and other stakeholder may be a source of feedback on the systems. Officials, public health workers and officers, media and others in the affected communities can provide input to ensure that the evaluation of the surveillance system addresses the appropriate questions and that the findings will be useful.
ii. Describe how this would work using an Indian Country example.b. Describe the Surveillance system to be evaluated.
i. In this step you describe the process. It’s not where you evaluate the data you’re getting from the system.
ii. An example of an Flow of Activity for a Surveillance System
40
Involve decision -makers in process
Train key persons in the
process
Collect Data obtained from your
sources
Review quality of the
information
Complete the data entry
Conduct the data analysis and disseminate the
findings

Injury Surveillance Course -- Draft Outline Objective 7 – Define an evaluation plan for the surveillance system and monitor prevention activities.
c. Determine a process for evaluationi. Circumstances and resources will determine how you want to proceed with the
evaluation of your system. You could do a process analysis of the system, looking at each step and evaluating its effectiveness. Or you could do quality assurance, looking at the data that’s been inputted into the system and determining the quality of it.
ii. As you’re evaluating the system, ask if the system is working the way you intended it to work and are you getting the information you need from it. If not, you might look into a preliminary evaluation based on the factors below. If you are a one or two-person operation, it is much better to devote your time to building operating the system than to evaluating it. If the system is not giving you the information you need or intended you should seek the assistance of the technical advisor or technical resource.
d. Factors to consider when evaluating your systemi. Simplicity. This refers to the structure of the system and the ease of operation.
Surveillance systems should be as simple as possible while still meeting the needs of their objectives.
ii. Flexibility. A flexible surveillance system can adapt to changing information needs and can accommodate changes in case definitions or technology and variations in funding or reporting sources.
iii. Data Quality. This reflects the completeness and validity of the data recorded in the public health system. Examining the percentage of “unknown” or blank responses to items is an easy measure of the data quality. Data of high quality will have a low percentage of blanks or unknowns.
iv. Acceptability. This is the measure of how willing other organizations are to participate in the system.
v. Timeliness. Measures the speed at which information travels through the system. It’s usually the amount of time between the onset of an event and the reporting of the event to the public health agency or group that is responsible for instituting control and prevention measures. The need for a rapid response in a surveillance systems depends on the event being measured and the objectives of the system. The use of electronic data collection from reporting sources via the Internet and the increased use of electronic data interchange by surveillance systems helps promote timeliness.
vi. Stability. This measures the ability to collect, manage and provide data properly on a regular basis without fail. Data needs to be collected over a long period of time in order to provide opportunity for analysis.
e. Very important to communicate your findings to appropriate people. Gather your thoughts about any problems you have discovered about the system and talk to the people involved about whether to fix problems.
41

Injury Surveillance Course -- Draft Outline Objective 7 – Define an evaluation plan for the surveillance system and monitor prevention activities.
i. It’s important to keep notes about any changes you make to the system and whether those changes may impact data and how. For example: When you have a new focus, such as suicide plus drugs, or you have new people or you switch from ICD 9 to ICD 10 that you note these things in a file you have earmarked just for documenting changes to the system. (Is there an example of this, such as a form or something that’s being used.)
3. Use Surveillance Data to Monitor Prevention Activitiesa. In this step you are tracking data, not trying to prove cause and effect. The bullet points
below are just an informal evaluation. But it’s important to be aware that other contributing factors may have influenced the outcome or if changes in system/investments is the reason for the difference.
i. Monitor the association of the implementation of the prevention strategies with changes in the number, rate, characteristics of injury which allows decision makers to decide whether or not to continue prevention activities.
ii. Monitor changes in the trend of an event before and after a strategy is applied.iii. Monitor the impact of strategies applied for purposes other than injury
prevention that could positively or negatively affect the events under surveillance.
iv. Possible over- or under-representation of certain groups in the population.v. Possible over- or under presence of some types of events in areas of the region
b. San Carlos Example – Continuous program evaluation 4. Summary Now you should
a. Know the steps to evaluating the system.b. Be able to use surveillance to monitor prevention activities (with guidance from
instructor on good ways data is used to track injuries, upward and downward trends.) What you’re seeing in data may or may not relate to prevention activities. Not a cause and effect. Need a study to show a causal relationship. Also may help you prioritize your efforts and know where you can make a difference.
42