Embed Size (px)
Citation preview

General Distribution OCDE/GD(97)27
ECONOMICS DEPARTMENTWORKING PAPERS
NO. 171
THE RELIABILITY OF QUARTERLY NATIONAL ACCOUNTSIN SEVEN MAJOR COUNTRIES : A USER'S PERSPECTIVE
byRobert York and Paul Atkinson
ORGANISATION FOR ECONOMIC CO-OPERATION AND DEVELOPMENT
Paris
48499
Document complet disponible sur OLIS dans son format d'origine
Complete document available on OLIS in its original format
2
The Reliability of Quarterly National Accounts in Seven Major Countries:A User's Perspective
National accounts data provide the most comprehensive overview available of developments in nationaleconomies. They are of great interest to a wide range of users of economic information. These users,which include governments formulating budgetary policies, central banks making monetary policydecisions, businesses considering investment decisions and financial institutions making judgementsconcerning portfolio allocation, have needs which may differ in various respects. However, since theirinterest generally stems from the likelihood that they will make better decisions if they are well informedabout economic developments, they all have a strong interest in the accuracy of national accountsstatistics. This paper examines the reliability of preliminary quarterly national accounts statistics. Inparticular, it considers the longer-term behaviour of the provisional estimates to GDP growth and its mainexpenditure components through an examination of the revisions to those estimates. It covers the sevenlargest OECD countries and, as such, updates and extends upon previous OECD analysis on the topic.Overall, the results are broadly similar to the earlier work; that preliminary estimates for output growthhave not been statistically biased, although the average size of revisions has been large but smaller thanthose exhibited by the demand components of GDP.
*****
Les données des comptes nationaux fournissent le résumé statistique disponible le plus complet sur lesévolutions des économies nationales. Elles sont d’un grand intérêt pour une large gamme d’utilisateursd’informations économiques. Ces utilisateurs, qu’ils soient des gouvernements formulant des politiquesbudgétaires, des banques centrales décidant des politiques monétaires, des entreprises étudiant les choixd’investissement ou des institutions financières prenant des décisions relatives à des choix de portefeuille,ont des besoins qui peuvent différer de diverses manières. Néanmoins, puisque leur intérêt provientgénéralement de la probabilité qu’ils pourront prendre de meilleures décisions s’ils sont bien informés ausujet des développements économiques, ils s’intéressent tous à l’exactitude des statistiques des comptesnationaux. Ce document examine la fiabilité des statistiques préliminaires des comptes nationauxtrimestriels. En particulier, il étudie le comportement à long terme des estimations provisoires de lacroissance du PIB et des principales composantes de la demande, en examinant les révisions opérées surces estimations. Il couvre les sept principaux pays de l’OCDE et ainsi, met à jour et prolonge lesprécédentes analyses de l’OCDE sur la question. Dans l’ensemble, les résultats sont d’une manièregénérale similaires aux précédents travaux, à savoir que les estimations préliminaires de la croissance de laproduction ne sont pas biaisées statistiquement, bien que l’ampleur moyenne des révisions soit importantemais plus petite que celles affectant les composantes de la demande du PIB.
Copyright OECD, 1997
Applications for permission to reproduce or translate all, or part of, this material should be madeto: Head of Publications Service, OECD, 2 rue André Pascal, 75775 Paris Cedex 16, France.

3
Table of Contents
Page
I. Introduction and main conclusions 5II. Methodology: judging accuracy of national accounts data 6III. Summary of the main results 7
1. Accuracy: summary statistics, bias and efficiency 72. The stable nature of revisions over time 93. The influence of the economic cycle 104. The influence of inflation 10
IV. Concluding remarks from a user’s perspective 11Notes 19References 22Notes to appendix tables 23
Tables
1. National statistical agencies: data coverage and release dates 142. Summary of revisions analysis for the major seven countries 153. Actual compared to adjusted revisions to real government
consumption 164. Summary statistics of revisions from the 1979 OECD study 175. The effect of the business cycle and inflation on revisions 18
Appendix Tables
1a. United States 241b. Statistical properties of revisions: United States 252a. Japan 262b. Statistical properties of revisions: Japan 273a. Western Germany 283b. Statistical properties of revisions: Western Germany 294a. France 304b. Statistical properties of revisions: France 315a. Italy 325b. Statistical properties of revisions: Italy 336a. United Kingdom 346b. Statistical properties of revisions: United Kingdom 357a. Canada 367b. Statistical properties of revisions: Canada 37

4

5
The Reliability of Quarterly National Accounts in Seven Major Countries:A User's Perspective*
I. Introduction and main conclusions
1. National accounts data provide the most comprehensive overview available ofdevelopments in national economies. They are of great interest to a wide range of users ofeconomic information. These users, which include governments formulating budgetary policies,central banks making monetary policy decisions, businesses considering investment decisions andfinancial institutions making judgements concerning portfolio allocation, have needs which maydiffer in various respects. However, since their interest generally stems from the likelihood thatthey will make better decisions if they are well informed about economic developments, they allhave a strong interest in the accuracy of national accounts statistics.
2. For many of these users of economic information, concerns about timeliness make thepreliminary national accounts data, which in most OECD countries become available on aquarterly basis, of particular interest. Indeed, it is not unusual for these data to have an immediateimpact on financial markets and to influence macroeconomic policy debate.1 The focus of thispaper, therefore, is on the accuracy of preliminary quarterly national accounts statistics. Inparticular, it considers the longer-term behaviour of the provisional estimates to GDP growth andits main expenditure components through an examination of the revisions to those estimates. Itcovers the seven largest OECD countries and, as such, updates and extends the analysis conductedin previous OECD work on the topic.2
3. Overall, the results are broadly similar to the findings of previous OECD work:
− Preliminary estimates for output growth have not been statistically biased, but theaverage size of revisions has been large, in some cases exceeding the average growthrate.
− The picture for revisions to preliminary inflation estimates is broadly similar.
− Revisions to the demand components similarly imply no statistical bias to preliminaryestimates, but they are generally larger than those for total GDP growth - especiallyfor exports and imports of goods and services.
− The behaviour of revisions does not suggest that preliminary estimates are gettingbetter or worse over time.
4. The remainder of this paper proceeds as follows. The next section sets out the approachtaken in this paper and the criteria for judging the quality of the quarterly national accounts, andthe following section summarises the results of the assessment. The final section makes someconcluding observations from a user's perspective on the issue of timeliness and accuracy ofnational accounts data and the prospects for improving the quality of this data.
6
II. Methodology: judging accuracy of national accounts data
5. This study follows the methodology used by many statistical agencies to assess thequality of national accounts data. It focuses on revisions to the "preliminary" (or the firstpublished) estimates of the quarter-on-quarter growth of real GDP, its main components (privateand government consumption, investment, and exports and imports) and their associated pricedeflators.3 Growth rates, rather than variable levels are examined in order to minimise the impacton the results of conceptual changes in the data and changes in base years used to construct theconstant price estimates; and because growth rates are of more direct interest to the main usergroups of the statistics. Revisions are defined as the difference between the preliminary estimates(P) of each variable and the "final" estimates (F). Historical data for the preliminary estimatescome from the OECD’s Quarterly National Accounts publication, beginning with issue Number4, 1979. Historical data for the final estimates are based on those statistics published by theOECD in Quarterly National Accounts, Number 2, 1994. National statistical sources and theperiods covered by the study are listed in Table 1.4
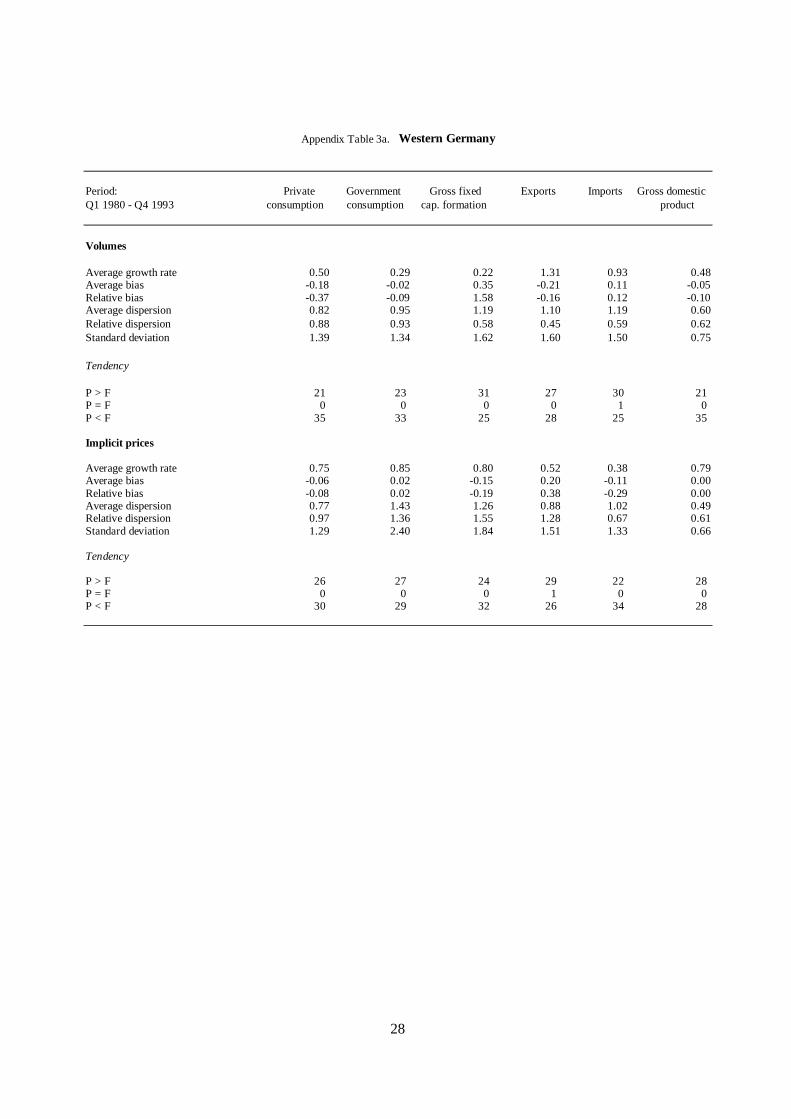
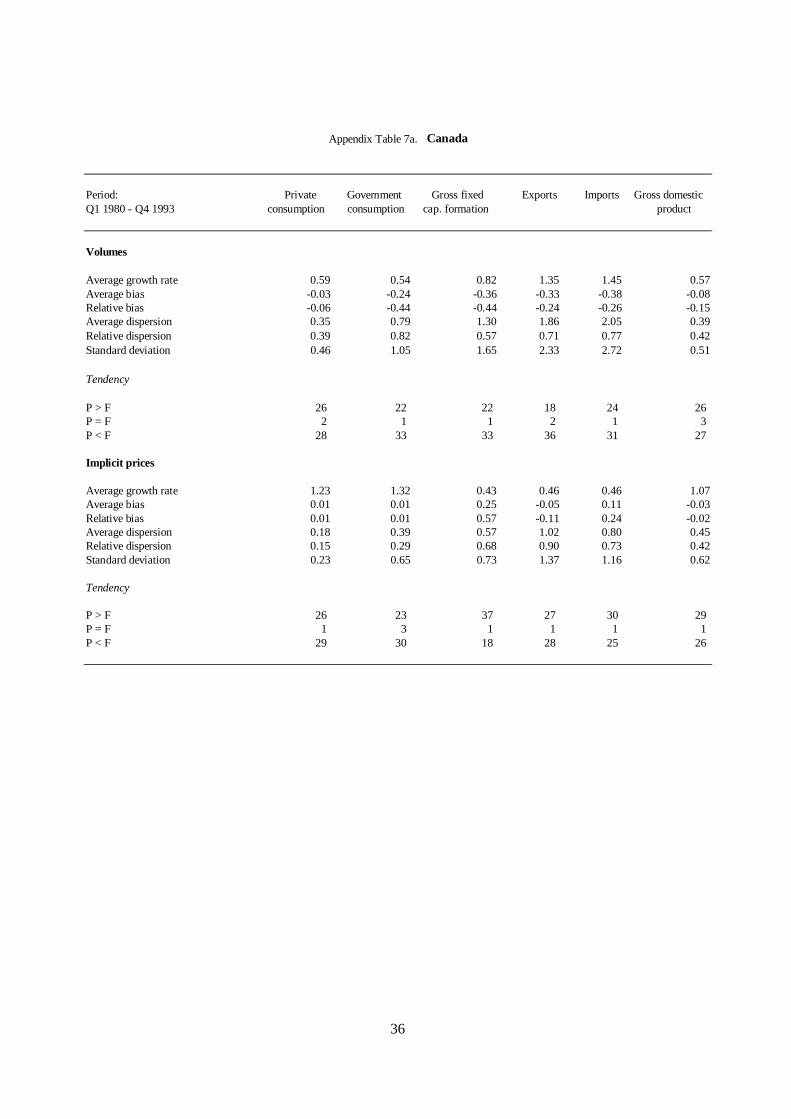
6. The analysis consists of three parts. The first involves the calculation of severalsummary measures of the size and distribution of revisions and replicates the analysis conductedin previous OECD studies on the topic. The summary measures include: average and relativebias; average and relative dispersion; the standard deviation; and the frequency of positive andnegative errors.5 These summary measures are reported in detail for GDP and the components ofdemand in Tables 1a-7a in the Appendix.
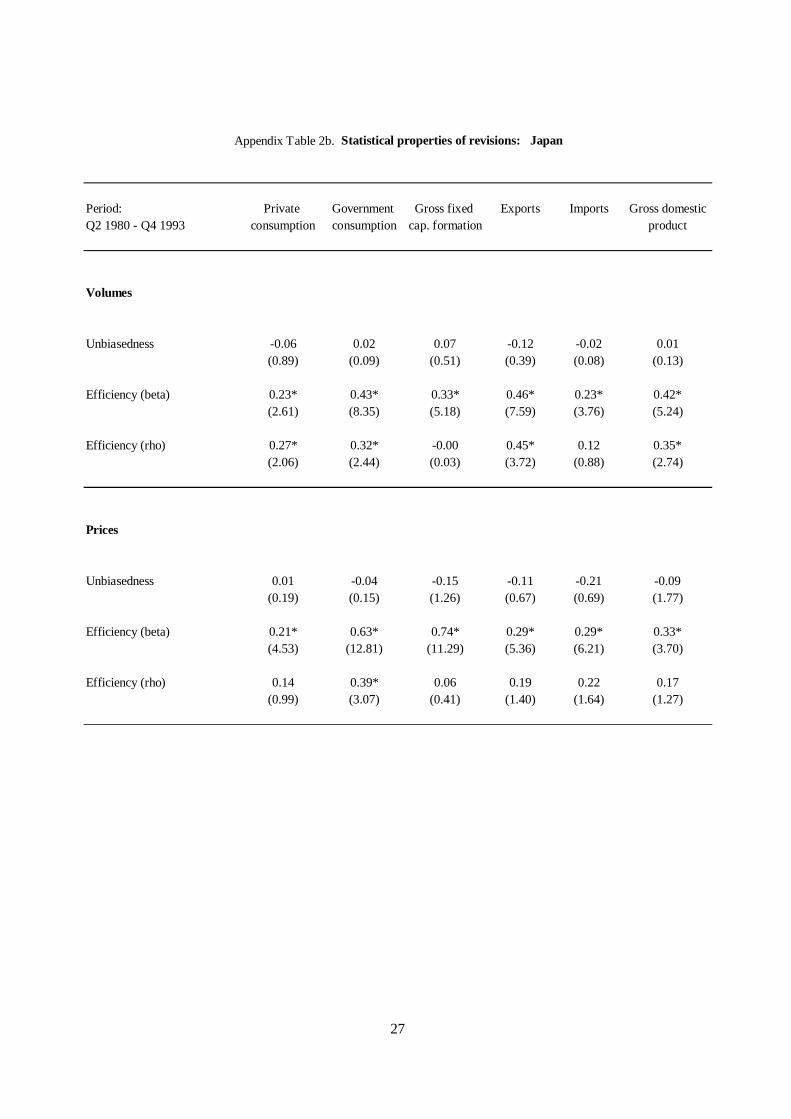
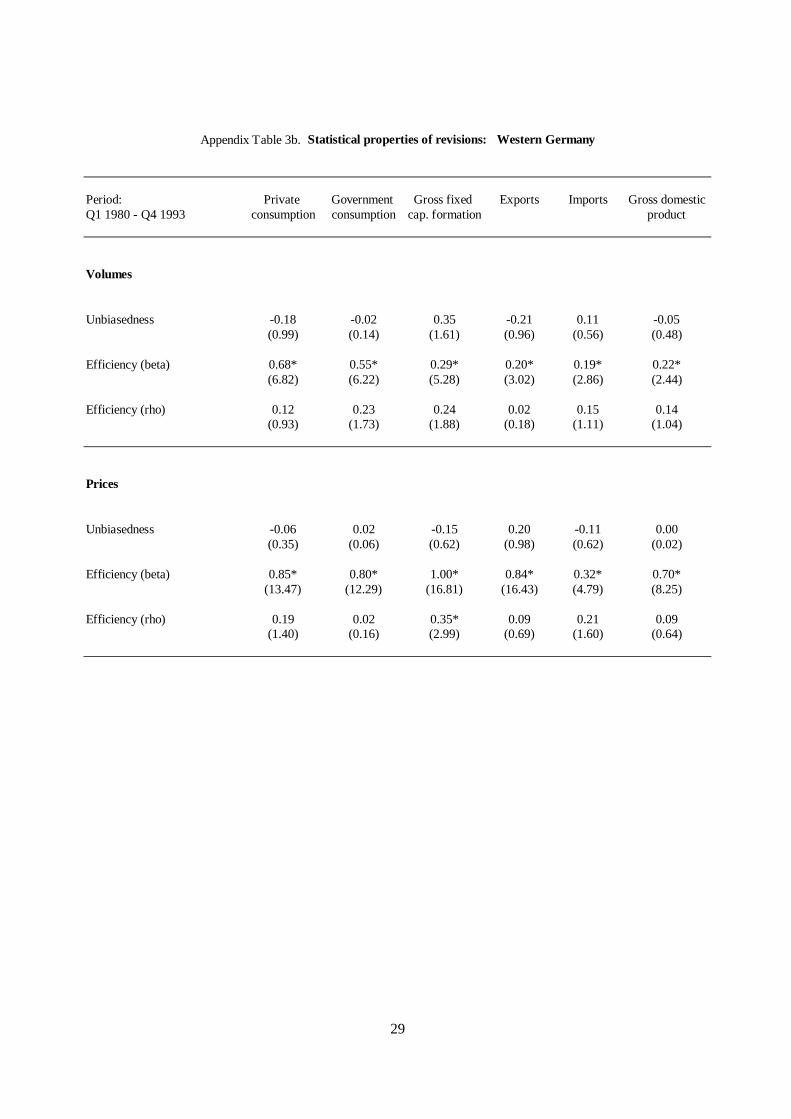
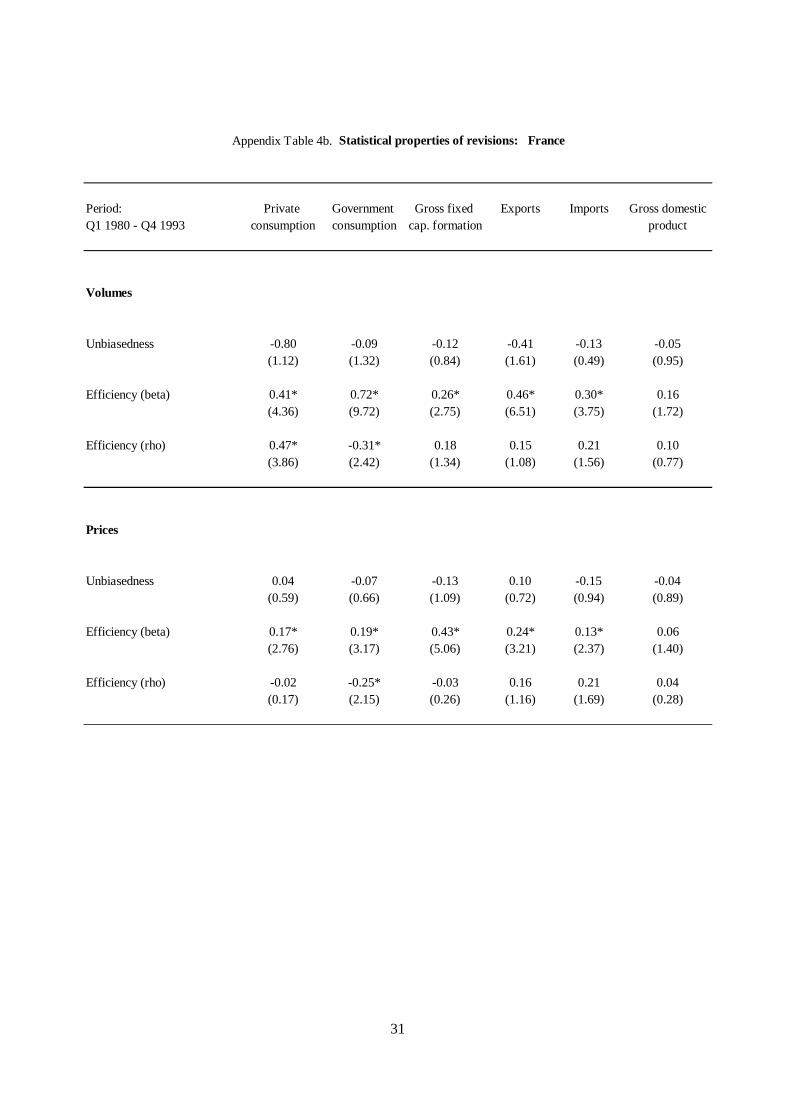
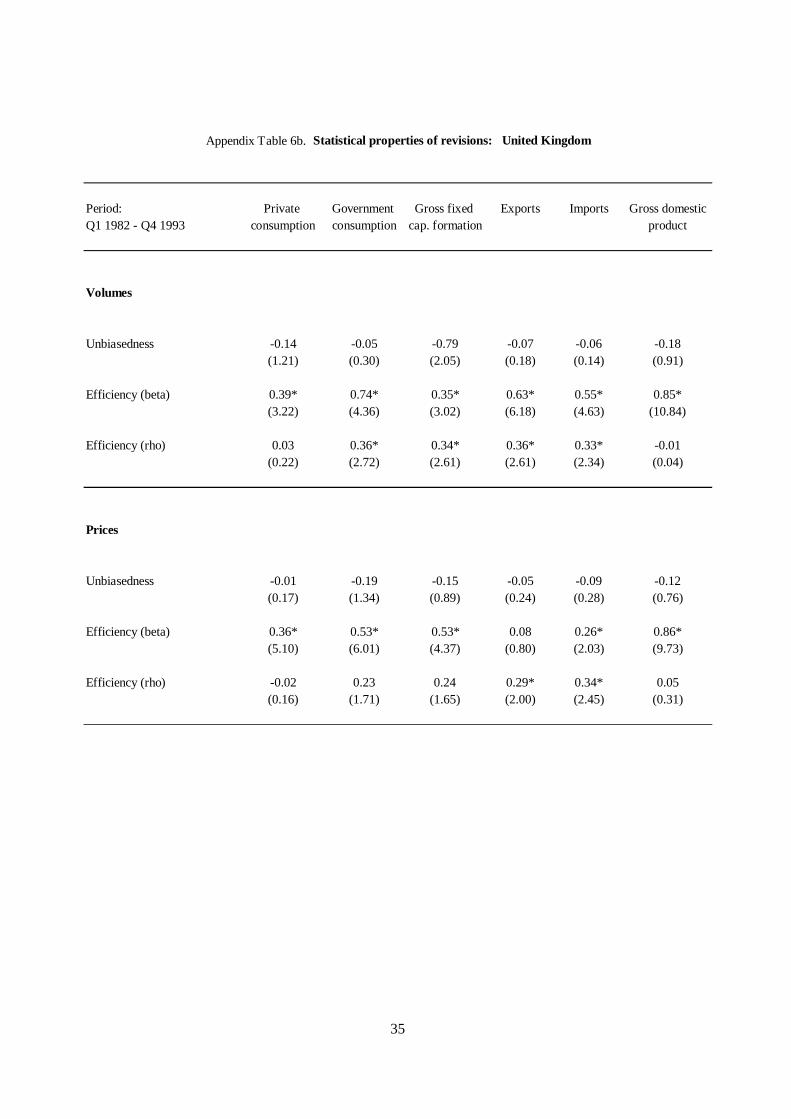
7. The second part expands on previous OECD work by evaluating the statistical propertiesof provisional estimates and revisions in terms of unbiasedness and efficiency. A provisionalestimate is considered to be accurate if it is statistically unbiased and efficient in the sense ofMuth's (1961) rational expectations framework. Random adjustments to the initial growth ratesof GDP and its components can and are expected to occur for any given quarter and as aconsequence the revision over any given period may be non-zero. However, abstracting fromthese random elements, the notion of unbiasedness requires that the expected average revision bezero -- so that on balance, initial projections are equivalent to outturns. (In technical terms, themean revision should not be significantly different from zero.) The notion of forecast efficiencyassumes that statistical agencies use all of the information that is available to them whenconstructing the initial estimates. Thus in order for revisions to embody forecast efficiency itfollows that they must be unrelated to information available at the time the preliminary estimate ismade.
8. The test for both unbiasedness and efficiency used in this analysis is based on the workof Holden and Peel (1990) and elaborated upon by Barrionuevo (1993). An ordinary leastsquares (OLS) regression of the revision on a constant allows a simple but sufficient test ofunbiasedness. The null hypothesis is that the estimated coefficient from such a regression is notsignificantly different from zero. If it is not, the size of revisions could be systematically reducedby adjusting the preliminary estimates by the constant coefficient. The check of efficiencyinvolves testing the statistical significance of the coefficients from an OLS regression of therevision on the preliminary estimate (the so-called beta test) and from a regression of the currentperiod's revision on the previous period's revision (the so-called rho test).6 If the beta and rhotests are jointly passed (i.e. if neither beta nor rho is statistically different than zero), the advance
7
estimates are presumed to be efficient. A failure of either or both tests implies inefficiency andthat the variance of revisions could be improved upon. The regression results which these testsinvolved are reported in Tables 1b-7b in the Appendix.
9. Beta and rho can provide some indication of the nature of the inefficiency of apreliminary indicator and a potential means of adjustment to improve them. Barrionuevo (1993)notes that if beta is zero but rho is not, the variance of revisions could be reduced by adjusting theestimate by rho, since in this case, past errors are being repeated in the present. (In other words,if a projection is widely off the mark, a non-zero rho suggests that some of that error should bebrought forward into next period's projection, in the same way an error-correction model accountsfor past mistakes.) If on the other hand, beta is different from zero but rho is not, the variance ofrevisions could be improved upon by adjusting the estimates by beta, since in this case, therevisions contain information that is not being incorporated in the preliminary estimate.
10. The third part of the analysis explores the possibility that the economic cycle andinflation may each have a separate and systematic influence on the behaviour of initial indicatorsand their subsequent revisions. This is motivated by observations in some countries, that whenthe initial estimate of growth is high (low), more often than not, subsequent changes are in thedownward (upward) direction.7 Research carried out by the Central Statistical Office (CSO) inthe United Kingdom has similarly uncovered a bias in the preliminary indicators linked tochanges in the United Kingdom's rate of inflation (CSO 1985). The experience in theUnited Kingdom is such that when the rate of inflation is rising quickly, the CSO frequentlyoverstates the initial GDP figures and revises downward its future estimates.
11. The explanatory power of the output gap and/or the rate of inflation (GDP deflator) indetermining the size and direction of updates to GDP growth is examined by estimatingregression equations. The output gap -- defined here as the difference between the preliminaryestimate of quarterly GDP and the trend level, where the trend is based on the final GDP series 8
-- is used here to define the business cycle, because it explicitly distinguishes between quarters ofabove- and below-, as well as average- growth. It is also useful as a test of the null hypothesissince at any point in time, policymakers and economic forecasters often have a fairly clear notionof where an economy is operating relative to its trend or potential output. In the event, a tendencyfor provisional estimates of output to be over-estimated (under-estimated) when the economy isoperating above (below) its trend level, should be identified by a negative (positive) correlationbetween the output-gap variable and revisions.
III. Summary of the main results
1. Accuracy: summary statistics, bias and efficiency
12. Overall, the results obtained in the present analysis, which are summarised in Table 2 forreal GDP and its implicit deflator, are in accordance with the findings of previous OECD studiesaddressing the nature and scope of revisions to the quarterly national accounts of the seven majorOECD countries. The preliminary estimates of GDP growth for six of the seven major countrieshave, on average, understated the final growth figures over the period 1980-94. In the case ofJapan, they have been very slightly overstated. These average errors (i.e., the average biases) are
8
generally small and the preliminary estimates are statistically unbiased (i.e., not statisticallydifferent from zero at the 95 per cent level of significance).
13. When judged against the measure of average dispersion (that is, in terms of absoluterevisions) the size of the ex post adjustments rises appreciably, from a low of 0.29 percentagepoints (1.2 per cent at an annual rate) for France to a high of 0.80 percentage points (3.2 per centat an annual rate) for the United Kingdom. These figures are quite substantial in comparison toaverage growth rates and, in the case of Germany and the United Kingdom, exceed them.Standard deviations, which provide an alternative indication of the size of absolute revisions, aretypically larger, ranging from a low of 0.37 per cent for France (1.4 per cent at an annual rate) toas high as 1.36 per cent for the United Kingdom (5.4 per cent at an annual rate).
14. With regard to the components of GDP (see Appendix Tables) average biases are oftennegative, but they are not statistically significant for any component for any country. However,the preliminary estimates contain wide measurement errors, as reflected in large averagedispersions and standard deviations, especially with respect to exports and imports of goods andservices. Across the seven countries, the average dispersion for both these components is around1.6 per cent (or 6.6 per cent at an annual rate) with standard deviations of around 2 per cent (morethan 8 per cent at an annual rate), which is 2-3 times larger than those for GDP. If the magnitudeof adjustments are compared against final outcomes, i.e. in terms of relative dispersion, the largestchanges occur to government consumption for six of the seven countries (France being theexception). The measure of relative dispersion for government consumption -- which indicatesthe size of the revision as a proportion of the final figure -- is typically around unity. Thisimplies that provisional quarterly estimates of the growth of government consumption are, onaverage, 100 per cent higher or lower than the final figures.
15. For the GDP-based measure of inflation, six out of the seven countries on average, alsorequire upward revisions to the initial quarterly estimates (the exception is Germany, where theaverage bias is zero), but only for Italy is this bias statistically significant or does it amount tomore than 0.12 per cent (around 0.5 per cent at an annual rate). Indicators of the absolute size ofrevisions, i.e. the absolute dispersion and the standard deviation, are similar to those for volumes.For the other price deflators, no general pattern emerges across the group of countries, althoughimplicit prices for exports and imports tend to need the widest margin of adjustment. Except forItaly's government consumption and Canada's investment deflators, preliminary estimates of thecomponent-price deflators are statistically unbiased.
16. Overall, there appears to be little advantage to be gained by making a priori judgementsconcerning the direction of future revisions to the advanced estimates of output growth and itsmain components. With very few exceptions, revisions to the initial estimates are statisticallyunbiased and future adjustments are largely random, so making such judgements could lead tounnecessary errors in assessment with no net benefits. However, since the absolute size of therevisions that can reasonably be expected is fairly large, the range of uncertainty that surroundsthe early national accounts data is significant and they must always be interpreted cautiously.
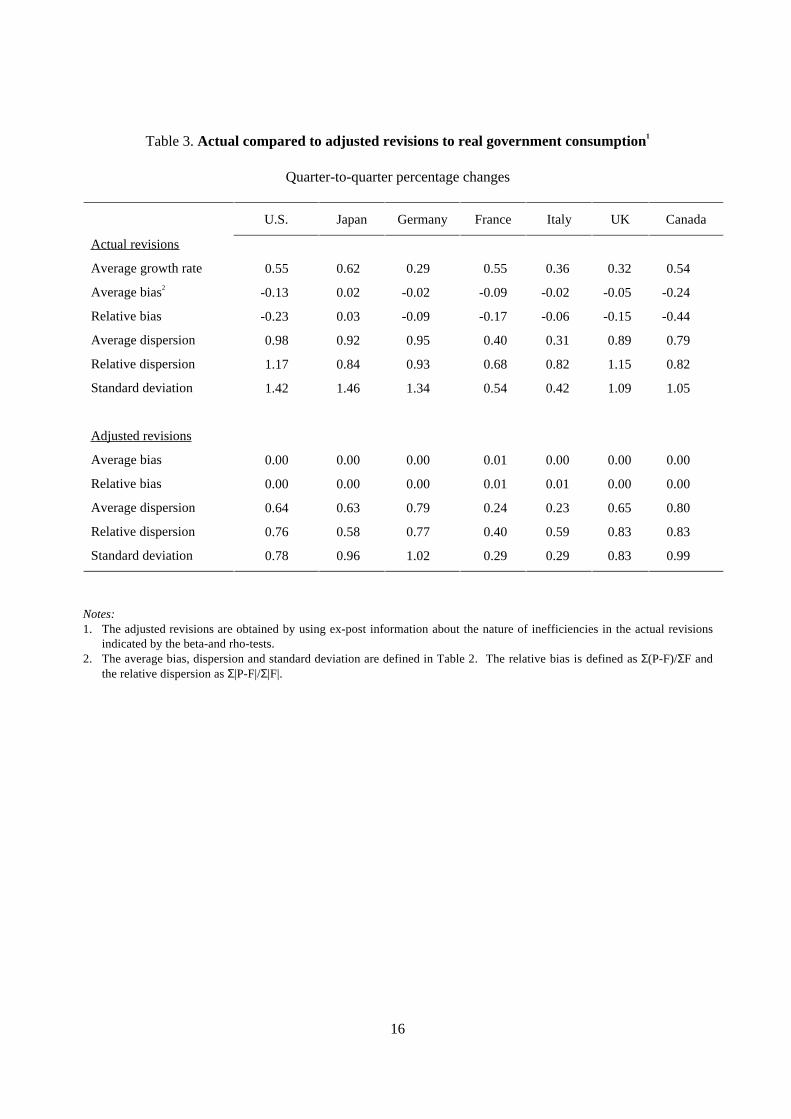
17. In most cases, preliminary national accounts estimates are not efficient. This implies thatthe variance of revisions is larger than it needs to be and that it might be reduced, perhaps throughbetter interpretation and more effective use of the available information set. The frequency with
9
which estimates of beta and rho are statistically different from zero suggests that there isunexploited information contained in the data which could be used to smooth the variability of thepreliminary figures. Such information -- obtained from estimated equations from the beta- andrho- tests of efficiency -- is used to demonstrate these potential improvements in the case ofgovernment consumption. As shown in Table 3, the standard deviation of an adjusted series canbe as much as 50 per cent lower than the actual (unadjusted) series.9
2. The stable behaviour of revisions over time
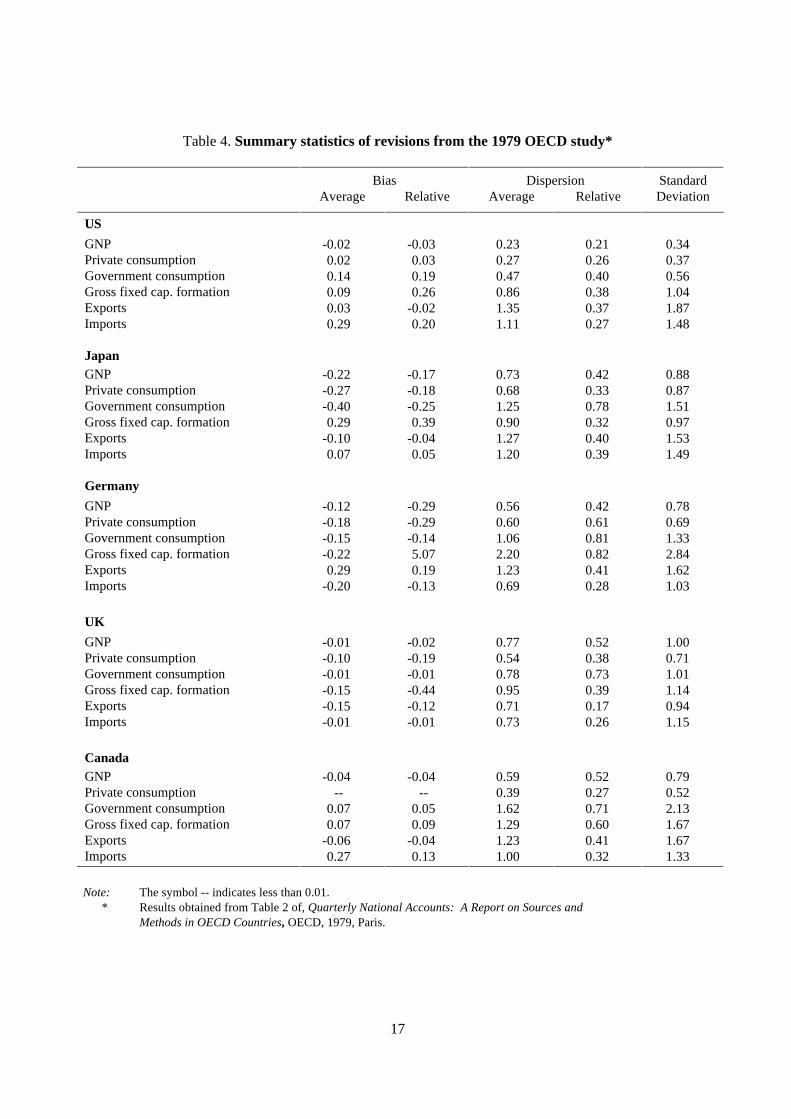
18. Since the methodology used in this study closely follows that used in previous OECDwork (OECD 1979), it allows for some general comparisons to be drawn with the earlier work.However, the findings should not be directly compared, given differences in the way revisions arespecifically defined. In the 1979 OECD study, for example, revisions are based on the differencebetween the initial estimate of the variable in question with the "final" figure obtained one-yearlater. Here, on the other hand, "final" outturns are derived from the historical series published inthe 2nd quarter of 1994. As a consequence, the present study may explore revisions of greatermagnitude and variance. It should be noted, however, that to the extent that this is the case thelarger revisions are presumably better measures of the accuracy of the preliminary estimates.
19. In comparing the findings of the 1979 study (Table 4) with those reported here, severalobservations can be made which point to the consistent quality of the quarterly national accountsover a long period of time. First, output growth in the major countries covered in both studies is,on average, slightly under-estimated in most cases, with the size and distribution of revisionsfalling within a similar order of magnitude in both studies. Second, the largest revisions (andwidest variance) continue to occur in the trade statistics. Like the present study, the earlieranalysis reported average dispersions to revisions for both exports and imports which are2-3 times larger than those made to preliminary projections of national income growth. Third,this enquiry has confirmed one of the findings of earlier work, namely that relative to finaloutturns, revisions to government consumption tend to be the largest of the national expenditurecomponents. This would appear to suggest that wide margins of uncertainty about the waygovernments carry out their own expenditure plans persist.
20. Finally, the sample used in the present study was split into two periods (roughly 1980-86and 1987-93) and summary statistics compared. (The sample split reflects the simplisticassumption that changes in quality might be visible as statistical methodologies, techniques andinformation sets improve over time). Across the group of countries and between periods, theperformance of preliminary indicators of GDP growth, its components and their associated pricedeflators was mixed: some remained larger in the later period and while others were reduced. Itcould not, therefore, be concluded one way or the other by this inquiry if the quality of thequarterly national accounts statistics either improved, deteriorated, or remained the same over theperiod. A similar conclusion was reached in the two earlier studies.
10
3. The influence of the economic cycle
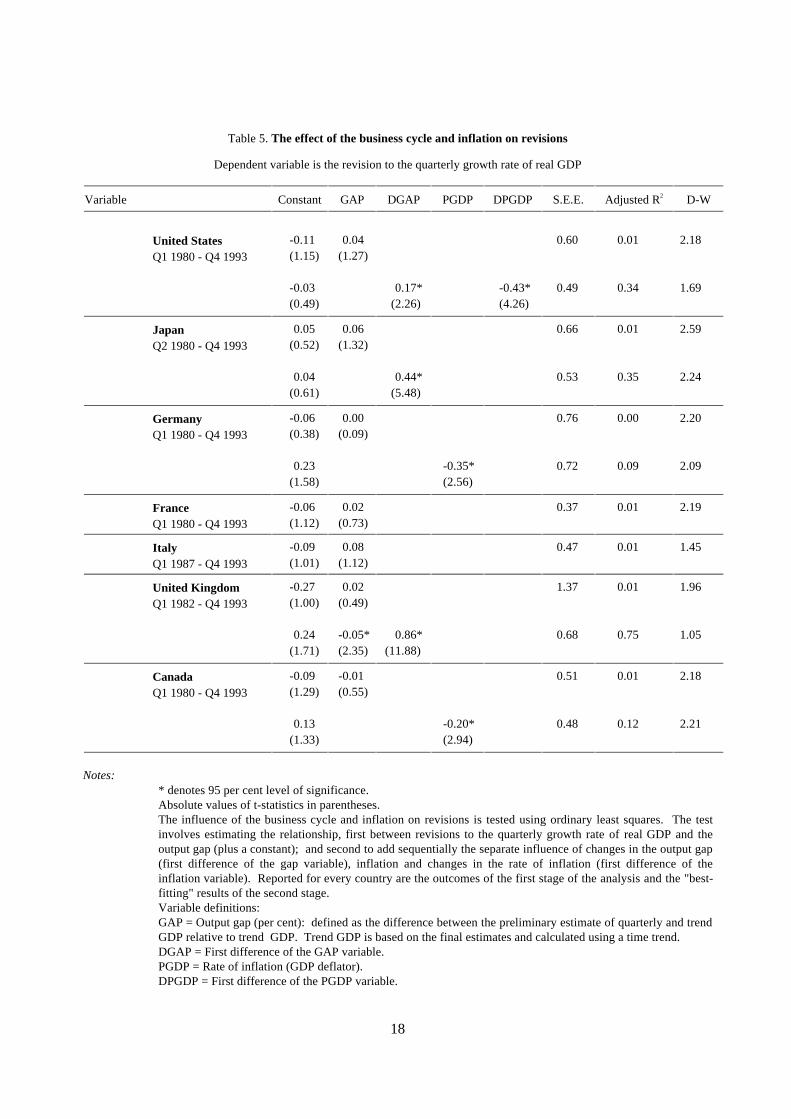
21. Regression results using revisions to the quarterly growth rate of GDP as the dependentvariable and the output gap as the explanatory variable yield no significant relationships for sixout of the seven countries under study (Table 5). There appears to be no systematic relationshipbetween the magnitude and direction of revisions and the path of the economy as it moves aboveor below the trend-determined level of output.
22. Some experimentation with a variation of this relationship, however, does reveal apositive but statistically weak influence (adjusted R2 of 35 per cent) between revisions andchanges in the output gap measure10 for the United States, Japan and the United Kingdom.11 Inthe United Kingdom, where the statistical relationship is the strongest and explains 75 per cent ofthe historical revisions, a small negative relationship with the level of output relative to trend alsoemerges. In these three countries, increases in the rate of economic growth away from trendresult in some tendency for preliminary estimates of quarter-on-quarter GDP growth to beunder-estimated, by around 0.2, an 0.4 and 0.9 percentage points, respectively. In other words,when their economies are expanding (or contracting) quickly, the regression results suggest thatupdates to advanced indicators are more likely to be in the upward (downward) direction.
4. The influence of inflation
23. Since many of the historical downward revisions to real output growth have occurred inyears in which inflation was high and rising -- for example, in the years after the first oil priceshock -- it has been suggested that these movements may be influenced by changes in prices. Arelationship of this nature has been identified in previous empirical work undertaken by theCentral Statistical Office (CSO) in the United Kingdom, which uncovered a likelihood thatadvance estimates of growth are overestimated when inflation is high and rising and that they areunder-reported when inflation is decelerating (CSO, 1985).
24. Regressions of revisions to quarterly real GDP growth on the rate of inflation (GDPdeflator) and on changes in the rate of inflation12 in the present analysis confirm a statisticallysignificant, but weak relationship in the data for the United States, Germany and Canada. (In thecase of both Germany and Canada, the influence of inflation only explains about 10 per cent ofthe overall revisions.) For the German and Canadian data, increases in the price level appear tobe associated with an upward bias in the advanced estimates of output growth, by around 0.4 and0. 2 percentage points respectively. In contrast, for the United States, downward adjustments toprovisional figures, of the order of 0.4 percentage points, seem necessary whenever the rate ofinflation is accelerating. In the case of the United Kingdom, previous results on the effects ofinflation were not corroborated here. This apparent inconsistency may be explained by thedifferent sample periods used -- the CSO's data was drawn from the high-inflation years of the1970s while the present investigation draws from the comparatively low-inflation years of the1980 -- and possibly by the changing influence of oil in the UK economy.

11
IV. Concluding remarks from a user's perspective
25. From the perspective of users whose concerns are largely about economic policy, theforegoing results are disappointing. The analysis of current economic developments andprospects is essential for macroeconomic policy analysis and formulation and also provides animportant element of the overall context in which structural policies must be analysed andformulated. Indeed, there are at least two areas in which it is crucial to policymakers ineconomics and finance ministries and central banks.
i. Monetary policy decisions must be based on perceptions of how the economy isevolving, what forces are operating on it, and how it will evolve on the basis ofalternative monetary policy decisions;
ii. Large parts of government spending and revenues are tied to the evolution of importantmacroeconomic variables. It is difficult to see, for example, how a modern budget couldsensibly be produced in isolation from a well-defined view of how the economy isevolving and, indeed, a formal set of macroeconomic projections is almost a necessity.
More generally, the analysis of current economic developments and prospects provides a premisefor much of the "story telling" which governments must do as they continuously communicate,explain, defend and sell their policies - both macroeconomic and structural - to the general public.
26. The comprehensiveness of national accounts data, which makes them not mere indicatorsbut virtually the definitive statement of how the economic situation has evolved, is almost uniqueamong the various sources of economic information. Where they become available sufficientlyearly to be of current, rather than historical, interest they provide new information about theeconomic situation which contributes directly to policy formulation. Where forecasts arerequired, the latest national accounts data almost invariably serve as the starting point and, indeed,the accuracy of forecasts is highly dependent on their accuracy.13 Furthermore they influencebusiness and, especially, financial market behaviour and, more generally, public perceptionsabout the economy, which in turn affect public debate. They therefore can affect the futurecourse of a wide range of policies. Consequently, timely and accurate national accounts datawould be highly desirable.
27. The contribution that accurate national accounts data can make to an understanding ofthe economic situation goes beyond the information contained in the total GDP figures. Inparticular, the expenditure based accounting framework which provides a decomposition of GDPinto the main demand components lends itself well to examining developments in different partsof the economy (i.e., households, business, government, the foreign sector) and to analysing theforces operating on the economy. Good data on demand components from expenditure basednational accounts estimates are therefore very helpful both for policy formulation and forcommunicating public policy decisions While the income and, to a lesser extent, productionbased approaches to measuring GDP also produce useful decompositions, for many users theseare of more limited value than the main demand components which emerge from the expenditureapproach.
12
28. Unfortunately, while the lack of bias in preliminary estimates is reassuring, the largeaverage dispersions and standard deviations of the revisions imply that the signal-to-noise ratio inthese data is lower than desirable. The poor quality of the demand component estimates is aserious defect. In addition, there are some grounds for believing that the signal-to-noise ratio inthe preliminary data in a number of countries is possibly even lower than the results reportedabove would suggest. The comparatively large size of revisions which typically occur to nationalaccounts data in the United Kingdom is somewhat surprising in view of the comparative highregard with which most users regard British statistics. One possible explanation for this is that theCSO is doing something seriously wrong and that it has much to learn from other statisticalagencies. An alternative explanation, to which considerable weight must be attached, is that byinvesting more time and effort into revising the accounts the CSO eventually, albeit over a periodof several years, provides “more accurate” statistics than other statistical agencies. To the extentthat this is the case, the apparently greater accuracy of provisional data elsewhere is a miragewhich just reflects less accurate final data - indeed, revisions could be reduced to zero by thesimple device of never going beyond the preliminary estimates.
29. An important feature affecting the usefulness of national accounts data to economicpolicy makers and forecasters is its timeliness. The release dates for the quarterly nationalaccounts are given in Table 1. The United States' statistical agency is the quickest in publishingprovisional figures just four weeks after quarter's-end, while Italian statisticians require fourteen.Agencies in the other five countries take on average, 8-10 weeks to release initial estimates. Themost notable difference among countries with regards to timeliness is the time taken by France,Italy and the United Kingdom in publishing the "final" quarterly estimates for a given year. Forexample, for 1993, France and the United Kingdom publish "final" estimates in 1995, while inItaly, they do not appear until 1996. Meanwhile, the other four major countries succeed in"finalising" the quarterly figures in only 6-9 months. These "final" revisions are then, of course,often revised sporadically in later years as further new information becomes available.
30. For the purposes of contributing to the understanding of the current economic situationand prospects, most of these provisional release dates are near the outer limit of what is useful,particularly in the Italian case. Since the national accounts variables of interest are flows, thegrowth rate for any particular quarter roughly measures the middle of the quarter in comparisonwith the middle of the previous quarter. Thus, a second quarter growth rate roughly compares theposition of the economy in mid-May with its position in mid-February, a period whose middlewas the end of March. If the initial estimate becomes available in September, i.e., 9-10 weeksafter the end of the second quarter, it is already rather dated. For many purposes, notablymonetary policy decision making, it would have to be discounted in favour of more recentinformation, however sketchy, even if its accuracy were completely reliable. Thus while holdingoff on releasing data until a later stage in the information collection process could reduce or eveneliminate the need for future revisions, and would have the benefit of reducing the extent to whichmisleading information is sometimes placed in the public domain, the deterioration in timelinesscould negate their usefulness in terms of providing information about the current economicsituation altogether.
31. Clearly, good national accounts data - especially where they are expenditure based - arehighly desirable, and improvements would be welcome. However, they are always supplementedby other sources of information - financial market developments, less comprehensive data
13
covering areas such as unemployment and trade, survey data, anecdotal information, etc. -- andusers of any type of data must always be aware of their limitations and discount themaccordingly. Furthermore, if national accounts data did not exist central banks would stillconduct monetary policy, finance ministries would still prepare budgets and governments wouldstill have to tell a story about the economic situation and defend their policies against thebackground of current economic developments and prospects. The fact they are costly to producemeans that improving their quality will involve trade-offs, and these trade-offs must beconsidered carefully.
32. The above considerations suggest that posing the question of trade-offs simply in termsof timeliness versus accuracy is not helpful. The value of more timely national accounts data willbe limited if they are at the expense of accuracy, while users already have the alternative ofwaiting for improved data to become available if timeliness is not a major concern. The practicalissues are whether there is scope for improvements in either timeliness or accuracy withoutsacrificing the other, or in both at the same time, and whether the extent of such improvementswould justify the costs. In the current budgetary climate few resource increases are likely to beforthcoming for the purpose of improving data collection. If more resources are to be devoted toimproving national accounts data, they will largely have to be drawn from the production of othertypes of statistics. The key trade-offs, therefore, involve the improvements that couldalternatively be made to other types of statistics or the saving which could be made by droppingstatistics that are currently produced but whose usefulness is marginal. This in turn points to theneed to evaluate the scope for improving the quality of national accounts data in the context of abroader prioritisation and cost evaluation of all statistical production activities.

14
Table 1. National statistical agencies: data coverage and release dates (a)
Country Period(number of
observations)
Source Approximatenumber of
weeks from endof quarter to
publication ofpreliminaryestimates
Usual date ofpublication offinal quarterlyestimates for
year n
United States 80.1 to 93.4(56)
Survey of Current Business,US Department ofCommerce, Washington
4 July, n+1
Japan 80.2 to 93.4(55)
Economic Planning Agency,data published in EconomicStatistics Monthly, StatisticsDepartment of The Bank ofJapan, Tokyo
10 December, n(b)
Germany (Western) 80.1 to 93.4(56)
VolkswirtschaftlicheGesamtrechungen,Statistiches Bundesamt,Wiesbaden
9 September, n+1
France 80.1 to 93.4(56)
Data provided directly bythe Institut National de laStatistique et des ÉtudesÉconomiques (INSEE),Paris (d)
10(c) April, n+2
Italy 87.1 to 93.4(28)
Bolletino Mensile diStatistica and Notizario,Istituto Centrale di Statistica(ISTAT), Rome
14 July, n+3
United Kingdom 82.1 to 93.4(48)
Economic Trends, CentralStatistical Office, London
8(c) September, n+2
Canada 80.1 to 93.4(56)
National Income andExpenditure Accounts,Statistics Canada, Ottawa
9 June, n+1
a) The data are expenditure-based national accounts which are taken from OECD’s publication, Quarterly National Accounts beginning withvolume Number 4, 1979 and ending with volume Number 2, 1994. The data published by the OECD come directly from the correspondingquarter of the national sources listed in the table and have not been transformed or adjusted in any way by the OECD.
b) For the four quarters ending in March of year n.c) France and the United Kingdom report partial sets of estimates before they release the fuller sets of estimates consisting of expenditure based
accounts in volume and in current price terms which are the subject of this study. In France, estimates of the main demand components arereported around seven weeks after the end of the quarter in volume terms only. In the United Kingdom an estimate of the output basedmeasure of GDP and some sectoral production estimates are released around four weeks after the end of the quarter, but these do not contain abreak-down from the expenditure side or price estimates.
d) The data are published by INSEE in Informations Rapides.

15
Table 2. Summary of revisions analysis for the major seven countries1
Quarter-to-quarter percentage changes
U.S. Japan Germany France Italy UK Canada
Real GDP
Average growth rate 0.55 0.85 0.48 0.45 0.45 0.58 0.57
Average bias2 -0.04 0.01 -0.05 -0.05 -0.10 -0.18 -0.08
Average dispersion3 0.42 0.50 0.60 0.29 0.38 0.80 0.39
Standard deviation4 0.60 0.67 0.75 0.37 0.48 1.36 0.51
Unbiasedness5
Efficiency (beta)6 * * * * *
Efficiency (rho)7 *
GDP deflator
Average growth rate 1.10 0.45 0.79 1.36 1.47 1.29 1.07
Average bias -0.03 -0.09 0.00 -0.04 -0.31 -0.12 -0.03
Average dispersion 0.29 0.31 0.49 0.27 0.47 0.74 0.45
Standard deviation 0.47 0.39 0.66 0.34 0.51 1.11 0.62
Unbiasedness *
Efficiency (beta) * * * * * *
Efficiency (rho)
Notes:1. Detailed summary statistics for each country and for each of the major components of GDP are presented in the Appendix
tables. Data for the United States, Germany (Western), France and Canada run from Q1/1980 to Q4/1993; from Q2/1980 toQ4/1993 for Japan; from Q1/1982 to Q4/1993 for the UK; and from Q1/1987 to Q4/1993 for Italy.
2. The average bias is defined as 1/nΣ(P-F); where P is the preliminary and F the final estimate.3. The average dispersion is defined as 1/nΣ |P-F|.4. The standard deviation is defined as the square root of 1/nΣ(d-d*)2 where d=P-F and d* is the sample mean.5. The property of unbiasedness is checked for by an OLS regression of the revision on a constant. A * indicates that the
estimated coefficient is statistically different from zero at the 95 per cent level of significant.6. The beta-test for the property of efficiency involves an OLS regression of the revision on the preliminary estimate.7. The rho-test for the property of the efficiency involves an OLS regression of the current periods revision on the previous
periods revision.
16
Table 3. Actual compared to adjusted revisions to real government consumption1
Quarter-to-quarter percentage changes
U.S. Japan Germany France Italy UK Canada
Actual revisions
Average growth rate 0.55 0.62 0.29 0.55 0.36 0.32 0.54
Average bias2 -0.13 0.02 -0.02 -0.09 -0.02 -0.05 -0.24
Relative bias -0.23 0.03 -0.09 -0.17 -0.06 -0.15 -0.44
Average dispersion 0.98 0.92 0.95 0.40 0.31 0.89 0.79
Relative dispersion 1.17 0.84 0.93 0.68 0.82 1.15 0.82
Standard deviation 1.42 1.46 1.34 0.54 0.42 1.09 1.05
Adjusted revisions
Average bias 0.00 0.00 0.00 0.01 0.00 0.00 0.00
Relative bias 0.00 0.00 0.00 0.01 0.01 0.00 0.00
Average dispersion 0.64 0.63 0.79 0.24 0.23 0.65 0.80
Relative dispersion 0.76 0.58 0.77 0.40 0.59 0.83 0.83
Standard deviation 0.78 0.96 1.02 0.29 0.29 0.83 0.99
Notes:1. The adjusted revisions are obtained by using ex-post information about the nature of inefficiencies in the actual revisions
indicated by the beta-and rho-tests.2. The average bias, dispersion and standard deviation are defined in Table 2. The relative bias is defined as Σ(P-F)/ΣF and
the relative dispersion as Σ|P-F|/Σ|F|.
17
Table 4. Summary statistics of revisions from the 1979 OECD study*
Bias Dispersion StandardAverage Relative Average Relative Deviation
US
GNP -0.02 -0.03 0.23 0.21 0.34Private consumption 0.02 0.03 0.27 0.26 0.37Government consumption 0.14 0.19 0.47 0.40 0.56Gross fixed cap. formation 0.09 0.26 0.86 0.38 1.04Exports 0.03 -0.02 1.35 0.37 1.87Imports 0.29 0.20 1.11 0.27 1.48
JapanGNP -0.22 -0.17 0.73 0.42 0.88Private consumption -0.27 -0.18 0.68 0.33 0.87Government consumption -0.40 -0.25 1.25 0.78 1.51Gross fixed cap. formation 0.29 0.39 0.90 0.32 0.97Exports -0.10 -0.04 1.27 0.40 1.53Imports 0.07 0.05 1.20 0.39 1.49
Germany
GNP -0.12 -0.29 0.56 0.42 0.78Private consumption -0.18 -0.29 0.60 0.61 0.69Government consumption -0.15 -0.14 1.06 0.81 1.33Gross fixed cap. formation -0.22 5.07 2.20 0.82 2.84Exports 0.29 0.19 1.23 0.41 1.62Imports -0.20 -0.13 0.69 0.28 1.03
UK
GNP -0.01 -0.02 0.77 0.52 1.00Private consumption -0.10 -0.19 0.54 0.38 0.71Government consumption -0.01 -0.01 0.78 0.73 1.01Gross fixed cap. formation -0.15 -0.44 0.95 0.39 1.14Exports -0.15 -0.12 0.71 0.17 0.94Imports -0.01 -0.01 0.73 0.26 1.15
CanadaGNP -0.04 -0.04 0.59 0.52 0.79Private consumption -- -- 0.39 0.27 0.52Government consumption 0.07 0.05 1.62 0.71 2.13Gross fixed cap. formation 0.07 0.09 1.29 0.60 1.67Exports -0.06 -0.04 1.23 0.41 1.67Imports 0.27 0.13 1.00 0.32 1.33
Note: The symbol -- indicates less than 0.01.* Results obtained from Table 2 of, Quarterly National Accounts: A Report on Sources and
Methods in OECD Countries, OECD, 1979, Paris.
18
Table 5. The effect of the business cycle and inflation on revisions
Dependent variable is the revision to the quarterly growth rate of real GDP
Variable Constant GAP DGAP PGDP DPGDP S.E.E. Adjusted R2 D-W
United States -0.11 0.04 0.60 0.01 2.18
Q1 1980 - Q4 1993 (1.15) (1.27)
-0.03 0.17* -0.43* 0.49 0.34 1.69(0.49) (2.26) (4.26)
Japan 0.05 0.06 0.66 0.01 2.59
Q2 1980 - Q4 1993 (0.52) (1.32)
0.04 0.44* 0.53 0.35 2.24(0.61) (5.48)
Germany -0.06 0.00 0.76 0.00 2.20
Q1 1980 - Q4 1993 (0.38) (0.09)
0.23 -0.35* 0.72 0.09 2.09(1.58) (2.56)
France -0.06 0.02 0.37 0.01 2.19
Q1 1980 - Q4 1993 (1.12) (0.73)
Italy -0.09 0.08 0.47 0.01 1.45
Q1 1987 - Q4 1993 (1.01) (1.12)
United Kingdom -0.27 0.02 1.37 0.01 1.96
Q1 1982 - Q4 1993 (1.00) (0.49)
0.24 -0.05* 0.86* 0.68 0.75 1.05(1.71) (2.35) (11.88)
Canada -0.09 -0.01 0.51 0.01 2.18
Q1 1980 - Q4 1993 (1.29) (0.55)
0.13 -0.20* 0.48 0.12 2.21(1.33) (2.94)
Notes:* denotes 95 per cent level of significance.Absolute values of t-statistics in parentheses.The influence of the business cycle and inflation on revisions is tested using ordinary least squares. The testinvolves estimating the relationship, first between revisions to the quarterly growth rate of real GDP and theoutput gap (plus a constant); and second to add sequentially the separate influence of changes in the output gap(first difference of the gap variable), inflation and changes in the rate of inflation (first difference of theinflation variable). Reported for every country are the outcomes of the first stage of the analysis and the "best-fitting" results of the second stage.Variable definitions:GAP = Output gap (per cent): defined as the difference between the preliminary estimate of quarterly and trendGDP relative to trend GDP. Trend GDP is based on the final estimates and calculated using a time trend.DGAP = First difference of the GAP variable.PGDP = Rate of inflation (GDP deflator).DPGDP = First difference of the PGDP variable.

19
NOTES
* This paper was prepared for the “Main Economic Indicators 30th Anniversary Meeting”, Châteaude la Muette, Paris, 16-17 October 1995. The authors would like to acknowledge numerouscomments and suggestions on earlier drafts of this paper from members of the EconomicsDepartment and Statistics Directorate, and the valuable technical assistance provided by IsabelleDuong.
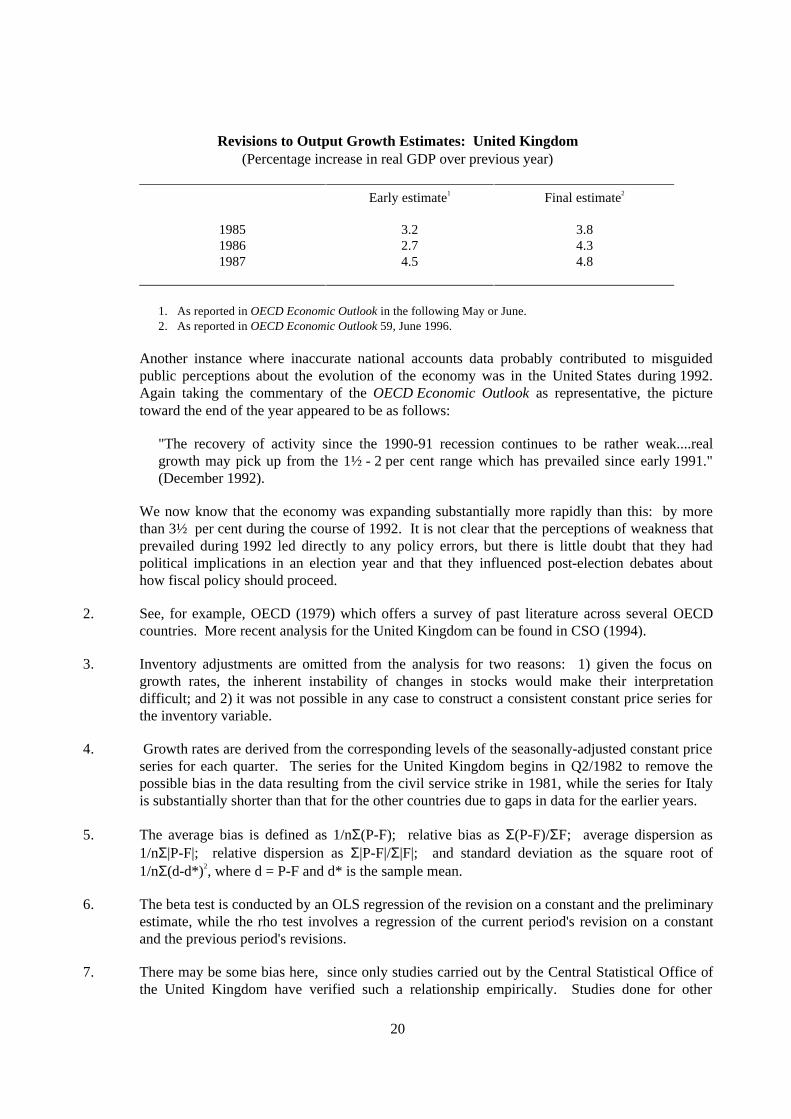
1. The availability of other sources of information about economic developments providesconsiderable protection from misleading information when national accounts are inaccurate, butthere have on occasion been instances when better data would have contributed to a far betterappreciation by policy makers and the general public of what was happening in the economy.One notable case in point was the United Kingdom in the mid-1980's, when the nationalaccounts frequently suggested more moderate expansion than was actually taking place. TheOECD Economic Outlook, which was probably representative of commentary on the economicsituation, noted at the time:
"The recovery has now lasted five years and looks set to continue...even though the pace ofrecovery seems to have slowed " (May 1986).
"The slowdown in growth since mid-1985 has lasted longer than expected. Over the past yearor so the economy has been expanding at only two-thirds of the rate achieved on average inthe first four years of the recovery" (December 1986).
"The United Kingdom is enjoying continued expansion....The growth of activity is projectedto decelerate in the period ahead. In 1987, however, real GDP should exceed 3 per cent"(June 1987).
On the basis of the information available at the time these were plausible assessments, but wenow know that growth during this period was far stronger than it appeared to be at the time (seeTable below) and that the economy was on its way to becoming seriously overheated. Therewere many influences on the evolution of macroeconomic policy during this period and the yearsthat followed and mistakes that were made cannot simply be attributed to data problems. But abetter understanding of how the economy was evolving would have provided a better basis fordecision-making and more accurate national accounts would have contributed significantly inthis regard.
20
Revisions to Output Growth Estimates: United Kingdom(Percentage increase in real GDP over previous year)
Early estimate1 Final estimate2
1985 3.2 3.81986 2.7 4.31987 4.5 4.8
1. As reported in OECD Economic Outlook in the following May or June.2. As reported in OECD Economic Outlook 59, June 1996.
Another instance where inaccurate national accounts data probably contributed to misguidedpublic perceptions about the evolution of the economy was in the United States during 1992.Again taking the commentary of the OECD Economic Outlook as representative, the picturetoward the end of the year appeared to be as follows:
"The recovery of activity since the 1990-91 recession continues to be rather weak....realgrowth may pick up from the 1½ - 2 per cent range which has prevailed since early 1991."(December 1992).
We now know that the economy was expanding substantially more rapidly than this: by morethan 3½ per cent during the course of 1992. It is not clear that the perceptions of weakness thatprevailed during 1992 led directly to any policy errors, but there is little doubt that they hadpolitical implications in an election year and that they influenced post-election debates abouthow fiscal policy should proceed.
2. See, for example, OECD (1979) which offers a survey of past literature across several OECDcountries. More recent analysis for the United Kingdom can be found in CSO (1994).
3. Inventory adjustments are omitted from the analysis for two reasons: 1) given the focus ongrowth rates, the inherent instability of changes in stocks would make their interpretationdifficult; and 2) it was not possible in any case to construct a consistent constant price series forthe inventory variable.
4. Growth rates are derived from the corresponding levels of the seasonally-adjusted constant priceseries for each quarter. The series for the United Kingdom begins in Q2/1982 to remove thepossible bias in the data resulting from the civil service strike in 1981, while the series for Italyis substantially shorter than that for the other countries due to gaps in data for the earlier years.
5. The average bias is defined as 1/nΣ(P-F); relative bias as Σ(P-F)/ΣF; average dispersion as1/nΣ|P-F|; relative dispersion as Σ|P-F|/Σ|F|; and standard deviation as the square root of1/nΣ(d-d*)2, where d = P-F and d* is the sample mean.
6. The beta test is conducted by an OLS regression of the revision on a constant and the preliminaryestimate, while the rho test involves a regression of the current period's revision on a constantand the previous period's revisions.
7. There may be some bias here, since only studies carried out by the Central Statistical Office ofthe United Kingdom have verified such a relationship empirically. Studies done for other

21
countries have based these types of conclusions on casual observations of particular quarterswith high (or low) growth.
8. The output gap is expressed as a percentage of trend GDP, where trend GDP is estimated from atime trend through the final series of the GDP figures for each of the seven countries.
9. The nature of the adjustment is to use the ex post information provided by the beta and rho-tests.The government consumption variable is transformed by adjusting the original series by theestimated coefficients from the OLS regression equations explained in footnote 6 above.
10. Changes in the output gap refer specifically to the first difference of the output-gap variable.
11. The bias uncovered as a result of the phase of the cycle for the United Kingdom data isconsistent with previous work carried out by the United Kingdom, Central Statistical Office(CSO, 1985). In this work, however, the CSO did not examine the relationship betweenrevisions and the rate of change of quarterly growth.
12. The first difference of the inflation rate.
13. A meeting among business and trade union experts on "Improvement of Economic Forecasts"concluded that data inaccuracies were a significant cause of forecasting problems. Therapporteur noted: "It was felt that an accurate up-to-date picture of what was happening in theeconomy would have helped substantially in making forecasts in a number of countries."(Mansley, 1995). While a recent analysis by the OECD Secretariat on forecasting accuracyemployed a slightly different methodology and covered a different period than does the Mansleystudy, its results would suggest that forecasting accuracy compares reasonably well with that ofthe natonal accounts data that provide the starting point for these forecasts. See OECD (1993),especially, the summary statistics reported in Tables 16-19.

22
REFERENCES
Barrionuevo, Jose M. (1993), "How Accurate are World Economic Outlook Projections", Staff Studies forthe World Economic Outlook, Washington.
Central Statistical Office (1985), "Revisions to Quarterly Estimates of Gross Domestic Product",Economic Trends, No. 381, London.
Central Statistical Office (1994), "Testing for Bias in Initial Estimates of the Components of GDP",Economic Trends, No. 489, London.
Holden, K. and D.A. Peel (1990), "On Testing for Unbiasedness and Efficiency of Forecasts", ManchesterSchool of Economic and Social Studies, Vol.58.
Mansley, N. (1995), "Improvement of Economic Forecasts, Report on a Joint Meeting of Management andTrade Union Experts held under the OECD Labour Management Programme", [OECD/GD(95)39],Paris.
Muth, J.F. (1961), "Rational Expectations and the Theory of Price Movements", Econometrica, Vol. 29,pp. 315-35.
OECD (1979), Quarterly National Accounts: A Report on Sources and Methods in OECD Countries,Paris.
OECD (1993) "How Accurate are Economic Outlook Projections", pp. 49-54, in OECDEconomic Outlook 53, June.
23
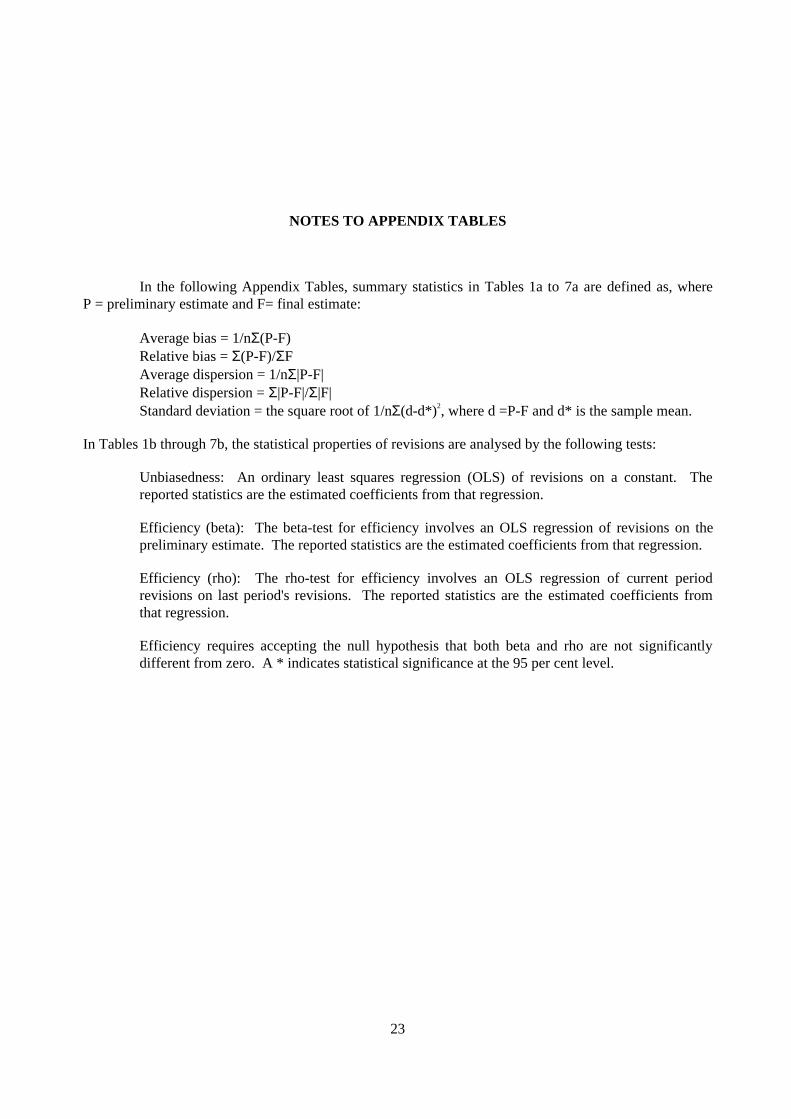
NOTES TO APPENDIX TABLES
In the following Appendix Tables, summary statistics in Tables 1a to 7a are defined as, whereP = preliminary estimate and F= final estimate:
Average bias = 1/nΣ(P-F)Relative bias = Σ(P-F)/ΣFAverage dispersion = 1/nΣ|P-F|Relative dispersion = Σ|P-F|/Σ|F|Standard deviation = the square root of 1/nΣ(d-d*)2, where d =P-F and d* is the sample mean.
In Tables 1b through 7b, the statistical properties of revisions are analysed by the following tests:
Unbiasedness: An ordinary least squares regression (OLS) of revisions on a constant. Thereported statistics are the estimated coefficients from that regression.
Efficiency (beta): The beta-test for efficiency involves an OLS regression of revisions on thepreliminary estimate. The reported statistics are the estimated coefficients from that regression.
Efficiency (rho): The rho-test for efficiency involves an OLS regression of current periodrevisions on last period's revisions. The reported statistics are the estimated coefficients fromthat regression.
Efficiency requires accepting the null hypothesis that both beta and rho are not significantlydifferent from zero. A * indicates statistical significance at the 95 per cent level.
24
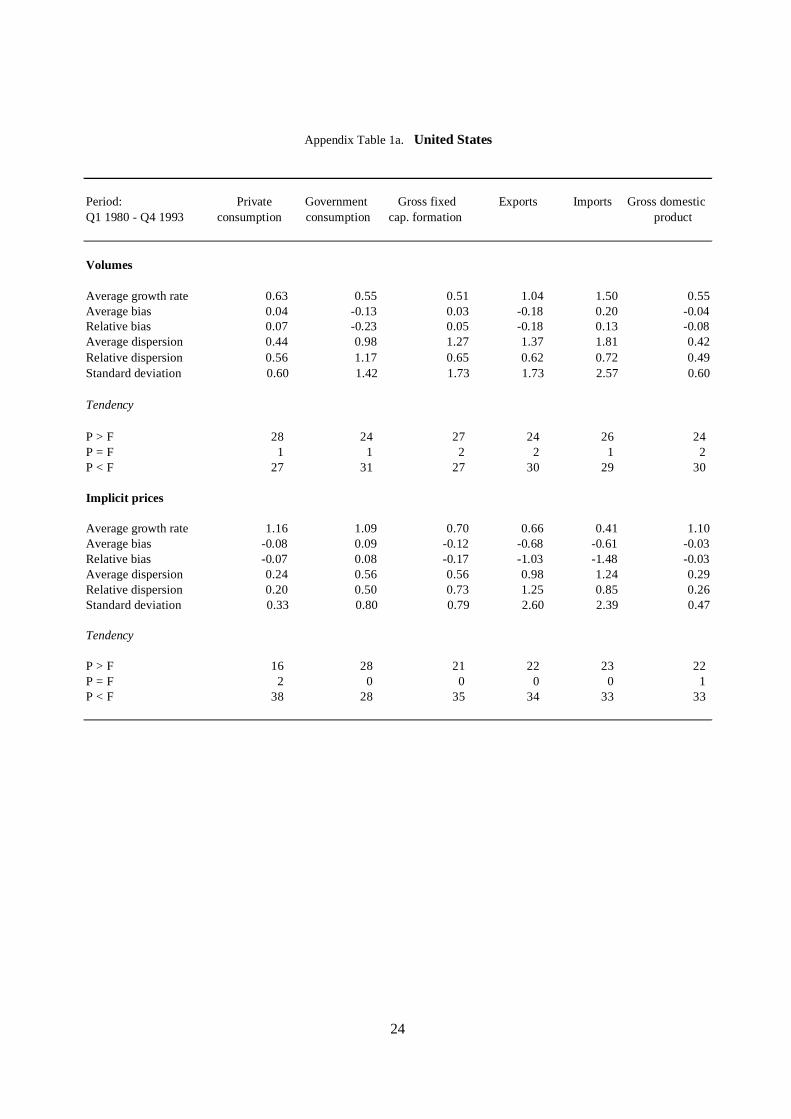
Appendix Table 1a. United States
Period: Private Government Gross fixed Exports Imports Gross domesticQ1 1980 - Q4 1993 consumption consumption cap. formation product
Volumes
Average growth rate 0.63 0.55 0.51 1.04 1.50 0.55Average bias 0.04 -0.13 0.03 -0.18 0.20 -0.04Relative bias 0.07 -0.23 0.05 -0.18 0.13 -0.08Average dispersion 0.44 0.98 1.27 1.37 1.81 0.42Relative dispersion 0.56 1.17 0.65 0.62 0.72 0.49Standard deviation 0.60 1.42 1.73 1.73 2.57 0.60
Tendency
P > F 28 24 27 24 26 24P = F 1 1 2 2 1 2P < F 27 31 27 30 29 30
Implicit prices
Average growth rate 1.16 1.09 0.70 0.66 0.41 1.10Average bias -0.08 0.09 -0.12 -0.68 -0.61 -0.03Relative bias -0.07 0.08 -0.17 -1.03 -1.48 -0.03Average dispersion 0.24 0.56 0.56 0.98 1.24 0.29Relative dispersion 0.20 0.50 0.73 1.25 0.85 0.26Standard deviation 0.33 0.80 0.79 2.60 2.39 0.47
Tendency
P > F 16 28 21 22 23 22P = F 2 0 0 0 0 1P < F 38 28 35 34 33 33

25
Appendix Table 1b. Statistical properties of revisions: United States
Period: Private Government Gross fixed Exports Imports Gross domesticQ1 1980 - Q4 1993 consumption consumption cap. formation product
Volumes
Unbiasedness 0.04 -0.13 0.03 -0.18 0.20 -0.04(0.54) (0.67) (0.12) (0.80) (0.59) (0.53)
Efficiency (beta) 0.43* 0.72* 0.22* 0.28* 0.43* 0.25*(7.40) (11.06) (2.63) (3.56) (5.23) (3.02)
Efficiency (rho) 0.11 0.28* 0.02 0.14 0.48* 0.08(0.84) (2.13) (0.13) (1.02) (3.99) (0.59)
Prices
Unbiasedness -0.08 0.09 -0.12 -0.68 -0.61 -0.03(1.77) (0.84) (1.10) (1.96) (1.91) (0.52)
Efficiency (beta) 0.28* 0.57* 0.33* 0.91* 0.63* 0.37*(4.90) (7.32) (3.00) (21.05) (9.69) (4.87)
Efficiency (rho) -0.10 0.23 0.07 -0.01 0.00 -0.08(0.75) (1.77) (0.53) (0.08) (0.02) (0.59)
26
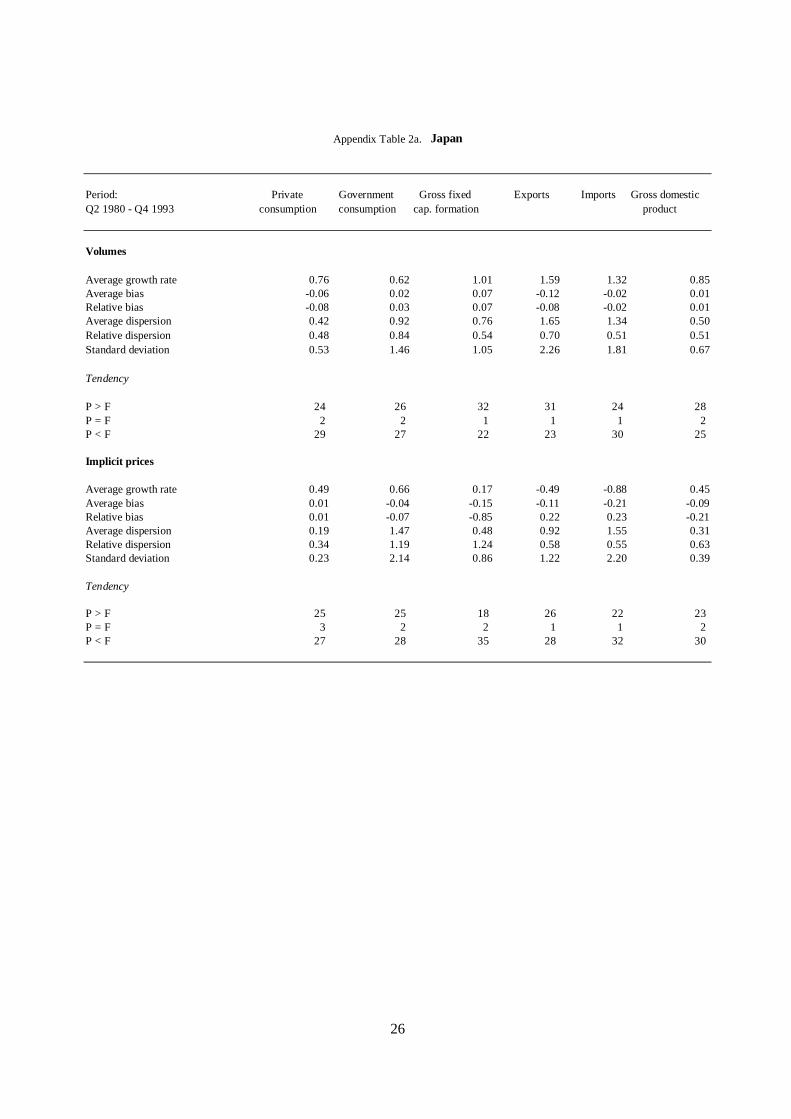
Appendix Table 2a. Japan
Period: Private Government Gross fixed Exports Imports Gross domesticQ2 1980 - Q4 1993 consumption consumption cap. formation product
Volumes
Average growth rate 0.76 0.62 1.01 1.59 1.32 0.85Average bias -0.06 0.02 0.07 -0.12 -0.02 0.01Relative bias -0.08 0.03 0.07 -0.08 -0.02 0.01Average dispersion 0.42 0.92 0.76 1.65 1.34 0.50Relative dispersion 0.48 0.84 0.54 0.70 0.51 0.51Standard deviation 0.53 1.46 1.05 2.26 1.81 0.67
Tendency
P > F 24 26 32 31 24 28P = F 2 2 1 1 1 2P < F 29 27 22 23 30 25
Implicit prices
Average growth rate 0.49 0.66 0.17 -0.49 -0.88 0.45Average bias 0.01 -0.04 -0.15 -0.11 -0.21 -0.09Relative bias 0.01 -0.07 -0.85 0.22 0.23 -0.21Average dispersion 0.19 1.47 0.48 0.92 1.55 0.31Relative dispersion 0.34 1.19 1.24 0.58 0.55 0.63Standard deviation 0.23 2.14 0.86 1.22 2.20 0.39
Tendency
P > F 25 25 18 26 22 23P = F 3 2 2 1 1 2P < F 27 28 35 28 32 30
27
Appendix Table 2b. Statistical properties of revisions: Japan
Period: Private Government Gross fixed Exports Imports Gross domesticQ2 1980 - Q4 1993 consumption consumption cap. formation product
Volumes
Unbiasedness -0.06 0.02 0.07 -0.12 -0.02 0.01(0.89) (0.09) (0.51) (0.39) (0.08) (0.13)
Efficiency (beta) 0.23* 0.43* 0.33* 0.46* 0.23* 0.42*(2.61) (8.35) (5.18) (7.59) (3.76) (5.24)
Efficiency (rho) 0.27* 0.32* -0.00 0.45* 0.12 0.35*(2.06) (2.44) (0.03) (3.72) (0.88) (2.74)
Prices
Unbiasedness 0.01 -0.04 -0.15 -0.11 -0.21 -0.09(0.19) (0.15) (1.26) (0.67) (0.69) (1.77)
Efficiency (beta) 0.21* 0.63* 0.74* 0.29* 0.29* 0.33*(4.53) (12.81) (11.29) (5.36) (6.21) (3.70)
Efficiency (rho) 0.14 0.39* 0.06 0.19 0.22 0.17(0.99) (3.07) (0.41) (1.40) (1.64) (1.27)
28
Appendix Table 3a. Western Germany
Period: Private Government Gross fixed Exports Imports Gross domesticQ1 1980 - Q4 1993 consumption consumption cap. formation product
Volumes
Average growth rate 0.50 0.29 0.22 1.31 0.93 0.48Average bias -0.18 -0.02 0.35 -0.21 0.11 -0.05Relative bias -0.37 -0.09 1.58 -0.16 0.12 -0.10Average dispersion 0.82 0.95 1.19 1.10 1.19 0.60Relative dispersion 0.88 0.93 0.58 0.45 0.59 0.62Standard deviation 1.39 1.34 1.62 1.60 1.50 0.75
Tendency
P > F 21 23 31 27 30 21P = F 0 0 0 0 1 0P < F 35 33 25 28 25 35
Implicit prices
Average growth rate 0.75 0.85 0.80 0.52 0.38 0.79Average bias -0.06 0.02 -0.15 0.20 -0.11 0.00Relative bias -0.08 0.02 -0.19 0.38 -0.29 0.00Average dispersion 0.77 1.43 1.26 0.88 1.02 0.49Relative dispersion 0.97 1.36 1.55 1.28 0.67 0.61Standard deviation 1.29 2.40 1.84 1.51 1.33 0.66
Tendency
P > F 26 27 24 29 22 28P = F 0 0 0 1 0 0P < F 30 29 32 26 34 28
29
Appendix Table 3b. Statistical properties of revisions: Western Germany
Period: Private Government Gross fixed Exports Imports Gross domesticQ1 1980 - Q4 1993 consumption consumption cap. formation product
Volumes
Unbiasedness -0.18 -0.02 0.35 -0.21 0.11 -0.05(0.99) (0.14) (1.61) (0.96) (0.56) (0.48)
Efficiency (beta) 0.68* 0.55* 0.29* 0.20* 0.19* 0.22*(6.82) (6.22) (5.28) (3.02) (2.86) (2.44)
Efficiency (rho) 0.12 0.23 0.24 0.02 0.15 0.14(0.93) (1.73) (1.88) (0.18) (1.11) (1.04)
Prices
Unbiasedness -0.06 0.02 -0.15 0.20 -0.11 0.00(0.35) (0.06) (0.62) (0.98) (0.62) (0.02)
Efficiency (beta) 0.85* 0.80* 1.00* 0.84* 0.32* 0.70*(13.47) (12.29) (16.81) (16.43) (4.79) (8.25)
Efficiency (rho) 0.19 0.02 0.35* 0.09 0.21 0.09(1.40) (0.16) (2.99) (0.69) (1.60) (0.64)

30
Appendix Table 4a. France
Period: Private Government Gross fixed Exports Imports Gross domesticQ1 1980 - Q4 1993 consumption consumption cap. formation product
Volumes
Average growth rate 0.54 0.55 0.25 0.95 0.80 0.45Average bias -0.08 -0.09 -0.12 -0.41 -0.13 -0.05Relative bias -0.14 -0.17 -0.47 -0.43 -0.16 -0.10Average dispersion 0.37 0.40 0.86 1.50 1.44 0.29Relative dispersion 0.56 0.68 0.77 0.83 0.63 0.48Standard deviation 0.52 0.54 1.06 1.89 1.91 0.37
Tendency
P > F 24 23 27 22 28 27P = F 1 1 1 0 0 1P < F 31 32 28 34 28 28
Implicit prices
Average growth rate 1.38 1.43 1.23 1.01 0.96 1.36Average bias 0.04 -0.07 -0.13 0.10 -0.15 -0.04Relative bias 0.03 -0.05 -0.11 0.10 -0.16 -0.03Average dispersion 0.28 0.57 0.65 0.78 0.96 0.27Relative dispersion 0.21 0.35 0.53 0.53 0.45 0.20Standard deviation 0.53 0.78 0.91 1.02 1.20 0.34
Tendency
P > F 30 27 24 27 26 24P = F 0 0 0 0 0 1P < F 26 29 32 29 30 31
31
Appendix Table 4b. Statistical properties of revisions: France
Period: Private Government Gross fixed Exports Imports Gross domesticQ1 1980 - Q4 1993 consumption consumption cap. formation product
Volumes
Unbiasedness -0.80 -0.09 -0.12 -0.41 -0.13 -0.05(1.12) (1.32) (0.84) (1.61) (0.49) (0.95)
Efficiency (beta) 0.41* 0.72* 0.26* 0.46* 0.30* 0.16(4.36) (9.72) (2.75) (6.51) (3.75) (1.72)
Efficiency (rho) 0.47* -0.31* 0.18 0.15 0.21 0.10(3.86) (2.42) (1.34) (1.08) (1.56) (0.77)
Prices
Unbiasedness 0.04 -0.07 -0.13 0.10 -0.15 -0.04(0.59) (0.66) (1.09) (0.72) (0.94) (0.89)
Efficiency (beta) 0.17* 0.19* 0.43* 0.24* 0.13* 0.06(2.76) (3.17) (5.06) (3.21) (2.37) (1.40)
Efficiency (rho) -0.02 -0.25* -0.03 0.16 0.21 0.04(0.17) (2.15) (0.26) (1.16) (1.69) (0.28)

32
Appendix Table 5a. Italy
Period: Private Government Gross fixed Exports Imports Gross domesticQ1 1987 - Q4 1993 consumption consumption cap. formation product
Volumes
Average growth rate 0.54 0.36 0.16 1.57 1.08 0.45Average bias 0.00 -0.02 -0.18 -0.23 -0.23 -0.10Relative bias -0.01 -0.06 -1.14 -0.15 -0.21 -0.22Average dispersion 0.38 0.31 0.81 1.55 1.20 0.38Relative dispersion 0.49 0.82 0.49 0.54 0.56 0.61Standard deviation 0.50 0.42 0.99 2.31 1.63 0.48
Tendency
P > F 11 10 10 14 9 10P = F 1 2 2 1 1 1P < F 10 16 16 13 18 17
Implicit prices
Average growth rate 1.41 1.89 1.21 1.16 1.17 1.47Average bias -0.12 -1.05 0.20 0.08 0.07 -0.31Relative bias -0.08 -0.55 0.17 0.07 0.06 -0.21Average dispersion 0.27 1.32 0.59 0.74 0.85 0.47Relative dispersion 0.19 0.67 0.49 0.50 0.44 0.32Standard deviation 0.42 1.34 1.12 1.14 1.11 0.51
Tendency
P > F 10 5 14 14 15 7P = F 2 1 1 1 1 1P < F 16 22 13 13 12 20

33
Appendix Table 5b. Statistical properties of revisions: Italy
Period: Private Government Gross fixed Exports Imports Gross domesticQ1 1987 - Q4 1993 consumption consumption cap. formation product
Volumes
Unbiasedness -0.00 -0.02 -0.18 -0.23 -0.23 -0.10(0.04) (0.29) (0.96) (0.53) (0.74) (1.09)
Efficiency (beta) 0.23 0.98* -0.17 0.31* 0.28* 0.35*(1.24) (5.22) (1.39) (4.34) (2.80) (2.15)
Efficiency (rho) -0.31 -0.08 -0.16 0.38* 0.04 -0.25(1.65) (0.41) (0.85) (2.06) (0.22) (1.35)
Prices
Unbiasedness -0.12 -1.05* 0.20 0.08 0.07 -0.31*(1.48) (4.14) (0.95) (0.39) (0.35) (3.21)
Efficiency (beta) 0.86* 0.33* 0.83* 0.37* 0.21* 0.41*(7.97) (3.60) (9.72) (4.44) (3.04) (3.02)
Efficiency (rho) -0.49* -0.32 -0.05 -0.18 -0.12 0.03(2.80) (1.69) (0.26) (0.93) (0.62) (0.16)

34
Appendix Table 6a. United Kingdom
Period: Private Government Gross fixed Exports Imports Gross domesticQ1 1982 - Q4 1993 consumption consumption cap. formation product
Volumes
Average growth rate 0.76 0.32 0.89 0.85 1.26 0.58Average bias -0.14 -0.05 -0.79 -0.07 -0.06 -0.18Relative bias -0.18 -0.15 -0.88 -0.08 -0.05 -0.31Average dispersion 0.62 0.89 1.97 1.83 1.83 0.80Relative dispersion 0.65 1.15 0.80 0.99 0.74 1.02Standard deviation 0.80 1.09 2.66 2.57 2.79 1.36
Tendency
P > F 24 27 23 21 26 16P = F 0 0 0 0 0 1P < F 24 21 25 27 22 31
Implicit prices
Average growth rate 1.25 1.55 0.86 0.90 0.77 1.29Average bias -0.01 -0.19 -0.15 -0.05 -0.09 -0.12Relative bias -0.01 -0.12 -0.17 -0.06 -0.12 -0.09Average dispersion 0.31 0.83 0.84 0.97 1.54 0.74Relative dispersion 0.25 0.52 0.73 0.53 0.68 0.58Standard deviation 0.41 1.00 1.15 1.41 2.28 1.11
Tendency
P > F 25 16 24 23 22 25P = F 1 1 0 0 0 0P < F 22 31 24 25 26 23
35
Appendix Table 6b. Statistical properties of revisions: United Kingdom
Period: Private Government Gross fixed Exports Imports Gross domesticQ1 1982 - Q4 1993 consumption consumption cap. formation product
Volumes
Unbiasedness -0.14 -0.05 -0.79 -0.07 -0.06 -0.18(1.21) (0.30) (2.05) (0.18) (0.14) (0.91)
Efficiency (beta) 0.39* 0.74* 0.35* 0.63* 0.55* 0.85*(3.22) (4.36) (3.02) (6.18) (4.63) (10.84)
Efficiency (rho) 0.03 0.36* 0.34* 0.36* 0.33* -0.01(0.22) (2.72) (2.61) (2.61) (2.34) (0.04)
Prices
Unbiasedness -0.01 -0.19 -0.15 -0.05 -0.09 -0.12(0.17) (1.34) (0.89) (0.24) (0.28) (0.76)
Efficiency (beta) 0.36* 0.53* 0.53* 0.08 0.26* 0.86*(5.10) (6.01) (4.37) (0.80) (2.03) (9.73)
Efficiency (rho) -0.02 0.23 0.24 0.29* 0.34* 0.05(0.16) (1.71) (1.65) (2.00) (2.45) (0.31)
36
Appendix Table 7a. Canada
Period: Private Government Gross fixed Exports Imports Gross domesticQ1 1980 - Q4 1993 consumption consumption cap. formation product
Volumes
Average growth rate 0.59 0.54 0.82 1.35 1.45 0.57Average bias -0.03 -0.24 -0.36 -0.33 -0.38 -0.08Relative bias -0.06 -0.44 -0.44 -0.24 -0.26 -0.15Average dispersion 0.35 0.79 1.30 1.86 2.05 0.39Relative dispersion 0.39 0.82 0.57 0.71 0.77 0.42Standard deviation 0.46 1.05 1.65 2.33 2.72 0.51
Tendency
P > F 26 22 22 18 24 26P = F 2 1 1 2 1 3P < F 28 33 33 36 31 27
Implicit prices
Average growth rate 1.23 1.32 0.43 0.46 0.46 1.07Average bias 0.01 0.01 0.25 -0.05 0.11 -0.03Relative bias 0.01 0.01 0.57 -0.11 0.24 -0.02Average dispersion 0.18 0.39 0.57 1.02 0.80 0.45Relative dispersion 0.15 0.29 0.68 0.90 0.73 0.42Standard deviation 0.23 0.65 0.73 1.37 1.16 0.62
Tendency
P > F 26 23 37 27 30 29P = F 1 3 1 1 1 1P < F 29 30 18 28 25 26

37
Appendix Table 7b. Statistical properties of revisions: Canada
Period: Private Government Gross fixed Exports Imports Gross domesticQ1 1980 - Q4 1993 consumption consumption cap. formation product
Volumes
Unbiasedness -0.03 -0.24 -0.36 -0.33 -0.38 -0.08(0.56) (1.72) (1.65) (1.06) (1.05) (1.25)
Efficiency (beta) 0.02 0.50* 0.19* 0.38* 0.35* 0.13(0.30) (2.46) (2.39) (5.32) (3.85) (1.82)
Efficiency (rho) 0.19 0.09 0.05 0.37* 0.27* 0.10(1.43) (0.65) (0.40) (2.90) (2.07) (0.74)
Prices
Unbiasedness 0.01 0.01 0.25* -0.05 0.11 -0.03(0.41) (0.12) (2.52) (0.29) (0.71) (0.31)
Efficiency (beta) 0.03 0.23* 0.33* 0.50* 0.43* 0.35*(0.88) (3.27) (3.73) (6.57) (6.37) (4.50)
Efficiency (rho) 0.19 -0.03 -0.30* 0.36* 0.19 -0.03(1.45) (0.25) (2.35) (2.85) (1.45) (0.25)

38
ECONOMICS DEPARTMENT
WORKING PAPERS
A complete list of Working Papers is available on request.
170. Confidence Indicators and their relationship to changes in Economic Activity (October, 1996)Teresa Santero and Niels Westerlund
169. Labour Productivity Levels in OECD Countries : Estimates for Manufacturing and SelectedService Sectors (September, 1996) Dirk Pilat
168. Ageing Populations, Pension Systems and Government Budgets : Simulations for 20 OECDCountries (September, 1996) Deborah Roseveare, Willi Leibfritz, Douglas Fore and EckhardWurzel
167. Modelling the Supply Side of the Seven Major OECD Economies (August, 1996) Dave Turner,Pete Richardson and Sylvie Rauffet
166. Size Distribution of Output and Emloyment: a Data Set for Manufacturing Industries in FiveOECD Countries, 1960s-1990 (August, 1996) Bart van Ark and Erik Monnikhof
165. Trade and Competition: Frictions after the Uruguay Round (July 1996) International Trade andInvestment Division
164. Corporate Governance, Compeition and Performance (June 1996) Colin Mayer
163. Fiscal Relations within the European Union (April 1996) Peter Hoeller, Marie-Odile Louppe andPatrice Vergriete
162. Mark-up Ratios in Manufacturing Industries (April 1996) Joaquim Oliveira Martins, StefanoScarpetta and Dirk Pilat
161. Innovation, Firm Size and Market Structure: Schumpetarian Hypotheses and Some New Themes(April 1996) George Symeoindis
160. Valuing the Right to Tax Incomes: An Options Pricing Approach (April 1996) Teun Draaismaand Kathryn Gordon
159. Innovation and Competitive Advantage (October 1995) P. A. Geroski
158. Monetary Policy at Price Stability: A Review of Some Issues (September 1995) Malcolm Edey,Norbert Funke, Mike Kennedy and Angel Palerm
157. Technical Progress, Factor Productivity and Macroeconomic Performance in the Medium Term(September 1995) Claude Giorno, Pete Richardson and Wim Suyker
156. Ageing Populations, Pension Systems and Government Budgets: How do they Affect Savings(August 1995) Willi Leibfritz, Deborah Roseveare, Douglas Fore and Eckhard Wurzel

39
155. The Determinants of Real Long-Term Interest Rates: 17 Country Pooled Time-Series Evidence(June 1995) Adrian Orr, Malcolm Edey and Michael Kennedy
154. An Assessment of Financial Reform in OECD Countries (May 1995) Malcolm Edey and KetilHviding
153. Markets for Tradeable CO2 Emission Quotas, Principles and Practice (February 1995) Graciela
Chichilnisky and Geoffrey Heal
152. Estimating Potential Output, Output Gaps and Structural Budget Balances (January 1995)Claude Giorno, Pete Richardson, Deborah Roseveare and Paul van den Noord
151. NOx/SO
x Emissions and Carbon Abatement (December 1994) Christophe Complainville and
Joaquim O. Martins
150. The Determinants and Properties of Monetary Conditions: Direct Survey Evidence from NewZealand (December 1994) Andreas Fischer and Adrian Orr
149. Health Care Reform: Controlling Spending and Increasing Efficiency (December 1994) HowardOxley and Maitland Macfarlan
148. Macroeconomic Performance and Fiscal Policy Adjustments in the Medium Term: AlternativeMedium-Term Scenarios (September 1994) Pete Richardson, Claude Giorno andStephan Thurman
147. The EC's Internal Market: Implementation, Economic Consequences, Unfinished Business(August 1994) Peter Hoeller and Marie-Odile Louppe
146. Comparison of Model Structure and Policy Scenarios: GREEN and 12RT (August 1994) AlanManne and Joaquim O. Martins
145. An International Sectoral Data Base for Fourteen OECD Countries (Second Edition) (June1994) F.J.M. Meyer zu Schlochtern and J.L. Meyer zu Schlochtern
144. Fiscal Policy, Government Debt and Economic Performance (June 1994) Willi Leibfritz,Deborah Roseveare and Paul van den Noord
143. GREEN: The Reference Manual (May 1994) Dominique van der Mensbrugghe
142. Pension Liabilities in the Seven Major Economies (December 1993) Paul van den Noord andRichard Herd
141. The Distribution System in Sweden (October 1993) Sören Wibe
140. The Distribution Sector in the United Kingdom (October 1993) John A. Dawson
139. The Italian Distribution System (October 1993) Luca Pellegrini and Angelo M. Cardani

40
GENERAL DISTRIBUTION
ECONOMICS DEPARTMENT
WORKING PAPERS
This series of Working Papers is designed to make available, to a wider readership, selectedstudies which the Department has prepared for use within OECD. Authorship is generallycollective, but main individual authors are named. The Papers are generally available in theiroriginal language, English or French, with a summary in the other.
The views expressed in this paper are those of the author(s) and do not necessarily reflect those ofthe OECD or of the governments of its Member countries.
Comment on the Papers is invited, and may be sent to OECD, Economics Department, 2 rueAndré Pascal, 75775 Paris Cedex 16, France. Additional copies of the Papers, on a limited basis,can be forwarded on request.
ORGANISATION FOR ECONOMIC CO-OPERATION AND DEVELOPMENT