Embed Size (px)
Citation preview

General Mills Fiscal 2016 First Quarter Results

8173-2
A Reminder on Forward-looking Statements
This presentation contains forward-looking statements within the meaning of the Private Securities Litigation Reform Act of 1995 that are based on management’s current expectations and assumptions. These forward-looking statements are subject to certain risks and uncertainties that could cause actual results to differ materially from the potential results discussed in the forward-looking statements. In particular, our predictions about future net sales and earnings could be affected by a variety of factors, including: competitive dynamics in the consumer foods industry and the markets for our products, including new product introductions, advertising activities, pricing actions and promotional activities of our competitors; economic conditions, including changes in inflation rates, interest rates, tax rates, or the availability of capital; product development and innovation; consumer acceptance of new products and product improvements; consumer reaction to pricing actions and changes in promotion levels; acquisitions or dispositions of businesses or assets; changes in capital structure; changes in the legal and regulatory environment, including labeling and advertising regulations and litigation; impairments in the carrying value of goodwill, other intangible assets, or other long-lived assets, or changes in the useful lives of other intangible assets; changes in accounting standards and the impact of significant accounting estimates; product quality and safety issues, including recalls and product liability; changes in consumer demand for our products; effectiveness of advertising, marketing and promotional programs; changes in consumer behavior, trends and preferences, including weight loss trends; consumer perception of health-related issues, including obesity; consolidation in the retail environment; changes in purchasing and inventory levels of significant customers; fluctuations in the cost and availability of supply chain resources, including raw materials, packaging and energy; disruptions or inefficiencies in the supply chain; effectiveness of restructuring and cost savings initiatives; volatility in the market value of derivatives used to manage price risk for certain commodities; benefit plan expenses due to changes in plan asset values and discount rates used to determine plan liabilities; failure or breach of our information technology systems; foreign economic conditions, including currency rate fluctuations; and political unrest in foreign markets and economic uncertainty due to terrorism or war. Forward-looking statements regarding the sale of our Green Giant business are subject to obtaining necessary approvals and consents for the transaction, fulfillment of other transaction conditions, economic conditions, and overall business and capital allocation strategy. The company undertakes no obligation to publicly revise any forward-looking statements to reflect any future events or circumstances.

Don Mulligan Executive Vice President;
Chief Financial Officer
First Quarter 2016
Financial Review

8173-4
First Quarter Fiscal 2016 Summary
*Non-GAAP measures.
**Excluding impact of proposed Green Giant divestiture.
• Strong Constant-currency Growth in Net
Sales, Total Segment Operating Profit*,
and Adjusted Diluted EPS*
• Cost Savings Initiatives on Target
• On Track to Deliver F16 Growth Goals**

8173-5
Green Giant Divestiture
• Selling Green Giant Brand to B&G Foods; General Mills Will Continue to Operate in Europe and Select Other Markets Via Royalty-free License
• Gross Sale Proceeds of Approximately $765MM
• Net Cash Proceeds to be Used for Share Repurchases and Debt Reduction
• Estimated F16 EPS Dilution of Approximately $0.05-$0.07*
• Transaction Expected to Close by End of CY 2015
*Excludes transaction costs and a one-time gain on the sale.

8173-6
Net Sales $4,208 -1% +4%
Segment Operating Profit* 826 +20% +23%
Net Earnings Attributable to General Mills 427 +24
Diluted EPS $0.69 +25
Certain Items Affecting Comparability 0.10
Adjusted Diluted EPS* $0.79 +30% +36%
First Quarter Fiscal 2016 Financial Summary
($ in Millions, Except per Share)
*Non-GAAP measures. See appendix for reconciliation.
$ % Change
Constant- currency
% Change*

8173-7
First Quarter Fiscal 2016 Components of Net Sales Growth
(As Reported)
Volume Price &
Mix Total
Net Sales
+2pts
-5pts
-1pt
Foreign Exchange
+2pts
Annie’s Contribution: 1 Point of Volume Growth, 2 Points of Net Sales Growth

8173-8
First Quarter Fiscal 2016 U.S. Retail Segment
Cereal +6%
Meals +6
Yogurt +4
Snacks +2
Baking Products Flat
Total U.S. Retail +4%
Q1 Net Sales Growth

8173-9
U.S. Retail Sales Trends
• U.S. Retail Net Sales Outpaced Consumer
Movement in Q1
− Growth in Non-measured Channels
− Customer Inventory Build
− High Promotional Expense in Year-ago Period
− Growth in Net Sales and Consumer Movement
Comparable on 2-Year Basis
• Expect Stronger Consumer Movement in Q2

8173-10
First Quarter Fiscal 2016 Convenience Stores & Foodservice Segment
6 Focus Platforms +9%
Other -6
Total CS&F +1%
Q1 Net Sales Growth

8173-11
First Quarter Fiscal 2016 International Segment
Europe +7%
Canada +5
Asia / Pacific +3
Latin America +3
Total International +5%
Q1 Constant-currency
Net Sales Growth*
*Non-GAAP measure. See appendix for reconciliation.

8173-12
*Non-GAAP measure. See appendix for reconciliation.
Adjusted Gross Margin* Results
• F15 First Quarter Impacted by High Promotional Expense
• Benefit from Cost Savings Projects
• HMM Offsetting Inflation
• Expect 2% Inflation for Full Year
Q1
F15 F16
34.8%
37.7%
8173-13
Total Segment
Operating Profit* $826 +20% +23% -15%
U.S. Retail 630 +38 -25
International 117 -20 -3 +17
Convenience Stores
& Foodservice 80 -9 +18
*Non-GAAP measure. See appendix for reconciliation.
First Quarter Fiscal 2016 Segment Operating Profit
($ in Millions)
$ % Change
Constant-currency
% Change*
Memo: Q1 F15
Constant- currency
% Change*

8173-14
First Quarter Fiscal 2016 Joint Venture Results
Cereal Partners Worldwide
Net Sales -2%**
Häagen-Dazs Japan
Net Sales +9%**
*Non-GAAP measure. See appendix for reconciliation.
**Growth rates in constant currency.
After-tax Earnings: $26MM; +16% vs. LY in Constant Currency*

8173-15
First Quarter Fiscal 2016 Other Income Statement Items
• Restructuring & Project-related Charges of $95MM Pretax (Includes $35MM in Cost of Sales)
• Unallocated Corporate Expense Decreased Excluding Certain Items
• Net Interest Expense $3MM Below Last Year
• Adjusted Effective Tax Rate 32.3%, Flat to LY*
• Average Diluted Shares Outstanding Down 2%
*Non-GAAP measure. See appendix for reconciliation.

8173-16
($ in Millions)
F16 F15
Q1
Accounts Receivable $1,532 $1,623
Inventories 1,796 1,823
Accounts Payable 1,760 1,571
Total Core Working Capital $1,568 $1,875 -16%
% Change
Core Working Capital

8173-17
First Quarter Fiscal 2016 Cash Flow Highlights
• Fixed Asset Investment =
$147MM
• Dividends Paid = $267MM
• Share Repurchases =
$152MM
Operating Cash Flow ($ in Millions)
F15 F16
$329
$431
Uses of Cash

8173-18
Update on Cost Savings Initiatives
• Targeting $400MM in F16 COGS HMM Savings
• Incremental Cost Savings Initiatives Remain on Track
(Project Century, Project Catalyst, Project Compass,
and Policies & Practices Update)
− Cumulative Annual Savings
− F15: $75MM
− F16 Goal: $285 - $310MM
− F17 Goal: $400MM+

8173-19
Reaffirming Fiscal 2016 Guidance
*Non-GAAP measures.
Net Sales Flat
Segment Operating Profit* +LSD
Adjusted Diluted EPS* +MSD
Constant-currency
Growth (52 vs 53 wks)
(Guidance Excludes Impact of Green Giant Divestiture)

Shawn O’Grady Senior Vice President; President,
Sales and Channel Development
U.S. Retail Sales
Update
8173-21
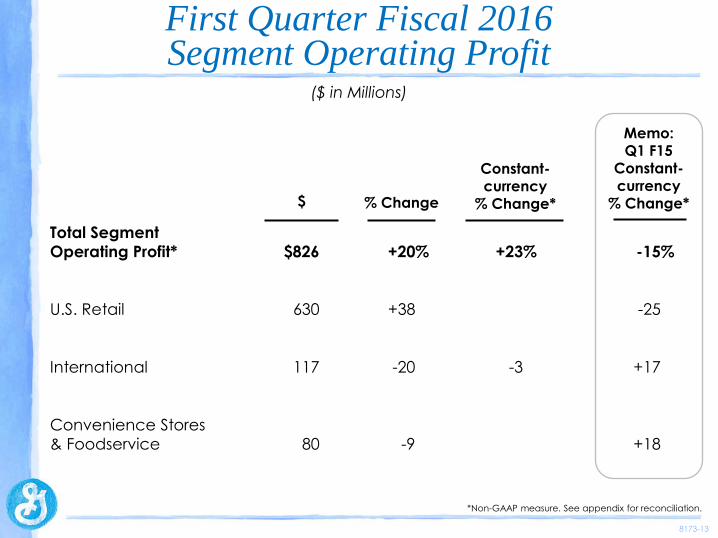
U.S. Retail Salesforce
Leading Profitable Growth:
• Supporting U.S. Retail Priorities
• Growth Across Channels
• Quality Execution

8173-22
U.S. Retail Sales
1,700 Sales Employees Expertise in 25 Categories
Across 3 Temperature States
Frozen Refrigerated Dry
Average 690 SKUs/Store

8173-23
U.S. Retail Priorities
Grow Cereal
Accelerate Yogurt and Snacks
Drive Double-digit Growth on Natural & Organic Portfolio
Deliver Consumer-first Value on Key Brands

8173-24
Grow Cereal
Gluten Free Cheerios
• Full Pallet In-store Displays
• Customized Point-of-sale
• Digital Tie-in with Customers

8173-25
Accelerate Yogurt & Snacks
Brand Innovation
• Secure Shelf Space
• Seed Launch with
Introductory Merchandising
• Execute In-store Sampling

8173-26
Drive Growth on Natural & Organic
Distribution Expansion
• Strengthen Core Distribution
• Expand into New Channels
• Sell New Offerings

8173-27
U.S. Retail Landscape
Grocery
5-Year F&B Industry CGR:
+LSD
Source: Kantar Retail, Nielsen scanner data, company estimates.
Supercenter
5-Year F&B Industry CGR:
+LSD
Alternative Channels
5-Year F&B Industry CGR:
+HSD

8173-28
Growth Across Channels
Club
• Win in Snacking Occasion
• Leverage Strong Product
Credentials
• Launch Unique Innovation

8173-29
Growth Across Channels
Natural & Organic • 3rd Largest U.S. N&O
Food Manufacturer
• Increasing Resources
• Leveraging Annie’s
Expertise to Grow
General Mills Natural &
Organic Brands

8173-30
Growth Across Channels
Drug & Dollar Stores
• Drug: Health Needs
• Dollar: Key Price Points
• Leading Advisor on Food

8173-31
Growth Across Channels
E-commerce
• Virtual Shelf / Captaincies
• Smaller Brands: Spearfishing
• Bigger Brands: Full Basket
Shopping

8173-32
Quality Execution
On-Shelf Distribution In-Store Display

8173-33
Quality Distribution
Source: Nielsen scanner data; internal shipment data.
Top 450 SKUs
75% of Volume
25% Distribution
Gap
Significant Growth
Opportunity

8173-34
Quality Display
• Focus on Most Productive Categories
• Focus on Leading National Brands
• Feature Fewer, Larger Items
Optimizing In-Store Display
8173-35
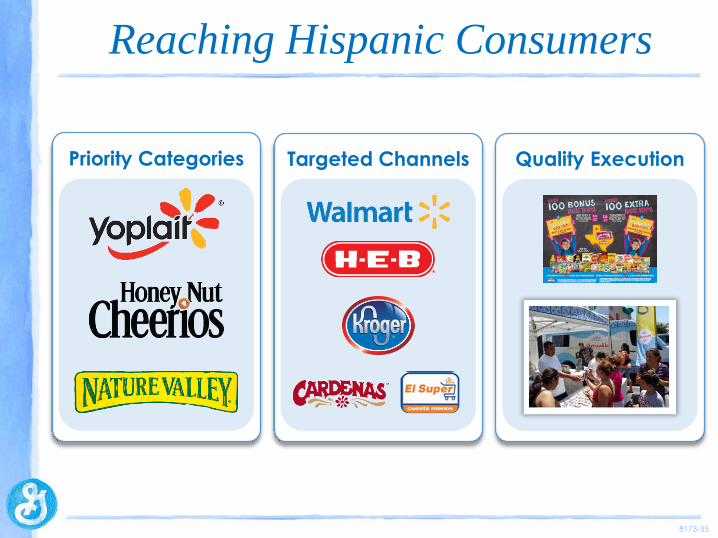
Reaching Hispanic Consumers
Priority Categories Targeted Channels Quality Execution

8173-36
U.S. Retail Salesforce
Leading Profitable Growth:
• Supporting U.S. Retail Priorities
• Growth Across Channels
• Quality Execution

Ken Powell Chairman and CEO
Operating Highlights

8173-38
Progress on U.S. Retail Fiscal 2016 Priorities
• Growing Cereal, Yogurt and Snacks
• Increasing Distribution on Natural &
Organic Products
• Addressing Value on Key Brands

8173-39
Improving U.S. Cereal Trends
-5.2%
-3.6%
-2.2% -1.6% -1.2%
Q1
F15
Q2
F15
Q3
F15
Q4
F15
Q1
F16
(RTE Cereal Category Retail Sales)
Source: Nielsen XAOC.

8173-40
U.S. Cereal Renovation and Innovation
Gluten-free Cheerios
Off to a Good Start
First Half Fiscal 2015
Second Half Fiscal 2015
Expanding Nature Valley
Franchise

8173-41
U.S. Yogurt Continues to Grow (Q1 Retail Sales)
Yoplait Greek
+11%
Yoplait Original
+4%
Source: Nielsen XAOC ended 8.29.15.

8173-42
U.S. Snacks Highlights
Source: Nielsen XAOC ended 8.29.15.
• Retail Sales Growth in
Grain Snacks
• Retail Sales Declines
in Fruit and Salty
Snacks Due to Lower
Merchandising
• Strong Levels of
Innovation in 2H

8173-43
Natural & Organic Portfolio Innovation
Cereal
Snacks
Soup

8173-44
Introducing Annie’s Yogurt
• Organic,
Whole-milk Yogurt
• Three Kid-friendly
Flavors
• Launching in
January 2016

8173-45
Additional U.S. Retail First-quarter Highlights
Old El Paso
Q1 Retail Sales: +2%
Progresso Soup
Launches
Totino’s Hot Snacks
Q1 Retail Sales: +4%
Improved
Value Source: Nielsen XAOC ended 8.29.15.

8173-46
Convenience Stores & Foodservice First-quarter Highlights
Cereal
Snacks
Yogurt
Frozen Meals

8173-47
International Highlights - Canada Q1 Constant-currency Net Sales: +5%*
Grain Snacks
Q1 Retail Sales Growth: +18%
Yogurt
Q1 Retail Sales Growth: +2%
*Non-GAAP measure. See appendix for reconciliation.
Source: Nielsen ended 8.22.15.
8173-48
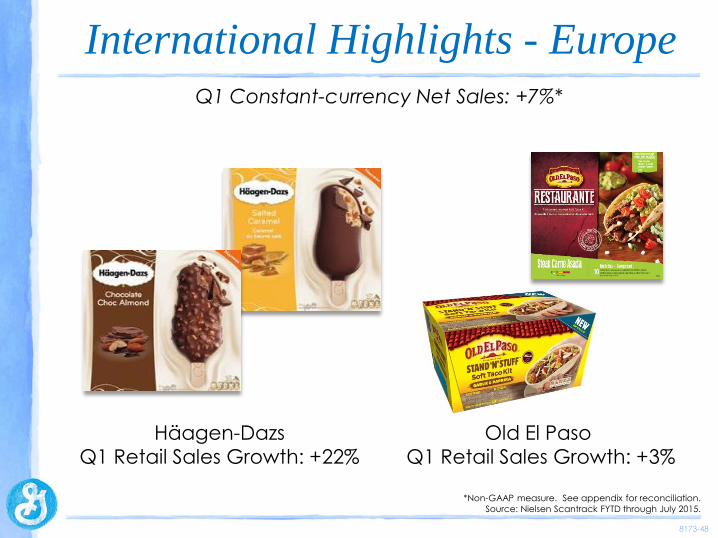
International Highlights - Europe Q1 Constant-currency Net Sales: +7%*
Häagen-Dazs
Q1 Retail Sales Growth: +22%
Old El Paso
Q1 Retail Sales Growth: +3%
*Non-GAAP measure. See appendix for reconciliation.
Source: Nielsen Scantrack FYTD through July 2015.

8173-49
International Highlights - Asia/Pacific Region
Häagen-Dazs Wanchai Ferry
China
Snacks
Häagen-Dazs
AMEA
Yoplait Off to a
Good Start
Q1 Constant-currency Net Sales: +3%*
*Non-GAAP measure. See appendix for reconciliation.

8173-50
International Highlights - Latin America
• Q1 Constant-currency
Net Sales: +3%*
• Good Growth in
Argentina and Mexico
• Challenging Market
Conditions in Brazil
*Non-GAAP measure. See appendix for reconciliation.

8173-51
General Mills First Quarter Fiscal 2016 Summary
• Strong Constant-currency Growth in Net
Sales, Total Segment Operating Profit*,
and Adjusted Diluted EPS*
• Cost Savings Initiatives on Target
• On Track to Deliver F16 Growth Goals**
*Non-GAAP measures.
**Excluding impact of proposed Green Giant divestiture.

8173-52
U.S. Retail $630 $457
International 117 146
Convenience Stores & Foodservice 80 87
Total Segment Operating Profit $826 $690
Unallocated Corporate Items 83 119
Restructuring, Impairment, and Other Exit Costs 60 14
Operating Profit $683 $558
Reconciliation of First Quarter Total Segment Operating Profit
(Fiscal Years, $ in Millions)
Table does not foot due to rounding.
2016 2015
Q1

8173-53
Reconciliation of First Quarter Constant-currency Net Sales Growth
(Fiscal Years)
Europe -10% -17 pts 7%
Canada -11 -16 5
Asia/Pacific Flat -3 3
Latin America -26 -29 3
Total International -11% -16 pts 5%
Total Net Sales -1% -5 pts 4%
% Change in Net Sales
on a Constant- currency Basis
Impact of Foreign Currency Exchange
% Change in Net Sales
as Reported
Q1 2016

8173-54
Reconciliation of Adjusted Diluted EPS and Related Constant-currency Growth Rate
(Fiscal Years)
Diluted EPS $0.69 $0.55 +25%
Mark-to-market effects -- .05
Restructuring costs .09 .01
Project-related costs .01 --
Adjusted Diluted EPS $0.79 $0.61 +30%
Impact of Foreign Currency Exchange -6
Adjusted Diluted EPS on a constant-currency basis +36%
2016 2015
Q1
Change

8173-55
(Fiscal Years)
International Segment Operating Profit -20% -17 pts -3%
Total Segment Operating Profit 20% -3 pts 23%
% Change in Segment
Operating Profit on a Constant- currency Basis
Impact of Foreign Currency Exchange
% Change in Segment
Operating Profit as Reported
Q1 2016
First Quarter Fiscal 2016 Reconciliation of Constant-currency Segment Operating Profit Growth

8173-56
(Fiscal Years, $ in Millions)
$
Net Sales $4,208 $4,268
Gross Margin as Reported* 1,555 36.9% 1,439 33.7%
Mark-to-market effects -3 49
Restructuring charges 22 --
Project-related costs 13 --
Adjusted Gross Margin $1,587 37.7% $1,488 34.8%
2016
$
% of Net Sales
2015
% of Net Sales
Reconciliation of First Quarter Adjusted Gross Margin
Q1
*Net sales less cost of sales.

8173-57
(Fiscal Years)
International Segment Operating Profit 16% -1 pts 17%
Total Segment Operating Profit -15% -- -15%
% Change in Segment
Operating Profit on a Constant- currency Basis
Impact of Foreign Currency Exchange
% Change in Segment
Operating Profit as Reported
Q1 2015
First Quarter Fiscal 2015 Reconciliation of Constant-currency Segment Operating Profit Growth

8173-58
(Fiscal Years)
Q1 2016
Total After-tax Earnings from Joint Ventures -1% -17 pts 16%
% Change in After-tax
JV Earnings on a Constant- currency Basis
Impact of Foreign Currency Exchange
% Change in After-tax
JV Earnings as Reported
Reconciliation of Constant-currency After-tax JV Earnings

8173-59
Reconciliation of Tax Rate Excluding Items
As Reported $608 $199 $479 $153
Mark-to-market effects -3 -1 49 18
Restructuring charges 82 24 14 5
Project-related costs 13 5 -- --
As Adjusted $700 $226 $542 $175
Effective Tax Rate:
As Reported 32.7% 31.8%
As Adjusted 32.3% 32.3%
Pre-tax Earnings*
Income Taxes
Q1 2015
(Fiscal Years, $ in Millions)
Pre-tax Earnings*
Income Taxes
* Earnings before income taxes and after-tax earnings from joint ventures.
Table does not foot due to rounding.
Q1 2016