Embed Size (px)
Citation preview
285
Invited Review
Generalized linear models
Peter M c C U L L A G H Department of Mathematics, Imperial College of Science and Technology, London SW7 2BZ, United Kingdom
Received October 1983
1. Introduction
As the name suggests, generalized linear models are an extension of the familiar general linear model discussed in standard textbooks, e.g. Rao [16], Scheffe [17], Searle [18], Seber [19], and it is important to distinguish the two terms. The essen- tial ingredients in the case of the general linear model are a response vector Y of length n, a model matrix X of order n × p giving a description of the conditions under which the observations were made, and a p-dimensional parameter vector fl for which estimates or confidence limits are required. The model matrix is regarded as fixed and the primary objective is to investigate the relationship between p = E ( Y ) and X: this relationship is as- sumed to be linear in the unknown ft.
Although it is possible to develop an exact theory of the general linear model based, say, on normal-theory assumptions, substantial progress can be made with the considerably weaker but more plausible second-order assumptions. That is to say, we assume that
(1)
and
c o v ( r ) = o2v (2)
where V is a known positive semi-definite matrix and o 2 is generally unknown. In the case of gener- alized linear models it is sometimes possible to
develop an exact theory based on full distribu- tional assumptions, but, in this paper, we con- centrate on second-moment assumptions and ex- tensions of the method of least squares. The weighted least squares equations for ~ in the linear model (1) may be written in the slightly unusual form
x'w(r- xl )=o (3)
where W = V -~. We have chosen to write the equations in the form (3) in order to emphasise the geometrical interpretation, namely, that the resid- ual vector ( Y - / i ) is orthogonal to the columns of X with respect to the inner product matrix W. It will be seen in Section 2 that this geometrical interpretation of ~ in the general linear model extends easily to generalized linear models whereas the notion of minimizing a suitably chosen func- tion does not. Finally we note that the covariance matrix of # in (3) is o2(xTwx) -t.
In the case of generalized linear models, as- sumptions (1) and (2) are relaxed as follows. First. the variance of an observation need not be con- stant but may depend on the mean so that (2) becomes
cov(Y) = (4)
where V(-) is a positive semi-definite matrix of known functions. In the theoretical development in Section 2 we replace the linear model (1) by the non-linear regression model
~, = ~,(fl) (5)
where the model matrix X has been absorbed into the function p( . ) . However, in most examples, the model has a linear component that can be ex- ploited in a useful way. Generalized linear models have the following structure
North-Holland European Journal of Operational Research 16 (1984) 285-292
71 = X f l . (6)
,~, = g(~ , , ) (7)
037%2217/84/$3.00 © 1984. Elsevier Science Publishers B.V. (North-Holland)
286 P. McCullagh / Generalized hnear models
where g(-) is known as the 'link' function. It is easily seen that (6) and (7) together constitute a special case of (5). Furthermore, for generalized linear models, the derivative matrix D = {Oft,lOfts }, which is used in Section 2, can be written as the product of a diagonal matrix with the model ma- trix X, a structure that leads to considerable com- putational simplification.
Some authors, e.g. Thompson and Baker [20], McCullagh and Nelder [13], permit link functions more general than (7). All of these are special cases of (5) and, while they introduce no new theoretical difficulties, they do generally increase computational complexity. Furthermore, in most applications, V(#) is a diagonal or block-diagonal matrix, a structure that can be exploited to sim- plify and reduce computations (Neider and Wed- derburn I15]).
2. Quasi-likelihood, least squares and minimum chi-square
We now consider extensions of the least squares method that are appropriate when the covariance matrix of Y is not constant but varies with /~ = E(Y). Examples of this are very common and are discussed in Section 3.
On possibility would be to choose t * as the value that minimizes the quadratic form
x2(fl)= (8)
where W = V- ' . This might be called the method of minimum chi-square but it is not difficult to show that t * is inconsistent except in the case where W(fl) is independent of ft. In other words the probability limit of t * as n ---, ~ is not ft.
The correct generalization of the least squares method is based on (3), i.e. U(fl) = 0 where
U(fl)= DTW( V- } (9)
where D = {O#,/Ofl, } and W are both considered as functions of ft. The function U(fl) may be viewed in two different but complementary ways. On the one hand, the equations U(~) = 0 express the same kind of orthogonality between the resid- ual vector Y - / i and the columns of D as that discussed at (3) above. On the other hand U(fl) behaves like the derivative of a log-likelihood
function in the sense that E{U(fl)} = 0 and
cov{U(f l )} = -o2e{u ' ( f l ) } =o2OTWD (lO)
where U'(fl) is the p × p matrix of derivatives of U(,8). Furthermore, for large n and under mild regularity conditions there exists a solution satisfying
Np{0, no2(o+wo)-l) +Op(n - ' /2 ) (11)
where Np denotes the p-variate normal distribution (McCullagh [11]).
If there exists a function I(fl) having U(fl) as first derivative vector then 1(,8 ) is known as the log-quasi-likelihood. In general, however, no such function exists, except perhaps in an asymptotic sence, because U'(fl) is not symmetric. However, the existence or non-existence of 1(,8) has no effect on the properties of ~, at least to the usual first order of approximation.
Finally, in order to set approximate confidence limits for a component, ill, say, of ,8 we require an estimate of 02 . In the case of the general linear model (1), (2), it is conventional to take the unbi- ased estimator
= ( v - v - f , ) / ( ,, - p )
where ~ = Xfl (Wedderburn [21]). The correspond- ing estimator with W replaced by l~" is the one commonly used in the case of generalized linear models. In other words
s2= X " ( f l ) / ( ~ - p ) (12)
and X2(fl) is a generalization of K. Pearson's goodness of fit statistic. The approximate confi- dence limits at level 1 - a for fl~ based on the normal approximation (11) are
+ , _ ska/2(t (13)
where i I' is the (1, 1) element of (DTWD) -I evaluated at/~ and 4~(k~*) = 1 - a. The accuracy of (13) depends heavily on the skewness of fll and can often be improved by choosing a scale st~ch that /3~ is approximately normally distributed. If the full distribution of the data, as opposed to the first two moments, is known then it is generally possible by computing higher order moments of/}1 and using Edgeworth expansions to improve on (13). See e.g. Cox [4] for the one-parameter case or McCullagh [12] for the multi-parameter case.
P. McCullagh / Generalized linear models 287
3. Applications
Regression is one of the most widely used and most easily understood statistical techniques. Al- though introductory texts place much emphasis on linear models, there are forceful arguments in favour of non-linear models, particularly when the range of response values is restricted to be positive or to lie in a fixed interval. A great many of the models that arise in applications are the gener- alized liner type (6), (7) while others, although linear, require an extended definition of the link function in (7). McCullagh and Nelder [13] discuss a number of intrinsically non-linear models but the following examples involve models having a substantial linear component (6).
3. l. Binary regression
different from the maximum likelihood estimator because there is no guarantee in general that all components of ,~ ffi X~ lie in the range [0, 1] as is required of the maximum likelihood estimator. A second difficulty, though rarely a problem in prac- tice, concerns uniqueness of the roots of U(~ ) ffi 0. We may conclude therefore, subject of the caveats just mentioned, that ~ is the maximum likelihood estimate.
The above discussion assumes that the data are ungrouped, but very commonly, homogeneous subsets are combined so that Y, gives the number of successes out of n, independent trials. It may be verified that (14) continues to apply in the case of the linear logistic model and (15) in the case of the linear probability model where, now, #, = n,er,.
Finally in the above example, var(Y,)= ~r,(1 - ) so that o2 __ 1 and does not require estimation.
Suppose that, independently for each i, Y, takes the value 0 with with probability 1 - or, and 1 with probability ~r, representing, say, failure and success respectively. Then p ffi E ( Y ) = ¢t, V= diag{ ~r,(1 -
)} and W = diag{ ~r- 1(1 - ~r, )- 1 }. Under the lin- ear logistic model we set *1, = log{ %/(1 - ~r,)} and
n = X,8.
One of the advantages of considering linear mod- els on the logistic scale as against linear models on the probability scale is that there are no range restrictions on r/,, unlike ~r, which must lie in the range [0. 1]. Thus any value of fi in the linear logistic model leads to probabilities in the correct range. The derivative matrix is given by D = VX so that (9) becomes
u(#) = x~ [ r - ~,(~)] (14)
which is in fact the log-likelihood derivative vec- tor, showing that maximum likelihood and least squares coincide.
On the other hand, if we had contemplated a model linear on the mean value scale, in this case not a wise choice, we have
so that D = X. Thus
U ( f l ) f X T W [ Y - p ( f l ) ] (15)
which is again the log-likelihood derivative vector. However a value /~ satisfying U ( ~ ) = 0 may be
3.2. Log-finear models
Suppose that Y has independent components with mean vector p and covariance matrix V= 0 2 diag(/~). All log-linear models may be written in terms of a model matrix X in the form
n=X,O
where )7, = log(#,) so that the ' l ink ' function in (7) is the logarithm.
As in the previous example, 0~/0~ = It, so that (9) becomes
U( f l ) = x T [ y - - # ( f l ) ] . (16)
In the particular case where X is the incidence matrix for a factorial model (often, in this context, misleadingly called a hierarchical model), X T Y gives the marginal totals corresponding to those terms (main effects and interactions) included in the model. The estimating equations U(~ ) = 0 as- sert that the observed and fitted values corre- sponding to these marginal totals are the same. This is the basis of the method of iterative propor- tional fitting, see, e.g. Bishop, Fienberg and Hol- land [23]. Note however that the derivation given here makes no use of likelihood functions. Evi- dently, the assumption of Poisson variation, im- plicit in most treatments of log-linear models is not essential. Of course (16) may be obtained as the derivative of a Poisson log-likelihood but the justification for (16)extends beyond this. In other
288 P. McCullagh / Generalized linear models
words, the use of standard methods for log-linear models can be justified without appeal to the Poisson distribution.
The factor 02 is known a~; the dispersion param- eter and, although it is not a variance, it does play the same role as the variance in normal-theory models. The usual estimator (12) may be written
. 2 ~ X2 ( n - ? ) s : = ~2(E- ~,,)/~,=
where the expression on the right is Pearson's goodness-of-fit statistic and s 2 is known as the Lexis ratio.
In many applications involving counted data it is found that 02> I, a phenomenon known as over-dispersion. There are numerous causes, see e.g. McCullagh and Nelder [13], Healy [7]. Under- dispersion, though less common in applications, is modelled by taking o 2 < 1.
3.3. Regression with constant coefficient of variation
Suppose that )'1 . . . . . Yn are uncorrelated, that var(Y,) = o 2#2, where o is the unknown coefficient of variation, assumed constant over i, and that inference is required for fll where
log#,=flo+fl , (x , -Y,) , i = 1 . . . . . n. . (17)
This formulation is often appropriate for positive observations where the effect on Y of changes in x is assumed to be multiplicative and where the proportional standard deviation rather than the variance is constant over all observations. Thus we have one parameter of interest, ill, and two nui- sance parameters (130, 02). Now (17) is a special case of (7) and, although the estimating equations for fl, U ( ~ ) = 0, do not have closed form solu- tions, we find from (11) that
var(/~0) = o 2/n; = o21y'.(x,- X)2
(18)
and in fact fl0 and 13~ are uncorrelated. There is a close similarity here to the ordinary linear regres- sion model with constant variance.
Formulae (18) are justified on the basis of second moment assumptions only without any ap- peal to more detailed distributional assumptions. An alternative procedure, and one that seems ap- pealing if the data are symmetrically distributed or nearly so is to assume normality and independence
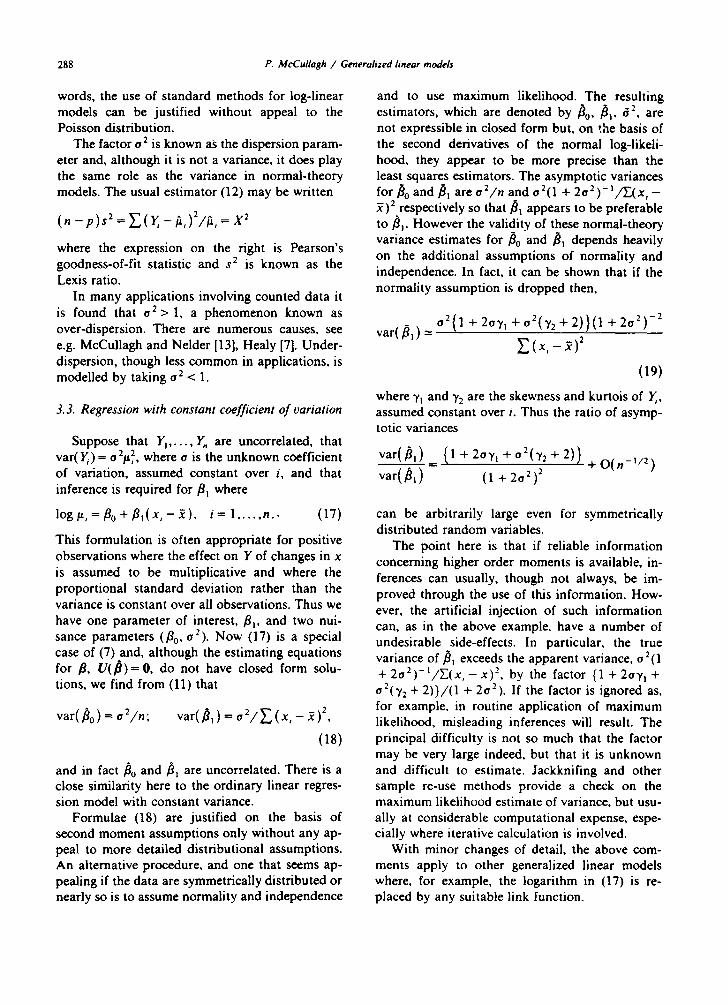
and to use maximum likelihood. The resulting estimators, which are denoted by /~0, /~1, 52, are not expressible in closed form but, on :he basis of the second derivatives of the normal log-likeli- hood, they appear to be more precise than the least squares estimators. The asymptotic variances for/)o and fll are o2/n and 02(1 + 2o2)-I/~_,(x,- .~)2 respectively so that fll appears to be preferable to/~1. However the validity of these normal-theory variance estimates for/)0 and 1)1 depends heavily on the additional assumptions of normality and independence. In fact, it can be shown that if the normality assumption is dropped then,
o {1 + 2or, + + 2)}(1 + 2 ° : ) - : var( 1)1 ) =
(19)
where ~'1 and ~,: are the skewness and kurtois of Y,, assumed constant over i. Thus the ratio of asymp- totic variances
var(/~,) = (1 + 2oy, +02('),2 + 2)) + O(n_, /2 )
var(/31) (1 + 2o2) 2
can be arbitrarily large even for symmetrically distributed random variables.
The point here is that if reliable information concerning higher order moments is available, in- ferences can usually, though not always, be im- proved through the use of this information. How- ever, the artificial injection of such information can, as in the above example, have a number of undesirable side-effects. In particular, the true variance of/~1 exceeds the apparent variance, o2(1 + 2o2) - l /E(x , - x) 2, by the factor {1 + 2o~, I + o2('),2 + 2))/(1 + 202). If the factor is ignored as, for example, in routine application of maximum likelihood, misleading inferences will result. The principal difficulty is not so much that the factor may be very large indeed, but that it is unknown and difficult to estimate. Jackknifing and other sample re-use methods provide a check on the maximum likelihood estimate of variance, but usu- ally at considerable computational expense, espe- cially where iterative calculation is involved.
With minor changes of detail, the above com- ments apply to other generalized linear models where, for example, the logarithm in (17) is re- placed by any suitable link function.
P. McCullagh / Generalized linear models 289
3.4. Multinomial response models
Suppose that the components of Y are indepen- dent multinomial k-vectors so that Y, satisfies
= E ( r , ) = m , , , ,
and
V, = coy(Y,) = m, {diag(~,) - *r,*r, r }
where V, has r a n k k - 1 since the sum of the k components of Y, is equal to the multinomial index m,. Formulae (8) and (9) may be used as before where W is an appropriate generalized in- verse of V. Wri t ing /x j = m,~r,j = E(Y,~), any log- linear model may be written in the form
,7,, = log = x ,8, (20)
subject to Y.jg~ - 1. As in Examples 3.1 and 3.2, the equations U ( ~ ) = 0 yield maximum likelihood estimates of the parameters.
If the response categories are ordered it is gen- erally considered more appropriate (McCullagh [10]) first to form cumulative totals 7,j = *r,i + • -- + ~r u. The proportional odds model may be written in terms of y,~ as
~, ~-- log{ ~iy/(1 -- ~,,) } m 0, + ,ST.K,. (21)
This is, of course, a linear model on the scale tl but the transformation ,r u --* 7/,j is not of the simple type (7) since y,j depends on g~ . . . . . 7r u. Link func- tions of this type are said to be composite [20] and arise with reasonable frequency in a variety of statistical applications. A useful alternative to the logistic link function in (21) is the complementary log-log link
, , , , = l o g { - l o g 0 - , , , ) }
where the structure on the right of (21) is retained. There is a close connection between the comple- mentary log-log link and the proportional hazards model (Cox [3]). In all the above cases, the least squares equations
D T W ( Y - I i ) = O
are also the maximum likelihood equations.
3.5. Additwe-multiplicative models
This example serves to illustrate the difficulties that can arise in dealing with intrinsically non-lin-
ear models, i.e. models not of the generalized type. Suppose that the observations are arranged in a complete two-way table as, for example, in a randomized blocks design or in a two-way con- tingency table. The model of no interaction may be written
,7,, = + g (22)
where, for linear models r/,~ =/~,j, and, for log-lin- ear models r/u --- log Pu" Multiplicative interaction models
~,, = a, + fl, + ~,8, (23)
where all parameters are unknown, have been pro- posed in the context of analysis of variance by Mandel [8,9] and in the context of discrete data by Goodman [5], Haberman [6] and Anderson [11.
The methods of Section 2 may be used for parameter estimation but the derivative matrix D for (23) is rank deficient at "t = 0 and at 8 = 0. Thus, if (22) is true, then $ and ~ would not satisfy (11). This leads to difficulties in testing the addi- tive model with (23) as alternative. For example, the likelihood ratio statistic has the same asymp- totic distribution as the largest root if a Wishart matrix and this is not chi-squared [6].
3. 6. Canonical regression
Suppose that the components of Y are vectors of length q so that #, -- E(Y,) may be regarded as a point in Euclidean q-space. The simplest canoni- cal regression model is
t,, = + ( , sTx , ) , , (24)
where e and ,80 are of length q, Ilell = 1 and ,8, x, are of length p. Model (24) implies that the effect of a change in the covariate from x = 0 to x~ is to move the expected value of Y from flo in the direction e by an a m o u n t flTx I. If e is known, (24) is a linear model. In applications, e would gener- ally be unknown so that (24) becomes non-linear. In the context of multivariate analysis where coy( Y, ) = o 2 V, a matrix of constants, e r Y, is known as the linear discriminant function and (24) states that there is a single non-zero canonical root to the determinantai equation
[Sr¢ s - XSrc~l = 0 (25)
where S,c s and S,~ are the regression and residual
290 P. McCullagh / Generalized linear models
sum of squares and products matrices respectively. If E(Y,) lie in a two-dimensional subspace of
R q, a model involving two canonical roots is re- quired, namely
#, = ~o + ( ~ x , )e, + ( ~2rxi )e 2
where Ilej[I = 1, e~e 2 = 0 and, by convention, e I is the vector associated with the largest root of (25).
In the case of multinomial or other non-normal responses we would usually replace the #, on the left of (24) with the vector of 'linear' predictors 7/, = { Tiu }, where, for example,
k
,~,, = e x p ( ~ , j ) / E exp(,1,,) r - - I
for multinomial responses that are unordered. The maximum likelihood analysis is discussed by Anderson [1]. In the case of ordered categories, we may take flu = log{ ~,,ff(1 -~,,j)} as in (21) or rl,j = log( - log(1 - ~'u)) so that ~i, is a vector of length k - 1. The proportional odds and proportional hazards models (McCullagh [10]) may be written
~, = flo + ( ~'rx, )l (26)
where 1 is a vector of l's. A natural generalization corresponding to canonical regression would be to write
11, = flo + ( flVx, )e, (27)
but the above model is no longer of the gener- alized linear type. Note also that since *l, is re- quired to lie in the ordered cone "Oa < rl,2 ~< • " " ~< rl,.k_ 1, so also must fl0 in (26) whereas fl ~ R P. In (27), however, the parameter space is considerably more complicated and the three sets of parameters fl0. fl, e are not variation independent.
4. Linearity
The theoretical development of Section 2 de- pends in no way on linearity but only on the covariance assumption (4), the adequacy of the regression model (5) and on additional mild regu- larity assumptions, the most important of which is that the derivative matrix D must have full rank in a neighbourhood of the true parameter value. What then is the role of linearity? Why is it that linearity is such a prominent feature in many applications
such as those discussed in Section 3? Three rea- sons, by no means equal in importance, are now given to justify this emphasis on linearity.
(i) Flexibility: Linearity is much less restrictive than the term might suggest. For example the linear model
7, = #o + # ,x , (28)
describes a straight line relationship between #i and x, if #, = % However, by varying the link function in (7) exponential and hyperbolic rela- tionships may be defined: for example
I o g ~ a = / ~ 0 + B ~ x , or ~aT~=/30+#~x, .
Furthermore, non-linear functions of x may be included in (28) and when these are combined with non-linear link functions the variety is con- siderably increased. For example
~';' = ,7, = Bo + f l ,x , + f l J x ,
defines a monotone function with a non-zero asymptote at ~a = flo i if B2 = 0 and an asymmetric function with turning points at x = +(f l2 / f l l ) w2 otherwise.
(ii) Interpretability: Simplicity of interpretation is particularly important where quantitative con- clusions together with measures of uncertainty are required to be presented in an easily understood way. More generally, by the principle of Occam's razor, there is no advantage in using a complex model where a simpler model will suffice. Linear models are well understood and effects that are additive on some scale are generally easy to quan- tify and understand. Furthermore, with the possi- ble exception of orthogonality, many of the ideas familiar in the theory of ordinary linear models carry over without change to generalized linear models. These ideas include factorial arrangement, the hierarchy of interactions and main effects, marginality, aliasing and confounding. Thus, pro- vided that the link transformation g( . ) makes sense physically, generalized linear models are no more difficult to understand than ordinary linear models.
(iii) Computational simplicity: In practice, com- putational simplicity is very important but it is viewed here as a welcome bonus entirely sub- sidiary to (ii) above.
P. McCullagh / Generalized linear models 291
5. Analysis of deviance
The deviance D( y; ti) measures, at least quali- tatively, the goodness of fit of a particular model with fitted values/i. As successively more complex models are fitted, the deviance decreases much like a residual sum of squares. In the limit, ~i = y the deviance reduces to zero. We now describe how the function D( y; #) may be constructed.
In the majority of problems of statistical inter- est, it is possible to construct a function l ( f l ) , known as a log-quasi-likelihood, having U(fl) as the vector of first partial derivatives. In such cases, but not otherwise, the least squares equations U(/~) = 0 can be cast as a maximization problem, max l(f l) , or as a minimization problem, rain D( y; #) subject to # = #(f l) . Often, but not always, I(f l) may be recognized as the log-likeli- hood for some exponential family of distributions, but, in fact, its use here is justified on the basis of second-moment assumptions only rather than full distributional assumptions. For our present purpo- ses it is convenient to express I(-) as a function of # rather than of ft. Thus 1"(#) = 1(~8) where # = #(iS). The deviance function may now be written as
D ( y ; #) = 2 1 * ( y ) - 21"(#)
provided that II*( Y)I < oe. In the process of maxi- mization o f / * ( # ) , implicit in the equations U(/~) =0, I* (y ) is a constant chosen to ensure that D( y; #) >I 0 with equality only if the fitted values coincide with the observed values.
In the important special case where V(/~) is a diagonal matrix, the log-quasi-likelihood exists and can be expressed as the sum of n uncorrelated components. A table of such functions, common in statistical applications is given by McCullagh and Neider [13,p. 170].
5.1. Choosing covariates
Suppose that we wish to test whether a particu- lar covariate, xp, say, has an effect on the mean response above and beyond the joint effect of the remaining variables x~ . . . . . xp_ 1. There are a num- ber of possible tests only two of which are consid- ered here. On the one hand we could consider the ratio T = flp(iPP)l/2//S where i pp is the ( p, p) ele-
ment of ( D T W D ) - i evaluated at ft. On the other hand we could base a test on the reduction in deviance, F = { D(Y; ~ o ) - D ( Y : ~t)/s 2, where / i 0 is the vector of fitted values under H o : tip = 0. In the case of the ordinary linear model, and ap- proximately otherwise, we have that F = T 2. Fur- thermore, for large n and under H o, T - tn_ p and F - Fl.,_p.
The usual variable selection procedures such as forward selection, backward elimination and so on, that are appropriate in the context of ordinary linear least squares, may now be used for gener- alized linear models. The only difference is that the selection criterion is based on reduction in deviance rather than reduction in residual sum of squares.
Of course it is important to bear in mind that covariates do not necessarily all have the same logical or even mathematical status. For example, qualitative variates or factors typically refer to a subspace of dimension k > 1 and the particular choice of basis vectors is, to a large extent, a matter of taste. Thus it would be unusual to ex- clude a particular basis vector while including the remainder. Furthermore, interactions involving several factors, or product terms involving quanti- tative variates should not normally be included without the corresponding main effects (Nelder [14]). Also, it is generally bad practice, in the principal statement of conclusions, to exclude from the model any main effects, whether statistically significant or not, unless these are very numerous and there is additional non-statistical evidence to support the claim that the excluded effects are indeed negligible. On the other hand, unless the evidence is fairly strong, interactions should not be included. If the evidence for interaction is strong it is usually better to re-formulate the model, for example by choosing a more appropriate link function, rather than simply to state that interac- tion is present. If the interaction persists, it is usually best to split the experiment on one of the offending factors, preferably a classification factor such as sex, age, medical history, blood group, soil type and so on, analyse each stratum separately and to state the conclusions appropriate to each stratum. Few automated selection procedures take any account of the above code of practice.
292 P, McCullash / Generalized hnear models
6. Computation
Any least squares regression program that in- clude weights and permits iteration can, in princi- ple, be adapted to fit all of the models discussed here. That is because the iterative scheme
D T W D ( [~I - ~o ) = DT w ( Y - ~o ) (29)
has the same form as weighted least squares equa- tions. Iteration is necessary because D, W and ~t need to be updated at each cycle. In the case of generalized linear models, the structure is even simpler because D --- W~ X where X, of order n × p is a matrix of constants (model matrix) and W~ is diagonal with elements d#,/dr/ , which depend on the link function. Furthermore W is diagonal so that at each iteration only the three vectors W, W~ and # need to be updated. In the case of special- purpose computer packages such as GLIM (Baker and Nelder [2]), the iterative scheme (29) is usually written in the more convenient form
DTWD/~t = D T w { D~o + r - ~o }
or, for generalized linear models,
x w'x/ t = xTw'{ 0 + w , - ' ( r -
where W* = W IWW 1, a diagonal matrix. Methods for solving these linear equations are outlined in [13]. For further references and a review of statisti- cal computing see Wood [22].
References
[1] J.A. Anderson, Regression and ordered categorical varia- bles (with discussion). J. Roy. Statist. Soc. See. B 46 (1984). to appear.
[21 R.J. Baker and J.A. Nelder, The GLIM System (Release 3) (Numerical Algorithms Group, Oxford, 1978).
[3] D.R. Cox. Regression models and life tables (with discus- sion), J. Roy. Statist. Soc. Set. B. 74 (1972) 187-220.
[41 D.R. Cox, Local ancillarity, Biometrika 67 (1980) 279-286. [5] L.A. Goodman, Association models and canonical corre-
lation in the analysis of cross-classified data having ordered categories, J. Amer. Statist. Assoc. 76 (1981) 320-334.
[6] S.J. Haberman, Tests for independence in two-way con- tingency tables based on canonical correlation and on linear-by-linear interaction, Ann. Statist. 9 (1981) 1178-1186.
[7] M.J.R. Healy, A source of assay heterogeneity, Biometrtcs 37 (1981) 834-835.
[8] J. Mandel, The analysis of Latin squares with a certain type of row-column interaction, Technometrics 1 (1959) 379-3987.
[9] J. Mandel, A new analysis of variance model for non-addi- tive data, Technometrics 13 (1971) 1-18.
{10] P. McCullagh, Regression models for ordinal data (with discussion). J. Roy. Statist. Soc. Set. B 49 (1980) 109-142.
[11] P. McCullagh, Quasi-likelihood functions, Ann. Statist. 11 (1983) 59-67.
[12] P. McCullagh, Local sufficiency, Biometrika 71 (1984), to appear.
[13] P. McCullagh and J.A. Nelder, Generalized Linear Models (Chapman and Hall, London, 1983).
[14] J.A. Nelder, A re-formulation of linear models (with dis- cussion), J. Roy. Statist. Soc. Set. A 140 (1977) 48-77.
[15] J.A. Nelder and R.W.M. Wedderburn, Generalized linear models, J. Roy. Statist. Soc. Set. ,4. 135 (1972) 370-38,1.
[16] C.R. Rao. Linear Statistical Inference and its Applications (Wiley. New York, 1973).
[17] H. Scheffe, Analysts of Variance (Wiley, New York, 1959). [18] S.R. Searle, Linear Models (Wiley. New York, 1971). [19] G.A.F. Seber, Linear Regression Analysis (Wiley, New
York, 1977). [20] R. Thompson and R.J. Baker, Composite link functions in
generalized linear models, Appl. Statist. 30 (1981) 125-131. [21] R.W.M. Wedderburn, Quasi-likelihood functions gener-
alized linear models and the Gauss-Newton method, Bio- metrtka 61 (197,1) 439-4,17.
{22] J.T. Wood, Statistical computing, European J. Operational Res. 9 (1982) 321-326.
[23] Y.M.M. Bishop, S.E. Fienberg and P.W. Holland, Discrete Multivariate Analvs~s: Theol. and Practwe (M.I.T. Press, Cambridge, MA, 1975).