Embed Size (px)
Citation preview
Generation CS: Computer Science Undergraduate Enrollments Surge Since 2006
GENERATION CS
For citation use: Computing Research Association (2017). Generation CS: Computer Science Undergraduate Enrollments
Surge Since 2006. http://cra.org/data/Generation-CS/
CRA Enrollment Committee (Institutional Subgroup)
◗ Tracy Camp, Chair, Colorado School of Mines
◗ W. Richards Adrion, University of Massachusetts Amherst
◗ Betsy Bizot, Computing Research Association
◗ Susan Davidson, University of Pennsylvania
◗ Mary Hall, University of Utah
◗ Susanne Hambrusch, Purdue University
◗ Ellen Walker, Hiram College
◗ Stuart Zweben, The Ohio State University
Computing Research Association
1828 L Street NW, Suite 800
Washington, DC 20036
www.cra.org

Across the United States and Canada, universities and colleges are facing a significant increase in enrollment in both undergraduate computer science (CS) courses and programs. The current enrollment surge has exceeded previous CS booms, and there is a general sense that the current growth in enrollment is substantially different than that of the mid-1980s and late 1990s. To investigate the current situation, the Computing Research Association (CRA) produced an enrollment survey to measure, assess, and better understand enrollment trends and their impact on computer science units, diversity, and more. Part of this effort included a survey of doctoral- and non-doctoral granting academic units in fall 2015. Generation CS: CS Enrollments Surge Since 2006 reports the survey results with respect to majors, nonmajors, diversity, impact on academic units, and units’ actions in response to the surge.
A. CRA Enrollment Committee: Institutional ImpactThe CRA Enrollment Committee was formed in 2015 to investigate increasing enrollments. This section describes the background and process of producing this report.
B. The Phenomenal Growth of CS Majors Since 2006The number of CS majors enrolled at North American doctoral institutions more than tripled from its low in 2006 through the most recent available data for 2015, and continued growth seems likely.
C. The Widespread Increase in Nonmajor EnrollmentIn addition to the growth in majors, more nonmajors are taking computing courses past the introductory level, and more students are minoring in CS. Analyses that look only at the number of CS majors understate the demands being placed on academic units.
D. The Mixed News on Diversity and the Enrollment SurgeThe computer science community learned several hard lessons about diversity in earlier booms, so there is concern that actions taken to manage increased enrollments today might have a side effect of reducing diversity. While more data is needed, there is some good news in terms of the number of women and underrepresented minorities enrolling in computing courses in aggregate; unfortunately not every unit that responded to the survey is experiencing this growth.
E. The Challenges of the Enrollment Surge for the UnitBoth doctoral and non-doctoral units have experienced stresses in available space, instructional resources, and faculty workload.
F. Units’ Response to Surging EnrollmentsUnits are using or are planning to use a wide range of approaches to manage enrollments, manage enrollment related resources, and reduce the demands on faculty while trying to meet the needs of both majors and nonmajors. Many doctoral- and non-doctoral granting units have increased class sizes and reduced some course offerings and faculty activities.
G. Appendix: IPEDS DataThe Integrated Postsecondary Education Data System (IPEDS) collects information on degrees awarded by detailed field from all U.S. postsecondary institutions. While IPEDS does not have enrollments by field, and degrees lag enrollments by several years, a review of the IPEDS data on computer science allows comparison of trends in the CRA Enrollment Survey responses to trends across all institutions.
H. Appendix: MethodologyThe Methodology section provides more detail on the data collection and analysis of the CRA Enrollment Survey.
I. Appendix: List of FiguresView a list of the figures published in the report. Data spreadsheets behind each of the figures in the report will be made available in the near future.
J. AcknowledgementsAcknowledgements to those who assisted with the survey, data, analysis, or report.

Generation CS: Computer Science Undergraduate Enrollments Surge Since 2006
A. CRA Enrollment Committee: Institutional Impact Across North America, universities and colleges are facing a significant increase in enrollment in both undergraduate
computer science (CS) courses and programs. The current enrollment surge has exceeded previous CS booms, and there
is a general sense that the current growth in enrollment is substantially different than that of the mid-1980s and late
1990s. For example, since the late 1990s, the U.S. Bureau of Labor data shows that the number of jobs where computing
skills are needed is on an upward slope, illustrating the increased reliance our society has on computing. We also
know how pervasive data has become in the science and engineering fields, which means all scientists and engineers
need more computational skills than ever before. It is, therefore, not surprising that the number of nonmajors taking
computer science classes is increasing, and that 78% of computer science units1 stated the number of minors in their
unit is increasing.
In early 2015, the Computing Research Association (CRA) created a committee to investigate several questions related to
increasing enrollments. The CRA Enrollment Committee set up two committees: an Institution Subgroup and a Student
Subgroup. The goal of the Institution Subgroup was to answer high-level questions such as “How are units handling the
current growth in computer science?” The goal of the student subgroup was to answer high-level questions such as “Why
are students so interested in computing?” This report addresses questions from the Institution Subgroup, questions that
concern computer science units, such as:
1. Are all units seeing a similar degree of growth?
2. Does the growth exist at all levels of the curriculum?
3. Are non-majors and minors having a significant impact on enrollment?
4. How is the current growth impacting diversity in our student population?
5. What are units doing to respond to the growth?
To answer these types of questions, the CRA Enrollment Committee’s Institution Subgroup created a CRA Enrollment Survey.
The CRA Enrollment Survey was administered in parallel with CRA’s annual Taulbee Survey of doctoral-granting units and
ACM’s annual NDC Study of non-doctoral granting units in computing. Responses were sought only from units that have
a computer science undergraduate degree program. The goal was to measure, assess, and better understand enrollment
trends and their impact on computer science units, diversity, and more.
We are grateful to the 134 doctoral-granting units and 93 non-doctoral granting units that responded to the CRA Enrollment
Survey, which produced a response rate of ~70% (for doctoral institutions via Taulbee) and ~13% (for non-doctoral institutions
via NDC). The data collected from the CRA Enrollment Survey is extremely rich, and allows us to consider a unit’s context
(e.g., size, public or private, etc.) and resources available when considering the impact from enrollment growth.
One section of the CRA Enrollment Survey asked responders to provide detailed demographic data on students enrolled in
four representative CS courses: an intro-level course that is mainly for non-majors, an intro-level course that is mainly for
1 We use the term “academic unit” or “unit” to denote the administrative division responsible for the CS bachelor’s program. Often, but not always, this is an academic department.

GENERATION CS
A-2
CS majors, a mid-level course, and an upper-level course. Data was requested on these four representative courses across
three different time periods (2005, 2010, and 2015). While annual data on degrees awarded and enrollment in majors is
available from other sources, we are unaware of any other data regarding student demographics in specific courses over
the period of the aforementioned decade (2005-2015). The CRA Taulbee survey has added questions to its survey in order to
continue collecting this type of data.
The enrollment growth in the mid-1980s is sometimes referred to as the “PC boom” and the enrollment growth in the late
1990s is sometimes referred to as the “dot-com boom.” CRA Snowbird Conference attendees suggest that we are currently
in “Generation CS,” where CS enrollment across the nation is surging due to the pervasiveness of computing in today’s
society. Computing plays a significant role in daily life, and students with interests in a variety of fields are beginning to
understand that training in computer science is vital.
This report consists of six sections and three appendices in which we present and analyze the data collected from the
CRA Enrollment Survey. Section B considers the phenomenal growth of computer science majors in North America since
2006 (e.g., the number of CS majors enrolled at North American doctoral2-granting units has more than tripled since
2006); furthermore, the data indicates that this continued growth is likely. Section C considers the phenomenal growth
of nonmajors taking computer science courses and discusses the data that units reported on the increase in computer
science minors.
We discuss diversity in Section D. Many members of the computer science community are very concerned about the impact
of the current student enrollment surge on diversity, as we learned several hard lessons regarding diversity in previous
enrollment booms. While more data is needed, there appears to be some good news regarding both the numbers and
percentages of women and underrepresented minority students involved in computer science as majors and as students in
CS courses; unfortunately this good news does not exist for all units that responded to the survey.
In Sections E and F, we consider the impact of the current enrollment surge on the unit (e.g., challenges with space and
instructional staff), as well as how units are responding to the current surge (e.g., increasing section sizes or number
of sections taught). Lastly, this report includes three noteworthy appendices. Section G considers degree completions
in computer science from the Integrated Postsecondary Education Data System (IPEDS) data. This section helps advance
our understanding of the data collected in the CRA Enrollment Survey, and provides more information about the current
surge in computer science at non-doctoral granting units (where data from the CRA survey is limited). Section H
discusses the survey’s methodology, and Section I provides access to all figures individually as well as the data that
comprises the figures in this report. Finally, Section J acknowledges everyone who has assisted with the survey, data,
analysis, or report.
Please contact any member of the CRA Enrollment Committee’s Institution Subgroup with questions about the report. The
committee members are:
◗ Tracy Camp, Chair, Colorado School of Mines ([email protected])
◗ W. Richards Adrion, University of Massachusetts Amherst ([email protected])
◗ Betsy Bizot, Computing Research Association ([email protected])
◗ Susan Davidson, University of Pennsylvania ([email protected])
◗ Mary Hall, University of Utah ([email protected])
◗ Susanne Hambrusch, Purdue University ([email protected])
2 Our report mainly focuses on doctoral-granting units, as more data is available on doctoral-granting units than non-doctoral granting units. We strongly encourage non-doctoral granting units to complete the annual ACM NDC!

A. CRA ENROLLMENT COMMITTEE: INSTITUTIONAL IMPACT
A-3
◗ Ellen Walker, Hiram College ([email protected])
◗ Stuart Zweben, The Ohio State University ([email protected])
We also encourage those interested in more details and analysis about the current enrollment surge in computer science
to obtain an upcoming report from the National Academies of Sciences, Engineering, and Medicine’s ad hoc Committee on
Growth of Computer Science Undergraduate Enrollments. The report is expected to be published later this year.

B. THE PHENOMENAL GROWTH OF CS MAJORS SINCE 2006
B-1
Generation CS: Computer Science Undergraduate Enrollments Surge Since 2006
B. The Phenomenal Growth of CS Majors Since 2006The average number of undergraduate CS majors is larger today than at any time previously, and greatly exceeds the peak
enrollment of the dotcom boom period. For example, the average number of CS majors at doctoral granting academic units1
has more than tripled since 2006 and more than doubled since 2011. (Source: CRA Taulbee Survey)
Academic units are taking a range of actions to handle the increased enrollment and the demand on resources. Without
question, the demands are putting an enormous stress on academic units and their faculty. Institutions will need to
respond with actions that recognize the reasons for the increased student interest, from both majors and nonmajors, and
the role computing plays in a wide range of disciplines and jobs.
This document provides details on the magnitude of the growth of CS majors since 2006. We provide data on the growth
of the number of majors as well as the cumulative growth of majors, compare the cumulative growth of majors with the
growth in tenure-track and teaching faculty, and illustrate the enrollment increase for courses at three different levels of
the curriculum. Most of this document focuses on doctoral granting units, for which more abundant data is available. Data
on non-doctoral granting units is included when available.
Enrollment Growth in Numbers and Percentages
0!100!200!300!400!500!600!700!800!
2006!
2007!
2008!
2009!
2010!
2011!
2012!
2013!
2014!
2015!
Avg CS majors per unit!Avg per unit at dotcom peak!
Source: CRA Taulbee Survey!!
Figure B.1: Average number of CS majors per unit since 2006.
1 We use the term “academic unit” or “unit” to denote the administrative division responsible for the CS bachelor’s program. Often, but not always, this is an academic department.

GENERATION CS
B-2
2 The years shown in the figures indicate the start of an academic year. For example, 2006 denotes academic year 2006-07. Enrollment for academic year 2015-16 is estimated from the 2015 CRA Taulbee Survey.
The current growth period began a decade ago. Figure B.1 shows how the average undergraduate enrollment has grown
each year during this period2. While this growth is impressive, it is natural to ask just how pervasive enrollment increases
have been. To better illustrate this, we first show enrollments when partitioning academic units by tenure-track faculty
size (as done by the CRA Taulbee Survey). Figure B.2 shows the average number of CS majors in “small” and “large” units,
where “large” is defined as units having at least 25 tenure-track faculty. In 2015-16, 70 large and 75 small units completed
the survey. All experienced significant enrollment increases, with large units having roughly twice as many majors as small
units. In percentages, however, the increases are very similar.. We also examined the growth at public versus private
institutions and found the increase in enrollment similar at both types of institutions.
Reporting means on enrollments could allow a few units to excessively skew the overall growth patterns. Figure B.3
shows the cumulative percentage of units experiencing different levels of increase from 2009-2014. Only 18% of the units
experienced growth under 50% and only 37% experienced growth under 100%. To express differently, over 60% of the
units more than doubled their enrollment since 2009.
0!100!200!300!400!500!600!700!800!900!
1000!1100!
2006! 2007! 2008! 2009! 2010! 2011! 2012! 2013! 2014! 2015!
Large (ten trk >= 25)!Small (ten trk < 25)!
Source: CRA Taulbee Survey!
+3%! +8%! +18%! +27%!+42%!
+73%!
+110%!+144%!
+5%! +12%! +8%! +20%! +26%!+68%!
+116%!+179%!
+216%!
+185%!
Figure B.2: Average enrollment by CS majors at large and small academic units (based on number of tenure track faculty). The percentages denote cumulative changes since 2006.
2%!
18%!
37%!
58%!70%!
77%! 82%! 84%! 87%! 91%! 93%!
<0%! <50%! <100%! <150%! <200%! <250%! <300%! <350%! <400%! <450%! <500%!Percent increase in majors!
Source: CRA Taulbee Survey!
Figure B.3: Cumulative percent of units with the indicated level of growth in CS majors from 2009 to 2014.

B. THE PHENOMENAL GROWTH OF CS MAJORS SINCE 2006
B-3
Teaching Capacity
The increase in the number of tenure-track faculty and teaching faculty in no way matches the growth in the number of
undergraduate CS majors, as is illustrated in Figure B.4. As a result, faculty are teaching larger classes and more classes
are taught by visitors, adjuncts, postdocs, and graduate students. Many units are trying to hire teaching faculty (e.g.,
professors of practice or lecturers) [F. Units Response]. While the growth in teaching faculty since 2006 is over 50%, the
average number of teaching faculty an academic unit had in 2015 was only six. By comparison, the average number of
tenure-track faculty in 2015 was 28.
The impact of the teaching demands is reflected in the responses units provided in the CRA Enrollment Survey. Actions
units have taken or plan to take are described in [F. Units’ Response].
-50!0!
50!100!150!200!250!300!350!
2006!
2007!
2008!
2009!
2010!
2011!
2012!
2013!
2014!
2015!
Cum change in UG majors per unit!
Cum change in TT fac per unit!
Cum change in teaching fac per unit!
Source: CRA Taulbee Survey!
Figure B.4: Cumulative percent growth of CS majors and instructional faculty since 2006.

GENERATION CS
B-4
Enrollment in CS Courses Across the Curriculum
Course enrollment increases are being experienced in all stages of the curriculum. Increases are not only due to the
increase in the number of CS majors, but also due to a significant increase in the number of nonmajors enrolled in CS
courses. Nonmajor enrollment is discussed in [C. Nonmajors Impact].
Figure B.5 illustrates growth of CS majors in representative courses at the introductory, mid-level, and upper-level, at five-
year intervals beginning 2005. (See [A. CRA Committee] and [H. Methodology] for details on the course data collected.) The
number of units from which such data was obtained is given in parenthesis next to the course name on the horizontal axis.
Non-doctoral Granting Academic Units
Data on non-doctoral granting units is included when available. As a result, we cannot produce analogs to Figures B.1-B.4
for non-doctoral granting academic units. Data collected by the CRA Enrollment Survey suggest that non-doctoral granting
units have seen significant increases in the introductory level courses and that increases in mid- and upper-level courses
have been smaller. This is illustrated in Figure B.6, which shows enrollment by course level for non-doctoral granting units.
A number of interesting questions regarding non-doctoral granting units deserve attention in the future. For example, our
community needs a better understanding of whether the surge in CS majors at non-doctoral granting units lags behind
the the surge in CS majors at doctoral granting units; whether non-doctoral granting units have had the resources to allow
enrollment increases in the recent past; and whether there is less student interest in CS at non-doctoral granting units. The
limited data from non-doctoral granting units does not provide enough insight on enrollment changes in these units. To fully
understand the situation at the diverse set of non-doctoral granting units, further study is needed.
0!
20!
40!
60!
80!
100!
120!
Intro Majors (47)! Mid-Level (45)! Upper-Level (44)!
2005!
2005!
2010!
2010!
2015!
2015!
+45%
+161%!
+20%
+154%
+43%!
+181%!
Source: CRA Enrollment Survey!
2005!
2010!
2015!
Figure B.5: Average enrollment by CS majors in computing courses at doctoral-granting units from 2005 to 2015. The number in parentheses in each category indicates sample size.

B. THE PHENOMENAL GROWTH OF CS MAJORS SINCE 2006
B-5
A comparison of the differential growth in doctoral granting and non-doctoral granting units can be approximated using
graduation data, for which much more comprehensive data is available from IPEDS. Such a comparison can be found in
[H. IPEDS Data]. That section shows the annual increases in CS degree production are lower at non-doctoral granting
institutions than at doctoral granting institutions, consistent with the limited enrollment data available from the CRA
Enrollment Survey. We note, however, that CS degree production at non-doctoral granting institutions increased by
approximately 50% during the period 2009-2015 (Source: IPEDS), and Figure B.6 seems to indicate that this growth in CS
degree production at non-doctoral granting institutions will continue to increase in the near future. As a comparison, the
degree production at doctoral-granting institutions almost doubled during the same period (2009-2015) (Source: IPEDS)
0!
5!
10!
15!
20!
25!
Intro Majors (19)! Mid-Level (21)! Upper-Level (22)!
2005!
2005!
2005!
2010!
2010!
2010!
2015!
2015!
2015!
+48%!
+115%!
+19%!
+129%!
+1%!
+75%!
Source: CRA Enrollment Survey!
Figure B.6: Average enrollment by CS majors in computing courses at non-doctoral granting units from 2005 to 2015. The number in parentheses in each category indicates sample size.

GENERATION CS
B-6
Summary
The current surge of CS majors is pervasive. Large and small academic units, in public and private institutions, have
been affected similarly. Doctoral granting and non-doctoral granting units are affected, though doctoral granting units to
date have seen larger increases. While academic units are taking a range of actions to handle the increased enrollment,
percentage increases in tenure-track faculty are about 1/10-th of the increase in the number of majors. As illustrated in
other sections, this discrepancy has impacted the operation of programs. Many units face increased faculty retention
problems, are not able to hire teaching faculty into newly created teaching positions, and realize that there are not enough
new PhDs to fill open faculty slots in the targeted areas.
The fundamental role computing plays in society and in preparing students of all majors for a competitive workforce
suggests that course demand will remain high. Units need to work within their institution to develop a sustainable model
for meeting the need, maintaining the quality of instruction, and fulfilling their role in educating for the 21st century.

C. THE WIDESPREAD INCREASE IN NONMAJOR ENROLLMENT
C-1
Generation CS: Computer Science Undergraduate Enrollments Surge Since 2006
C. The Widespread Increase in Nonmajor EnrollmentIn addition to a phenomenal increase in computer science majors [B. Growth of CS Majors], there is a large increase in
the number of nonmajors taking computing courses. Increases in the number of nonmajors are occurring throughout the
curriculum (i.e., at the introductory course level, in mid-level courses, and in upper-level courses). Any analysis that only
considers the growth of computer science majors therefore underrepresents the increased demand that units1 are trying to
meet. In order to fully understand the demand that exists, we need to also consider the large increase of nonmajors taking
computing courses.
An overview of the nonmajor growth in computing courses, based on survey course-level data collected, can be found in
Figure C.1 (see [A. CRA Committee] and [H. Methodology] for details on the course data collected). Between 2005 and 2015,
in representative courses primarily intended for majors, the number of nonmajors in computing courses increased at a
rate equal to or greater than the increase in majors. For the intro majors course, majors increased by 152% and nonmajors
by 177%; for the mid-level course, majors increased by 152% and nonmajors by 251%; and for the upper-level course, majors
increased by 165% and nonmajors by 143%. This data is from both the doctoral- and non-doctoral granting units that
responded to the CRA Enrollment Survey.
0!
2000!
4000!
6000!
8000!
10000!
12000!
14000!
16000!
18000!
Intro Nonmajors (51)! Intro Majors (66)! Mid-Level (66)! Upper-Level (66)!
Source: CRA Enrollment Survey
Nonmajors!Majors!
2005!
2010!
2015!
2005!
2010!
2015
2005!
2010!
2015!
2005!
2010!
2015!
Figure C.1: Cumulative nonmajor enrollment (red) and major enrollment (blue) in computing courses at doctoral- and non-doctoral granting units from 2005 to 2015. The number in parentheses in each category indicates sample size.
1 We use the term “academic unit” or “unit” to denote the administrative division responsible for the CS bachelor’s program. Often, but not always, this is an academic department.

GENERATION CS
C-2
In the following, we consider these increases separately for doctoral and non-doctoral granting units. Specifically, Figure
C.2(a) summarizes the mean enrollments in each course category for doctoral-granting units, and Figure C.2(b) summarizes
the mean enrollments in each course category for non-doctoral granting units.
0!
50!
100!
150!
200!
250!
Intro Nonmajors (38)! Intro Majors (47)! Mid-Level (45)! Upper-Level (44)!
2005!
2005!
2005!
2010!
2010!
2010!
2015!
2015!
2015!
+35%!
+184%!
+60%!
+265%!
+19%!+146%!
Source: CRA Enrollment Survey!
2015!
2010!
2005!
+55%!
+21%!
(a) Doctoral-Granting Units
0!
20!
40!
60!
80!
100!
120!
Intro Nonmajors (13)! Intro Majors (19)! Mid-Level (21)! Upper-Level (22)!
2005!
2005!
2005!
2010!
2010!
2010!
2015!
2015!
2015!
+39%!+11%! +133%! +33%! +102%
2010!
2015!
+20%! +25%!
+92%!
Source: CRA Enrollment Survey!
2005!
Figure C.2: Average enrollment by nonmajors in computing courses at doctoral- and non-doctoral granting units from 2005 to 2015. The number in parentheses in each category indicates sample size.
(b) Non-Doctoral Granting Units

C. THE WIDESPREAD INCREASE IN NONMAJOR ENROLLMENT
C-3
Introductory Courses
As discussed in [A. CRA Committee], data was collected from institutions for two types of introductory courses: an intro-
level course mainly for nonmajors and an intro-level course mainly for majors. At doctoral-granting units, mean enrollment
by nonmajors in the representative intro-level course for nonmajors had an increase of 55% from 2005 to 2015 (38
respondents). Enrollment by nonmajors in the representative intro-level course for majors had a much larger increase of
184% (47 respondents).
Non-doctoral granting units have also seen growth (from 2005 to 2015) in the number of nonmajors taking both types of
introductory courses; the growth, however, is somewhat less dramatic than the growth seen at doctoral-granting units: a
25% increase in the intro-level course for nonmajors (13 respondents) and a 92% increase in the intro-level course for majors
(19 respondents). We note, however, that the sample size is small, especially when one considers the large number of non-
doctoral granting units that exist; in other words, as mentioned in [B. Growth of CS Majors], more study of non-doctoral
granting units is needed to fully understand the situation at the diverse set of non-doctoral granting units.
Mid-Upper Level Courses
The growth in mid-level and upper-level courses from 2005 to 2015 due to nonmajors was also phenomenal at doctoral-
granting units. Specifically, the number of nonmajors in mid-level courses grew by 265% (45 respondents) and the number of
nonmajors in upper-level courses grew by 146% (44 respondents).
The growth in the number of nonmajors in mid-level and upper-level courses from 2005 and 2015 at non-doctoral granting
units was also quite dramatic. Specifically, the number of nonmajors in mid-level courses grew by 133% (21 respondents)
and the number of nonmajors in upper-level courses grew by 102% (22 respondents). While it is clear that there is an
upward trend in the number of nonmajors in mid-level and upper-level courses at non-doctoral granting units, we note
that the mean numbers of students in both of these courses is extremely small. In other words, this data should be
interpreted cautiously.
Other Enrollment Observations
An important category of nonmajors is minors. Unfortunately, understanding course enrollment changes due to minors
is difficult for units to track. Thus, the CRA Enrollment Survey asked for qualitative impact from minors. Of the doctoral-
granting units surveyed, none said the number of minors has decreased in recent years, 22% said the number of minors is
unchanged, 50% said the number of minors has increased, and 28% said the number of minors has increased significantly.
We compared the reported change in the number of minors to the unit’s perception regarding the overall impact on CS
enrollment increases. We found that units with a greater increase in minors also reported a greater overall impact. In fact,
the impact was rated at the highest level (Having big impact with significant challenges to unit) by 46% of the units that
stated the number of minors is unchanged, 76% of the units that stated the number of minors has increased, and 96% of
the units that stated the number of minors has significantly increased..
It is important to remember that our data about course enrollment is only a sample (i.e., four representative courses from
those units who responded). Furthermore, 45% of the doctoral-granting units stated that they restrict their upper-level
courses to only majors and minors and, therefore, the data provided in this section may under-represent the actual demand
by nonmajors.
Finally, the number of nonmajors in the 2015 data may be slightly inflated, especially in the introductory and mid-level
courses. That is, some of the reported nonmajors may later become computer science majors. Nonetheless, it is clear from
the data that nonmajors represent a significant aspect of the current surge in CS enrollments.

GENERATION CS
C-4
Summary
Increases in the number of nonmajors are occurring in courses at all levels: intro-level, mid-level, and upper-level. It appears
the impact from nonmajors is greater at doctoral-granting units than non-doctoral granting units. However, our data
indicates that non-doctoral granting units are also seeing significant increases in enrollments from nonmajors. Students
pursuing a minor in computer science (who are counted as nonmajors) are an important category of nonmajors.
Units must develop strategies for managing the increased demand by nonmajors, and minors in particular, within the
context of their institutions. These strategies should include increasing the unit’s understanding regarding both the
motivations and needs of nonmajors for enrolling in computing courses. Some of the enrollment demand is driven by the
growth of other types of degrees with significant computational components (e.g. “X+CS” degrees that include course
requirements from computer science and another discipline X). Thus, units should work across their institution to develop
institutional strategies and support for handling the significant enrollment demand from nonmajors.

D. THE MIXED NEWS ON DIVERSITY AND THE ENROLLMENT SURGE
D-1
Generation CS: Computer Science Undergraduate Enrollments Surge Since 2006
D. The Mixed News on Diversity and the Enrollment SurgeA positive consequence of the current enrollment surge is a significant increase in the number of women and
underrepresented minority (URM) students in computer science, both in courses and as majors. In addition, there is also
some good news in regard to the percentage of women and URM students in aggregate; the good news, however, is not
universal across all units1 surveyed.
This section examines the impact of the enrollment surge on diversity, using both existing data sets (i.e., the CRA Taulbee
Survey and IPEDS) and data collected from the CRA Enrollment Survey. We also highlight relationships discovered between
actions to manage the surge and their impact on diversity.
The survey asked units for women and URM student enrollment data, and the data is examined later in this section. The
survey also asked each unit’s perception about trends in the recruitment and retention of students from underrepresented
groups. Approximately 50% of the units perceive the percentage of women in their unit is increasing. While this perception
exists in both doctoral- and non-doctoral granting units, doctoral-granting units were more likely to state the percentage of
females in their unit is increasing significantly. We understand that perception may not reflect reality but, in this case, hard
data on the percentage of women enrolled in the introductory course for majors is consistent with the unit’s self-reported
change in the ratio of women entering the major. Specifically, the proportion of women in the intro majors course at
doctoral-granting units increased by an average of 0.4 percentage points from 2010 to 2015 for units that self-reported the
proportion of women was level or declining (n=18), by 5.1 percentage points for units reporting the proportion of women as
increasing (n=14), and by 7.3 percentage points for units reporting the proportion of women as significantly increasing (n=8).
Furthermore, the enrollment data results discussed in this section show that the median percentage of female students in
the courses surveyed has increased overall at both doctoral- and non-doctoral granting units. While some may consider the
percentage increase to be significant, others would likely note that we are still a long way from gender parity.
Approximately 50% of doctoral- and 30% of non-doctoral granting units perceive the percentage of URMs in their unit is level,
while approximately 20% of doctoral- and 40% of non-doctoral granting units perceive the percentage of URMs in their unit
is increasing. The results presented in the rest of this section show that the median percentage of URM students in our
four representative courses not at minority-serving institutions is increasing. However, the percentage increase for URM
students is larger in the intro course for non-majors than the intro course for majors at doctoral-granting units.
While there is some good news here, the data does suggest a shrinking pipeline may exist for both female and URM
students (i.e., in the course data provided, the representation of these students decreased from the intro through mid-
level through upper-level courses). Also, as mentioned previously, not all units are seeing an increase in the percentage of
women and URM students participating in computer science. In short, much work remains to meet our community’s goals
for diversity.
1 We use the term “academic unit” or “unit” to denote the administrative division responsible for the CS bachelor’s program. Often, but not always, this is an academic department.

GENERATION CS
D-2
Diversity Statistics From the Taulbee and IPEDS Data
To provide context for the CRA Enrollment Survey data, we will first look at diversity statistics from the CRA Taulbee Survey
and IPEDS data for the period of 2006-2015. Taulbee graduation rates for doctoral-granting units show that female students
comprised 14% of the computer science bachelor’s degrees in 2006. This percentage declined over subsequent years until it
reached a low point of just above 11% in 2009. Since 2009, we have seen a slow but steady increase, with female students
earning 16% of the 2015 computer science bachelor’s degrees awarded. The IPEDS statistics for women [G. IPEDS Data],
which provides completion data for both doctoral-granting and non-doctoral granting units, shows a similar trend. According
to IPEDS data for doctoral-granting units, women comprised 13.6% of 2006 computer science bachelor’s degree graduates,
11.3% of 2008 graduates (the low point), and 15.3% of 2015 graduates. For non-doctoral granting units, the percentage of
women has been higher overall, with 20.5% of computer science bachelor’s degrees being awarded to women in 2006,
declining to 15.5% by 2011 (the low point), and rising slightly to 16.6% in 2015.
For URMs, we consider Blacks/African Americans, Hispanics/Latinos, and other underrepresented groups (American Indians
or Alaska Natives plus, after 2007, Native Hawaiians or Other Pacific Islanders). The omission of the Asian and Multiracial
(“Two or more Races”) categories is designed to avoid considering groups that are not underrepresented in computing.
We first examine the Taulbee Survey data for doctoral-granting units. In 2006, URM students comprised 9% of the CS
graduating students at doctoral-granting units. We saw the percentage of URM students earning bachelor’s degrees in
CS increase to 12% in 2008, which coincided with the shift to new categories for race and ethnicity, a decrease to 9% in
2010 (the low point), and a subsequent gradual increase to 11% in 2015. IPEDS statistics for doctoral-granting units are a
bit different from the Taulbee data, likely because of the difference in the definition of doctoral-granting2, but the general
trend shows 11-12% of computer science bachelor’s degrees were awarded to URMs from 2006-2011; in 2015, URM students
comprised 13% of the computer science bachelor’s degree graduates at doctoral-granting units. In non-doctoral granting
units, IPEDS data shows a higher percentage of URM students, with almost 20% in 2006, but remaining close to 18% for
most of the 2007-2105 period. A decline in Black/African American completions was offset by an increase in Hispanic/
Latino completions.
The Impact of the Enrollment Surge on the Representation of Women
The CRA Enrollment Survey shows that the percentage of women has grown in all three of the CS major courses surveyed
from 2005 to 2015 for both doctoral-granting and non-doctoral granting units (Figure D.1). For doctoral-granting units, most of
this growth occurred between 2010 and 2015; for non-doctoral granting units, this growth occurred between 2010 and 2015
in only the mid- and upper-level courses. Doctoral-granting units also showed consistent growth from 2005 to 2015 for their
nonmajor intro course. Unfortunately, there is not sufficient data on the nonmajor intro course for non-doctoral granting
units. That is, only 20-22 non-doctoral granting units of the ~700 provided course diversity data in the CRA Enrollment Survey
for each of the 2005, 2010, and 2015 periods surveyed, and only 11 of these units provided diversity data for a separate
nonmajor intro course.
For the non-doctoral granting units that provided course enrollment data, the median percentage of women was slightly
higher than in doctoral-granting units. We also note that the median percentage of women at doctoral-granting units in
the upper-level course in 2015 (17%) (Figure D.1(a)) is close to the Taulbee percentage of women who graduated in 2015 (16%).
For non-doctoral granting units, our course enrollment data at the mid- and upper-level shows a larger increase in the
percentage of women from 2010 to 2015 than IPEDS data [G. IPEDS Data], which could be due to either our small sample size
or a recent pipeline increase that has yet to be realized as CS degrees.
2 Taulbee and NDC survey data define doctoral- and non-doctoral granting units by whether the unit grants doctorates specifically in computing. IPEDS doctoral-granting units are institutions who grant at least 20 research/scholarship doctorates in any field (not including professional practice doctoral-level degrees such as JD and MD), following the Carnegie Classification of Institutions of Higher Education.

D. THE MIXED NEWS ON DIVERSITY AND THE ENROLLMENT SURGE
D-3
From Figure D.1, the largest percentage of women in doctoral-granting units can be found in the nonmajor intro course
followed by the major intro course. Since percentages drop in the mid-level and upper-level courses, there may be an issue
of retaining women into higher-level courses. While a similar trend exists in the non-doctoral granting units, we stress that
this question regarding retention requires further study. For example, one possible explanation could be that the apparent
decrease is simply a byproduct of growth. That is, students in upper-level classes entered the program at a time when
the percentage of women was lower. Furthermore, the data seems to validate this explanation. That is, the percentage
of women in the upper-level course in 2015 is between the percentage of women in the 2010 and 2015 mid-level courses.
Another hypothesis is that the larger percentages in the lower-level courses reflect an increase in female nonmajors in
those courses. Of course, if the trend reflects a leaky pipeline, where women are dropping out at a higher rate than men as
they advance, a concern about female student retention is valid.
0!5!
10!15!20!25!30!35!40!
Intro Nonmajors (36)! Intro Majors (40)! Mid-Level (40)! Upper-Level (39)!
2010!
2015!
2015!
2010!
2005!
2005!
2010!
2015!
2005!
2010!
2015!
Source: CRA Enrollment Survey!
+24%
+47%
+4%
+35%
+16%
+68%
-‐8%
+65%
2005!
0!5!
10!15!20!25!30!35!
Intro Majors (20)! Mid-Level (22)! Upper-Level (21)!
2005!
2010!
2015!
2005!
2010!
2015!
2005!
2010!
2015!
+30%! +25%!
+4%!
+63%!
+38%!
Source: CRA Enrollment Survey!
+108%!
Figure D.1: Median percentage of female students in the courses surveyed.
(b) Non-Doctoral Granting Units
(a) Doctoral-Granting Units

GENERATION CS
D-4
For doctoral-granting units, data also revealed more rapid growth in the percentage of women in private schools, as
compared to public schools, in all four courses surveyed, as shown in Figure D.2. For example, consider the nonmajor intro
course and the mid-level course. In both cases, public and private schools had similar percentages of women in 2005 and
very different percentages of women in 2015. The 2015 IPEDS data corroborates this observation [G. IPEDS Data] (e.g., the
percentage of female degree earners was 14% for public schools and 20% for private schools in 2015). A study of what
private schools have been doing, or not doing, compared to public schools could be useful to increasing the number of
women in CS.
While Figures D.1 and D.2 show the change in the median percentage of women across units, Figure D.3 shows how much
women’s representation in the chosen upper-level course varies by unit. Across units, the percentage of women enrolled in
the upper-level course ranged from a low of 0-2% (5 units in 2010, but none in 2015) to a high of 42-44% (one unit in 2015). In
short, there is substantial variation across departments, but the distribution, as a whole, shifted up between 2010 and 2015.
Figure D.2: Median percentage of female students in the courses surveyed in doctoral-granting units: public vs. private. Number in parentheses in each category indicates sample size.
Intro Nonmajors!(36)!
Intro Majors!(40) !
Mid-Level !(40)!
Upper-Level!(39)!
0!
10!
20!
30!
40!
50!
2005! 2010! 2015! 2005! 2010! 2015! 2005! 2010! 2015! 2005! 2010! 2015!
Median %F Private!
Median %F Public!
Source: !CRA Enrollment !Survey!

D. THE MIXED NEWS ON DIVERSITY AND THE ENROLLMENT SURGE
D-5
8! 6! 4! 2! 0! 2! 4! 6! 8! 10!
2!4!6!8!
10!12!14!16!18!20!22!24!26!28!30!32!34!36!38!40!42!44!
2010! 2015! Source: CRA Enrollment Survey!
The Impact of the Enrollment Surge on the Representation of Underrepresented Minorities
The number of URM students has also shown remarkable growth since 2005, mostly between 2010 and 2015. As shown
in Figure D.4, the total number of minority students reported in the course enrollment data of doctoral-granting units has
grown from 708 to 808 to 1620 in the intro required course (33 units), from 299 to 443 to 992 in the mid-level course (33
units), and from 208 to 322 to 606 in the upper-level course (32 units). While this growth in the number of URM students is
occurring at all units, we note that a significant number of URM students are added by the four minority-serving institutions
(MSIs) in our sample. Because these MSIs have a very different profile of students, they could bias our data and are thus
removed from the following analysis of percentages and correlations.
Figure D.3: Number of doctoral-granting units with indicated percentage of women in representative upper-level courses in 2010 and 2015.

GENERATION CS
D-6
Figure D.5 shows the median percentage of URM students for each course, for both doctoral-granting and non-doctoral
granting units (not including MSIs). While the percentage of URM students does not show the consistently increasing trend
seen in the percentage of women students (see Figure D.1), we note the percentage of URM students has increased when
comparing 2005 to 2015 data for both doctoral- and non-doctoral granting units, which is consistent with the Taulbee and
IPEDS data on degrees awarded. While our enrollment data does not consider different URM populations, the IPEDS data
appears to show a decline in Black/African American students which is offset by a rise in Hispanic/Latino students.
Although the percentage of URM students appears to be growing, we note that the percentages are still extremely small
(e.g., only 9% URM students in the 2015 upper-level course data for doctoral-granting units). In fact, in 2005, the median
percentage of URM students reported by non-doctoral granting units for the upper-level course was 0. Clearly, there is much
room for growth among the URM student population, especially when one considers that 34% of college students are URM
in the United States3. Similar to the trends we see in the course enrollment data for women, we typically see a decrease
in the URM student representation from the intro through mid-level through upper-level courses. As previously mentioned,
further study is needed to determine whether a leaky pipeline exists.
0!
200!
400!
600!
800!
1000!
1200!
1400!
1600!
1800!
Intro Nonmajors! Intro Majors! Mid-Level! Upper-Level!
Source: CRA Enrollment Survey
MSI (N=4)!Non-MSI (N=29)!
2005!
2010!
2015!
2005!
2010!
2015!
2005!
2010!
2005!
2005!
2010!
2015!
Figure D.4: Number of URM students in four representative courses in doctoral-granting units.
3 National Science Foundation, National Center for Science and Engineering Statistics, TABLE 2-1: Undergraduate enrollment at all institutions, by citizenship, ethnicity, race, sex, and enrollment status: 2004–14. Retrieved from: https://www.nsf.gov/statistics/2017/nsf17310/data.cfm. [Feb. 23, 2017]

D. THE MIXED NEWS ON DIVERSITY AND THE ENROLLMENT SURGE
D-7
The Relationships Between Unit Actions and Diversity Growth
The CRA Enrollment Survey included several questions about the actions that units were taking in response to the surge. In
this section, we highlight a few statistically significant correlations that relate growth in female and URM students to unit
responses (actually, a composite4 of several different responses).
1. Units that explicitly chose actions to assist with diversity goals have a higher percentage of female and URM students. We observed significant positive correlations between units that chose actions to assist with diversity goals
and the percentage of female majors in the unit for doctoral-granting units (per Taulbee 2015, r=.19, n=113, p<.05), and with
the percent of women in the intro majors course at non-doctoral granting units (r=.43, n=22, p<.05). A similar correlation was
found for URM students. Non-MSI doctoral-granting units showed a statistically significant correlation between units that
chose actions to assist with diversity goals and the increase in the percentage of URM students from 2010 to 2015 in the
intro for majors course (r=.47, n=36, p<.001) and mid-level course (r=.37, n=38, p<.05). Of course, units choosing actions to assist
with diversity goals are probably making many other decisions with diversity goals in mind. Improved diversity does not
come from a single action but from a series of them.
0!2!4!6!8!
10!12!14!16!18!
Intro Nonmajors (29)! Intro Majors (29)! Mid-Level (29)! Upper-Level (28)!
2005
2010
2015
2005
2015
2005
2010
2015
2010
2015
2005
Source: CRA Enrollment Survey
-‐10%
+43%
-‐18%
+9%
+31%
+75%
+18% +39%
2010
0!
5!
10!
15!
20!
25!
Intro Majors (16)! Mid-Level (18)! Upper-Level (17)!
2005!
2010!
2015!
2005!
2010!
2015!
2010!
2015!
2005!
Source: CRA Enrollment Survey!
-‐2%
+43%
+164% +171%
(a) Doctoral-Granting Units
(b) Non-Doctoral Granting Units
Figure D.5: Median percentage of URM students in the courses surveyed (excluding MSIs). No percentage increase is shown for non-doctoral upper-level courses because the 2005 median was zero.
4 Composites that were used for correlations include “Any Diversity Action Taken” and “Diversity Considered in Decisions”. Specifics of how these composites were determined are given in [H: Methodology].

GENERATION CS
D-8
2. Units with an increase in minors have an increase in the percentage of female students in mid- and upper-level courses. We observed a positive correlation between female percentages in the mid- and upper-level course data
and doctoral-granting units that have seen an increase in minors (mid-level course r=.35, n=51, p<.01; upper-level course
r=.30, n=52, p<.05). We saw no statistically significant correlation with the increased number of minors in the URM student
enrollment data. The CRA Enrollment Survey did not collect diversity information about minors. Thus, it is not possible to look
more deeply into this finding from the collected data. Perhaps more women are minoring in computer science, which would
then positively impact the percentage of women in mid- and upper-level courses. However, units that reported an increase
in minors also have a higher percentage of women majors per Taulbee enrollment data (r=.31. n=95, p<.01). Thus, we can’t be
sure of the relative contribution of women minors and majors to an increased percentage of women overall in the mid- and
upper-level courses. In short, more research is needed to understand this finding.
3. Very few units specifically chose or rejected actions due to diversity. While many units (46.5%) stated they
consider diversity impacts when choosing actions, very few (14.9%) chose actions to reduce impact on diversity and even
fewer (11.4%) decided against possible actions out of concern for diversity. In addition, only one-third of units believe their
existing diversity initiatives will compensate for any concerns with increasing enrollments, and only one-fifth of units are
monitoring for diversity effects at transition points.
Summary
Because of computer science’s past history, there is concern that the actions departments take to manage increased
enrollments might have a side effect of reducing diversity. At this point, we see substantial increases in the number of
women and underrepresented minorities enrolling in computer science courses, and median percentages of both groups at
all course levels has also grown. This result holds for all courses for which there is sufficient data from our survey, and in
both doctoral-granting and non-doctoral granting units. In other words, growth in female and URM students appears to be
greater than the overall growth in students. Yet, we must continue our efforts to attract and retain these populations, as
the percentages are still nowhere near where they should be. Our course data for both female and URM students shows
decreases in each year as the course level increases. Further study is needed to determine whether a leaky pipeline exists,
or whether there is another explanation for this trend.
This period of unprecedented growth in the field may actually be an opportunity to increase the diversity of computer
science undergraduates. The CRA data shows that very few units are specifically choosing or rejecting actions due to
diversity, but those that do have a higher percentage of female and URM students. It is likely that many of these units have
been considering diversity in their actions over the long term, not just with respect to the enrollment surge. We strongly
encourage units to track the diversity of their majors, minors, and nonmajors and to consider the effect of the actions that
they take on the diversity of their programs. We need to ensure that the diversity gains we have recently seen can bring
the computing community closer to representing the population that uses the technology we create.

E. THE CHALLENGES OF THE ENROLLMENT SURGE FOR THE UNIT
E-1
Generation CS: Computer Science Undergraduate Enrollments Surge Since 2006
E. The Challenges of the Enrollment Surge for the UnitThe data collected from the CRA Enrollment Survey shows that the impact on computer science units1 from increasing
enrollments is significant2 (Figure E.1). For example, 66% of the 134 responding doctoral-granting units reported that the
enrollment growth is having a big impact (i.e., causing significant challenges) on their unit, while almost 60% of the 93
responding non-doctoral granting units reported that the enrollment growth is beginning to have an impact or already is
having a significant impact.
0!10!20!30!40!50!60!70!
Having big impact with significant challenges!
Beginning to impact unit!
Have seen increase but managed so
far!
No noticeable increase!
Other!
Doctoral! Nondoctoral!
Source: CRA !Enrollment Survey!
Figure E.1: Percentage of doctoral- and non-doctoral granting units experiencing a given level of impact.
1 We use the term “academic unit” or “unit” to denote the administrative division responsible for the CS bachelor’s program. Often, but not always, this is an academic department.2 The use of the term “significant” in this section does not refer to statistical significance. Instead it reflects the qualitative perception of the units who responded to survey questions asking about “significant” demands and challenges. 3 IPEDS doctoral-granting units are institutions that grant at least 20 research/scholarship doctorates in any field (not including professional practice doctoral-level degrees such as JD and MD), following the Carnegie Classification of Institutions of Higher Education. Taulbee and NDC survey data define doctoral- and non-doctoral granting units by whether the unit grants doctorates in computing.
Comprehensive data from the Integrated Postsecondary Education Data System (IPEDS) on degree completions can further
our understanding of the situation at non-doctoral granting units relative to their doctoral counterparts. In the IPEDS data,
we see a significant growth in computer science degree completions at doctoral-granting units3 [G. IPEDS Data]. In other
GENERATION CS
E-2
words, the IPEDS completions data from the broader set of 313 doctoral-granting units is consistent with the substantial
growth reported by the 134 doctoral-granting units responding to the CRA Enrollment Survey. At the 1,185 non-doctoral
granting units, the number of IPEDS computer science degree completions is increasing, but this is occurring more slowly
than at the doctoral-granting units. Since the number of degree completions is increasing more slowly, it makes sense that
non-doctoral granting units are less likely than the doctoral-granting units to report they are experiencing a significant
impact from increasing enrollments (33% vs. 66%).
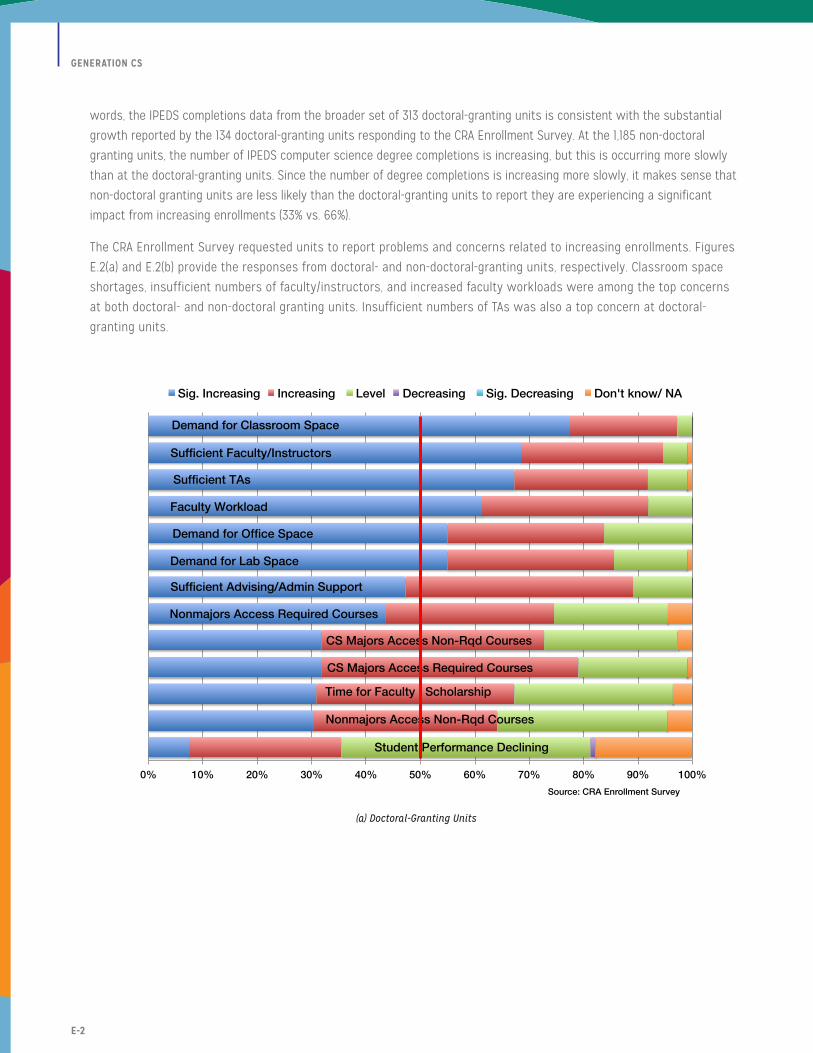
The CRA Enrollment Survey requested units to report problems and concerns related to increasing enrollments. Figures
E.2(a) and E.2(b) provide the responses from doctoral- and non-doctoral-granting units, respectively. Classroom space
shortages, insufficient numbers of faculty/instructors, and increased faculty workloads were among the top concerns
at both doctoral- and non-doctoral granting units. Insufficient numbers of TAs was also a top concern at doctoral-
granting units.
0%! 10%! 20%! 30%! 40%! 50%! 60%! 70%! 80%! 90%! 100%!Source: CRA Enrollment Survey!
Sig. Increasing! Increasing ! Level! Decreasing ! Sig. Decreasing ! Don't know/ NA!
Demand for Classroom Space!
Sufficient Faculty/Instructors!
Sufficient TAs!
Faculty Workload!
Demand for Office Space!
Demand for Lab Space!
Sufficient Advising/Admin Support!
Nonmajors Access Required Courses!
Nonmajors Access Non-Rqd Courses!
CS Majors Access Non-Rqd Courses!
CS Majors Access Required Courses!
Time for Faculty Scholarship!
Student Performance Declining!
(a) Doctoral-Granting Units

E. THE CHALLENGES OF THE ENROLLMENT SURGE FOR THE UNIT
E-3
In fact, more than 50% of the respondents from doctoral-granting units identified six significantly increasing problems or
concerns due to growing enrollments: classroom space, faculty/instructors, TAs, faculty workload, office space, and lab
space. The respondents from non-doctoral granting units also identified several problems or concerns due to increasing
enrollments. However, besides insufficient numbers of faculty/instructors, no other problem or concern was rated as
significantly increasing from more than 50% of the respondents. More than 50% of the respondents from non-doctoral
granting units did identify eight problems or concerns at the significantly increasing or increasing level: classroom space,
faculty/instructors, faculty workload, office space, lab space, advising and administrative support, time for faculty to do
research, and non-majors getting into non-required courses. If we consider responses at the significantly increasing or
increasing level, then all but one of the listed problems or concerns were rated above 50% by respondents from doctoral-
granting units. Despite increasing enrollments, approximately 45% of doctoral- and 40% of non-doctoral granting units
perceive that student performance is level. However, approximately 35% of doctoral- and 40% of non-doctoral-granting units
perceive that student performance is declining. Many of the other 20% are unsure, which suggests these units should more
closely monitor the impact of increasing enrollments on student performance.
In regard to other student impacts, the majority of institutions reported that student retention was level or increasing
overall. Similarly, most doctoral- and non-doctoral granting units reported that the ratio of women and other
underrepresented groups entering the CS degree program was level or increasing. Diversity is discussed in more detail in [D.
Impact on Diversity].
0%! 10%! 20%! 30%! 40%! 50%! 60%! 70%! 80%! 90%! 100%!Source: CRA Enrollment Survey!
Sig. Increasing Increasing Level Decreasing Sig. Decreasing Don't know/ NA
Demand for Classroom Space!
Sufficient Faculty/Instructors!
Faculty Workload!
Sufficient TAs!
Demand for Office Space!
Demand for Lab Space!
Sufficient Advising/Admin Support!
Nonmajors Access Required Courses!
Nonmajors Access Non-Rqd Courses!
Time for Faculty Scholarship!
CS Majors Access Required Courses!
CS Majors Access Non-Rqd Courses!
Student Performance Declining!
(b) Non-Doctoral Granting Units
Figure E.2: Percentage of units stating whether a given problem or concern exists at their unit due to increasing enrollment.

GENERATION CS
E-4
Figure E.3 shows doctoral-granting respondents’ qualitative responses about where they believe the increasing demand
exists. A large number of units believe there are significant increases in demand for computer science major courses by
computer science majors. This perception data is supported by the phenomenal growth of computer science majors [B.
Growth of CS Majors]. While respondents believe the increase is most significant in the introductory courses (i.e., 82% of
respondents stated a significant increase in demand from majors exists for intro courses), respondents believe there is
also a significant increase in demand for mid-level and upper-level courses (e.g., 68% of respondents stated a significant
increase in demand exists for upper-level courses).
Many doctoral-granting respondents stated there is a demand from nonmajors for computer science major courses, but
they believe the demand from nonmajors is less of an issue than the demand from majors. For example, 41% of units
reported a stable demand from nonmajors for upper-level courses. Any increase in nonmajor demand for mid-level and
upper-level CS courses can be partly explained by the demand of these courses from CS minors (who are considered
nonmajors by many units). While not shown in a figure, doctoral-granting units report that the number of students seeking
minors is stable for only 21% of the units, somewhat increasing for 50% of the units, and significantly increasing for 29% of
the units. The impact on units from nonmajors is discussed in more detail in [C. Nonmajors Impact]. Lastly, Figure E.3 shows
that only one unit reported a perceived decrease in demand for any computer science major course.
Summary
Classroom space shortages, insufficient numbers of faculty and instructors to teach courses, and increased faculty
workloads are among the top problems and concerns at doctoral-granting and non-doctoral granting units. On the positive
side, the CRA Enrollment Survey found that approximately 88% of both doctoral- and non-doctoral granting respondents
believe that student retention is level or increasing overall. Also, approximately 40% of respondents believe student
performance has not been adversely affected so far. On the other hand, more than one-third of the units reported concerns
0!
20!
40!
60!
80!
100!
120!
140!
Intro for Majors!
Mid-Level! Upper-Level! Intro for Majors!
Mid-Level! Upper-Level!
Significantly Increasing!
Somewhat Increasing!
Stable!
Somewhat Decreasing!
Significantly Decreasing!
Source: !CRA Enrollment Survey!Demand from Majors! Demand from Nonmajors!
Figure E.3: Number of doctoral-granting units reporting levels of increased demand from majors and nonmajors by course level.

E. THE CHALLENGES OF THE ENROLLMENT SURGE FOR THE UNIT
E-5
that student performance is declining. Many units stated that students are facing increased challenges to enroll in required
and non-required CS classes. Units also report that it is increasingly difficult to advise all of their students and provide the
needed administrative support.
Many units are clearly struggling to cope with their current enrollments in computer science courses. Larger faculty
workloads resulting from increased enrollments may decrease faculty retention, which will exacerbate the problems that
units have in covering their courses. Current pressures on computer science units are extremely difficult to manage and
will also intensify if enrollments continue to grow. Institutional administrators need to work with computer science units
to find sustainable approaches to meet the student demand, accounting for important factors such as (1) lack of space for
classes and units, (2) academic support required, (3) the limited pool of qualified teaching faculty, (4) the goals and needs
of nonmajors taking CS classes, (5) the effect of class size on the course experience, and (6) the desired retention of both
students and faculty.

A. CRA ENROLLMENT COMMITTEE: INSTITUTIONAL IMPACT
F-1
Generation CS: Computer Science Undergraduate Enrollments Surge Since 2006
F. Units’ Responses to Surging Student EnrollmentsThe CRA Enrollment Survey asked a wide range of questions about the impact of increased enrollment in undergraduate
courses on the units1, including questions on what was or may be reduced, what was or may be eliminated, how the
increased demand is managed, and what units are trying to maintain and preserve. This section summarizes the responses
on the actions taken or not taken by the 134 doctoral- and 93 non-doctoral granting units that completed the survey.
The complete list of questions asked in the CRA Enrollment Survey is available from a link within [H. Methodology]. We
encourage the reader to see the survey for the full wording of the questions.
The CRA survey asked units to assess the impact of their increased enrollments and the demand on associated resources.
The following sections summarize responses on actions taken to manage enrollment growth, course size, related
resources, and faculty workloads. We also report on approaches taken to manage students’ access to courses.
General Enrollment Management Strategies
The survey asked units to rate eight actions representing possible reductions explicitly taken or in process to manage
the enrollment growth. Figures F.1(a) and F.1(b) list the responses that were received from the doctoral- and non-doctoral
granting units. We list the actions by the largest responses for “Reduced” in doctoral-granting units. For the doctoral-
granting units, more than 50% of units stated they have reduced or plan to reduce two of the actions listed: reducing the
number of courses with low enrollments and reducing the number of electives offered. For the non-doctoral granting units,
more than 50% of units stated they have reduced one of the actions listed: the units’ contribution to the College Core or
First Year program. The difference in responses is likely due to differences in priorities and institutional structures.
0%! 10%! 20%! 30%! 40%! 50%! 60%! 70%! 80%! 90%! 100%!Source: CRA Enrollment Survey!
Facu
lty In
volv
emen
t with
!
Reduced! Plan to Reduce! No Reduction! Don't know/ NA!
Non-Class Student Projects!
Contributions Outside Unit!
UG Research/Honors!
Student Groups!Number of Electives!
Low Enrollment Courses!
K-12 Outreach!
Campus/Unit Service!
1 We use the term “academic unit” or “unit” to denote the administrative division responsible for the CS bachelor’s program. Often, but not always, this is an academic department.
(a) Doctoral-Granting Units

GENERATION CS
F-2
Actions Taken to Manage Course Size and Student Enrollment
Figures F.2(a) and F.2(b) list possible actions related to managing course size and enrollments. The survey asked units to rate
each action using six criteria, from “Done this” to “Don’t know/NA.” We list the actions by the largest responses for “Done
this” in doctoral-granting units.
0%! 10%! 20%! 30%! 40%! 50%! 60%! 70%! 80%! 90%! 100%!Source: CRA Enrollment Survey!
Facu
lty In
volv
emen
t with
!
Reduced! Plan to Reduce! No Reduction! Don't know/ NA!
Non-Class Student Projects!
Contributions Outside Unit!
UG Research/Honors!
Student Groups!
Number of Electives!
Low Enrollment Courses!
K-12 Outreach!
Campus/Unit Service!
(b) Non-Doctoral Granting Units
Figure F.1: Enrollment related actions taken by units
0%! 10%! 20%! 30%! 40%! 50%! 60%! 70%! 80%! 90%! 100%!Source: CRA Enrollment Survey!
Done this! Considering! Like to, can't! Considered/rejected! Haven’t thought of it! Don't know/ NA!
Increase AY Sections!
Significantly Increase Class Sizes!
Increase Summer Offerings!
Reduce Low-Enrollment Classes!
Increase Blended Offerings!
Increase Online Offerings!
Reduce Non-Major Offerings!
Raise Bar On Prerequisite Grades!
Spin off Service Courses!
(a) Doctoral-Granting Units

F. UNITS’ RESPONSES TO SURGING STUDENT ENROLLMENTS
F-3
The top two actions taken by both doctoral- and non-doctoral granting units to manage increased course size and
enrollment are not surprising: increasing the number of sections and significantly increasing class sizes. More than 80% of
the doctoral-granting units and 47-61% of non-doctoral units have already taken these two actions.
More than 50% of the doctoral-granting units are offering extra summer courses, while few of the non-doctoral granting
units are employing this strategy. More than 50% of the doctoral-granting units and 34% of the non-doctoral granting units
have also reduced the number of low enrollment courses offered. Less than 11% of the units stated that they have raised
the bar for doing well in a course, so fewer students advance in the program. In fact, raising the bar and spinning off
service courses to other units are the two course management strategies that have been done or are being considered by
the fewest units.
Actions Taken to Manage Teaching Resources
Figures F.3(a) and F.3(b) show how units are managing their teaching resources in response to the growth in student
enrollment. For each action, “Done this” means the units have increased their use of the specified action.
The top four actions already taken by more than 65% of doctoral-granting units are increasing: (1) the use of existing
undergraduate TA programs, (2) the use of adjuncts and visitors, (3) the use of advanced graduate students to teach
courses, and (4) the number of teaching faculty. The two largest actions already taken for managing teaching resources at
the non-doctoral granting units are an increased reliance on adjuncts and visitors (44%) and beginning a new undergraduate
TA/tutor program (45%, which is the same level of response for this action from doctoral-granting units).
0%! 10%! 20%! 30%! 40%! 50%! 60%! 70%! 80%! 90%! 100%!Source: CRA Enrollment Survey!
Done this! Considering! Like to, can't! Considered/rejected! Haven’t thought of it! Don't know/ NA!
Increase AY Sections!
Significantly Increase Class Sizes!
Increase Summer Offerings!
Reduce Low-Enrollment Classes!
Increase Blended Offerings!
Increase Online Offerings!
Reduce Non-Major Offerings!
Raise Bar On Prerequisite Grades!
Spin Off Service Courses!
(b) Non-Doctoral Granting Units
Figure F.2: Actions taken to manage course size and enrollments

GENERATION CS
F-4
0% ! 10%! 20%! 30%! 40%! 50%! 60%! 70%! 80%! 90%! 100%!Source: CRA Enrollment Survey!
Done this! Considering! Like to, can't! Considered/rejected! Haven’t thought of it! Don't know/ NA!
Employ More Existing Undergrad TAs/Tutors!
Increase Teaching Faculty!
Use More Adjuncts or Visitors as Instructors!
Use More Advanced Grad Students as Instructors!
Increase Size of Tenured/Tenure-Track Faculty!
Increase the Number of Grad Student TAs!
Create New Undergrad TA/Tutor Programs!
Use Faculty/Instructors from Other Units!
Use Phased/Retired Faculty as Instructors!
Increase Teaching Load!
Increase Cost for or Reduce Buyouts!
(a) Doctoral-Granting Units
0%! 10%! 20%! 30%! 40%! 50%! 60%! 70%! 80%! 90%! 100%!Source: CRA Enrollment Survey!
Done this! Considering! Like to, can't! Considered/rejected! Haven’t thought of it! Don't know/ NA!
Employ More Existing Undergrad TAs/Tutors!
Use More Adjuncts or Visitors as Instructors!
Use More Advanced Grad Student as Instructors!
Increase Size of Tenured/Tenure-Track Faculty!
Increase the Number of Grad Student TAs!
Create New Undergrad TA/Tutor Programs!
Use Faculty/Instructors from Other Units!
Use Phased/Retired Faculty as Instructors!
Increase Cost for or Reduce Buyouts!
Increase Teaching Faculty!
Increase Teaching Load!
(b) Non-Doctoral Granting Units
Figure F.3: Actions taken to manage teaching resources

F. UNITS’ RESPONSES TO SURGING STUDENT ENROLLMENTS
F-5
The two most rejected or not-allowed actions at doctoral-granting units include increasing teaching loads and modifying
the administration cost of teaching buyouts. A number of the possible actions listed in the survey are not applicable for
many non-doctoral granting units, making it difficult to interpret the most-often rejected actions by these units. Similar to
doctoral-granting units, a notable number of non-doctoral granting units (25%) have increased the teaching loads of their
faculty. A slightly larger percent have considered this action but rejected it.
In both doctoral- and non-doctoral granting units, the largest “Considering” action to manage teaching resources is hiring
tenured/tenure track faculty. The sharp increase in the number of open tenure-track faculty positions at both doctoral- and
non-doctoral granting units suggests that units are having difficulties filling open positions2. Since only about one-third of
new Ph.D.s pursue an academic position3 and industry continues to hire researchers from academia4, filling open faculty
positions will continue to be a challenge.
Managing Faculty Workloads
Figures F.4(a) and F.4(b) show actions that units are taking to manage faculty workloads. For doctoral-granting units, the
responses are diverse and no action was taken by more than 50% of the units. Approximately 50% of the units are not
using junior faculty in large classes and are accepting that increased workloads are a fact of life. Indeed, more than 60%
of both doctoral- and non-doctoral-granting institutions units reported they are accepting or beginning to accept the
increase in workloads as a “new normal.” Few units have thought of eliminating or reducing service workloads, providing
additional compensation, giving more credit for teaching in annual performance reviews, or training faculty in scalable
class management.
2 Craig E. Wills. Analysis of Current and Future Computer Science Needs via Advertised Faculty Searches for 2017. CRA Bulletin, November 21, 2016. Retrieved from: http://cra.org/analysis-current-future-computer-science-needs-via-advertised-faculty-searches-2017/ [Feb. 23, 2017]3 2015 CRA Taulbee Survey. Retreived from: http://cra.org/wp-content/uploads/2016/05/2015-Taulbee-Survey.pdf [Feb. 23, 2017]4 Universities’ AI Talent Poached by Tech Giants, Wall Street Journal, November 24, 2016.
0%! 10%! 20%! 30%! 40%! 50%! 60%! 70%! 80%! 90%! 100%!Source: CRA Enrollment Survey!
Done this! Considering ! Like to, but can't! Considered/Rejected! Haven’t thought of doing this! Don't know/ NA!
Limit Assigning Junior Faculty Large Courses!
Accept the Increased Load as a Fact of Life!
Reduce Faculty Advising Load !
Consider Class Size in Assigning Loads!
Reduced/No Service When Teach Large Classes!
Additional Compensation for Large Classes!
Inc. Weight For Teaching in Annual Perf. Eval.!
Train Faculty In Scalable Class Mgmt.!
(a) Doctoral-Granting Units

GENERATION CS
F-6
Managing Students’ Access to Courses
Figures F.5(a) and F.5(b) show responses to five questions related to restricting admission to the major and limiting
enrollment in courses. Close to 50% of both doctoral- and non-doctoral granting units limit enrollments in high-demand
courses. More than one-third of both doctoral- and non-doctoral granting units also advise less successful students to
leave the major. Doctoral-granting units are more likely to require that students are a major or minor in order to enroll in
an advanced course (i.e., 45% of doctoral-granting units have put restrictions on non-majors/minors to enroll in advanced
courses while only 16% of non-doctoral granting units have done this).
0%! 10%! 20%! 30%! 40%! 50%! 60%! 70%! 80%! 90%! 100%!Source: CRA Enrollment Survey!
Done this! Considering ! Like to, but can't! Considered/Rejected! Haven’t thought of doing this! Don't know/ NA!
Limit Junior Faculty Large Courses!
Accept the Increased Load as a Fact of Life!
Reduce Faculty Advising Load !
Consider Class Size in Assigning Loads!
Reduced/No Service When Large Classes!
Inc. Weight For Teaching in Annual Perf. Eval.!
Additional Compensation for Large Classes!
Train Faculty In Scalable Class Mgmt.!
(b) Non-Doctoral Granting Units
Figure F.4: Actions taken to manage faculty workloads
0%! 10%! 20%! 30%! 40%! 50%! 60%! 70%! 80%! 90%! 100%!Source: CRA Enrollment Survey!
Done this! Considering! Like to, can't! Considered/rejected! Haven’t thought of it! Don't know/ NA!
Tighten Requirements for Major!
Limit Enrollments in High-Demand Courses!
Advise Less Successful Students to Leave!
Limit Advanced Courses to Majors/Minors!
Limit Access to Advanced Courses in Another Way!
(a) Doctoral-Granting Units

F. UNITS’ RESPONSES TO SURGING STUDENT ENROLLMENTS
F-7
Doctoral granting units are also more likely than non-doctoral granting units to tighten requirements for their major (27% vs.
7%). Almost 40% of doctoral- and almost 30% of non-doctoral granting units report that they could not or rejected the idea
of tightening requirements for entering the major. Lastly, the responses shown in Figure F.5(b) suggest that non-doctoral
granting units have not explored some of actions that doctoral-granting units have already implemented.
There is a great deal of research5 that discusses how actions taken by a department (e.g., to manage access to courses or
a major) have an impact on diversity. For an in-depth discussion about diversity, see [D. Impact on Diversity]. In conclusion,
units should think carefully about the impact of their actions to manage students’ access to CS courses.
Summary
The responses to the CRA Enrollment Survey clearly show that both doctoral- and non-doctoral granting units are
experiencing significant increases in undergraduate course enrollments. Units are using or are planning to use a wide range
of approaches to manage student enrollments, manage enrollment-related resources, and reduce the demands on faculty
while trying to meet the needs of both majors and nonmajors.
As units continue to manage increasing enrollments, a number of the actions taken or not taken could cause undesirable
results. Offering courses in continuously larger classrooms lacks scalability. In addition, ever-increasing class sizes may
reduce the quality of the students’ education and make teaching less attractive to faculty. The survey results show that
one consequence of increased enrollments is faculty reducing their involvement in valuable non-course related educational
activities.
Given the available data on job postings, Ph.D. production, and the insufficient number of new Ph.D.s pursuing academic
positions, units may not be able to hire faculty members as planned. In addition, units may face increased faculty retention
problems. University administrators need to act on the enrollment demands and the stresses they create on the available
resources and faculty. Appropriate institutional responses are required to ensure the educational and research missions of
the unit and the institution can be maintained.
5 For example, see J. McGrath Cohoon, Recruiting and retaining women in undergraduate computing majors, ACM SIGCSE Bulletin, vol. 34, no. 2, pp. 48-52, June 2002.
0%! 10%! 20%! 30%! 40%! 50%! 60%! 70%! 80%! 90%! 100%!Source: CRA Enrollment Survey!
Done this! Considering! Like to, can't! Considered/rejected! Haven’t thought of it! Don't know/ NA!
Tighten Requirements for Major!
Limit Enrollments in High-Demand Courses!
Advise Less Successful Students to Leave!
Limit Advanced Courses to Majors/Minors!
Limit Access to Advanced Courses in Another Way!
(b) Non-Doctoral Granting Units
Figure F.5: Actions taken to manage access to courses or major
G. IPEDS DEGREE COMPLETION DATA
G-1
Generation CS: Computer Science Undergraduate Enrollments Surge Since 2006
G. IPEDS Degree Completion DataComprehensive data from the Integrated Postsecondary Education Data System (IPEDS) on degree completions at CS
and CIS programs can improve our understanding of the CRA Enrollment Survey data. The data provided in this section is
from the IPEDS Data Center on degree completions for two Classification of Instructional Programs (CIP) codes: Computer
and Information Sciences, General (11.0101) and Computer Science (11.0701). The data is for all Carnegie-classified, not-for-
profit, 4-year public and private institutions in the United States, Guam, Puerto Rico, and the U.S. Virgin Islands. We looked
at completions under both 11.0101 and 11.0701 since some institutions with computer science degree programs report
completions under CIP code 11.0101, while others report completions under 11.0701. In this section, we use “CS” to represent
reported completions under both 11.0101 (CIS, general) and 11.0701 (CS).
Comparing IPEDS Data to the CRA Enrollment Survey Data
The CRA Enrollment Survey collected data from 134 doctoral-granting units1 and 93 non-doctoral granting units. To compare
the CRA Enrollment Survey data collected with IPEDS degree completions, we consider two groupings of Carnegie-classified
institutions: (1) Highest, Higher and Moderate Research Doctoral Institutions (Doctoral in Figure G.1) and (2) Large, Medium
and Small Masters and Liberal Arts and Diverse Baccalaureate Institutions (Non-Doctoral in Figure G.1).
Figure G.1 shows remarkable growth in CS completions (94%) at the 313 Carnegie-classified doctoral-granting units2 from
2009 (which reflects growth in majors that began three years earlier) to 2015. The IPEDS degree completion data is
consistent with the substantial growth reported in [B. Growth of CS Majors]. Figure G.1 also shows noteworthy growth in
IPEDS CS completions (48%) at the 1,185 Carnegie-classified non-doctoral granting units. Since the increase in the number
of degree completions at non-doctoral granting units is less than the increase in the number of degree completions at
doctoral-granting units, it is not surprising that non-doctoral granting units are less likely than doctoral-granting units to
report they are experiencing a significant impact from increasing enrollments [E. Impact on Unit].
The CRA Enrollment Survey collected data from 134 doctoral-granting units, which is a good representative sample of the 313
Carnegie-classified doctoral-granting units in IPEDS. However, the CRA Enrollment Survey collected data from only 93 non-
doctoral granting units, which is a small fraction of the 1,185 non-doctoral granting units in the IPEDS data. The IPEDS data
represents a much wider variety of institutions than the CRA Enrollment Survey data. The IPEDS institutions include small,
medium, and large masters programs; liberal arts bachelor degree programs; more specialized bachelor degree programs;
and other kinds of non-doctoral institutions.
1 We use the term “academic unit” or “unit” to denote the administrative division responsible for the CS bachelor’s program. Often, but not always, this is an academic department.2 IPEDS doctoral-granting units are institutions that grant at least 20 research/scholarship doctorates in any field (not including professional practice doctoral-level degrees such as JD and MD), following the Carnegie Classification of Institutions of Higher Education. Taulbee and NDC survey data define doctoral- and non-doctoral granting units by whether the unit grants doctorates in computing.

GENERATION CS
G-2
- !
2,000 !
4,000 !
6,000 !
8,000 !
10,000 !
12,000 !
14,000 !
16,000 !
18,000 !
20,000 !
2009! 2010! 2011! 2012! 2013! 2014! 2015!Source: IPEDS!
Non-Doctoral! Doctoral!
up 94% !
up 48% !
Figure G.1: IPEDS Data (CIP 11.0101 & 11.0701)
Degree Completions by Gender and Ethnicity
Figure G.2 shows IPEDS CS degree completions for four groups — women, Blacks/African Americans, Hispanics/Latinos,
and other underrepresented groups (American Indians or Alaska Natives plus Native Hawaiians or Other Pacific Islanders)
— as a percentage of total completions for doctoral- and non-doctoral granting units. Figure G.2(a) shows a growth in
completions from 2009 to 2015 for three of the four groups (all but Blacks/African Americans). Figure G.2(b) shows a growth
in completions for only two of the four groups: Hispanics/Latinos and other underrepresented groups. The percentage of
degree completions of Blacks/African Americans declined from 2009 to 2015 in both doctoral- and non-doctoral granting
units. The percentage of degree completions by women increased in doctoral-granting units, while this percentage dropped
and then recovered somewhat in non-doctoral granting units.

G. IPEDS DEGREE COMPLETION DATA
G-3
11.4%!
15.3%!
5.5%!4.3%!
5.8%!
8.4%!
0.3%! 0.4%!0.0%!
2.0%!
4.0%!
6.0%!
8.0%!
10.0% !
12.0% !
14.0% !
16.0% !
18.0% !
2009! 2010! 2011! 2012! 2013! 2014! 2015!Source: IPEDS!
Women! Black/African-American! Hispanic/Latino! Other URMs!
(a) Doctoral-Granting Units
17.0%!16.6%!
10.6%!
8.6%!
7.0%! 8.5%!
0.6%! 0.8%!
0.0%!
2.0%!
4.0%!
6.0%!
8.0%!
10.0% !
12.0% !
14.0% !
16.0% !
18.0% !
2009! 2010! 2011! 2012! 2013! 2014! 2015!Source: IPEDS!
Women! Black/African-American! Hispanic/Latino! Other URMs!
(b) Non-Doctoral Granting Units
Figure G.2: IPEDS CS Diversity Data

GENERATION CS
G-4
Due to the overall increase in CS degree completions, the number of completions by all four groups has grown from 2009
to 2015. Table G.1 shows the increase in the number of IPEDS CS degree completions from 2009 to 2015, separated by
non-doctoral and doctoral-granting units. The growth in completions by women (except in non-doctoral granting units),
Hispanics/Latinos, and Other Underrepresented groups (American Indians or Alaska Natives plus Native Hawaiians or Other
Pacific Islanders) has outpaced the overall growth across both doctoral- and non-doctoral granting units. While the number
of IPEDS CS degree completions by Blacks/African Americans has increased, the rate of increase is only approximately one-
half of the overall increase.
Degree Completions at Public vs. Private Institutions
Figure G.3 shows the total number of IPEDS CS degree completions at public and private institutions. The growth in total
completions from 2009 to 2015 was much larger for public institutions (79%) than private institutions (58%). Figure G.4
shows IPEDS CS degree completions for women and underrepresented minorities (URMs) at public and private institutions.
While private institutions have a larger percentage of women graduating (20% vs. 14%), public institutions still produce more
women overall (approximately 2,600 vs. 1,800). Lastly, Figure G.4(b) shows that the IPEDS CS degree completions rate for
underrepresented minorities (Blacks/African Americans, Hispanics/Latinos, and Other Underrepresented groups) from 2009
to 2015 has decreased slightly at private institutions and increased slightly at public institutions.
Table G.1: Increase in Completions 2009-2015
Numerical Increase Percentage Increase
Non-Doctoral Doctoral Non-Doctoral Doctoral All
Total 3,959 8,351 48% 94% 72%
Women 637 1,620 46% 160% 94%
Blacks/African-Americans 183 259 21% 53% 33%
Hispanics/Latinos 463 932 81% 181% 128%
Other Underrepresented 44 42 85% 175% 113%

G. IPEDS DEGREE COMPLETION DATA
G-5
- !
5,000 !
10,000 !
15,000 !
20,000 !
25,000 !
2009! 2010! 2011! 2012! 2013! 2014! 2015!Source: IPEDS!
Private! Public!
up 79% !
up 58% !
Figure G.3: IPEDS Private vs. Public CS Completions
12.4%!14.0%!
17.4%!
20.2%!
0.0%!
5.0%!
10.0%!
15.0%!
20.0%!
25.0%!
2009! 2010! 2011! 2012! 2013! 2014! 2015!Source: IPEDS!
Women Public! Women Private!
(a) Percentage Completions for Women

GENERATION CS
G-6
10.9%!
12.6%!
16.0%! 15.5%!
0.0%!
2.0%!
4.0%!
6.0%!
8.0%!
10.0%!
12.0%!
14.0%!
16.0%!
18.0%!
20.0%!
2009! 2010! 2011! 2012! 2013! 2014! 2015!Source: IPEDS!
URMs Public! URMs Private!
(b) Percentage Completions for URMs
Figure G.4: Diversity in Public and Private Institutions

H. METHODOLOGY
H-1
Generation CS: Computer Science Undergraduate Enrollments Surge Since 2006
H. MethodologyIn Fall 2015, the CRA Enrollment Committee Institutional Subgroup sought to understand the scope and impact of recent
increases in undergraduate computer science programs by collecting data from academic units1 in the United States and
Canada. This section describes the collection and analysis of the academic unit data obtained via the CRA Enrollment Survey.
Survey Scope
The survey was sent to units responsible for serving bachelor-level majors in computer science. We explicitly omitted units
whose programs were only in computer engineering, information science, or information technology.
U.S. doctoral-granting and non-doctoral granting and Canadian doctoral-granting units were surveyed.
Survey Design
The survey questions covered the following areas:
◗ Unit context (degrees offered, recent changes in degrees, admission of students to the major, responsibility for
nonmajor courses)
◗ Unit’s perception of the trend in demand for introductory, mid-level, and upper-level courses from majors and nonmajors
◗ Impacts the unit sees or does not see on students, faculty, staff, physical space, and diversity
◗ Actions the unit has considered or taken to deal with increases, including actions to limit impacts on faculty and actions
to mitigate potential impacts on diversity
◗ Course-level enrollment data for representative courses at the introductory, mid-level, and upper-level for 2005, 2010,
and 2015; and also numbers of majors, women, and underrepresented minorities enrolled in the selected courses
Questions were revised based on a pilot survey with 10 units, including one Canadian and three non-doctoral granting units.
The final survey is available at http://cra.org/wp-content/uploads/2017/02/2015-Enrollment_Survey-Sample.pdf.
Data Collection
The survey used the format of the CRA Taulbee Survey for doctoral-granting units and the ACM NDC Study for non-doctoral-
granting (bachelor’s and master’s) units, both of which survey their populations annually. Doctoral or non-doctoral status for
the Taulbee and NDC surveys is based on whether a unit grants doctorates in computing.
For the doctoral-granting units, the CRA Enrollment Survey was set up as a separate survey under the Taulbee umbrella.
All doctoral units with undergraduate CS programs were invited to participate via an email to the academic unit head and,
later, to the primary Taulbee contact within the unit (if different from the academic unit head). Surveys were conducted
online. Data collection began in October 2015 and concluded in January 2016.
For the non-doctoral units, the CRA Enrollment Survey was set up as a separate survey under the ACM NDC Study umbrella.
The CRA Enrollment and ACM NDC surveys were launched concurrently in January 2016. An email was sent to the ACM NDC
1 We use the term “academic unit” or “unit” to denote the administrative division responsible for the CS bachelor’s program. Often, but not always, this is an academic department.

GENERATION CS
H-2
Study contacts of all non-doctoral granting units announcing the launch of the surveys; the email indicated that the CRA
Enrollment Survey was only for those units with an undergraduate CS program. Data collection concluded at the end of
March 2016.
Members of the CRA Enrollment Committee Institutional Subgroup were concerned that units might be unable to provide the
requested course-level enrollment data. While not all units provided this data, Table H.1 provides a few examples that show
many units were able to do so.
Table H.1: CRA Enrollment Survey Response Rates
Type of Unit SurveyedResponded
# (%)
Provided Intro Majors Course Data
for 2015
Provided Intro Majors Course Data
for 2010
Provided Course Data All Levels for
2005, 2010, and 2015
Doctoral 190 134 (70.5%) 70 59 49
Non-Doctoral 706 93 (13.2%) 25 23 20
Not all responding units answered every question. Thus, analyses and figures in different sections of this report may be
based on different numbers of responses.
Data Analysis
Types of Analyses
This Generation CS report primarily includes descriptive statistics about the extent of the enrollment surge and its impact
on academic units. Significance testing was employed in two places. In [B. Growth of CS Majors], we report that there was
no significant difference in the percent change in enrollment over time between small and large academic units, which
was tested using a paired sample t-test. In [D. Impact on Diversity], some correlations are reported between actions and
diversity outcomes (percent of women or underrepresented minority students) with their associated p values.
Categorizing Academic Units
In the analysis within this Generation CS report, units are categorized in several different ways:
◗ Doctoral- vs. non-doctoral granting. The CRA Taulbee Survey, the ACM NDC Study, and the CRA Enrollment Survey classify
units as doctoral or not based on whether the unit grants doctorates in computing. The Integrated Postdoctoral Education
Data System (IPEDS) categorizes institutions as doctoral or not based on whether they grant more than 20 research or
scholarship doctorates per year in any field, following the Carnegie Classification of Institutions of Higher Education. Most
sections of this report only use data from the CRA Enrollment Survey. However, both [D. Impact on Diversity] and [G. IPEDS
Data] present some analyses of IPEDS data for context and comparison.
◗ Public vs. private. Includes only U.S. doctoral units. There are responses from 92 public (74% of the responses) and 32
private (26%) doctoral units.
◗ Large vs. small. Units with >= 25 tenured or tenure-track faculty FTE are considered large; those with fewer than 25 are
considered small. Four units did not provide faculty size; of the 130 units with a stated faculty size, there are responses
from 68 large (52%) and 62 small (48%) units.
◗ Canadian. Ten Canadian doctoral-granting units responded to the survey; no Canadian non-doctoral granting units were
surveyed. Canadian units are not included in the public vs. private comparisons but are included in all other analyses for
which they provided data.◗ Non-doctoral granting. All responses from non-doctoral granting units are grouped together. While subgroup differences
would be of interest (e.g. liberal arts schools vs. large master’s granting units), not enough units responded to the CRA
Enrollment Survey to properly analyze these differences.

H. METHODOLOGY
H-3
◗ MSIs (minority-serving institutions). The doctoral-granting respondents include four minority-serving institutions, one
HBCU, and three Hispanic-serving institutions. The MSI data is included with the other units except for correlations
between percent of underrepresented minority (URM) students and other variables, such as diversity actions taken. The
non-doctoral granting respondents included one Hispanic-serving institution and one all-women institution.
Missing Data
Because of missing data, not all analyses using the same unit breakdown have the same number of academic units.
Analyses of course enrollment data across time use only responses of units that provided data for all years under analysis.
Variables
Course-Level Enrollment
The survey asked for an “intro-level course for (mainly) nonmajors” and an “intro-level course for (mainly) CS majors.” In
most cases this is synonymous with an intro course not required for the major and an intro course required for the major.
Such courses are handled differently by different units. For example, not all units have an intro-level course for nonmajors.
Furthermore, in some units, the intro course primarily for majors is taken before a student can officially declare a major.
Also, some units could only report whether the student who took a course was a CS major when they left the institution,
not their major status at the time they took the course. Clearly, some students taking the intro-level course for nonmajors
later become majors, and not all students taking the intro-level course for majors become majors.
There is less ambiguity about majors and nonmajors in the mid-level and upper-level courses. However, in interpreting this
data, note that the CRA Enrollment Survey asked for data on a representative course at each level, not for complete data
for the unit. For example, the enrollment figures (and thus the percent of women and URMs) labeled “Upper-Level” are for
a single selected upper-level course for each unit, which is not a total picture of the unit’s enrollment in all upper-level
courses. Each unit made its own choice of representative courses, but within the constraint that the course had been
offered with similar goals and curriculum since 2005. Therefore, unit differences in course enrollment at the mid-level
and upper-level may reflect differences between the topics of the selected representative courses as well as differences
between institutions.
Definition of Underrepresented Minorities (URMs)
For the course-level enrollment data, the CRA Enrollment Survey asked units to provide the following data for each chosen
representative course: total student enrollment in the course the most recent time it was offered, number of CS majors,
number of women, number of international students, and number of URMs. The instructions for URM status were to
“aggregate the following classifications: Black/African American, American Indian/Alaska Native, and Hispanic/Latino.”
Although we recognize that there may be differences in the trends and experiences of different groups, we did not collect
data to break this aggregate down further.
Analyses using the Taulbee Survey data and IPEDS data group the same classifications into URMs. Students reported as
multiracial are not counted as URMs because we do not have information on which races they identify with.
Diversity Action Composites
Diversity Considered in Decisions composite was computed as the sum of the first three items in Question F6 of the CRA
Enrollment Survey, which are yes/no whether diversity impacts are explicitly considered when discussing possible actions.
Some actions were considered but not taken because of concerns about their impact on diversity. Also, some actions were
chosen specifically to reduce the potential impact on underrepresented groups.
Any Diversity Action Taken was computed as yes/no if there were yes responses to any of the three diversity action questions.

I. LIST OF FIGURES
I-1
Generation CS: Computer Science Undergraduate Enrollments Surge Since 2006
I. List of FiguresFigures and data spreadsheets are available at http://cra.org/data/generation-cs/appendix-list-figures/.
A. CRA Enrollment CommitteeNo Figures
B. The Phenomenal Growth of CS Majors Since 2006Figure B.1. Average number of CS majors per unit since 2006.
Figure B.2: Average enrollment by CS majors at large and small academic units (based on number of tenure track faculty).
The percentages denote cumulative changes since 2006.
Figure B.3: Cumulative percent of units with the indicated level of growth in CS majors from 2009 to 2014.
Figure B.4: Cumulative percent growth of CS majors and instructional faculty since 2006.
Figure B.5: Average enrollment by CS majors in computing courses at doctoral-granting units from 2005 to 2015. The number
in parentheses in each category indicates sample size
Figure B.6: Average enrollment by CS majors in computing courses at non-doctoral granting units from 2005 to 2015. The
number in parentheses in each category indicates sample size.
C. The Widespread Increase in Nonmajor EnrollmentFigure C.1: Cumulative nonmajor enrollment (red) and major enrollment (blue) in computing courses at doctoral- and non-
doctoral granting units from 2005 to 2015. The number in parentheses in each category indicates sample size.
Figure C.2: Average enrollment by nonmajors in computing courses at doctoral- and non-doctoral granting units from 2005
to 2015. The number in parentheses in each category indicates sample size.
D. The Mixed News on Diversity and the Enrollment SurgeFigure D.1: Median percentage of female students in the courses surveyed.
Figure D.2: Median percentage of female students in the courses surveyed in doctoral-granting units: public vs. private.
Number in parentheses in each category indicates sample size.
Figure D.3: Number of doctoral-granting units with indicated percentage of women in representative upper-level courses in
2010 and 2015.
Figure D.4: Number of URM students in four representative courses in doctoral-granting units.
Figure D.5: Median percentage of URM students in the courses surveyed (excluding MSIs).
No percentage increase is shown for non-doctoral upper-level courses because the 2005 median was zero.

GENERATION CS
I-2
E. The Challenges of the Enrollment Surge for the UnitFigure E.1: Percentage of doctoral- and non-doctoral granting units experiencing a given level of impact.
Figure E.2: Percentage of units stating whether a given problem or concern exists at their unit due to increasing enrollment.
Figure E.3: Number of doctoral-granting units reporting levels of increased demand from majors and nonmajors by
course level.
F. Units’ Response to Surging EnrollmentsFigure F.1: Enrollment related actions taken by units
Figure F.2: Actions taken to manage course size and enrollments
Figure F.3: Actions taken to manage teaching resources
Figure F.4: Actions taken to manage faculty workloads
Figure F.5: Actions taken to manage access to courses or major
G. IPEDS ComparisonsFigure G.1: IPEDS Data (CIP 11.0101 & 11.0701)
Figure G.2: IPEDS CS Diversity Data
Figure G.3: IPEDS Private vs. Public CS Completions
Figure G.4: Diversity in Public and Private Institutions
H. Appendix: MethodologyNo Figures
I. Appendix: List of FiguresNo Figures
J. AcknowledgementsNo Figures

J. ACKNOWLEDGEMENTS
J-1
Generation CS: Computer Science Undergraduate Enrollments Surge Since 2006
J. AcknowledgementsNumerous people were involved in the creation of this report, from providing feedback on early drafts of the CRA Enrollment
Survey, to supplying data, to commenting on earlier versions of this report. We thank the following:
Ed Lazowska (University of Washington), Eric Roberts (Stanford University), and James Kurose (National Science Foundation)
for first bringing attention to the widespread enrollment surge in computer science.
Andrew Bernat (CRA Executive Director) and the CRA Board for launching the CRA Enrollment Committee to investigate the
CS community’s numerous questions about the surge.
Lida Beninson (The National Academies of Sciences, Engineering, and Medicine) and Jan Cuny (National Science Foundation)
for their advice as the work of the CRA Enrollment Committee’s Institution Subgroup got underway.
Duncan Buell (University of South Carolina), Ed Lazowska (University of Washington), Leen-Kiat Soh (University of
Nebraska), Jane Stout (Computing Research Association), and Jodi Tims (Baldwin Wallace) for their participation on the CRA
Enrollment Committee’s Student Subgroup. The Student Subgroup assisted the CRA Enrollment Committee’s Institution
Subgroup in several ways, such as providing feedback on the CRA Enrollment Survey and offering suggestions on ways to
improve this report.
Anne Condon (University of British Columbia) for evaluating the CRA Enrollment Survey from a Canadian’s perspective.
Three Google CS Capacity Grantees—John DeNero (University of California, Berkeley), Jeff Offut (George Mason University), and
Heather Pon-Barry (Mount Holyoke College)—for providing detailed feedback on an early draft of the CRA Enrollment Survey.
Karen Mattingly (University of Maryland, Baltimore County) for an early discussion regarding the feasibility of the survey and
for comments on part of the report.
Yan Timanovsky (ACM) for conducting the CRA Enrollment Survey for non-doctoral granting units in parallel with the
ACM NDC survey.
David Morgan (Peerfocus) for implementation of the online survey and for coordination of the doctoral- and non-doctoral
granting versions.
Emily Grumbling (The National Academies of Sciences, Engineering, and Medicine) and others at the Computer Science
Telecommunications Board for suggesting updates to the CRA Enrollment Survey.
Valerie Taylor (Texas A&M) for suggesting we consider data on underrepresented minorities from minority-serving
institutions separately.
Miriah Meyer (University of Utah) and Alex Lex (University of Utah) for their advice on how best to visualize the CRA
Enrollment Survey data.
Jeffrey Swenson (Hiram College) for advice on language usage in the report.

GENERATION CS
J-2
The many attendees of the CRA Conference at Snowbird in 2016 who offered their opinions on what this enrollment surge
should be called. Special thanks to Jane Stout (Computing Research Association) for suggesting the Generation CS name.
Jack Rosenberger (Editor) for proofreading this report and suggesting valuable improvements.
Shar Steed (Computing Research Association), Kapil Patnaik (IT Consultant, Caretecher), and the graphic designers at Allen
Wayne for providing creative design templates and associated web pages.
The numerous responders of the CRA Enrollment Survey (the specific institutions are listed below).
And other individuals who offered valuable suggestions to members of the CRA Enrollment Committee’s Institution Subgroup
during the 20+ months that the committee worked on this report.
THANK YOU!
Doctoral-granting units that responded to the CRA Enrollment Survey
Arizona State UniversityAuburn UniversityBoston UniversityBrown UniversityCarnegie Mellon UniversityCase Western Reserve UniversityClarkson UniversityCollege of William & MaryColorado School of MinesColorado State UniversityColumbia UniversityCornell UniversityDePaul UniversityDrexel UniversityEmory UniversityFlorida International UniversityFlorida State UniversityGeorge Mason UniversityGeorgia Institute of TechnologyGeorgia State UniversityHarvard UniversityHoward UniversityIllinois Institute of TechnologyIndiana University School of Informatics and ComputingIowa State UniversityJohns Hopkins UniversityKansas State UniversityKent State UniversityLehigh University
Massachusetts Institute of TechnologyMcGill UniversityMichigan State UniversityMichigan Technological UniversityMississippi State UniversityMissouri University of Science & TechnologyMontana State UniversityNew Jersey Institute of TechnologyNew Mexico State UniversityNew Mexico TechNew York UniversityNorth Carolina State UniversityNortheastern UniversityNorthwestern UniversityOhio State UniversityOhio UniversityOklahoma State UniversityOld Dominion UniversityOregon State UniversityPennsylvania State UniversityPrinceton UniversityPurdue UniversityRensselaer Polytechnic InstituteRice UniversityRochester Institute of TechnologySimon Fraser UniversitySouthern Illinois University, CarbondaleStanford UniversityStony Brook University, SUNY

J. ACKNOWLEDGEMENTS
J-3
Texas A&M UniversityTufts UniversityUniversity at Albany, SUNYUniversity of Alabama, TuscaloosaUniversity of ArizonaUniversity of Arkansas at Little RockUniversity of British ColumbiaUniversity of CalgaryUniversity of California, BerkeleyUniversity of California, DavisUniversity of California, IrvineUniversity of California, RiversideUniversity of California, San DiegoUniversity of California, Santa BarbaraUniversity of California, Santa CruzUniversity of Central FloridaUniversity of ChicagoUniversity of Colorado, BoulderUniversity of ConnecticutUniversity of DelawareUniversity of FloridaUniversity of GeorgiaUniversity of HoustonUniversity of Illinois, ChicagoUniversity of Illinois, Urbana-ChampaignUniversity of IowaUniversity of KentuckyUniversity of ManitobaUniversity of MarylandUniversity of Maryland, Baltimore CountyUniversity of Massachusetts, AmherstUniversity of Massachusetts, BostonUniversity of Massachusetts, LowellUniversity of MichiganUniversity of MinnesotaUniversity of Nebraska at OmahaUniversity of Nebraska, LincolnUniversity of Nevada, Las VegasUniversity of New Hampshire
University of New MexicoUniversity of North Carolina at Chapel HillUniversity of North TexasUniversity of Notre DameUniversity of OklahomaUniversity of OregonUniversity of PennsylvaniaUniversity of PittsburghUniversity of Rhode IslandUniversity of RochesterUniversity of South CarolinaUniversity of South FloridaUniversity of Southern CaliforniaUniversity of Tennessee, KnoxvilleUniversity of Texas, ArlingtonUniversity of Texas, AustinUniversity of Texas, DallasUniversity of Texas, El PasoUniversity of TorontoUniversity of UtahUniversity of VermontUniversity of VictoriaUniversity of VirginiaUniversity of WashingtonUniversity of WaterlooUniversity of Western OntarioUniversity of Wisconsin, MadisonUniversity of Wisconsin, MilwaukeeVirginia TechWashington State UniversityWashington University in St. LouisWayne State UniversityWestern Michigan UniversityWorcester Polytechnic InstituteWright State University
York University

GENERATION CS
J-4
Abilene Christian UniversityAmherst CollegeBaldwin Wallace UniversityBaylor UniversityBerea CollegeBlackburn CollegeBloomsburg University of PennsylvaniaBoston CollegeCalifornia State University, FullertonCalvin CollegeCarleton CollegeCentral CollegeCentre CollegeChristopher Newport UniversityColby CollegeColgate UniversityCollege of Holy CrossCollege of New JerseyCollege of Saint BenedictColumbia CollegeConcordia University TexasCovenant CollegeDePauw UniversityDelaware State UniversityDenison UniversityDickinson CollegeEast Stroudsburg University of PennsylvaniaElizabethtown CollegeFlorida Polytechnic UniversityGeorgia College & State UniversityGeorgia Regents UniversityGettysburg CollegeGraceland University-LamoniGrambling State UniversityGrinnell CollegeHamilton CollegeHenderson State UniversityHiram CollegeHuntington UniversityIllinois State UniversityIllinois Wesleyan UniversityIona CollegeKalamazoo CollegeKnox CollegeLake Superior State UniversityLe Moyne CollegeLeTourneau University
Lewis-Clark State CollegeLongwood UniversityLoyola University MarylandMarquette UniversityMetropolitan State UniversityMiddlebury CollegeMillersville University of PennsylvaniaMontana Tech of University of MontanaMount Holyoke CollegeNew College of FloridaNorthern Kentucky UniversityOberlin CollegeOlivet NazareneOtterbein UniversityOuachita Baptist UniversityPark UniversityQuinnipiac UniversityRamapo College of New JerseyRoanoke CollegeRoger Williams UniversityRose-Hulman Institute of TechnologySUNY College at OswegoSaint Thomas Aquinas CollegeSeattle UniversitySiena CollegeSouthern Connecticut State UniversitySouthwestern UniversityStephen F. Austin State UniversityUnion CollegeUniversity of Central MissouriUniversity of EvansvilleUniversity of MinnesotaUniversity of Minnesota-MorrisUniversity of Missouri-St. LouisUniversity of North Carolina at AshevilleUniversity of North Carolina at GreensboroUniversity of PortlandUniversity of Washington TacomaValparaiso UniversityWalla Walla UniversityWartburg CollegeWest Virginia State UniversityWestminster CollegeWheaton CollegeWilliam Penn UniversityWilliams College
Non-doctoral granting units that responded to the CRA Enrollment Survey