Embed Size (px)
Citation preview

Computación y Sistemas
ISSN: 1405-5546
Instituto Politécnico Nacional
México
Cruz-Barbosa, Raul; Vellido, Alfredo
Generative Manifold Learning for the Exploration of Partially Labeled Data
Computación y Sistemas, vol. 17, núm. 4, octubre-diciembre, 2013, pp. 641-653
Instituto Politécnico Nacional
Distrito Federal, México
Available in: http://www.redalyc.org/articulo.oa?id=61529295015
How to cite
Complete issue
More information about this article
Journal's homepage in redalyc.org
Scientific Information System
Network of Scientific Journals from Latin America, the Caribbean, Spain and Portugal
Non-profit academic project, developed under the open access initiative
Generative Manifold Learningfor the Exploration
of Partially Labeled Data
Raul Cruz-Barbosa1 and Alfredo Vellido2
1Instituto de Computacion, Universidad Tecnologica de la Mixteca, Huajuapan, Oaxaca,Mexico
2Departament de Llenguatges i Sistemes Informatics, Universitat Politecnica de Catalunya, Barcelona,Spain
[email protected], [email protected]
Abstract. In many real-world application problems,the availability of data labels for supervised learningis rather limited and incompletely labeled datasetsare commonplace in some of the currently mostactive areas of research. A manifold learning model,namely Generative Topographic Mapping (GTM), isthe basis of the methods developed in the thesisreported in this paper. A variant of GTM that usesa graph approximation to the geodesic metric is firstdefined. This model is capable of representing dataof convoluted geometries. The standard GTM is heremodified to prioritize neighbourhood relationshipsalong the generated manifold. This is accomplishedby penalizing the possible divergences between theEuclidean distances from the data points to the modelprototypes and the corresponding geodesic distancesalong the manifold. The resulting Geodesic GTM(Geo-GTM) model is shown to improve the continuityand trustworthiness of the representation generatedby the model, as well as to behave robustly in thepresence of noise. We then proceed to define a novelsemi-supervised model, SS-Geo-GTM, that extendsGeo-GTM to deal with semi-supervised problems. InSS-Geo-GTM, the model prototypes obtained fromGeo-GTM are linked by the nearest neighbour tothe data manifold. The resulting proximity graphis used as the basis for a class label propagationalgorithm. The performance of SS-Geo-GTM isexperimentally assessed via accuracy and Matthewscorrelation coefficient, comparing positively withan Euclidean distance-based counterpart and thealternative Laplacian Eigenmaps and semi-supervisedGaussian mixture models.
Keywords. Semi-supervised learning, Clustering,Generative Topographic Mapping, Exploratory DataAnalysis.
Aprendizaje generativo de variedadespara la exploracion de datos
parcialmente etiquetados
Resumen. En muchos problemas aplicados del mundoreal, la disponibilidad de etiquetas de los datos parael aprendizaje supervisado es bastante limitada y losconjuntos de datos etiquetados incompletamente sonhabituales en algunas de las areas de investigacionactualmente mas activas . Un modelo de aprendizajede variedades, el Mapeo Topografico Generativo (GTMcomo acronimo del nombre en ingles), es la basede los metodos desarrollados en la tesis reportadaen este artıculo. Se define en primer lugar unaextension de GTM que utiliza una aproximacion degrafos para la metrica geodesica. Este modelo escapaz de representar datos de geometrıa intrincada.El GTM estandar se modifica aquı para priorizarrelaciones de vecindad a lo largo de la variedadgenerada. Esto se logra penalizando las divergenciasposibles entre las distancias euclideanas de lospuntos de datos a los prototipos del modelo y lasdistancias geodesicas correspondientes a lo largo dela variedad. Se muestra aquı que el modelo GTMgeodesico (Geo-GTM) resultante mejora la continuidady la fiabilidad de la representacion generada porel modelo, al igual que se comporta robustamenteen presencia de ruido. Despues, procedemosa definir un modelo semi-supervisado novedoso,SS-Geo-GTM, que extiende Geo-GTM para tratarproblemas semi-supervisados. En SS-Geo-GTM, losprototipos del modelo obtenidos de Geo-GTM sonvinculados mediante el vecino mas cercano a la variedadde datos. El grafo de proximidad resultante se utilizacomo la base para un algoritmo de propagacion deetiquetas de clase. El rendimiento de SS-Geo-GTM seevalua experimentalmente a traves de las medidas deexactitud y el coeficiente de correlacion de Matthews,comparando positivamente con una contraparte basada
en la distancia euclideana y con los modelos alternativosde Eigenmapas Laplacianos y mezclas de Gaussianassemi-supervisadas.
Palabras clave. Aprendizaje semi-supervisado,agrupamiento, mapeo topografico generativo, analisisexploratorio de datos.
1 Introduction
Labeling aspects of reality is one of the moststandard tasks performed by the human brain and,therefore, of natural learning. When dividing theexisting reality into different categories, humansseamlessly perform a classification task that canbe improved over time through learning.
In the realm of non-natural, or machine learning,the task of unraveling the relationship betweenthe observed data and their corresponding classlabels can be seen as the modeling of the mappingbetween a set of data inputs and a set of discretedata targets. This is understood as supervisedlearning.
Unfortunately, in many real applications classlabels are either completely or partially unavailable.The first case scenario is that of unsupervisedlearning, where the most common task to beperformed is that of data clustering, which aims todiscover the “true” group structure of multivariatedata [32]. The second case is less frequentlyconsidered but far more common than what onemight expect: quite often, only a reduced numberof class labels is readily available and even that canbe difficult and/or expensive to obtain.
In such context, unsupervised models are anadequate tool for a first exploratory approach.The available class labels can then be used torefine the unsupervised procedure. This becomesa task on the interface between supervised andunsupervised models: semi-supervised learning(SSL [17, 59, 7]). This type of learning is commonlyunderstood as a way to improve supervised tasks(usually with few available labeled samples) withthe use of unlabeled samples [47, 15, 33, 26, 44].In this paper, the approach is a less typical one:improving and refining unsupervised learning byusing class labeled data.
From several categories of SSL methods [17],we are specifically interested in graph-basedmethods based on generative models. Ingraph-based methods, the nodes of a graphcome to represent the observed data points, while
its edges are assigned the pairwise distancesbetween the incident nodes.
The way the distance between two data points iscomputed can be seen as an approximation of the(true) geodesic distance (which is computationallyintractable [11, 38]) between the two points withrespect to the overall data manifold [10]. Therefore,we present a semi-supervised approach, inspiredby that two-stage SSL method proposed in [31].It is based on geodesic generative topograhicmapping (Geo-GTM: [20]), which is an extension ofthe statistically principled Generative TopographicMapping (GTM: [14]).
In our proposal, the prototypes obtained fromGeo-GTM are inserted and linked by the nearestneighbour to the data manifold. The resultinggraph is considered as a proximity graph forwhich an ad hoc version of label propagationalgorithm (LP: [58]) is defined. This becomessemi-supervised Geo-GTM (SS-Geo-GTM:[21, 22]), a model that uses the informationderived from Geo-GTM training to accomplishthe semi-supervised task (see Fig. 1). A detaileddescription of SS-Geo-GTM can be found in [21],whereas a practical application to a problem in thefield of neuro-oncology, using human brain tumourdatasets, is described in [22].
Unlike the aforementioned SS-Geo-GTMpublications, here we compare its performance,via accuracy and Matthews correlationcoefficient [40, 28], with that of two alternativesemi-supervised techniques: LaplacianEigenmaps [8] and semi-supervised Gaussianmixture models [41].
2 Semi-Supervised and GenerativeManifold Learning
Semi-supervised learning is an emergent disciplinethat incorporates prior knowledge into supervisedor unsupervised methods (classification andclustering, mainly). The need for SSL, understoodas learning from a combination of both labeled andunlabeled data, rises naturally in cases for whichthere exists a large supply of unlabeled data buta limited one of labeled data (bearing in mind thatin many practical domains it can be very difficultand/or expensive to generate the labeled data).When SSL is used for classification, the main goalis to improve the classification accuracy aided byunlabeled data.
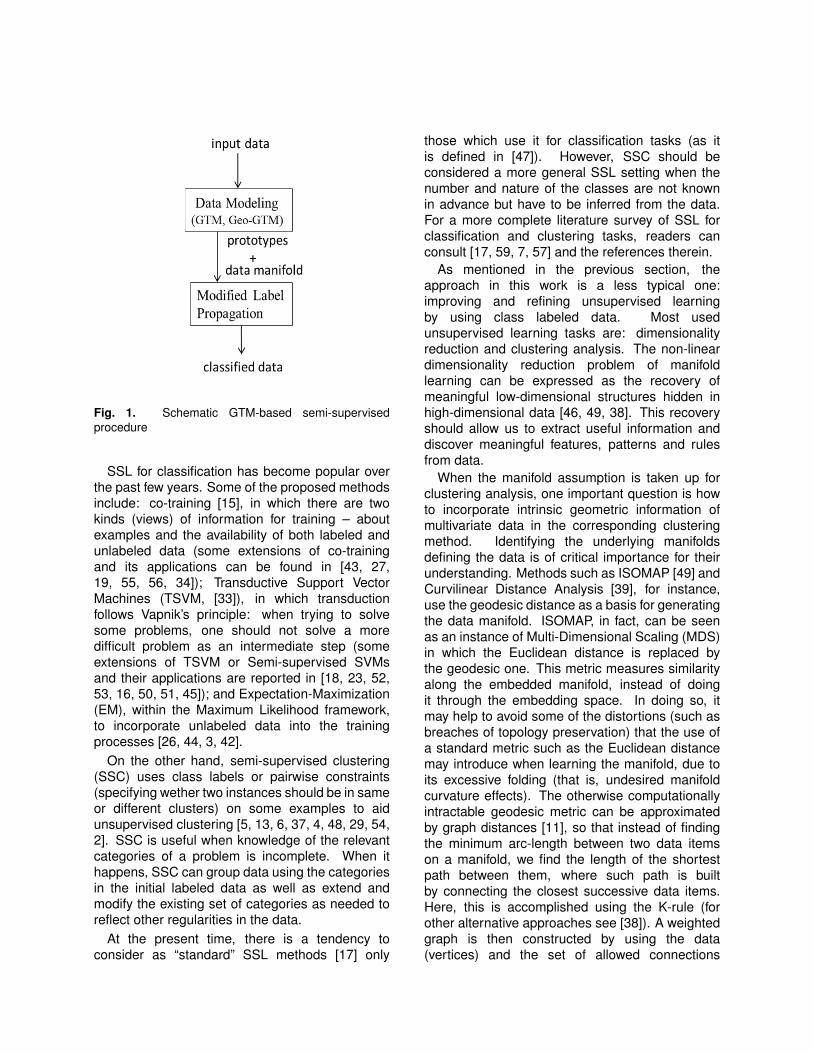
Fig. 1. Schematic GTM-based semi-supervisedprocedure
SSL for classification has become popular overthe past few years. Some of the proposed methodsinclude: co-training [15], in which there are twokinds (views) of information for training – aboutexamples and the availability of both labeled andunlabeled data (some extensions of co-trainingand its applications can be found in [43, 27,19, 55, 56, 34]); Transductive Support VectorMachines (TSVM, [33]), in which transductionfollows Vapnik’s principle: when trying to solvesome problems, one should not solve a moredifficult problem as an intermediate step (someextensions of TSVM or Semi-supervised SVMsand their applications are reported in [18, 23, 52,53, 16, 50, 51, 45]); and Expectation-Maximization(EM), within the Maximum Likelihood framework,to incorporate unlabeled data into the trainingprocesses [26, 44, 3, 42].
On the other hand, semi-supervised clustering(SSC) uses class labels or pairwise constraints(specifying wether two instances should be in sameor different clusters) on some examples to aidunsupervised clustering [5, 13, 6, 37, 4, 48, 29, 54,2]. SSC is useful when knowledge of the relevantcategories of a problem is incomplete. When ithappens, SSC can group data using the categoriesin the initial labeled data as well as extend andmodify the existing set of categories as needed toreflect other regularities in the data.
At the present time, there is a tendency toconsider as “standard” SSL methods [17] only
those which use it for classification tasks (as itis defined in [47]). However, SSC should beconsidered a more general SSL setting when thenumber and nature of the classes are not knownin advance but have to be inferred from the data.For a more complete literature survey of SSL forclassification and clustering tasks, readers canconsult [17, 59, 7, 57] and the references therein.
As mentioned in the previous section, theapproach in this work is a less typical one:improving and refining unsupervised learningby using class labeled data. Most usedunsupervised learning tasks are: dimensionalityreduction and clustering analysis. The non-lineardimensionality reduction problem of manifoldlearning can be expressed as the recovery ofmeaningful low-dimensional structures hidden inhigh-dimensional data [46, 49, 38]. This recoveryshould allow us to extract useful information anddiscover meaningful features, patterns and rulesfrom data.
When the manifold assumption is taken up forclustering analysis, one important question is howto incorporate intrinsic geometric information ofmultivariate data in the corresponding clusteringmethod. Identifying the underlying manifoldsdefining the data is of critical importance for theirunderstanding. Methods such as ISOMAP [49] andCurvilinear Distance Analysis [39], for instance,use the geodesic distance as a basis for generatingthe data manifold. ISOMAP, in fact, can be seenas an instance of Multi-Dimensional Scaling (MDS)in which the Euclidean distance is replaced bythe geodesic one. This metric measures similarityalong the embedded manifold, instead of doingit through the embedding space. In doing so, itmay help to avoid some of the distortions (such asbreaches of topology preservation) that the use ofa standard metric such as the Euclidean distancemay introduce when learning the manifold, due toits excessive folding (that is, undesired manifoldcurvature effects). The otherwise computationallyintractable geodesic metric can be approximatedby graph distances [11], so that instead of findingthe minimum arc-length between two data itemson a manifold, we find the length of the shortestpath between them, where such path is builtby connecting the closest successive data items.Here, this is accomplished using the K-rule (forother alternative approaches see [38]). A weightedgraph is then constructed by using the data(vertices) and the set of allowed connections
(edges). If the resulting graph is disconnected,some edges are added using a minimum spanningtree procedure in order to connect it. Finally,the distance matrix of the weighted undirectedgraph is obtained by repeatedly applying Dijkstra’salgorithm [25], which computes the shortest pathbetween all data items.
2.1 Standard and Geodesic GenerativeTopographic Mapping
The standard GTM is a generative non-linearlatent variable model that, in its original definition,was intended for modelling continuous, intrinsicallylow-dimensional data distributions, embeddedin high-dimensional spaces. It can also beunderstood both as a sound probabilisticalternative to the well-known and widely usedSelf-Organizing Maps (SOM: [36]) and as aconstrained mixture of distributions model. Itsconstraints make it less flexible than generalmixtures of distributions, but such renounceto flexibility is compensated by computationalexpediency and by data visualization capabilitiesakin to those of the SOM, which general mixturemodels lack. Like SOM, GTM is used forunsupervised clustering and visualization.
The GTM is a model of the manifold learningfamily defined as a mapping from a lowdimensional latent space onto the multivariatespace where observed data reside. Themapping is carried through by a number of basisfunctions generating a constrained mixture densitydistribution. It is defined as a generalized linearregression model:
y(u;w) = φ(u)W (1)
where φ are M basis functionsφ(u) = (φ1(u), ...,φM(u)). For continuous data ofdimension D, spherically symmetric Gaussians
φm(u) = exp{−1/2σ2‖u− µm‖2
}(2)
are an obvious choice of basis function, withcentres µm and common width σ; W is a M ×D matrix of adaptive weights wmd that definesthe mapping, and u is a point in latent space.To avoid computational intractability a regular gridof K points uk can be sampled from the latentspace. Each of them, which can be consideredas the representative of a data cluster, has a fixedprior probability p(uk) = 1/K and is mapped,
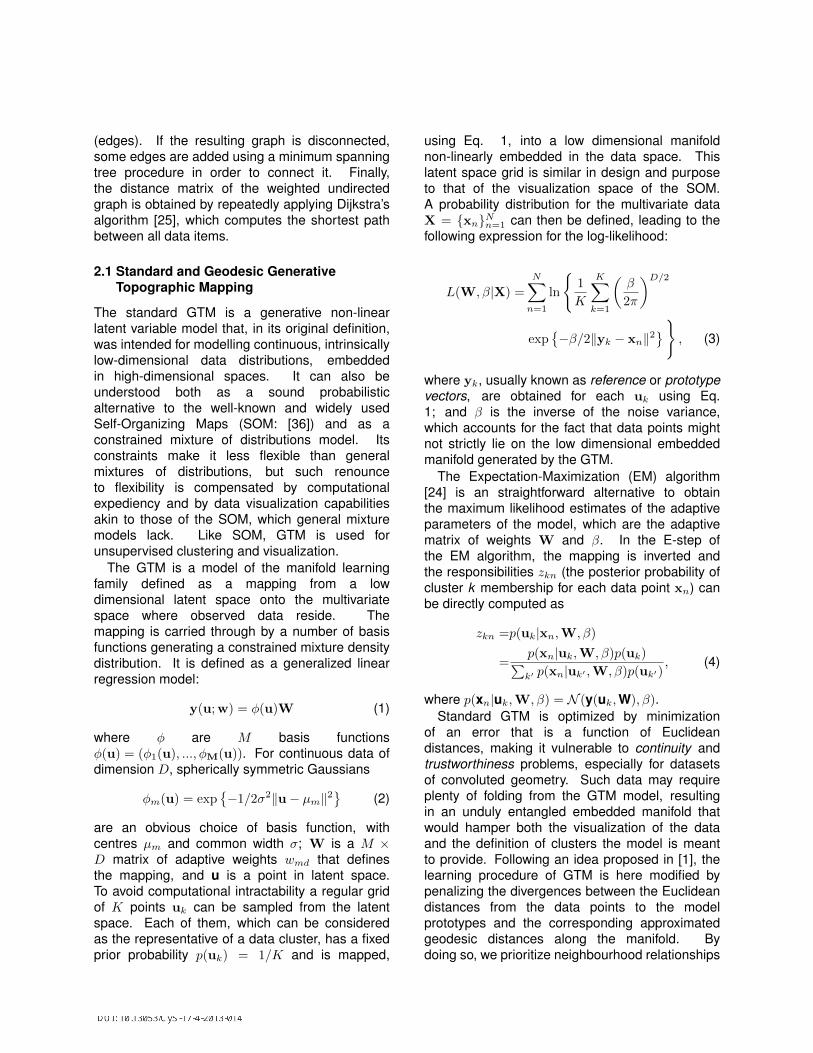
using Eq. 1, into a low dimensional manifoldnon-linearly embedded in the data space. Thislatent space grid is similar in design and purposeto that of the visualization space of the SOM.A probability distribution for the multivariate dataX = {xn}Nn=1 can then be defined, leading to thefollowing expression for the log-likelihood:
L(W,β|X) =
N∑n=1
ln
{1
K
K∑k=1
(β
2π
)D/2
exp{−β/2‖yk − xn‖2
}}, (3)
where yk, usually known as reference or prototypevectors, are obtained for each uk using Eq.1; and β is the inverse of the noise variance,which accounts for the fact that data points mightnot strictly lie on the low dimensional embeddedmanifold generated by the GTM.
The Expectation-Maximization (EM) algorithm[24] is an straightforward alternative to obtainthe maximum likelihood estimates of the adaptiveparameters of the model, which are the adaptivematrix of weights W and β. In the E-step ofthe EM algorithm, the mapping is inverted andthe responsibilities zkn (the posterior probability ofcluster k membership for each data point xn) canbe directly computed as
zkn =p(uk|xn,W,β)
=p(xn|uk,W,β)p(uk)∑k′ p(xn|uk′ ,W,β)p(uk′)
, (4)
where p(xn|uk,W,β) = N (y(uk,W),β).Standard GTM is optimized by minimization
of an error that is a function of Euclideandistances, making it vulnerable to continuity andtrustworthiness problems, especially for datasetsof convoluted geometry. Such data may requireplenty of folding from the GTM model, resultingin an unduly entangled embedded manifold thatwould hamper both the visualization of the dataand the definition of clusters the model is meantto provide. Following an idea proposed in [1], thelearning procedure of GTM is here modified bypenalizing the divergences between the Euclideandistances from the data points to the modelprototypes and the corresponding approximatedgeodesic distances along the manifold. Bydoing so, we prioritize neighbourhood relationships
between points along the generated manifold,which makes the model more robust to thepresence of off-manifold noise.
The Geo-GTM model is an extension of GTMthat favours the similarity of points along thelearned manifold, while penalizing the similarity ofpoints that are not contiguous in the manifold, evenif close in terms of the Euclidean distance. This isachieved by modifying the standard calculation ofthe responsibilities in Eq. 4 proportionally to thediscrepancy between the geodesic (approximatedby the graph) and the Euclidean distances. Suchdiscrepancy is made operational through thedefinition of the exponential distribution, as in [1]:
E(dg|de,α) =1
αexp
{−dg(xn,ym)− de(xn,ym)
α
},
(5)where de(xn,ym) and dg(xn,ym) are, in turn, theEuclidean and graph distances between data pointxn and the GTM prototype ym. Responsibilities areredefined as:
zgeomn = p(um|xn,W,β)
=p′(xn|um,W,β)p(um)∑m′ p′(xn|um′ ,W,β)p(um′)
, (6)
where
p′(xn|um,W,β)
= N (y(um,W),β)E(dg(xn,ym)2|de(xn,ym)2, 1).(7)
As for standard GTM, Geo-GTM providesdata visualization capabilities that the alternativeManifold Finite Gaussian Mixtures model proposedin [1] lacks.
3 Semi-Supervised GeodesicGenerative Topographic Mapping
In many of the databases generated in some ofthe currently most active areas of research, suchas, for instance, biomedicine, bioinformatics, orweb mining, class labels are either completely orpartially unavailable. As was stated in section 2,SSL methods can be developed to assist eitherclassification or clustering tasks mainly. The formertask is the purpose of the models described inthis section, but using a clustering method as abasis. That is, this section specifically concernsgraph-based methods that use, as a basis,generative unsupervised models for clustering andvisualization.
3.1 SS-Geo-GTM
The basic idea underlying the proposedsemi-supervised approach is that neighbouringpoints are most likely to share their label andthat these labels are best propagated throughneighbouring nodes according to proximity.Assuming that the Geo-GTM prototypes and thecorresponding constructed data manifold can beseen as a proximity graph, we modify an existinglabel propagation algorithm [58] to account for theinformation provided by the trained Geo-GTM. Theresult is the proposed semi-supervised Geo-GTM(SS-Geo-GTM, for short). An schematic procedureof SS-Geo-GTM is shown in Fig. 1.
The LP method is adapted to Geo-GTM asfollows. A label vector Lm ∈ [0, 1]k is firstassociated to each Geo-GTM prototype ym. Theselabel vectors can be considered as nodes in aproximity graph. The weights of the edges arederived from the graph distances dg betweenprototypes. For this, the prototypes are insertedand linked to the graph through the nearest datapoint. It is important to note that, in this process,empty clusters (that is, those associated to a givenprototype ym, to which no data point is assigned,or, in other words, those that do not bear amaximum of responsibility zgeomn for any data pointn) are omitted. The edge weight between nodes mand m′ is calculated as
wmm′ = exp(−d2g(m,m′)
σ2), (8)
where the σ parameter defines the level ofsparseness in the graph for label information. Onepossible choice for the value of this parameter isthe minimal inter-prototype distance. An alternativechoice is introduced and defined in [21] as themain reference inter-prototype (MRIP) distance,which is the graph distance dg(ym1,ym2) betweenthe two non-contiguous prototypes ym1,ym2 ofhighest Cumulative Responsibility (i.e., the sum ofresponsibilities over all data items in X, for eachcluster m, CRm =
∑Nn=1 z
geomn). The prototypes
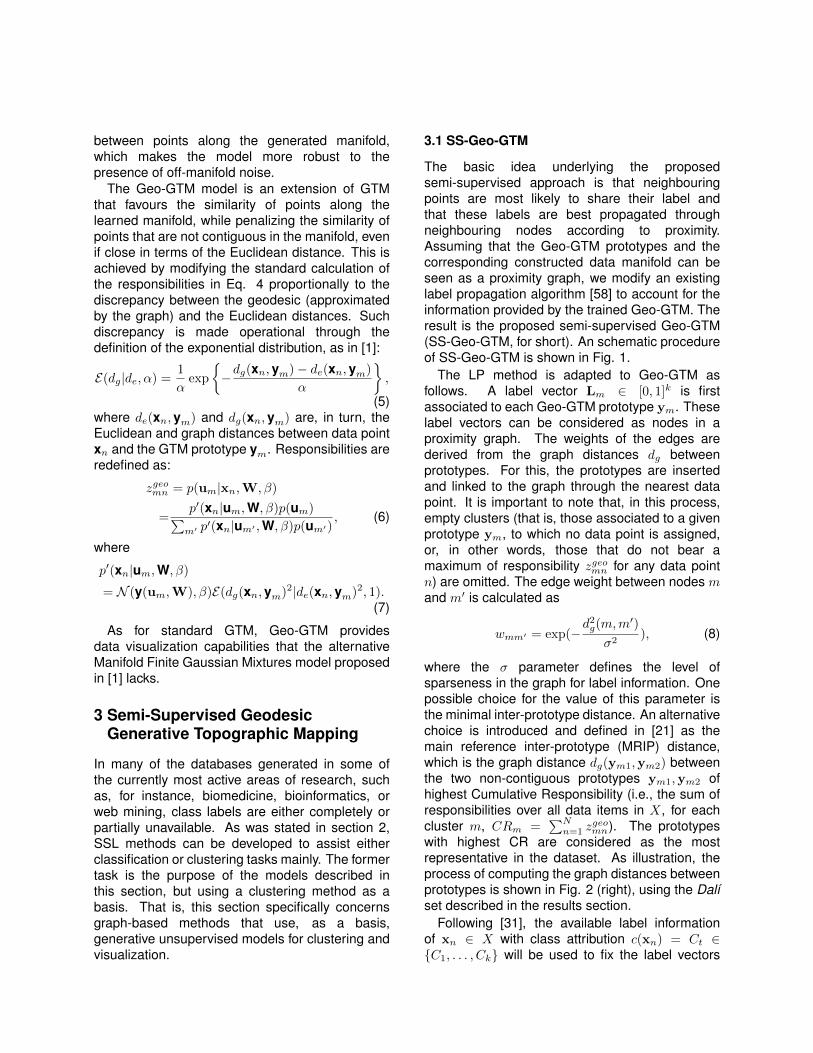
with highest CR are considered as the mostrepresentative in the dataset. As illustration, theprocess of computing the graph distances betweenprototypes is shown in Fig. 2 (right), using the Dalıset described in the results section.
Following [31], the available label informationof xn ∈ X with class attribution c(xn) = Ct ∈{C1, . . . ,Ck} will be used to fix the label vectors
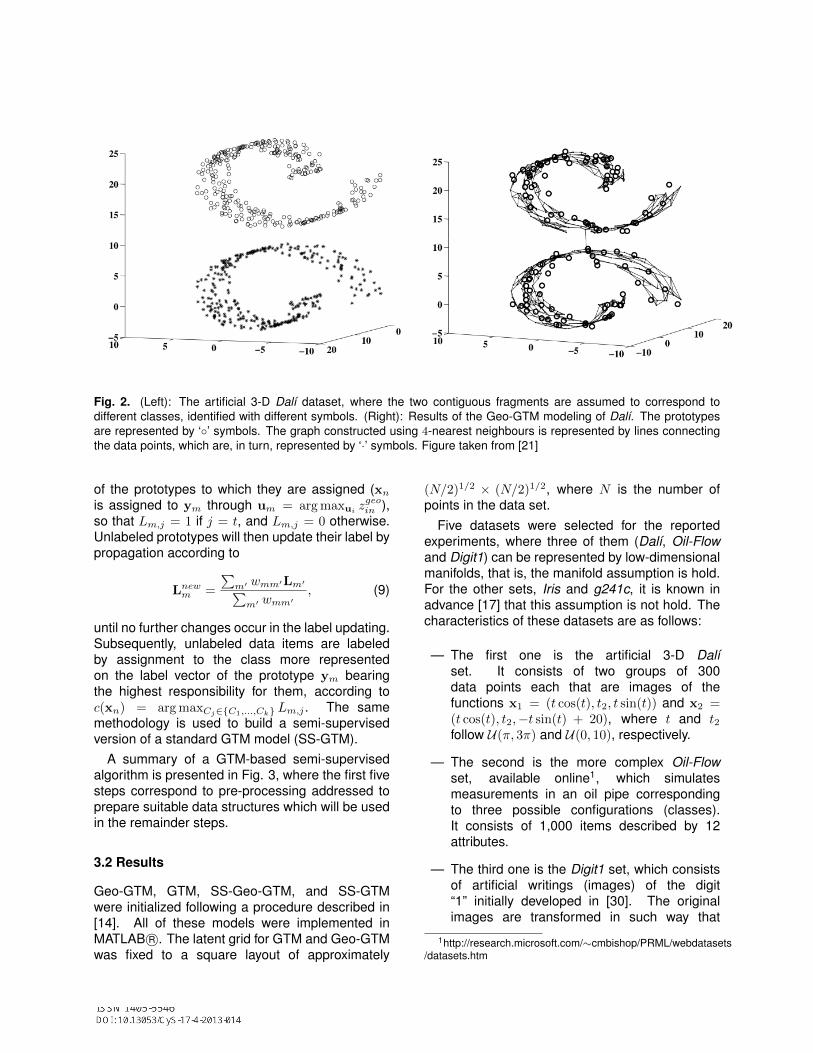
Fig. 2. (Left): The artificial 3-D Dalı dataset, where the two contiguous fragments are assumed to correspond todifferent classes, identified with different symbols. (Right): Results of the Geo-GTM modeling of Dalı. The prototypesare represented by ‘◦’ symbols. The graph constructed using 4-nearest neighbours is represented by lines connectingthe data points, which are, in turn, represented by ‘·’ symbols. Figure taken from [21]
of the prototypes to which they are assigned (xn
is assigned to ym through um = argmaxui zgeoin ),
so that Lm,j = 1 if j = t, and Lm,j = 0 otherwise.Unlabeled prototypes will then update their label bypropagation according to
Lnewm =
∑m′ wmm′Lm′∑
m′ wmm′, (9)
until no further changes occur in the label updating.Subsequently, unlabeled data items are labeledby assignment to the class more representedon the label vector of the prototype ym bearingthe highest responsibility for them, according toc(xn) = argmaxCj∈{C1,...,Ck} Lm,j . The samemethodology is used to build a semi-supervisedversion of a standard GTM model (SS-GTM).
A summary of a GTM-based semi-supervisedalgorithm is presented in Fig. 3, where the first fivesteps correspond to pre-processing addressed toprepare suitable data structures which will be usedin the remainder steps.
3.2 Results
Geo-GTM, GTM, SS-Geo-GTM, and SS-GTMwere initialized following a procedure described in[14]. All of these models were implemented inMATLAB R©. The latent grid for GTM and Geo-GTMwas fixed to a square layout of approximately
(N/2)1/2 × (N/2)1/2, where N is the number ofpoints in the data set.
Five datasets were selected for the reportedexperiments, where three of them (Dalı, Oil-Flowand Digit1) can be represented by low-dimensionalmanifolds, that is, the manifold assumption is hold.For the other sets, Iris and g241c, it is known inadvance [17] that this assumption is not hold. Thecharacteristics of these datasets are as follows:
— The first one is the artificial 3-D Dalıset. It consists of two groups of 300data points each that are images of thefunctions x1 = (t cos(t), t2, t sin(t)) and x2 =(t cos(t), t2,−t sin(t) + 20), where t and t2follow U(π, 3π) and U(0, 10), respectively.
— The second is the more complex Oil-Flowset, available online1, which simulatesmeasurements in an oil pipe correspondingto three possible configurations (classes).It consists of 1,000 items described by 12attributes.
— The third one is the Digit1 set, which consistsof artificial writings (images) of the digit“1” initially developed in [30]. The originalimages are transformed in such way that
1http://research.microsoft.com/∼cmbishop/PRML/webdatasets/datasets.htm
Fig. 3. GTM-based semi-supervised algorithm summary
they are rescaled, noise is added, and somedimensions are masked [17]. The final dataconsists of 1500 241-dimensional samples,which correspond to two classes.
— The fourth set is the well-known Irisdata, available from the UCI repository,which consists of 150 4-dimensional itemsrepresenting several measurements of Irisflowers, which belong to 3 different classes.
— The fifth set is g241c, where 241-dimensional750 points were drawn from each of twounit-variance isotropic Gaussians, the centersof which had a distance of 2.5 in a randomdirection. The class label of a point representsthe Gaussian it was drawn from. Digit1 andg241c are also available online2.
The central goal of the experiments is thecomparison of the performances of SS-Geo-GTM,SS-GTM, Laplacian Eigenmaps (LapEM [9])and semi-supervised Gaussian mixture Model(SS-GMM [41]) in terms of classification accuracyand Matthews correlation coefficient (MCC) [40] fordatasets where the manifold assumption is or nothold.
2http://olivier.chapelle.cc/ssl-book/benchmarks.html
We hypothesize that SS-GTM will yieldlower rates of classification accuracy inthe semi-supervised task than its geodesicdistance-based counterpart, especially fordatasets of convoluted geometry such as Dalıand Oil-Flow. LapEM was implemented inMATLAB R©and for SS-GMM a recent open sourceimplementation for R environment [12] was used.
Through several experiments shown in [21] isconcluded that the choice of the MRIP as avalue for σ is appropriate. Class labels wereavailable for all data points in the original fivedatasets. In order to evaluate the models ina semi-supervised setting, labels were thereforerandomly removed (thus becoming missing values)in every run of the experiments. In this setting,we evaluate the models in the most extremesemi-supervised setting, that is, when the classlabel is only available for a single input samplefor each class and the remaining samples areconsidered as unlabeled data. In the next step,the label availability condition is relaxed, and themodels are evaluated in the presence of higherratios of labels as well as in the presence of noise.
All datasets are first modeled using GTM andGeo-GTM. SS-GTM and SS-Geo-GTM are thenbuilt on top of these. The semi-supervised
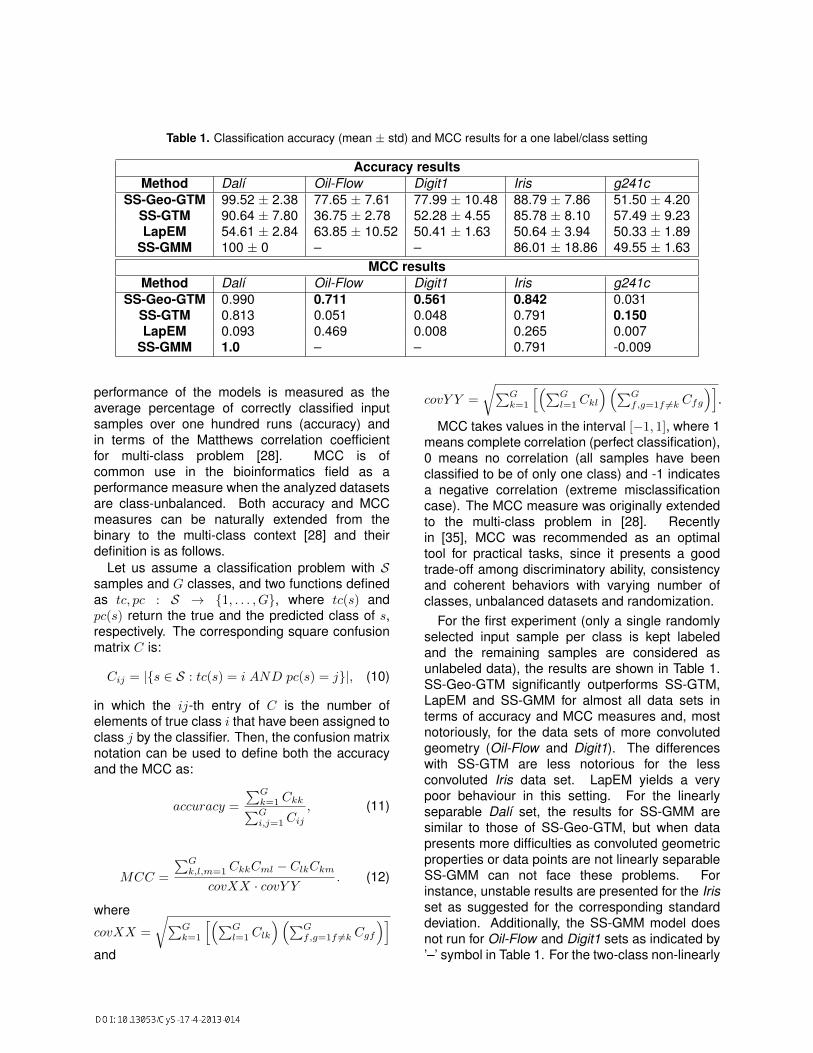
Table 1. Classification accuracy (mean ± std) and MCC results for a one label/class setting
Accuracy resultsMethod Dalı Oil-Flow Digit1 Iris g241c
SS-Geo-GTM 99.52 ± 2.38 77.65 ± 7.61 77.99 ± 10.48 88.79 ± 7.86 51.50 ± 4.20SS-GTM 90.64 ± 7.80 36.75 ± 2.78 52.28 ± 4.55 85.78 ± 8.10 57.49 ± 9.23LapEM 54.61 ± 2.84 63.85 ± 10.52 50.41 ± 1.63 50.64 ± 3.94 50.33 ± 1.89
SS-GMM 100 ± 0 – – 86.01 ± 18.86 49.55 ± 1.63MCC results
Method Dalı Oil-Flow Digit1 Iris g241cSS-Geo-GTM 0.990 0.711 0.561 0.842 0.031
SS-GTM 0.813 0.051 0.048 0.791 0.150LapEM 0.093 0.469 0.008 0.265 0.007
SS-GMM 1.0 – – 0.791 -0.009
performance of the models is measured as theaverage percentage of correctly classified inputsamples over one hundred runs (accuracy) andin terms of the Matthews correlation coefficientfor multi-class problem [28]. MCC is ofcommon use in the bioinformatics field as aperformance measure when the analyzed datasetsare class-unbalanced. Both accuracy and MCCmeasures can be naturally extended from thebinary to the multi-class context [28] and theirdefinition is as follows.
Let us assume a classification problem with Ssamples and G classes, and two functions definedas tc, pc : S → {1, . . . ,G}, where tc(s) andpc(s) return the true and the predicted class of s,respectively. The corresponding square confusionmatrix C is:
Cij = |{s ∈ S : tc(s) = i AND pc(s) = j}|, (10)
in which the ij-th entry of C is the number ofelements of true class i that have been assigned toclass j by the classifier. Then, the confusion matrixnotation can be used to define both the accuracyand the MCC as:
accuracy =
∑Gk=1 Ckk∑Gi,j=1 Cij
, (11)
MCC =
∑Gk,l,m=1 CkkCml − ClkCkm
covXX · covY Y. (12)
where
covXX =
√∑Gk=1
[(∑Gl=1 Clk
)(∑Gf ,g=1f 6=k Cgf
)]and
covY Y =
√∑Gk=1
[(∑Gl=1 Ckl
)(∑Gf ,g=1f 6=k Cfg
)].
MCC takes values in the interval [−1, 1], where 1means complete correlation (perfect classification),0 means no correlation (all samples have beenclassified to be of only one class) and -1 indicatesa negative correlation (extreme misclassificationcase). The MCC measure was originally extendedto the multi-class problem in [28]. Recentlyin [35], MCC was recommended as an optimaltool for practical tasks, since it presents a goodtrade-off among discriminatory ability, consistencyand coherent behaviors with varying number ofclasses, unbalanced datasets and randomization.
For the first experiment (only a single randomlyselected input sample per class is kept labeledand the remaining samples are considered asunlabeled data), the results are shown in Table 1.SS-Geo-GTM significantly outperforms SS-GTM,LapEM and SS-GMM for almost all data sets interms of accuracy and MCC measures and, mostnotoriously, for the data sets of more convolutedgeometry (Oil-Flow and Digit1). The differenceswith SS-GTM are less notorious for the lessconvoluted Iris data set. LapEM yields a verypoor behaviour in this setting. For the linearlyseparable Dalı set, the results for SS-GMM aresimilar to those of SS-Geo-GTM, but when datapresents more difficulties as convoluted geometricproperties or data points are not linearly separableSS-GMM can not face these problems. Forinstance, unstable results are presented for the Irisset as suggested for the corresponding standarddeviation. Additionally, the SS-GMM model doesnot run for Oil-Flow and Digit1 sets as indicated by’–’ symbol in Table 1. For the two-class non-linearly
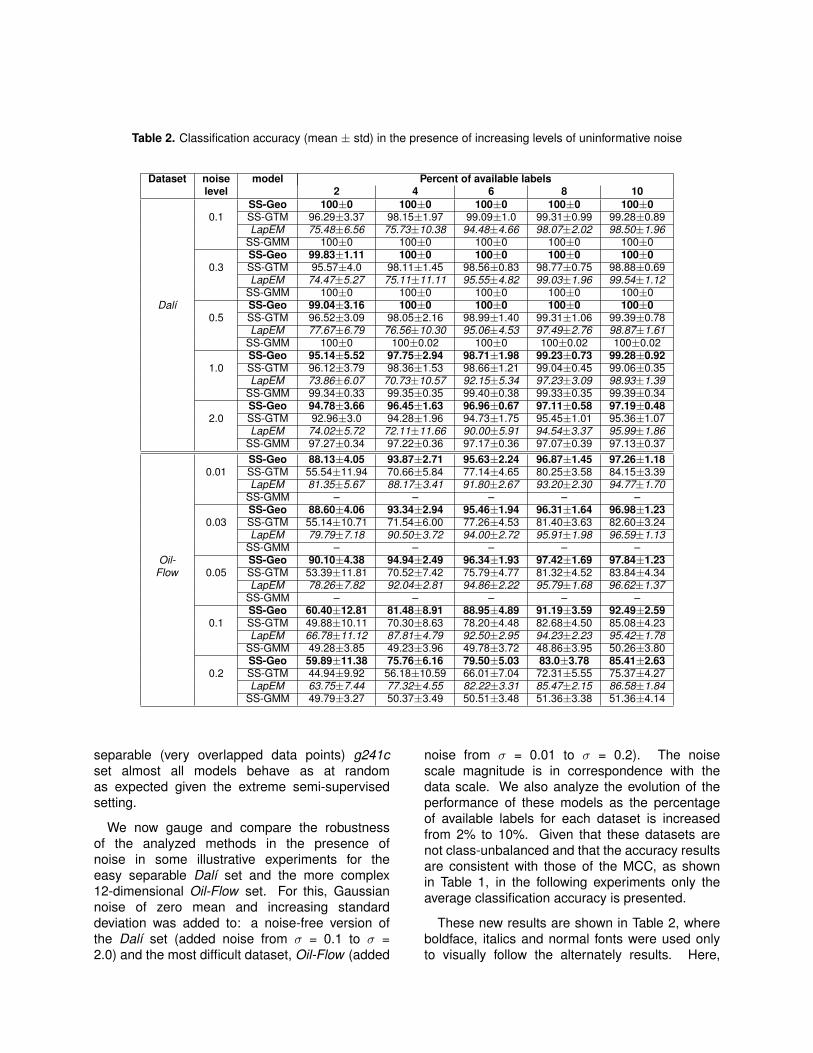
Table 2. Classification accuracy (mean ± std) in the presence of increasing levels of uninformative noise
Dataset noise model Percent of available labelslevel 2 4 6 8 10
SS-Geo 100±0 100±0 100±0 100±0 100±00.1 SS-GTM 96.29±3.37 98.15±1.97 99.09±1.0 99.31±0.99 99.28±0.89
LapEM 75.48±6.56 75.73±10.38 94.48±4.66 98.07±2.02 98.50±1.96SS-GMM 100±0 100±0 100±0 100±0 100±0SS-Geo 99.83±1.11 100±0 100±0 100±0 100±0
0.3 SS-GTM 95.57±4.0 98.11±1.45 98.56±0.83 98.77±0.75 98.88±0.69LapEM 74.47±5.27 75.11±11.11 95.55±4.82 99.03±1.96 99.54±1.12
SS-GMM 100±0 100±0 100±0 100±0 100±0Dalı SS-Geo 99.04±3.16 100±0 100±0 100±0 100±0
0.5 SS-GTM 96.52±3.09 98.05±2.16 98.99±1.40 99.31±1.06 99.39±0.78LapEM 77.67±6.79 76.56±10.30 95.06±4.53 97.49±2.76 98.87±1.61
SS-GMM 100±0 100±0.02 100±0 100±0.02 100±0.02SS-Geo 95.14±5.52 97.75±2.94 98.71±1.98 99.23±0.73 99.28±0.92
1.0 SS-GTM 96.12±3.79 98.36±1.53 98.66±1.21 99.04±0.45 99.06±0.35LapEM 73.86±6.07 70.73±10.57 92.15±5.34 97.23±3.09 98.93±1.39
SS-GMM 99.34±0.33 99.35±0.35 99.40±0.38 99.33±0.35 99.39±0.34SS-Geo 94.78±3.66 96.45±1.63 96.96±0.67 97.11±0.58 97.19±0.48
2.0 SS-GTM 92.96±3.0 94.28±1.96 94.73±1.75 95.45±1.01 95.36±1.07LapEM 74.02±5.72 72.11±11.66 90.00±5.91 94.54±3.37 95.99±1.86
SS-GMM 97.27±0.34 97.22±0.36 97.17±0.36 97.07±0.39 97.13±0.37SS-Geo 88.13±4.05 93.87±2.71 95.63±2.24 96.87±1.45 97.26±1.18
0.01 SS-GTM 55.54±11.94 70.66±5.84 77.14±4.65 80.25±3.58 84.15±3.39LapEM 81.35±5.67 88.17±3.41 91.80±2.67 93.20±2.30 94.77±1.70
SS-GMM – – – – –SS-Geo 88.60±4.06 93.34±2.94 95.46±1.94 96.31±1.64 96.98±1.23
0.03 SS-GTM 55.14±10.71 71.54±6.00 77.26±4.53 81.40±3.63 82.60±3.24LapEM 79.79±7.18 90.50±3.72 94.00±2.72 95.91±1.98 96.59±1.13
SS-GMM – – – – –Oil- SS-Geo 90.10±4.38 94.94±2.49 96.34±1.93 97.42±1.69 97.84±1.23
Flow 0.05 SS-GTM 53.39±11.81 70.52±7.42 75.79±4.77 81.32±4.52 83.84±4.34LapEM 78.26±7.82 92.04±2.81 94.86±2.22 95.79±1.68 96.62±1.37
SS-GMM – – – – –SS-Geo 60.40±12.81 81.48±8.91 88.95±4.89 91.19±3.59 92.49±2.59
0.1 SS-GTM 49.88±10.11 70.30±8.63 78.20±4.48 82.68±4.50 85.08±4.23LapEM 66.78±11.12 87.81±4.79 92.50±2.95 94.23±2.23 95.42±1.78
SS-GMM 49.28±3.85 49.23±3.96 49.78±3.72 48.86±3.95 50.26±3.80SS-Geo 59.89±11.38 75.76±6.16 79.50±5.03 83.0±3.78 85.41±2.63
0.2 SS-GTM 44.94±9.92 56.18±10.59 66.01±7.04 72.31±5.55 75.37±4.27LapEM 63.75±7.44 77.32±4.55 82.22±3.31 85.47±2.15 86.58±1.84
SS-GMM 49.79±3.27 50.37±3.49 50.51±3.48 51.36±3.38 51.36±4.14
separable (very overlapped data points) g241cset almost all models behave as at randomas expected given the extreme semi-supervisedsetting.
We now gauge and compare the robustnessof the analyzed methods in the presence ofnoise in some illustrative experiments for theeasy separable Dalı set and the more complex12-dimensional Oil-Flow set. For this, Gaussiannoise of zero mean and increasing standarddeviation was added to: a noise-free version ofthe Dalı set (added noise from σ = 0.1 to σ =2.0) and the most difficult dataset, Oil-Flow (added
noise from σ = 0.01 to σ = 0.2). The noisescale magnitude is in correspondence with thedata scale. We also analyze the evolution of theperformance of these models as the percentageof available labels for each dataset is increasedfrom 2% to 10%. Given that these datasets arenot class-unbalanced and that the accuracy resultsare consistent with those of the MCC, as shownin Table 1, in the following experiments only theaverage classification accuracy is presented.
These new results are shown in Table 2, whereboldface, italics and normal fonts were used onlyto visually follow the alternately results. Here,
the geodesic variant SS-Geo-GTM consistentlyoutperforms SS-GTM (and LapEM) across datasets and noise levels, with few exceptions. Therobustness of the semi-supervised procedure forSS-GTM is surprisingly good, though. For the morecomplex Oil-Flow set, both models deterioratesignificantly at high noise levels. Overall, theseresults indicate that the resilience of the modelsis mostly due to the inclusion of the geodesicmetric and not to the semi-supervised procedureitself. It is worth noting that, in general, theresults for LapEM only become comparable as thepercentage of available labels increases. As inTable 1, SS-GMM results are similar to those ofSS-Geo-GTM for the Dalı set across noise levels.For Oil-Flow set, SS-GMM only can be run for thehighest noise levels, where a poor performance isobtained. Furthermore, no benefit is shown whenthe percentage of label availability is increased.
4 Conclusions and Future Work
The ultimate goal of this thesis was thedevelopment of novel generative manifold learningmethods for the exploration of partially labeleddata. The first contribution is the definition ofGeo-GTM as a principled extension of GTMto uncover underlying structures in convoluteddatasets. The second one is the definitionof SS-Geo-GTM as a principled extensionof Geo-GTM to semi-supervised problems.Through several experiments, the performanceof SS-Geo-GTM has been assessed, in termsof classification accuracy and MCC, and it hasbeen shown to be consistently better than thatof the semi-supervised version of the standardGTM, even in the presence of high levels of noise.Its performance has also been compared to thatof LapEM and SS-GMM in several datasets. Ithas been shown that SS-Geo-GTM significantlyoutperforms LapEM for all data sets and noiselevels, with few exceptions. Furthermore, it hasbeen reported that for datasets which presentconvoluted geometric properties or when datapoints are not linearly separable, SS-GMM obtainspoor performance compared to SS-Geo-GTM.
As future work, a semi-supervised extensionof Geo-GTM using pairwise constraints shouldbe defined in order to deal with semi-supervisedclustering tasks.
Acknowledgements
R. Cruz-Barbosa acknowledges the MexicanSecretariat of Public Education (SEP-PROMEPprogram) for his PhD grant.
References
1. Archambeau, C. & Verleysen, M. (2005). Manifoldconstrained finite gaussian mixtures. In Cabestany,J., Prieto, A., & Sandoval, D. F., editors, Procs.of IWANN, volume LNCS 3512. Springer-Verlag,820–828.
2. Baghshah, M. S. & Shouraki, S. B. (2010).Kernel-based metric learning for semi-supervisedclustering. Neurocomputing, 73, 1352–1361.
3. Baluja, S. (1998). Probabilistic modeling for faceorientation discrimination: learning from labeled andunlabeled data. In Neural Information ProcessingSystems. 854–860.
4. Basu, S. (2005). Semi-supervised Clustering:Probabilistic Models, Algorithms and Experiments.Ph.D. thesis, The University of Texas at Austin,U.S.A.
5. Basu, S., Banerjee, A., & Mooney, R. J. (2002).Semi-supervised clustering by seeding. In Proc.of the 19th International Conference on MachineLearning.
6. Basu, S., Bilenko, M., & Mooney, R. J. (2004).A probabilistic framework for semi-supervisedclustering. In Proc. of the 10th ACM SIGKDDInternational Conference on Knowledge Discoveryand Data Mining, KDD’04. 59–68.
7. Basu, S., Davidson, I., & Wagstaff, K., editors(2009). Constrained Clustering: Advances inAlgorithms, Theory and Applications. Chapman &Hall/CRC Press.
8. Belkin, M. & Niyogi, P. (2002). Usingmanifold structure for partially labelled classification.In Advances in Neural Information ProcessingSystems (NIPS) 15.
9. Belkin, M. & Niyogi, P. (2003). Laplacianeigenmaps for dimensionality reduction and datarepresentation. Neural Computation, 15(6),1373–1396.
10. Belkin, M. & Niyogi, P. (2004). Semi-supervisedlearning on Riemannian manifolds. MachineLearning, 56, 209–239.
11. Bernstein, M., de Silva, V., Langford, J., &Tenenbaum, J. (2000). Graph approximationsto geodesics on embedded manifolds. Technicalreport, Stanford University, CA, U.S.A.
12. Biecek, P., Szczurek, E., Vingron, M., & Tiuryn, J.(2012). The R package bgmm: mixture modelingwith uncertain knowledge. Journal of StatisticalSoftware, 47(3), 1–31.
13. Bilenko, M., Basu, S., & Mooney, R. J.(2004). Integrating constraints and metric learningin semi-supervised clustering. In Proc. of the 21stInternational Conference on Machine Learning.
14. Bishop, C. M., Svensen, M., & Williams, C. K. I.(1998). The Generative Topographic Mapping.Neural Computation, 10(1), 215–234.
15. Blum, A. & Mitchell, T. (1998). Combining labeledand unlabeled data with co-training. In Procs. of the11th Annual Conference on Computational LearningTheory (COLT 98). 92–100.
16. Chapelle, O., Chi, M., & Zien, A. (2006). Acontinuation method for semi-supervised SVMs.In Proc. of the 23rd International Conference onMachine Learning (ICML 2006).
17. Chapelle, O., Scholkopf, B., & Zien, A., editors(2006). Semi-Supervised Learning. The MIT Press.
18. Chapelle, O., Sindhwani, V., & Keerthi,S. S. (2008). Optimization techniques forsemi-supervised support vector machines. Journalof Machine Learning Research, 9, 203–233.
19. Chawla, N. & Karakoulas, G. (2005). Learningfrom labeled and unlabeled data: an empirical studyacross techniques and domains. Journal of ArtificialIntelligence Research, 23, 331–366.
20. Cruz-Barbosa, R. & Vellido, A. (2008). GeodesicGenerative Topographic Mapping. In Geffner, H.,Prada, R., Alexandre, I., & David, N., editors,Proceedings of the 11th Ibero-American Conferenceon Artificial Intelligence (IBERAMIA 2008), volume5290 of LNAI. Springer, 113–122.
21. Cruz-Barbosa, R. & Vellido, A. (2010).Semi-supervised geodesic generative topographicmapping. Pattern Recogn Lett, 31, 202–209.
22. Cruz-Barbosa, R. & Vellido, A. (2011).Semi-supervised analysis of human brain tumoursfrom partially labeled MRS information, usingmanifold learning models. Int J Neural Syst, 21,17–29.
23. De Bie, T. & Cristianini, N. (2004). Convexmethods for transduction. In Thrun, S., Saul, L., &Scholkopf, B., editors, Proc. of Advances in NeuralInformation Processing Systems 16. MIT Press.
24. Dempster, A. P., Laird, N. M., & Rubin, D. B.(1977). Maximum likelihood from incomplete datavia the EM algorithm. Journal of the Royal StatisticalSociety B, 39, 1–38.
25. Dijkstra, E. W. (1959). A note on two problems inconnection with graphs. Numerische Mathematik, 1,269–271.
26. Ghahramani, Z. & Jordan, M. I. (1994). Supervisedlearning from incomplete data via the EM approach.In Advances in Neural Information ProcessingSystems 6. 120–127.
27. Goldman, S. & Zhou, Y. (2000). Enhancingsupervised learning with unlabeled data. In Proc.of the 17th International Conference on MachineLearning. Morgan Kaufmann, 327–334.
28. Gorodkin, J. (2004). Comparing two K-categoryassignments by a K-category correlation coefficient.Computational Biology and Chemistry, 28, 367–374.
29. Grira, N., Crucianu, M., & Boujemaa, N. (2008).Active semi-supervised fuzzy clustering. PatternRecognition, 41, 1834–1844.
30. Hein, M. & Audibert, J. Y. (2005). Intrinsicdimensionality estimation of submanifolds in Rd. InProceedings of the 22nd International Conferenceon Machine Learning. 289–296.
31. Herrmann, L. & Ultsch, A. (2007). Labelpropagation for semi-supervised learning inself-organizing maps. In Procs. of the 6th WSOM2007.
32. Jain, A. K. & Dubes, R. C. (1998). Algorithms forClustering Data. Prentice Hall, New Jersey.
33. Joachims, T. (1999). Transductive inference fortext classification using support vector machines.In Procs. of the 16th International Conference onMachine Learning (ICML-99). 200–209.
34. Jones, R. (2005). Learning to extract entities fromlabeled and unlabeled text. Doctoral DissertationCMU-LTI-05-191, Carnegie Mellon University.
35. Jurman, G., Riccadonna, S., & Furlanello, C.(2012). A comparison of MCC and CEN errormeasures in multi-class prediction. PLoS ONE, 7(8),e41882.
36. Kohonen, T. (1995). Self-Organizing Maps.Springer-Verlag, Berlin.
37. Kulis, B., Basu, S., Dhillon, I. S., & Mooney,R. J. (2005). Semi-supervised graph clustering: akernel approach. In Proc. of the 22nd InternationalConference on Machine Learning. 457–464.
38. Lee, J. & Verleysen, M. (2007). NonlinearDimensionality Reduction. Springer.
39. Lee, J. A., Lendasse, A., & Verleysen, M. (2002).Curvilinear distance analysis versus isomap. InProcs. of European Symposium on Artificial NeuralNetworks (ESANN). 185–192.
40. Matthews, B. (1975). Comparison of the predictedand observed secondary structure of T4 phagelysozyme. Biochimica et Biophysica Acta - ProteinStructure, 405, 442–451.
41. Miller, D. J. & Uyar, H. S. (1997). A mixtureof experts classifier with learning based on bothlabelled and unlabelled data. In Neural InformationProcessing Systems (NIPS) 9. 571–577.
42. Nigam, K. (2001). Using unlabeled data toimprove text classification. Doctoral DissertationCMU-CS-01-126, Carnegie Mellon University.
43. Nigam, K. & Ghani, R. (2000). Analyzing theeffectiveness and applicability of co-training. InNinth International Conference on Information andKnowledge Management. 86–93.
44. Nigam, K., McCallum, A., Thrun, S., & Mitchell,T. (2000). Text classification from labeled andunlabeled documents using EM. Machine Learning,39, 103–134.
45. Pozdnoukhov, A. & Kanevski, M. (2008).Geokernels: Modeling of spatial data ongeomanifolds. In Proc. of the 16th EuropeanSymposium on Artificial Neural Networks (ESANN2008). 277–282.
46. Roweis, S. T. & Saul, L. K. (2000). Nonlineardimensionality reduction by locally linearembedding. Science, 290, 2323–2326.
47. Seeger, M. (2000). Learning with labeled andunlabeled data. Technical report, Institute for ANC,Edinburgh, UK.
48. Tang, W., Xiong, H., Zhong, S., & Wu, J. (2007).Enhancing semi-supervised clustering: a featureprojection perspective. In Proc. of the 13th ACMSIGKDD International conference on Knowledgediscovery and data mining, KDD’07. 707–716.
49. Tenenbaum, J. B., de Silva, V., & Langford, J. C.(2000). A global geometric framework for nonlineardimensionality reduction. Science, 290, 2319–2323.
50. Wang, J. & Shen, X. (2007). Large marginsemi-supervised learning. Journal of MachineLearning Research, 8, 1867–1891.
51. Weston, J., Leslie, C., Ie, E., Zhou, D., Elisseeff,A., & Noble, W. S. (2005). Semi-supervised proteinclassification using cluster kernels. Bioinformatics,21, 3241–3247.
52. Xu, L. & Schuurmans, D. (2005). Unsupervisedand semi-supervised multi-class support vectormachines. In Proc. of the 20th National Conferenceon Artificial Intelligence (AAAI 2005).
53. Xu, Z., Jin, R., Zhu, J., King, I., & Lyu, M.(2008). Efficient convex relaxation for transductivesupport vector machine. In Platt, J. C., Koller,
D., Singer, Y., & Roweis, S., editors, Advancesin Neural Information Processing Systems 20. MITPress, 1641–1648.
54. Yin, X., Chen, S., Hu, E., & Zhang, D. (2010).Semi-supervised clustering with metric learning: Anadaptive kernel method. Pattern Recognition, 43,1320–1333.
55. Zhou, Y. & Goldman, S. (2004). Democraticco-learning. In Proc. of the 16th IEEE InternationalConference on Tools with Artificial Intelligence(ICTAI 2004). 594–602.
56. Zhou, Z. H. & Li, M. (2005). Tri-training: exploitingunlabeled data using three classifiers. IEEETransactions on Knowledge and Data Engineering,17(11), 1529–1541.
57. Zhu, X. (2007). Semi-supervised learning literaturesurvey. Technical Report TR 1530, University ofWisconsin – Madison.
58. Zhu, X. & Ghahramani, Z. (2002). Learning fromlabeled and unlabeled data with label propagation.Technical report, CMU-CALD-02-107, CarnegieMellon University.
59. Zhu, X. & Goldberg, A. B. (2009). Introductionto Semi-Supervised Learning. Morgan & ClaypoolPublishers.
Raul Cruz-Barbosa receivedhis B.S. and M. Sc degreefrom the computer sciencedepartment of the AutonomousUniversity of Puebla (Mexico) in1999 and 2002, respectively. Hecompleted his PhD in ArtificialIntelligence at Technical
University of Catalonia (Spain) in 2009. He isan associate professor at Technological Universityof the Mixteca Region (UTM), since 1999, wherehe has been coordinator of both the appliedcomputing technologies master program and thepattern recognition group. His research interestsare related to machine learning (semi-supervisedlearning, mainly) and digital image processingtechniques applied to pattern recognition as wellas computer aided detection and diagnosis (ofmedical images). He is a member of the MexicanNational System of Researchers (SNI) of theNational Council for Science and Technology(CONACYT).
Alfredo Vellido received hisdegree in Physics from theDepartment of Electronicsand Automatic Control ofthe University of the BasqueCountry (Spain) in 1996. Hecompleted his PhD in NeuralComputation at Liverpool John
Moores University (UK) in 2000. Following aRamon y Cajal research fellowship, he is currentlyassistant professor at Technical University ofCatalonia in Barcelona, Spain. Research interests
include, but are not limited to, pattern recognition,machine learning and data mining, as well as theirapplication in biomedicine, business, ecology, ande-learning, on which subjects he has publishedwidely. He is currently member of the IEEESystems, Man & Cybernetics Society SpanishChapter and the Task Force on Medical DataAnalysis in the IEEE-CIS Data Mining TechnicalCommittee.
Article received on 23/12/2011; accepted on 18/06/2013.