Embed Size (px)
Citation preview

Genes Involved in Plant Stress Response and Evolution of their
Responsiveness
Cheng Zou
11/09/2007

The Stress Response is Unique and Vital to Plants
Soybean aphid, Aphis glycines (Photo Claudio Gratton)
Different from animals, when exposed to adverse environments, plant can not run away. So along evolution plant developed a specific system to fight against them. There are two main sources of stress, one is biotic, such as invasion of bacterium, fungi; another one is abiotic, such as cold, drought and heat. Based on the AtGenExpress experiments in Arabidopsis, of 22110 genes which are presented on the micro array, 37% genes are up or down regulated significantly by at least one stress condition. So we are interested in what kind of genes tend to have stress responsiveness and how gene function in stress response evolved

Arabidopsis Expression profile under stress condition
Type of stress
Abiotic stress
Osmotic
UV-B
Wounding
Cold4C
Heat
Genotoxic
Drought
Salt
Oxidative
Biotic stress
avrRpm1
DC3000
Flg22
GST-NPP1
HrcC-
HrpZ
LPS
P-infestans
Psph
For each condition, Up- and down-regulated genes were defined as genes with significantly higher and lower intensities (at 5% false discovery rate) with treated samples than those in controls. Non-responsive genes were defined
as genes that were not significantly up- or down-regulated.
time series
2 or 3 replicates control

Number of Up or Down regulated gene under each condition
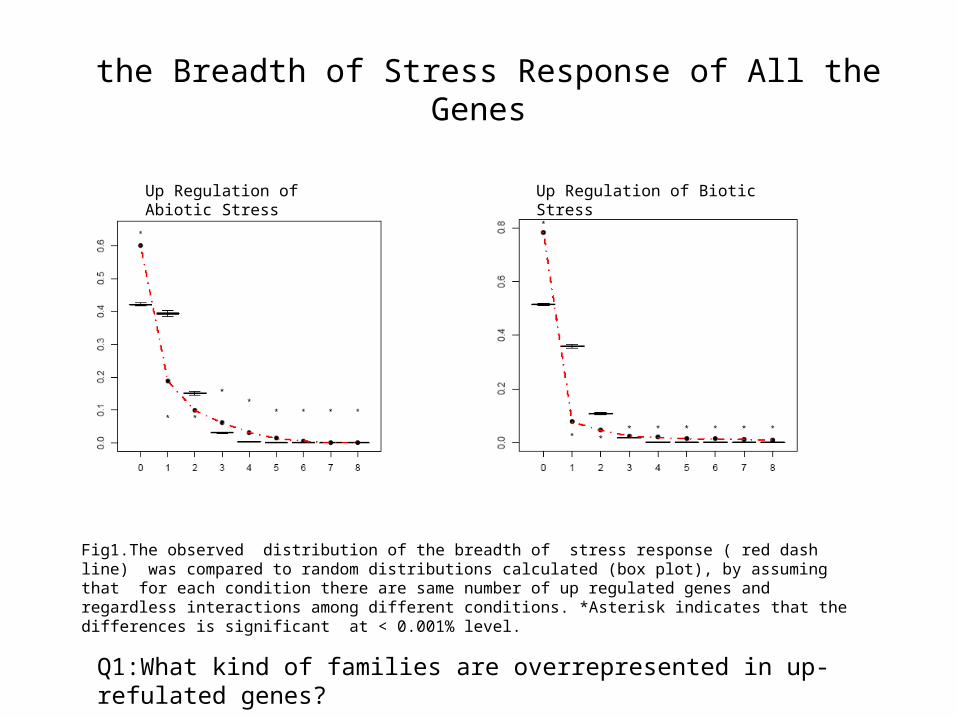
the Breadth of Stress Response of All the Genes
Q1:What kind of families are overrepresented in up-refulated genes?
Up Regulation of Abiotic Stress
Fig1.The observed distribution of the breadth of stress response ( red dash line) was compared to random distributions calculated (box plot), by assuming that for each condition there are same number of up regulated genes and regardless interactions among different conditions. *Asterisk indicates that the differences is significant at < 0.001% level.
Up Regulation of Biotic Stress

the Breadth of Stress Response of Domain Family
Fig2.The observed distribution of the breadth of domain (dash line) was compared to random distributions calculated (box plot), by assuming that for each condition there are same number of domain families that over or underrepresented in up regulated genes, and regardless interactions among different conditions. *Asterisk indicates that the differences is significant at < 0.001% level.
Up Regulation of Abiotic Stress
Up Regulation of Biotic Stress
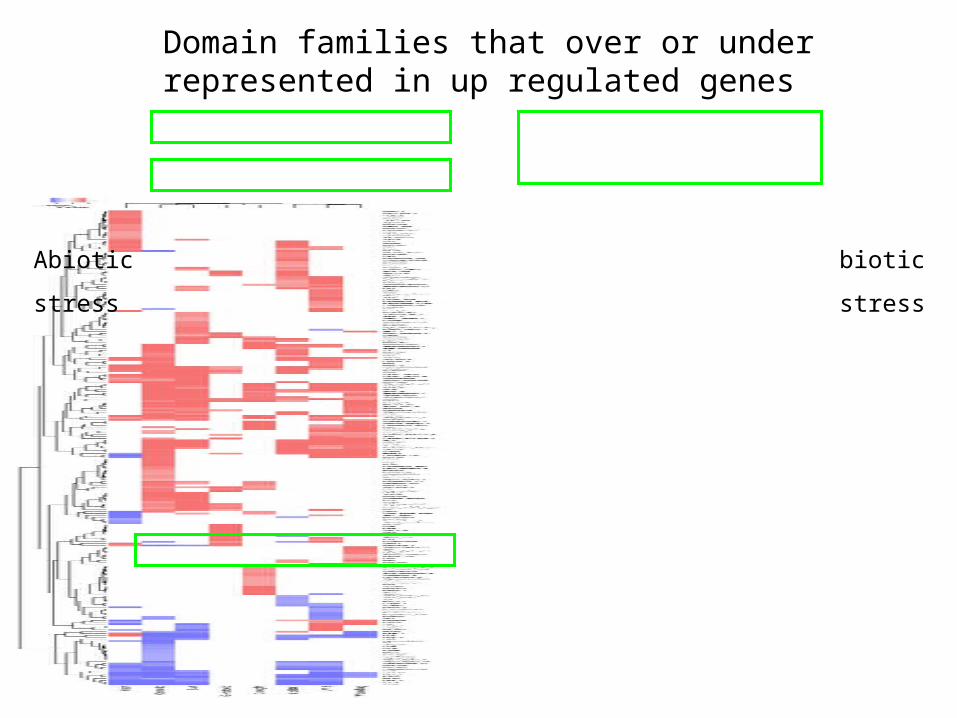
Domain families that over or under represented in up regulated genes
Abiotic
stress
biotic
stress


Evolution of Stress Response


![Evolutionary History and Stress Regulation of PlantEvolutionary History and Stress Regulation of Plant Receptor-Like Kinase/Pelle Genes1[W][OA] Melissa D. Lehti-Shiu, Cheng Zou, Kousuke](https://img.pdfslide.net/doc/110x75/60295fc008594a2bba0a8ef9/evolutionary-history-and-stress-regulation-of-evolutionary-history-and-stress-regulation.jpg)