Embed Size (px)
Citation preview
23
GENETIC DIVERSITY IN INTRODUCED CASSAVA USING INTER SIMPLE
SEQUENCE REPEAT MARKERS (ISSRs)
BY
Zayed,E.M.1, A.S. Shams
2 and A.S. Kamel
2
1
Forage Crops Research Department (FCRD), Field Crops Research Institute (FCRI), Agricultural
Research Center (ARC), Giza, Egypt.
2 Cassava Project (CP), Crop Intensification Research Department (CIRD), Field Crops Research
Institute (FCRI), Agricultural Research Center (ARC), Giza, Egypt.
Geneconserve: 12 (47) - 23:33
ABSTRACT
Four Introduced genotypes of cassava were used in the present study, Indonesian,
Brazilian, Thai (Rayong 60) and Thai (Huay Bong 60) cassava genotypes. Ten primers for ISSR were
successful in generating reproducible and reliable amplicons for the four the imported cassava
genotypes. The aim of this study was to measure genetic distance and to generate molecular
profile for imported cassava using ISSR markers. The total number of bands from the ten primers
was 79 bands; distributed as 43 polymorphic bands and 36 monomorphic bands. The nine unique
bands were given from interaction among ten primers ISSR and four cassava genotypes. The
polymorphism level was differing from primer to another reflecting the primer ability to detect the
diversity between cassava genotypes. The 14A ISSR-primer revealed higher level of
polymorphism than the rest of ISSR primers followed by 98A which produced 80% polymorphism.
The lowest polymorphism was produced by HB09 followed by HB14 with values 17 and 25. The
highest value was similarity between Brazilian Cassava and Thai Cassava (Huay Bong 60)
(82.3%) followed by Thai Cassava (Rayong 60) and Thai Cassava (Huay Bong 60) (81.1%) then
Brazilian Cassava and Thai Cassava (Rayong 60) (81%). The lowest similarity value appeared
between Indonesian Cassava and Brazilian Cassava (75%) followed by Thai Cassava (Rayong
60) and Indonesian Cassava (75.4%). The far genetic distance is between Indonesian Cassava
and Thai Cassava (Huay Bong 60).
Key words: Cassava, ISSR, Genetic Diversity.
INTRODUCTION
Cassava is regarded as one of the most important staple crops and food for about 800
million people in tropics and sub tropics (FAO, 2007). It contributes to the world food supply in
24
many ways either as eaten roots for human and animals or as starch or flour. Cassava starch is
used in food industry too. Cassava (Manihot esculenta Grantz) belongs to the family
Euphorbiaceae, which are characterized by lactiferous vessels composed of secretory cells. Its
relatives in the euphorbiaceae family include several commercially important plants, such as
rubber trees (Heveabrasiliensis), castor oil plants (Ricinuscomunis) and ornamental plants
(Euphorbia spp.). It’s believed that cassava originated by hybridization between two wild Manihot
species, followed by vegetative reproduction of the hybrid. The center of origin of cassava was
first reported to be Central America including Colombia, Venezuela, Guatemala and Southern
Mexico due to the large number of genotypes present there (Sauer, 1952 and Roger, 1965).
Cassava is generally propagated with stem cuttings, thereby maintaining a
genotype.Under natural conditions as well as in plant breeding, propagation by seed is common
and farmers in Africa are known to occasional use of spontaneous seedlings for subsequent
planting (Silvestre and Arraudeaus, 1983).Cassava generally has a diploid genome (2n=36).
However, some authors have described it as a segmental allotetraploid with basic chromosome
number x=9. (Jos and Nair, 1979).
A lot of 1000 cassava seeds was introduced by the senior author from Brazil in 1986 to
Egypt. Growing plants were subjected to selection through 12 consecutive years, and resulted in
selecting two clones that were productive. One of these clones was used in intercropping trials
with groundnut in sandy soil of Northern Egypt region, a typical temperate climate. A high
productivity of intercropped cassava was achieved. It reached 21 t fed-1
i.e., 49.98 t ha-1
when
planted in spring (April) (Sherif and Nassar, 2010).
Techniques based on molecular marker analysis (i.e. RFLP, RAPD, ISSR-PCR) may
provide a more efficient and accurate screening method biochemical genetic analysis. Simple
sequence repeats comprise short oligonucleotide sequences, two to six bases long, repeated in
tandem array, which occur very frequently in eukaryotic genomes (Tautz and Renz, 1984;
Beckmann and Soller 1990 and Lagercrantz et al. 1993). The ISSR-PCR technique uses
primers that are complementary to a single SSR and anchored at either the 5′ or 3′ end with a
one- to three-base degenerate oligonucleotide (‘anchor’) (Zietkiewicz et al., 1994).The aim of
this study was to investigate the genetic distance as well as the molecular profile in imported
cassava using ISSR markers.
MATERIALS AND METHODS
Plant Material
Four Introduced genotypes of cassava were used in the present study (Table 1).
Table 1. Cassava code, Common Name, Chromosome no., and origin.
Code Common Name Chromosome no. Origin
A1 Indonesian Cassava 36 Indonesia
25
A2 Brazilian Cassava 36 Brazil
A3 Thai Cassava (Rayong 60) 36 Thailand
A4 Thai Cassava (Huay Bong 60) 36 Thailand
Genomic DNA extraction and purification: extraction of total DNA was performed using
methods for medicinal and aromatic plants according to Anna et al. (2001). To remove RNA
contamination, RNase A (10 mg/ml, Sigma, USA) was added to the DNA solution and incubated
at 37oC for 30 min. Estimation of the DNA concentration in different samples was done by
measuring optical density at 260 nm according to the following equation: Conc. (ug/ml) = OD260 X
50 X dilution factor.
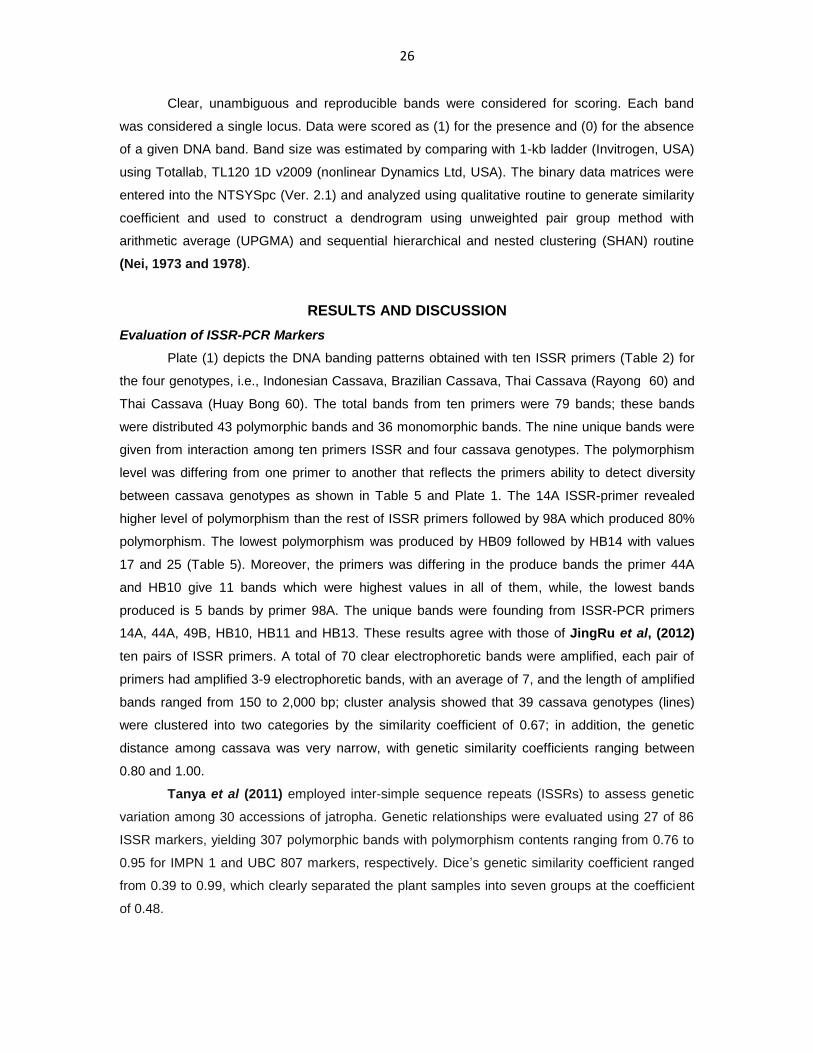
Table 2. List of the ten primer names and their nucleotide sequences used in the study for ISSR procedure.
Inter simple sequence repeats (ISSRs)
Ten primers for ISSR were used in the study and were successful in generating
reproducible and reliable amplicons for the four imported cassava accessions. Names and
sequences of the selected primers are shown in Table (2). The amplification reaction was carried
out in 25 µl reaction volume containing 1x PCR buffer, 4 mM MgCl2, 0.2 mM dNTPs, 20 pmole
primer, 2 units Taq DNA polymerase and 25 ng template DNA. PCR amplification was performed
in a Perkin Elmer 2400 thermocycler (Germany), programmed to fulfill 40 cycles after an initial
denaturation cycle for 4 min at 94oC. Each cycle consisted of a denaturation step at 94
oC for 1
min, an annealing step at 40oC for 2 min, and an extension step at 72
oC for 2 min, following by an
extension cycle for 7 min at 72oC.
Detection of PCR Products
The products of ISSR-based PCR analyses were detected using agarose gel electrophoresis
(1.2% in 1X TBE buffer), stained with ethidium bromide (0.3 ug/ml) and then visually examined
with UV transilluminator and photographed using a CCD camera (UVP, UK).
Data analysis
No Name Sequence No Name Sequence
1 14 A 5` (CT)8 TG 3` 6 HB 09 5´ (GT)6 GC 3`
2 44 A 5` (CT)8 AC 3` 7 HB 10 5´ (GA)6 CC 3`
3 98 A 5` (CA)7 3` 8 HB 11 5´ (GT)8 CC 3`
4 44 B 5` (CT)8 GC 3` 9 HB 13 5´ (GAG)3 GC 3`
5 49 B 5` (CA)6 GG 3` 10 HB 14 5´ (CTC)3 GC 3`
26
Clear, unambiguous and reproducible bands were considered for scoring. Each band
was considered a single locus. Data were scored as (1) for the presence and (0) for the absence
of a given DNA band. Band size was estimated by comparing with 1-kb ladder (Invitrogen, USA)
using Totallab, TL120 1D v2009 (nonlinear Dynamics Ltd, USA). The binary data matrices were
entered into the NTSYSpc (Ver. 2.1) and analyzed using qualitative routine to generate similarity
coefficient and used to construct a dendrogram using unweighted pair group method with
arithmetic average (UPGMA) and sequential hierarchical and nested clustering (SHAN) routine
(Nei, 1973 and 1978).
RESULTS AND DISCUSSION
Evaluation of ISSR-PCR Markers
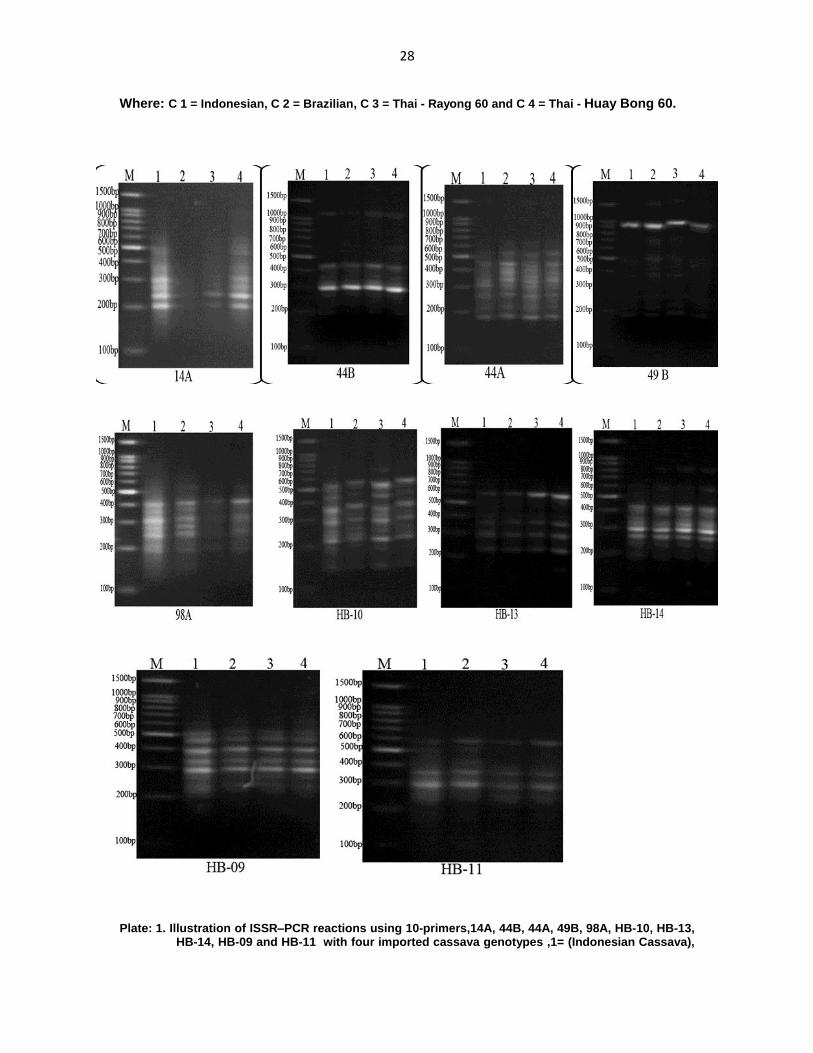
Plate (1) depicts the DNA banding patterns obtained with ten ISSR primers (Table 2) for
the four genotypes, i.e., Indonesian Cassava, Brazilian Cassava, Thai Cassava (Rayong 60) and
Thai Cassava (Huay Bong 60). The total bands from ten primers were 79 bands; these bands
were distributed 43 polymorphic bands and 36 monomorphic bands. The nine unique bands were
given from interaction among ten primers ISSR and four cassava genotypes. The polymorphism
level was differing from one primer to another that reflects the primers ability to detect diversity
between cassava genotypes as shown in Table 5 and Plate 1. The 14A ISSR-primer revealed
higher level of polymorphism than the rest of ISSR primers followed by 98A which produced 80%
polymorphism. The lowest polymorphism was produced by HB09 followed by HB14 with values
17 and 25 (Table 5). Moreover, the primers was differing in the produce bands the primer 44A
and HB10 give 11 bands which were highest values in all of them, while, the lowest bands
produced is 5 bands by primer 98A. The unique bands were founding from ISSR-PCR primers
14A, 44A, 49B, HB10, HB11 and HB13. These results agree with those of JingRu et al, (2012)
ten pairs of ISSR primers. A total of 70 clear electrophoretic bands were amplified, each pair of
primers had amplified 3-9 electrophoretic bands, with an average of 7, and the length of amplified
bands ranged from 150 to 2,000 bp; cluster analysis showed that 39 cassava genotypes (lines)
were clustered into two categories by the similarity coefficient of 0.67; in addition, the genetic
distance among cassava was very narrow, with genetic similarity coefficients ranging between
0.80 and 1.00.
Tanya et al (2011) employed inter-simple sequence repeats (ISSRs) to assess genetic
variation among 30 accessions of jatropha. Genetic relationships were evaluated using 27 of 86
ISSR markers, yielding 307 polymorphic bands with polymorphism contents ranging from 0.76 to
0.95 for IMPN 1 and UBC 807 markers, respectively. Dice’s genetic similarity coefficient ranged
from 0.39 to 0.99, which clearly separated the plant samples into seven groups at the coefficient
of 0.48.

27
Table: 3. Present and absent bands ISSR-PCR products by ISSR-primers in four imported cassava genotypes.
Primer MW 14A Primer MW HB09
No. Band bp C 1 C 2 C 3 C 4 No. Band bp C 1 C 2 C 3 C 4
1 1000 - - - + 1 500 + + + + 2 600 + - - - 2 450 + + + + 3 500 + - - + 3 400 + + + + 4 300 + - - + 4 350 + + + + 5 270 + - - + 5 300 + + + + 6 230 + - + + 6 220 + + - - 7 200 + - - + Primer MW HB10
Primer MW 44A No. Band bp C 1 C 2 C 3 C 4
No. Band bp C 1 C 2 C 3 C 4 1 500 + + + + 1 700 - + + + 2 450 + - + -
2 500 - + + + 3 400 - + - +
3 450 + + + + 4 370 + - + -
4 400 - + + + 5 320 - + - +
5 380 - + + - 6 300 - + + +
6 350 - + - - 7 280 + - - -
7 320 + + + + 8 220 + + - -
8 310 + - - - 9 200 + + + + 9 250 + + + + 10 180 + + + +
10 200 + + + + 11 110 + + + + 11 180 + + + + Primer MW HB11
Primer MW 98A No. Band bp C 1 C 2 C 3 C 4
No. Band bp C 1 C 2 C 3 C 4 1 600 - + - +
1 400 + + + + 2 500 + + - -
2 350 + + - - 3 400 - + - - 3 300 + + - + 4 350 + + + + 4 280 + + - - 5 300 + + + + 5 200 + + - + 6 280 + + + +
Primer MW 44B Primer MW HB13
No. Band bp C 1 C 2 C 3 C 4 No. Band bp C 1 C 2 C 3 C 4
1 1000 + - + + 1 600 + + + + 2 450 + + + + 2 500 + + - - 3 380 + + + + 3 400 + + + + 4 330 + - + + 4 370 + + + + 5 310 + + + + 5 300 + + + + 6 300 + + + + 6 280 + + + + 7 280 + + + + 7 180 - - - +
8 250 + + + + Primer MW HB14
9 200 + - + + No. Band bp C 1 C 2 C 3 C 4
Primer MW 49B 1 800 - - + + No. Band bp C 1 C 2 C 3 C 4 2 600 + + + +
1 1500 - + + + 3 450 + + + + 2 950 + + + + 4 400 - - + + 3 700 - + - - 5 320 + + + + 4 500 - + + + 6 300 + + + + 5 450 + - - - 7 280 + + + + 6 400 - + + + 8 200 + + + + 7 280 - + + +
8 250 - + + + 9 200 + + + +
28
Where: C 1 = Indonesian, C 2 = Brazilian, C 3 = Thai - Rayong 60 and C 4 = Thai - Huay Bong 60.
Plate: 1. Illustration of ISSR–PCR reactions using 10-primers,14A, 44B, 44A, 49B, 98A, HB-10, HB-13, HB-14, HB-09 and HB-11 with four imported cassava genotypes ,1= (Indonesian Cassava),
29
2= (Brazilian Cassava), 3= ( Thai Cassava - Rayong 60) and 4 =( Thai Cassava - Huay Bong 60).
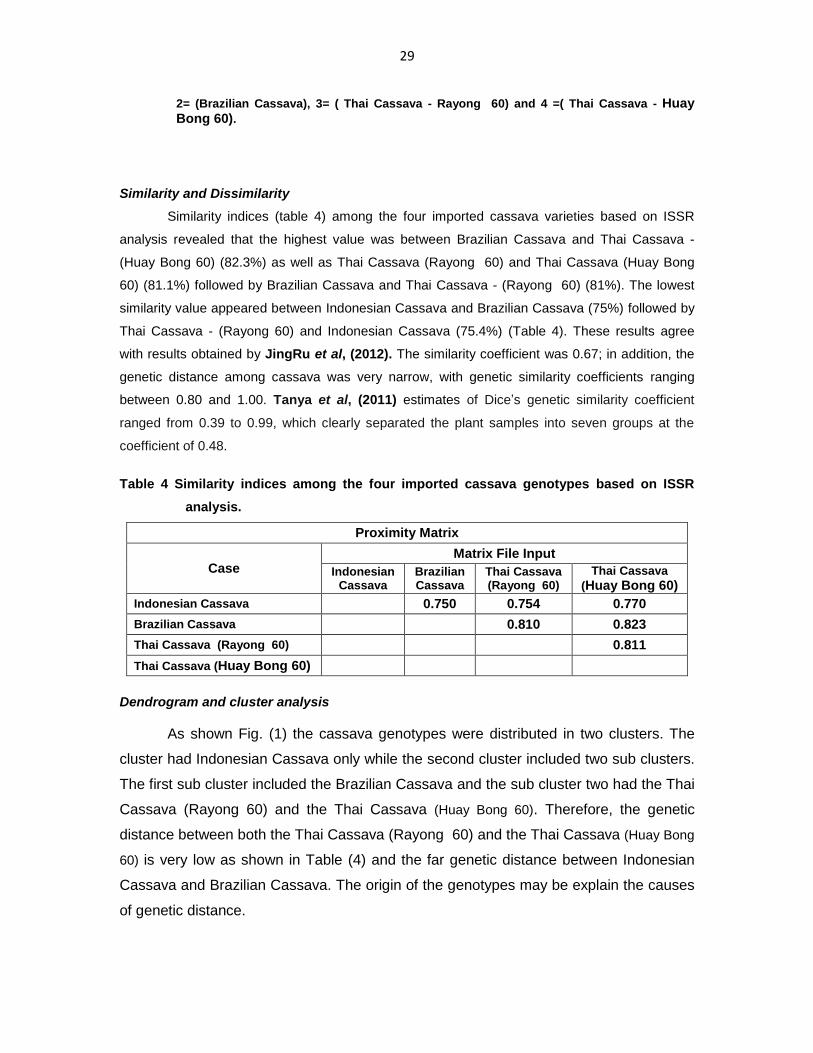
Similarity and Dissimilarity
Similarity indices (table 4) among the four imported cassava varieties based on ISSR
analysis revealed that the highest value was between Brazilian Cassava and Thai Cassava -
(Huay Bong 60) (82.3%) as well as Thai Cassava (Rayong 60) and Thai Cassava (Huay Bong
60) (81.1%) followed by Brazilian Cassava and Thai Cassava - (Rayong 60) (81%). The lowest
similarity value appeared between Indonesian Cassava and Brazilian Cassava (75%) followed by
Thai Cassava - (Rayong 60) and Indonesian Cassava (75.4%) (Table 4). These results agree
with results obtained by JingRu et al, (2012). The similarity coefficient was 0.67; in addition, the
genetic distance among cassava was very narrow, with genetic similarity coefficients ranging
between 0.80 and 1.00. Tanya et al, (2011) estimates of Dice’s genetic similarity coefficient
ranged from 0.39 to 0.99, which clearly separated the plant samples into seven groups at the
coefficient of 0.48.
Table 4 Similarity indices among the four imported cassava genotypes based on ISSR
analysis.
Proximity Matrix
Case Matrix File Input
Indonesian Cassava
Brazilian Cassava
Thai Cassava (Rayong 60)
Thai Cassava
(Huay Bong 60)
Indonesian Cassava
0.750 0.754 0.770
Brazilian Cassava
0.810 0.823
Thai Cassava (Rayong 60)
0.811
Thai Cassava (Huay Bong 60)
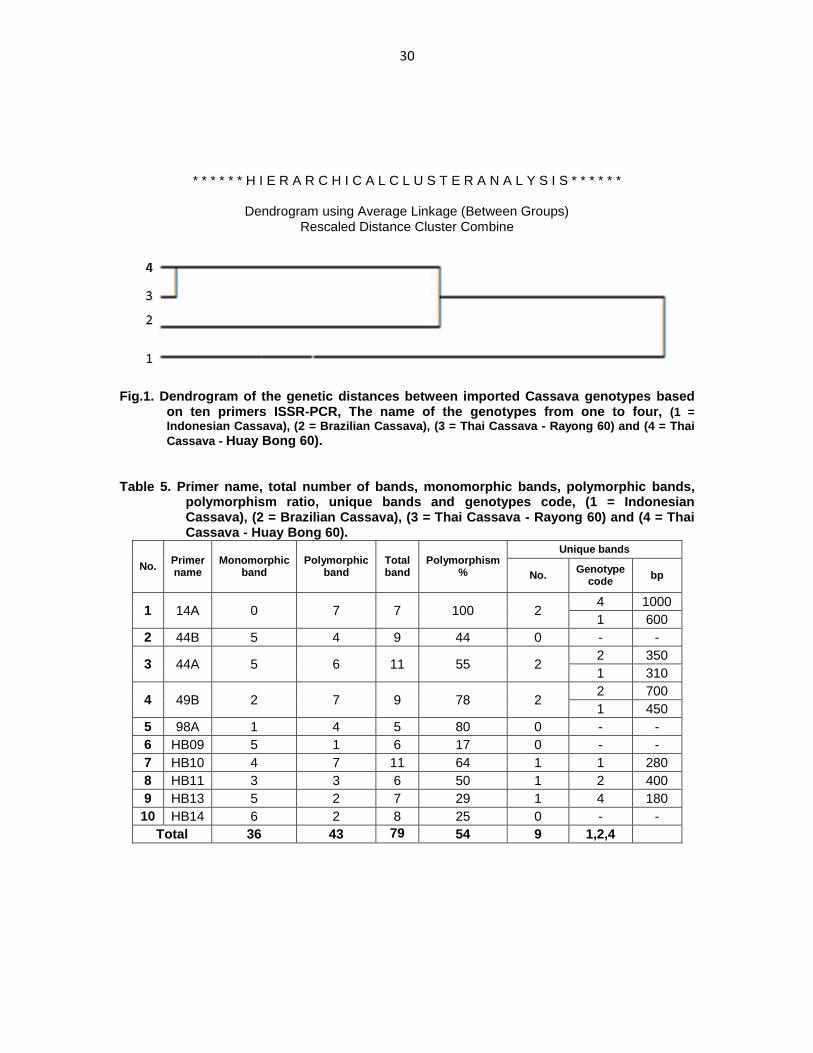
Dendrogram and cluster analysis
As shown Fig. (1) the cassava genotypes were distributed in two clusters. The
cluster had Indonesian Cassava only while the second cluster included two sub clusters.
The first sub cluster included the Brazilian Cassava and the sub cluster two had the Thai
Cassava (Rayong 60) and the Thai Cassava (Huay Bong 60). Therefore, the genetic
distance between both the Thai Cassava (Rayong 60) and the Thai Cassava (Huay Bong
60) is very low as shown in Table (4) and the far genetic distance between Indonesian
Cassava and Brazilian Cassava. The origin of the genotypes may be explain the causes
of genetic distance.
30
* * * * * * H I E R A R C H I C A L C L U S T E R A N A L Y S I S * * * * * *
Dendrogram using Average Linkage (Between Groups) Rescaled Distance Cluster Combine
Fig.1. Dendrogram of the genetic distances between imported Cassava genotypes based
on ten primers ISSR-PCR, The name of the genotypes from one to four, (1 =
Indonesian Cassava), (2 = Brazilian Cassava), (3 = Thai Cassava - Rayong 60) and (4 = Thai
Cassava - Huay Bong 60). Table 5. Primer name, total number of bands, monomorphic bands, polymorphic bands,
polymorphism ratio, unique bands and genotypes code, (1 = Indonesian Cassava), (2 = Brazilian Cassava), (3 = Thai Cassava - Rayong 60) and (4 = Thai Cassava - Huay Bong 60).
No. Primer name
Monomorphic band
Polymorphic band
Total band
Polymorphism %
Unique bands
No. Genotype
code bp
1 14A 0 7 7 100 2 4 1000
1 600
2 44B 5 4 9 44 0 - -
3 44A 5 6 11 55 2 2 350
1 310
4 49B 2 7 9 78 2 2 700
1 450
5 98A 1 4 5 80 0 - -
6 HB09 5 1 6 17 0 - -
7 HB10 4 7 11 64 1 1 280
8 HB11 3 3 6 50 1 2 400
9 HB13 5 2 7 29 1 4 180
10 HB14 6 2 8 25 0 - -
Total 36 43 79 54 9 1,2,4
31
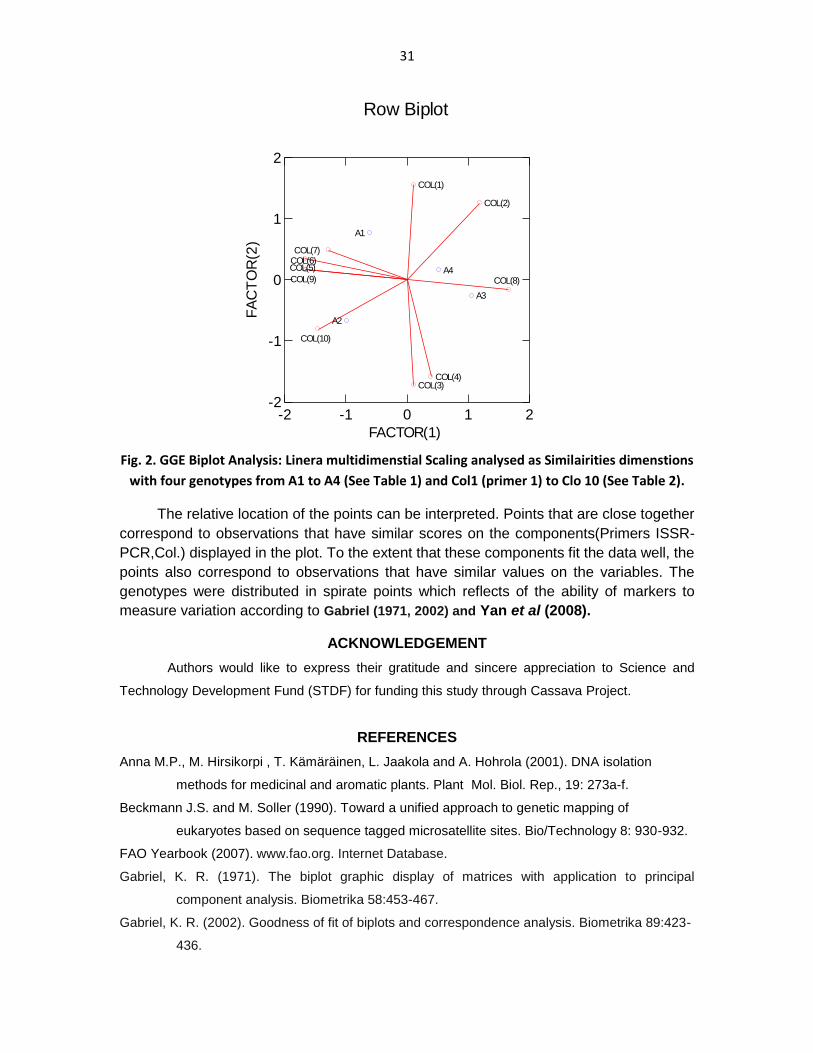
Row Biplot
-2 -1 0 1 2
FACTOR(1)
-2
-1
0
1
2
FA
CT
OR
(2)
A3
A4
A1
A2
COL(5)
COL(9)
COL(6)
COL(10)
COL(7)
COL(8)
COL(2)
COL(4)COL(3)
COL(1)
Fig. 2. GGE Biplot Analysis: Linera multidimenstial Scaling analysed as Similairities dimenstions
with four genotypes from A1 to A4 (See Table 1) and Col1 (primer 1) to Clo 10 (See Table 2).
The relative location of the points can be interpreted. Points that are close together
correspond to observations that have similar scores on the components(Primers ISSR-
PCR,Col.) displayed in the plot. To the extent that these components fit the data well, the
points also correspond to observations that have similar values on the variables. The
genotypes were distributed in spirate points which reflects of the ability of markers to
measure variation according to Gabriel (1971, 2002) and Yan et al (2008).
ACKNOWLEDGEMENT
Authors would like to express their gratitude and sincere appreciation to Science and
Technology Development Fund (STDF) for funding this study through Cassava Project.
REFERENCES
Anna M.P., M. Hirsikorpi , T. Kämäräinen, L. Jaakola and A. Hohrola (2001). DNA isolation
methods for medicinal and aromatic plants. Plant Mol. Biol. Rep., 19: 273a-f.
Beckmann J.S. and M. Soller (1990). Toward a unified approach to genetic mapping of
eukaryotes based on sequence tagged microsatellite sites. Bio/Technology 8: 930-932.
FAO Yearbook (2007). www.fao.org. Internet Database.
Gabriel, K. R. (1971). The biplot graphic display of matrices with application to principal
component analysis. Biometrika 58:453-467.
Gabriel, K. R. (2002). Goodness of fit of biplots and correspondence analysis. Biometrika 89:423-
436.

32
JingRu, P.; ZhiYong, G.; Ping, L.; Qiang, H.; JinChun, Y.; LanRong, S. and F. HaiTian (2012). A
study of genetic polymorphism of cassava germplasms and ISSR molecular markers.
Agricultural Biotechnology. 1 (1) 8-11.
Jos, J.S. and S.G. Nair (1979). Pachytene paring in relation to pollen fertility in five cultivars of
cassava. Cytologia, 44: 813-820.
Lagercrantz U, H. Ellegren and L. Andersson, (1993). The abundance of various polymorphic
microsatellite motifs differs between plants and vertebrates. Nucleic Acids Research
21:1111–1115.
Nei M. (1973). Analysis of gene diversity in subdivided populations. Proc Natl Acad Sci,; USA
70:3321–3323.
Nei M. (1978). Estimation of average heterozygosity and genetic distance from a small number of
individuals. Genetics 89:583–590.
Roger, D.J.(1965). Some botanical and etnological considerations of Manihot escuelnta.
Economic Botany,19: 369-377.
Sherif, Sahar A. and N.M.A. Nassar (2010). Introducing cassava into Egypt. Geneconserve,
9(35): 118-123.
Sauer, C. O. (1952). Agriculture origin and Dispersals Series Two, The American geographic
Society, New York.
Silvestre, P. and M. Arraudeaus, (1983). Le manioc. Techniques Agricoles et productions
Tropicales Collection. Maisonneuve & Larose Agence de Cooperation Culturalle et
Technique, Paris. pp.262.
Tanya, P.; Taeprayoon, P.; Hadkam Y. and P. Srinives, (2011). Genetic Diversity Among
Jatropha and Jatropha-Related Species Based on ISSR Markers. Plant Mol Biol Rep
29:252–264.
Tautz, D. and M. Renz, (1984). Simple sequences are ubiquitous repetitive components of
eukaryote genomes. Nucleic Acids Res. 12: 4127-4138.
Yan, W. and J.A. Frégeau-Reid (2008). Breeding line selection based on multiple traits. Crop Sci.
48: 417-423.
Zietkiewicz E, A. Rafalski and D. Labuda, (1994). Genome fingerprinting by simple
sequence repeat (SSR)-anchored polymerase chain reaction amplification.
Genomics, 20:176- 183.
33
ما بين التتابعات ISSRsتقنية بإستخدام اسافاالك ة منالتنوع الوراثي ألربعة تراكيب وراثية مستورد
القصيرة المتتالية
2كامل سعيد أحمد ،2شمس سعد ،عمرو 1إيهاب محمد زايد
قسم بحوث محاصيل العمف، معهد بحوث المحاصيل الحقمية، مركز البحوث الزراعية، الجيزة، مصر. 1
قسم بحوث التكثيف المحصولى، معهد بحوث المحاصيل الحقمية، مركز البحوث الزراعية، الجيزة، مصر. الكاسافا ، مشروع 2
الممخص العربي
سافا اسافا االندونيسية، الكاالك سافا في ىذه الدراسة وىي:اإستخدم أربعة من التراكيب الوراثيو المستورده من الك
في الدراسة . ISSRـ واستخدمت عشرة من البادئات ل .(Huay Bong 60) و )(Rayong 60 سافا التايالنديةاالبرازيمي، الك
. وتيدف ىذه الدراسة سافاامتضاعف لألربعة تراكيب وراثيو من الك ampliconsكانت البادئات الوراثيو ناجحة في توليد
.ISSR المعممات باستخدام سافاافي الك التوصيف الجزيئىوكذلك التباين الوراثىقياس ل
34حزمة جزيئية ، توزعت الحزم ما بين 79 عمىمن مجموع البادئات الجزيئية العشرة نا حصمناوأوضحت النتائج أن
ذو ISSRحزمة فريدة من التفاعل بين 9كما كان من الحزم .monomorphicحزمة 63حزمو متعددة المظيرية الجزيئية و
المستورده. يدل ىذا المستوي من تعدد األشكال الجزيئية المختمفة سافا امن الكربعة تراكيب وراثية ألاالبادئات الجزيئية العشرة ، و
ISSR البادئ الجزيئ وقد أظيرسافا االك التراكيب الوراثيةاألربعة منعمي قدرة المعمم الجزيئ وبادئاتو العشره الظيار التنوع بين
14A بادئ الجزيئيميو ال %(011معدل من التباين )أعمى ISSR 98A ئات ، كما أظيرت الباد%81الذى أظير نسبة تباين
. كما ظير أن أعمى قيمة 52و 07القيم مع HB-1 4ويميو HB-9الجزيئة أدنى تعدد من األشكال الجزيئية بالبادئ الجزيئ
التايالندية الكاسافا ٪، وكذلك 82.3ى ى (Huay Bong 60)سافا التايالندية اسافا البرازيمي والكامن التشابو الوراثي بين الك
(Huay Bong 60) سافا التايالندية اوالك(Rayong 60) 80.0٪ سافا التايالندية االبرازيمي والكالكاسافا ، يميو(Rayong
سافا اكال٪، يميو 75 سافا البرازيمياسافا االندونيسية والكابين الككانت تشابو نسبةكما أظيرت النتائج ان ادنى ٪. 80 (60
سافا االندونيسية ابين الك كانت مسافة جينيةفى حين ان ابعد ٪ 75.4االندونيسية الكاسافا و (Rayong 60) التايالندية
.(Huay Bong 60)سافا التايالندية اوالك