Embed Size (px)
Citation preview
Texas Medical Center LibraryDigitalCommons@The Texas Medical Center
UT GSBS Dissertations and Theses (Open Access) Graduate School of Biomedical Sciences
8-2014
GENETIC PREDICTORS OF METABOLICSIDE EFFECTS OF DIURETIC THERAPYJorge L. Del Aguila
Follow this and additional works at: http://digitalcommons.library.tmc.edu/utgsbs_dissertations
Part of the Bioinformatics Commons, Biostatistics Commons, Cardiovascular DiseasesCommons, Clinical Epidemiology Commons, Clinical Trials Commons, Genetics Commons,Genomics Commons, Longitudinal Data Analysis and Time Series Commons, and the SystemsBiology Commons
This Dissertation (PhD) is brought to you for free and open access by theGraduate School of Biomedical Sciences at DigitalCommons@The TexasMedical Center. It has been accepted for inclusion in UT GSBSDissertations and Theses (Open Access) by an authorized administrator ofDigitalCommons@The Texas Medical Center. For more information,please contact [email protected].
Recommended CitationDel Aguila, Jorge L., "GENETIC PREDICTORS OF METABOLIC SIDE EFFECTS OF DIURETIC THERAPY" (2014). UT GSBSDissertations and Theses (Open Access). Paper 484.
GENETIC PREDICTORS OF METABOLIC SIDE EFFECTS OF DIURETIC THERAPY
by
Jorge L. Del Aguila, B.S. MSc
APPROVED: ______________________________ Eric Boerwinkle, PhD ______________________________ Craig Hanis, PhD ______________________________ James Hixson, PhD ______________________________ Alanna Morrison, PhD ______________________________ Oleh Pochynyuk, PhD
APPROVED: ____________________________ Dean, The University of Texas Graduate School of Biomedical Sciences at Houston

GENETIC PREDICTORS OF METABOLIC SIDE EFFECTS OF DIURETIC THERAPY
A
DISSERTATION
Presented to the Faculty of The University of Texas
Health Science Center at Houston and
The University of Texas MD Anderson Cancer Center
Graduate School of Biomedical Sciences in Partial Fulfillment
of the Requirements
for the Degree of
DOCTOR OF PHILOSOPHY
by
Jorge L. Del Aguila, B.S., MSc Houston, Texas
August, 2014

iii
ACKNOWLEDGMENTS
I would like to thanks my advisor, Dr. Eric Boerwinkle, not only for his support,
encouragement and advice during my dissertation work at GSBS, but also for allowing me to
lead as a junior investigator one of the CHARGE projects, that sign of confidence meant a
lot to me. I would also like to thank my committee members for their guidance and support:
Dr. Craig Hanis, Dr. James Hixson, Dr. Alanna Morrison and Dr. Oleh Pochynyuk. Thanks to
Dr. Steve Turner, Dr. Julie Johnson and Dr. Bruce Psaty who provided the GERA, the PEAR
and the CHARGE pharmacogenetics data, respectively.
I would like to acknowledge Mrs. Zhiying Wang for her useful skills in cleaning the data,
which were of great help. I wish to thank Dr. Maja Barbalic, Dr. Bing Yu, Jacy R. Crosby,
Alex Li, and Heather Highland for the time that we spent discussing genetics and statistics.
Thank to Lilian Antunes for the eternals sds and more, to Elena Mejia for proofreading this
dissertation and her friendship, to Sandra Tocto for listening (sometimes) and being there
(sometimes), to Selina Vattathil for her comments and encouragement. To my friends Omid
Tavana, Mike Hernandez, Deppaboli Chakravarti, Akash Agarwal, Andria Schibler, Al Reger,
Arup Sinha, Charles Darkoh and Sergei Guma for making my life here in Houston a nice
one.
Finally, I would like to express my love and thanks to my family, my brothers Pepe and
Lucho and my parents Luis Alberto and Norka for their unconditional love and support.

iv
GENETIC PREDICTORS OF METABOLIC SIDE EFFECTS OF DIURETIC THERAPY
Jorge L Del Aguila, BS, MSC
Advisor: Eric Boerwinkle, Ph.D.
ABSTRACT
Thiazide diuretics are a recommended first-line monotherapy for hypertension
(i.e.SBP>140 mmHg or DBP>90 mmHg). Even so, diuretics are associated with adverse
metabolic side effects, such as hyperlipidemia, hyperglycemia and hypokalemia which
increase the risk of developing type II diabetes. This thesis used three analytical strategies
to identify and quantify genetic factors that contribute to the development of adverse
metabolic effects due to thiazide diuretic treatment. I performed a genome-wide association
study (GWAS) and meta-analysis of the change in fasting plasma glucose and triglycerides
in response to HCTZ from two different clinical trials: the Pharmacogenomic Evaluation of
Antihypertensive Responses (PEAR) and the Genetic Epidemiology of Responses to
Antihypertensive (GERA) studies. Two SNPs (rs12279250 and rs4319515 (r2=0.73)),
located at 11p15.1 in the NELL1 gene, achieved genome-wide significance for association
with change in fasting plasma triglycerides in African Americans, whereby each variant allele
was associated with a 28 mg/dl increase in the change in triglycerides. NELL1 encodes a
cytoplasmic protein that contains epidermal growth factor (EGF)-like repeats and has been
shown to represses adipogenic differentiation. No statistical significant association was
found in the case of change in glucose or change in triglycerides in European-Americans in
this study.
In order to increase the sample size and signal for the change in glucose, I
performed a GWAS of longitudinal data and meta-analysis from 14 cohorts which are part of
the CHARGE consortium. No statistically significant association was found. The lack of
positive results in this analysis suggested that it is unlikely that there is a single common
SNP with a large effect on the adverse reaction to the diuretic use. Therefore, we can
speculate about the possible interaction of multiple variants each with modest effect sizes or
the fact that rare variants are playing a greater part in this particular phenotype.
Finally, I performed a genome-wide association study and a Multi-Ethnic Meta-
Analysis of change in blood potassium levels 718 European- and African-American
v
hypertensive participants. SNPs rs10845697 (Bayes Factor=5.560) on chromosome 12,
near to the HEME binding protein 1 gene, and rs11135740 (Bayes Factor= 5.258) on
chromosome 8 near the Mitoferrin-1 gene reached GWAS significance (Bayes Factor > 5).
These results, if replicated, suggested a novel mechanism involving effects of genes in the
HEME pathway influencing hydrochlorothiazide-induced renal potassium loss.
The main goal of this research was to explore first steps in developing
hydrochlorothiazide personalize medicine in order to provide a lasting and positive impact
on public health.
vi
TABLE OF CONTENTS
ACKNOWLEDGMENTS ....................................................................................................... iii
ABSTRACT .......................................................................................................................... iv
LIST OF TABLES ................................................................................................................. ix
LIST OF FIGURES ............................................................................................................... xi
CHAPTER 1: BACKGROUND AND SIGNIFICANCE ......................................................... 1
1.1 Definition of BP and hypertension .......................................................................... 2
1.2 Hypertension as Cardiovascular Risk Factor .......................................................... 5
1.3 Treatment of Hypertension ..................................................................................... 5
1.4 Hydrochlorothiazide Treatment and its adverse effects .......................................... 7
1.5 Role of potassium .................................................................................................. 8
1.6 Pharmacogenetics and Pharmacogenomics .........................................................11
1.7 Specific Aims ........................................................................................................13
CHAPTER 2: GENOME-WIDE ASSOCIATION ANALYSES SUGGEST NELL1
INFLUENCES ADVERSE METABOLIC RESPONSE TO HCTZ IN AFRICAN-AMERICANS
............................................................................................................................................15
2.1 INTRODUCTION...................................................................................................16
2.2 MATERIALS AND METHODS...............................................................................16
2.2.1 Study population ............................................................................................16
2.2.2 Phenotype and Genotype data .......................................................................17
2.2.3 Statistical analysis ..........................................................................................18
2.3 RESULTS .............................................................................................................19
2.3.1 GWAS of adverse effect of HCTZ on glucose: ...............................................21
2.3.2 GWAS of adverse effect of HCTZ on triglycerides: .........................................21
2.4 DISCUSSION ........................................................................................................26
2.5 SUPPLEMENTARY INFORMATION .....................................................................28
2.5.1 Top SNPs associated with glucose response in European Americans ...........28
2.5.2 Top SNPs associated with triglyceride response in European Americans ......28

vii
2.5.3 Top SNPs associated with glucose response in African-Americans ...............29
2.5.4 Top SNPs associated with triglyceride response in African-Americans ..........30
CHAPTER 3: LONGITUDINAL GENOME-WIDE ASSOCIATION FOR INTERACTION OF
SNPS WITH THIAZIDE DIURETIC USE ON FASTING GLUCOSE AND INSULIN LEVELS
IN EUROPEAN AMERICANS IN THE CHARGE CONSORTIUM ........................................49
3.1 INTRODUCTION...................................................................................................50
3.2 MATERIALS AND METHODS...............................................................................50
3.2.1 Study populations ..........................................................................................50
3.2.2 Study design exclusion and inclusion criteria .................................................51
3.2.3 Definition of drug exposure ............................................................................51
3.2.4 Measurement of glucose and insulin ..............................................................51
3.2.5 Genotype arrays and imputation ....................................................................51
3.2.6 Statistical analysis ..........................................................................................54
3.3 RESULTS .............................................................................................................54
3.4 DISCUSSION ........................................................................................................61
CHAPTER 4: TRANS ETHNIC META ANALYSIS SUGGESTS GENETIC VARIATION IN
THE HEME PATHWAY INFLUENCES POTASSIUM RESPONSE IN PATIENTS TREATED
WITH HYDROCHLOROTHIAZIDE. .....................................................................................62
4.1 INTRODUCTION...................................................................................................63
4.2 MATERIALS AND METHODS...............................................................................63
4.2.1 Study population ............................................................................................63
4.2.2 Phenotype and Genotype data .......................................................................64
4.2.3 Statistical analysis ..........................................................................................65
4.3 RESULTS .............................................................................................................65
4.4 DISCUSSION ........................................................................................................75
4.5 SUPPLEMENTARY INFORMATION .....................................................................77
CHAPTER 5: SYNTESIS AND FUTURE DIRECTIONS .....................................................91
5.1 SYNTHESIS ..........................................................................................................92

viii
5.2 THOUGHT AND FUTURE DIRECTIONS ..............................................................93
REFERENCES ...................................................................................................................95
VITA ................................................................................................................................. 113
ix
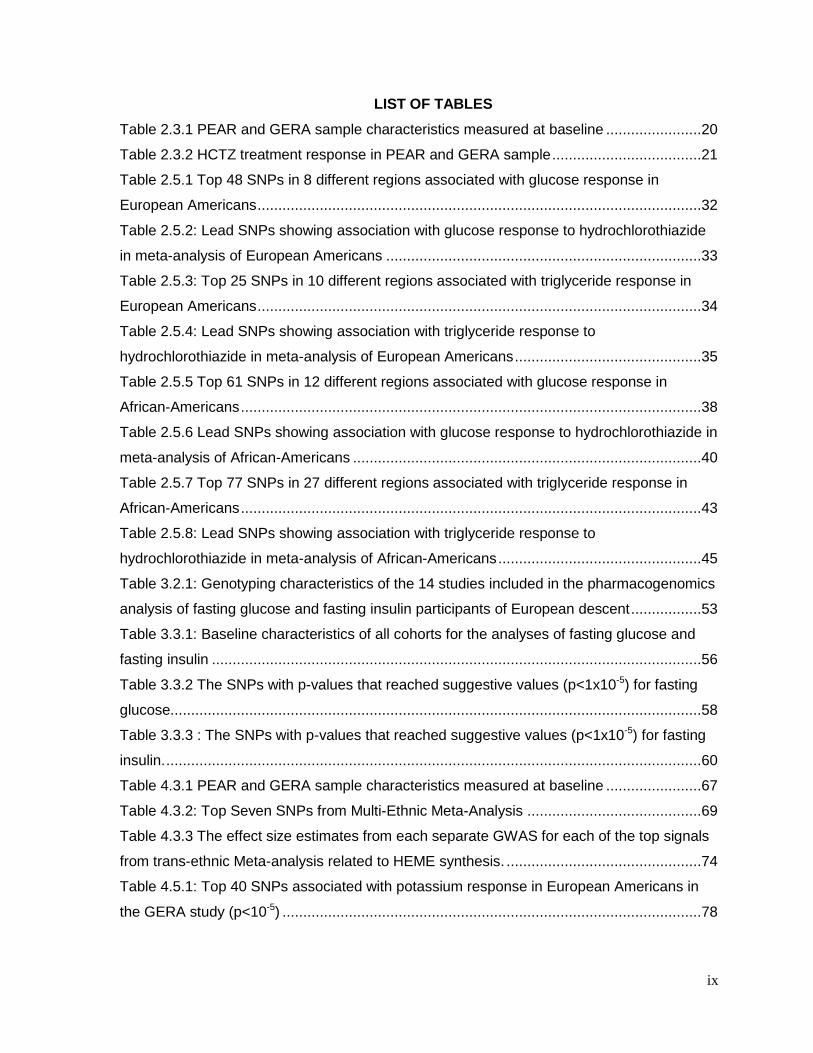
LIST OF TABLES
Table 2.3.1 PEAR and GERA sample characteristics measured at baseline .......................20
Table 2.3.2 HCTZ treatment response in PEAR and GERA sample ....................................21
Table 2.5.1 Top 48 SNPs in 8 different regions associated with glucose response in
European Americans ...........................................................................................................32
Table 2.5.2: Lead SNPs showing association with glucose response to hydrochlorothiazide
in meta-analysis of European Americans ............................................................................33
Table 2.5.3: Top 25 SNPs in 10 different regions associated with triglyceride response in
European Americans ...........................................................................................................34
Table 2.5.4: Lead SNPs showing association with triglyceride response to
hydrochlorothiazide in meta-analysis of European Americans .............................................35
Table 2.5.5 Top 61 SNPs in 12 different regions associated with glucose response in
African-Americans ...............................................................................................................38
Table 2.5.6 Lead SNPs showing association with glucose response to hydrochlorothiazide in
meta-analysis of African-Americans ....................................................................................40
Table 2.5.7 Top 77 SNPs in 27 different regions associated with triglyceride response in
African-Americans ...............................................................................................................43
Table 2.5.8: Lead SNPs showing association with triglyceride response to
hydrochlorothiazide in meta-analysis of African-Americans .................................................45
Table 3.2.1: Genotyping characteristics of the 14 studies included in the pharmacogenomics
analysis of fasting glucose and fasting insulin participants of European descent .................53
Table 3.3.1: Baseline characteristics of all cohorts for the analyses of fasting glucose and
fasting insulin ......................................................................................................................56
Table 3.3.2 The SNPs with p-values that reached suggestive values (p<1x10⁻⁵) for fasting
glucose................................................................................................................................58
Table 3.3.3 : The SNPs with p-values that reached suggestive values (p<1x10⁻⁵) for fasting
insulin. .................................................................................................................................60
Table 4.3.1 PEAR and GERA sample characteristics measured at baseline .......................67
Table 4.3.2: Top Seven SNPs from Multi-Ethnic Meta-Analysis ..........................................69
Table 4.3.3 The effect size estimates from each separate GWAS for each of the top signals
from trans-ethnic Meta-analysis related to HEME synthesis. ...............................................74
Table 4.5.1: Top 40 SNPs associated with potassium response in European Americans in
the GERA study (p<10-5) .....................................................................................................78
x
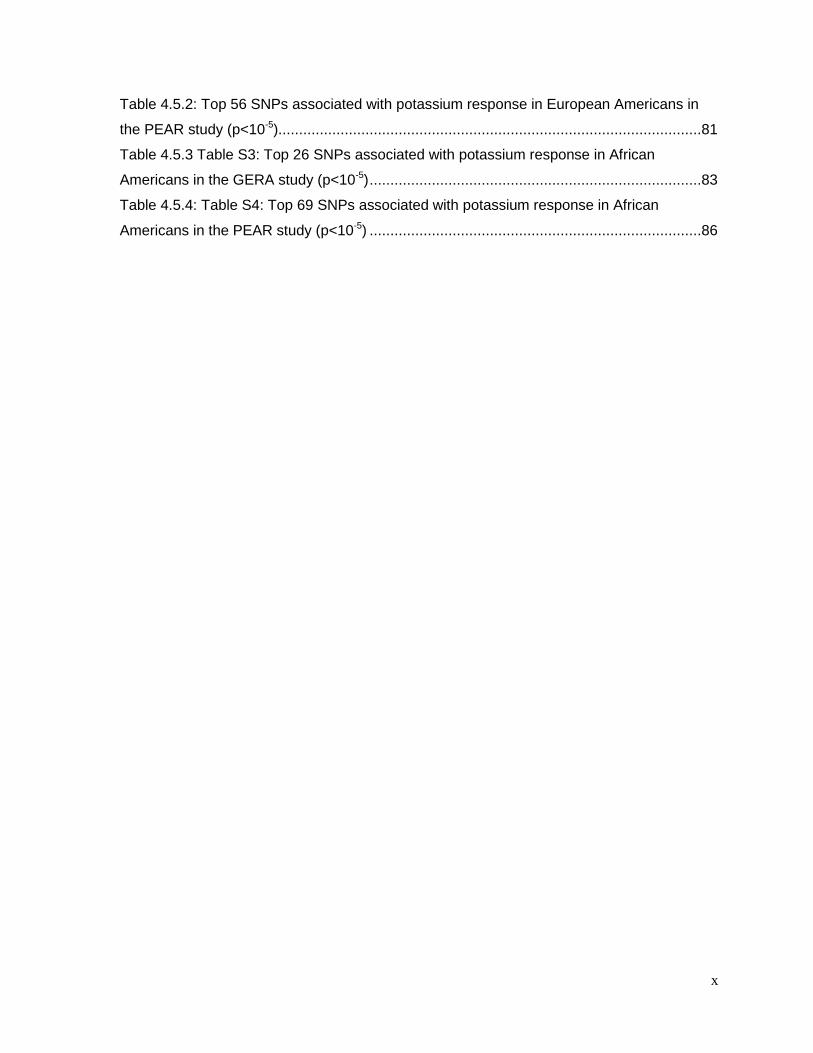
Table 4.5.2: Top 56 SNPs associated with potassium response in European Americans in
the PEAR study (p<10-5)......................................................................................................81
Table 4.5.3 Table S3: Top 26 SNPs associated with potassium response in African
Americans in the GERA study (p<10-5) ................................................................................83
Table 4.5.4: Table S4: Top 69 SNPs associated with potassium response in African
Americans in the PEAR study (p<10-5) ................................................................................86
xi
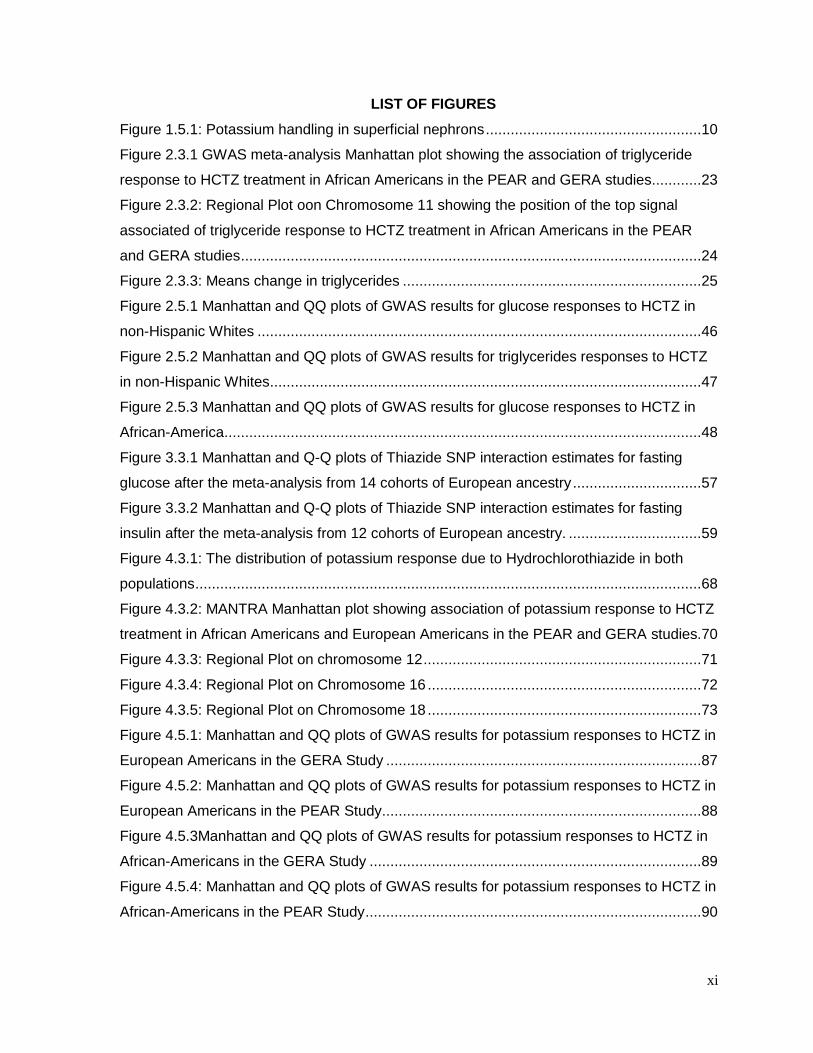
LIST OF FIGURES
Figure 1.5.1: Potassium handling in superficial nephrons ....................................................10
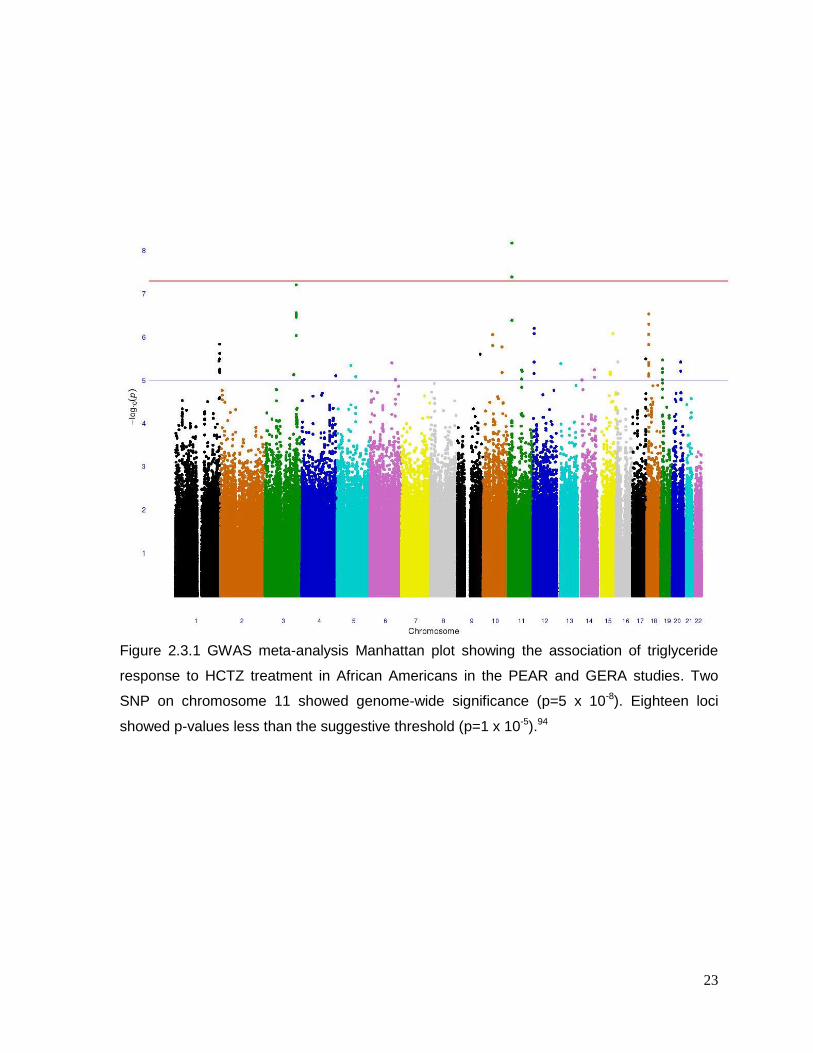
Figure 2.3.1 GWAS meta-analysis Manhattan plot showing the association of triglyceride
response to HCTZ treatment in African Americans in the PEAR and GERA studies............23
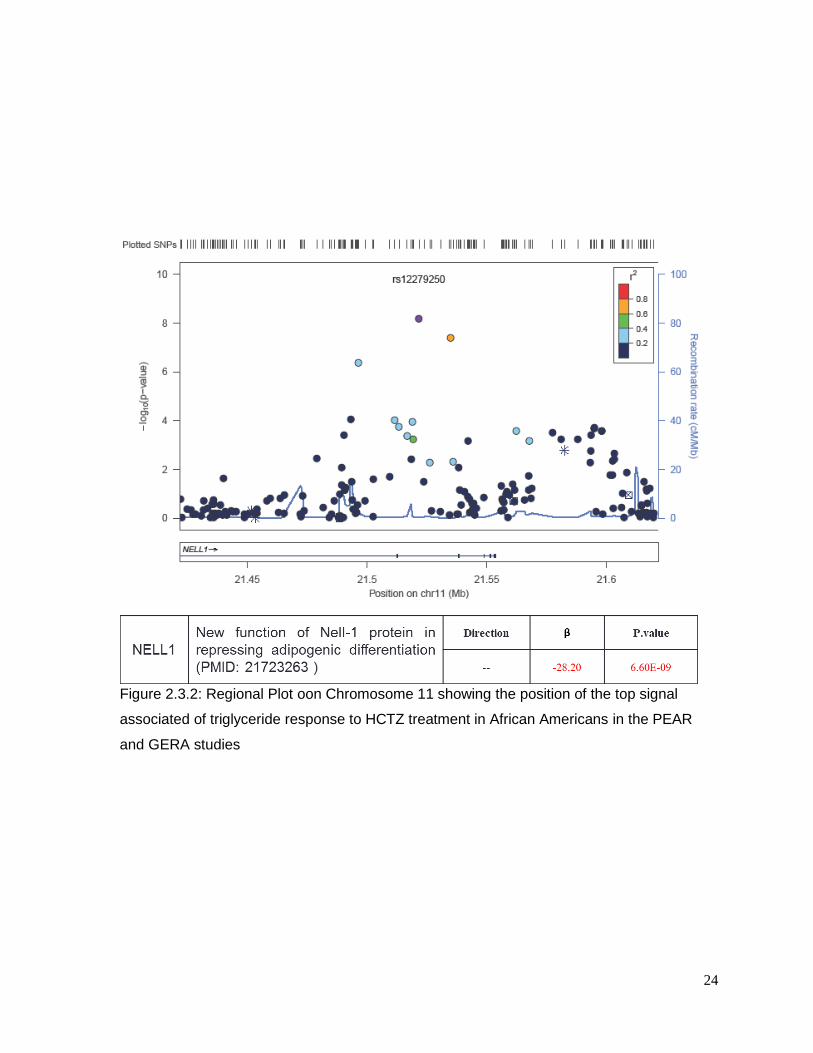
Figure 2.3.2: Regional Plot oon Chromosome 11 showing the position of the top signal
associated of triglyceride response to HCTZ treatment in African Americans in the PEAR
and GERA studies ...............................................................................................................24
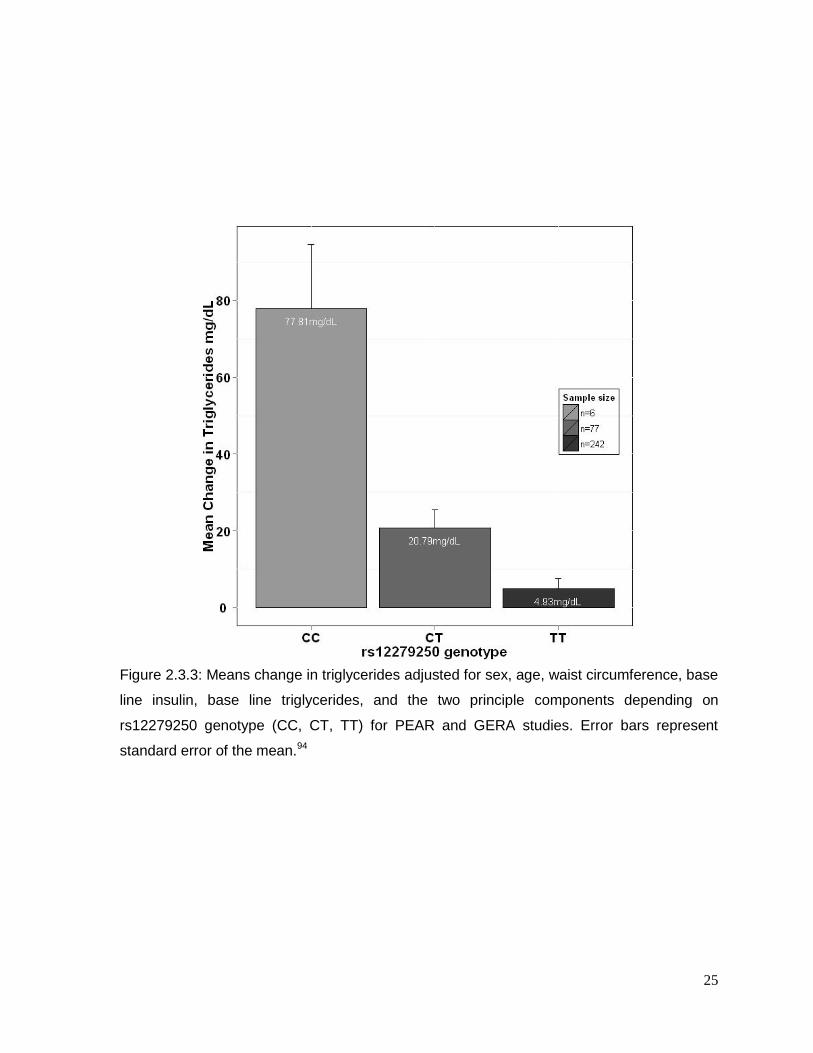
Figure 2.3.3: Means change in triglycerides ........................................................................25
Figure 2.5.1 Manhattan and QQ plots of GWAS results for glucose responses to HCTZ in
non-Hispanic Whites ...........................................................................................................46
Figure 2.5.2 Manhattan and QQ plots of GWAS results for triglycerides responses to HCTZ
in non-Hispanic Whites ........................................................................................................47
Figure 2.5.3 Manhattan and QQ plots of GWAS results for glucose responses to HCTZ in
African-America ...................................................................................................................48
Figure 3.3.1 Manhattan and Q-Q plots of Thiazide SNP interaction estimates for fasting
glucose after the meta-analysis from 14 cohorts of European ancestry ...............................57
Figure 3.3.2 Manhattan and Q-Q plots of Thiazide SNP interaction estimates for fasting
insulin after the meta-analysis from 12 cohorts of European ancestry. ................................59
Figure 4.3.1: The distribution of potassium response due to Hydrochlorothiazide in both
populations ..........................................................................................................................68
Figure 4.3.2: MANTRA Manhattan plot showing association of potassium response to HCTZ
treatment in African Americans and European Americans in the PEAR and GERA studies.70
Figure 4.3.3: Regional Plot on chromosome 12 ...................................................................71
Figure 4.3.4: Regional Plot on Chromosome 16 ..................................................................72
Figure 4.3.5: Regional Plot on Chromosome 18 ..................................................................73
Figure 4.5.1: Manhattan and QQ plots of GWAS results for potassium responses to HCTZ in
European Americans in the GERA Study ............................................................................87
Figure 4.5.2: Manhattan and QQ plots of GWAS results for potassium responses to HCTZ in
European Americans in the PEAR Study .............................................................................88
Figure 4.5.3Manhattan and QQ plots of GWAS results for potassium responses to HCTZ in
African-Americans in the GERA Study ................................................................................89
Figure 4.5.4: Manhattan and QQ plots of GWAS results for potassium responses to HCTZ in
African-Americans in the PEAR Study .................................................................................90

1
CHAPTER 1: BACKGROUND AND SIGNIFICANCE
2
1.1 Definition of BP and hypertension
The beating heart is the most important organ in the circulatory system which is
responsible for delivering nutrients and oxygen to all cells in the body as well as removing
waste that the cells produce as a result of normal respiration. To accomplish this function,
the heart needs to repeatedly contract (i.e. systole), and relax (i.e. diastole). The heart
consists of 4 chambers, two atria in the upper part and two ventricles in the lower part. This
pumping action generates a blood pressure (BP) within the circulatory system. Contraction
or systole of the left ventricle opens the aortic valve and pushes oxygenated blood into the
aorta. This phenomenon causes the artery’s wall to stretch and the pressure to rise to a
maximum that is called the systolic blood pressure (SBP). The pressure in the aorta falls
during relaxation or diastole of the left ventricle allowing the closing of the aortic valve.
Before the left atrium contracts again, the pressure in the aorta reaches a minimum that is
called the diastolic blood pressure (DBP)1.
Average values of SBP and DBP at birth are approximately 70 and 50mmHg,
respectively, but increase to 120 and 80mmHg during adulthood2. In westernized
populations, SBP continues to rise throughout life reaching an average value of 140mmHg
by the seventh decade3. In the case of DBP, it reaches an average value of 80mmHg by the
fifth decade where it tends to be flat or even decline3. Isolated non-westernized populations
do not show a significant age-related increase in BP in adulthood after reaching the “normal
BP values” from normal growth4. Interestingly, this pattern changes when individuals from
these isolated population migrate to western cultures5.
Prominent factors that influence the age-related increase in blood pressure are gender,
ethnicity, earlier blood pressure levels, obesity and excess salt intake. When individuals
reach adolescence, BP levels in men are on average higher than in women. This difference
disappears in later stages of life and in fact is reversed at older ages, perhaps due to higher
mortality in hypertensive men3. Considering ethnicity, Hispanics have lower BP levels than
Caucasians and Asians6. The BP of African-Americans increases more sharply during their
second decade than Whites6. In the case of previous BP levels, it is well known that BP
values in a population are distributed as a near Gaussian distribution4 and that members of
the population tend to remain in the same relative position of the BP distribution later in life7,
8. This phenomenon is known as “tracking”. The US Health and Nutrition Education Survey
3
shows the tendency that individuals in the upper percentiles of the BP distribution have a
greater age-related increase in BP than the rest of the population9. In reference to obesity,
the Framingham study reported a clear relationship between the excess adipose cells,
which is a main characteristic of obese individuals, and an increase of SBP10. The trend was
4.5mmHg average increase of SBP for every 4.5 kg of weight gain. Finally in the case of salt
intake, an early experiment was conducted in 500 newborn infants for 6 month, in which the
sodium intake was reduced by half in 250 newborn11. This study showed that by reducing
the sodium intake, SBP was reduced by 2.1mmHg in comparison a newborn with normal
sodium intake. Later on, two studies showed that patients (with or without hypertension) who
restrict their sodium intake for 36 month12 to 5 years13 had reduced BP levels and decrease
incidence of hypertension compared to patients without a reduction in sodium intake.
Inter-individual differences in BP values may be influenced by genetic differences among
individuals, shared environmental factors such as a household or school effects, and factors
that are unique to an individual, including measurement error. All of these factors that
influence inter-individual BP variability can be investigated in family studies where familial
aggregation of BP values occur4. The Montreal Adoption14, 15study showed strong correlation
coefficients for SBP and DBP between related individuals that share genetic factors as well
as environmental factors16. On the other hand, the correlation coefficients for SBP and DBP
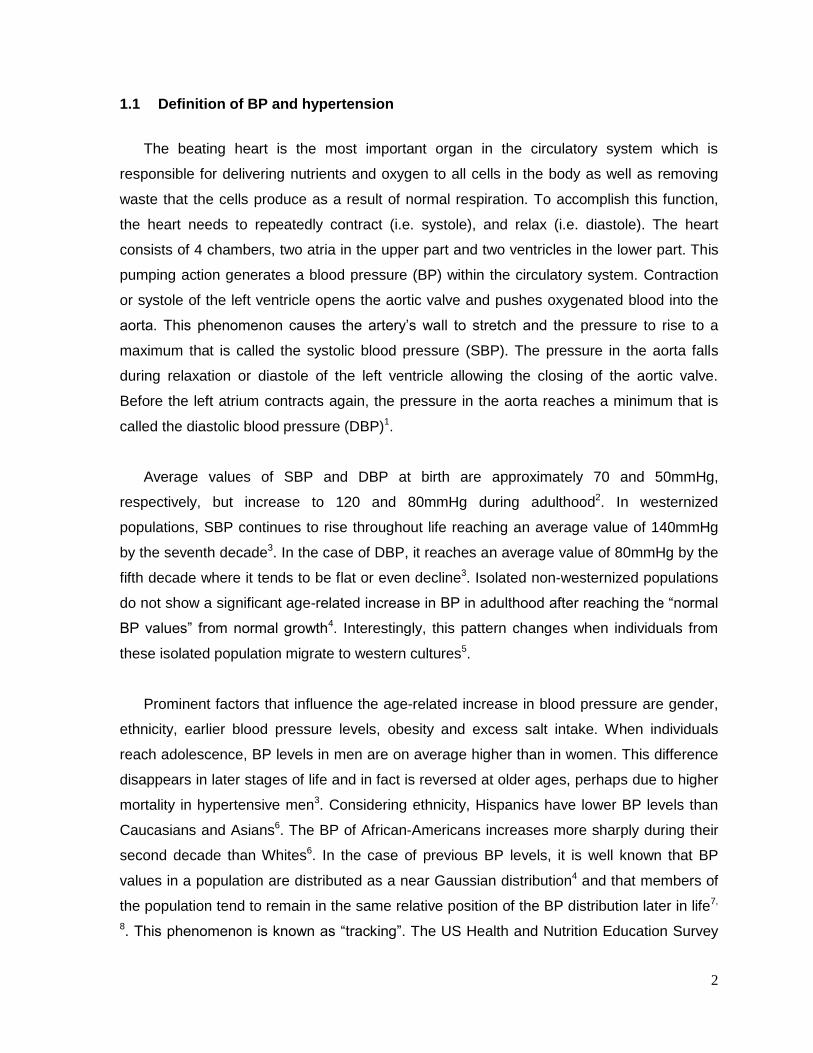
in unrelated individuals who only share environmental factors are lower (Table 1.). Taken
together, I conclude that there are clear genetic and environmental factors that influence
interindividual BP variability.
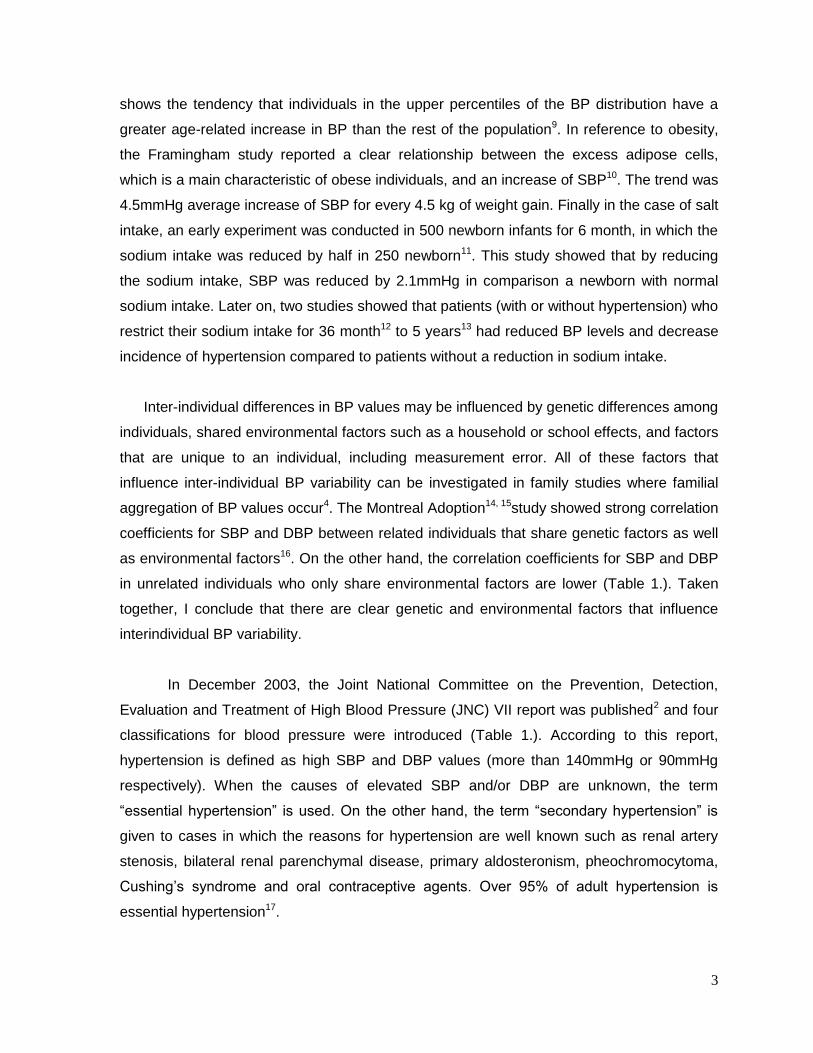
In December 2003, the Joint National Committee on the Prevention, Detection,
Evaluation and Treatment of High Blood Pressure (JNC) VII report was published2 and four
classifications for blood pressure were introduced (Table 1.). According to this report,
hypertension is defined as high SBP and DBP values (more than 140mmHg or 90mmHg
respectively). When the causes of elevated SBP and/or DBP are unknown, the term
“essential hypertension” is used. On the other hand, the term “secondary hypertension” is
given to cases in which the reasons for hypertension are well known such as renal artery
stenosis, bilateral renal parenchymal disease, primary aldosteronism, pheochromocytoma,
Cushing’s syndrome and oral contraceptive agents. Over 95% of adult hypertension is
essential hypertension17.
4
*total pairs of relative compared; +p=0.001; &p=0.01
Relationship N* SBP DBP
Spouses 521 0.146+ 0.175+
Father-Natural Child 198 0.237+ 0.205&
Mother-Natural Child 198 0.271+ 0.260+
Natural Siblings 94 0.382+ 0.525+
Father-Adopted Child 442 0.089 0.134&
Mother- Adopted Child 442 0.078 0.099
Adopted Siblings 154 0.164 0.285+
Natural child- Adopted
child 119 0.186 0.269+
Table 1.1: Estimated SBP and DBP correlation between household members14, 15
*based on blood pressure values alone
Blood Pressure
Classification
SBP
mmHg
DBP
mmHg
Lifestyle
Modification
Drug
Therapy*
Normal <120 and <80 No No
Prehypertension 120–139 or 80–89 Encourage No
Hypertension
Stage 1 140–159 or 90–99 Yes Yes
Hypertension
Stage 2 >160 or >100 Yes Yes
Table 1.2 Classification of blood pressure for adults
5
1.2 Hypertension as Cardiovascular Risk Factor
Multiple studies have showed a consistent and continuous relationship between
hypertension and risk of cardiovascular disease (CVD) events (atherosclerosis18,
hypertension retinopathy19, coronary artery disease, stroke, myocardial infarction and kidney
disease2, 20, 21). Lewington et al22 performed meta-analysis of 61 prospective studies that
included 1 million individuals; this analysis indicated that stroke and ischemic heart disease
(IHD) increase linearly with BP levels. The Framingham Heart Study23 reported that
individuals, with BP classified as prehypertensive or stage 1 hypertension, have a two-fold
increased risk to develop CVD compared to individuals with normal BP. The National High
Blood Pressure Education Program and other public health programs aim to increase the
control of hypertension and its treatment to reduce morbidity and mortality in the American
population2, 24. However, the prevalence of hypertension between 1999 and 2006 did not
show a significant decline (28% to 30% respectively). In addition, among those with
hypertension, only 78% are aware of their condition, and of them, only 68% are using
antihypertensive medication, and of them, only 64% are able to control their BP below the
recommended levels (BP less than 140/90mmHg)25. In general, hypertension affects 28% of
the adult population in America; and continues to be a significant contributor to morbidity
and mortality in the United States.
1.3 Treatment of Hypertension
The primary guidelines for the prevention and treatment of hypertension in the United
State are published by the U. S. Department of Health and Human Services, and its most
recent guidelines are given in “The Seventh Report of the Joint National Committee on
Prevention, Detection, Evaluation, and Treatment of High Blood Pressure: the JNC 7 report”
(JNC VII)2. According to JNC VII, the main objective of antihypertensive therapy is to
reduce SBP levels below 140mmHg; and DBP rates to 90mmHg in order to decrease CVD
complications26. However, in patients with diabetes or renal disease the goals are below
130mmHg for SBP and below 80mmHg for DBP27.
To reach these goals, lifestyle modification 28,29,30,31, 32 and pharmacological treatment
are needed. With respect to pharmacologic treatment, there are diverse drug classes that
can be used to control hypertension such as: thiazide diuretics (TZDs), beta blockers (BBs),
angiotensin II antagonist, aldosterone receptors blockers (ARB), angiotensin converting
enzyme inhibitors (ACEI), and calcium channels blockers (CCB).

6
Most hypertensive patients need a combination of drug classes to control their
hypertension33, 34. As an example, in the ALLHAT study, 60 % of patients on a two drugs
class treatment were able to reduce their BP to less than 140/90mmHg in comparison with
30% that achieved the same goal with only one drug treatment35. The JNC VII report cites
the findings from the ALLHAT study, which showed35 that the primary coronary heart
disease(CHD) outcome and mortality among patients using chlorthalidone (thiazide diuretic-
like), or lisinopril (ACEI) or amlodipine (CCB) were not different, suggesting the use of
thiazide diuretics, due to their cheaper price, as the main drug (either alone or in
combination with other drugs) to control hypertension.
Thiazide diuretics act mainly in the cortical portion of the ascending loop of Henlé (ALH)
and the distant convoluted tubule (DCT) after being excreted into the lumen by OCT1,
coded for by the SLC22A6 gene, and OCT3 coded for by the SLC22A8 gene36. The main
target of thiazide diuretics is the electro-neutral Na+-Cl- symporter (NCC). The NCC
reabsorbs Na+ and Cl- from the lumen of the tubule into the tubular cells due to the higher
concentration of sodium in the ALH and DCT. This sodium gradient is produced by the
depletion of sodium and gain of potassium from the tubular cell due to the Na+-K+-ATPase
antiport. This antiport is located in the basolateral membrane in the tubular cells. The NCC
binds sodium first which then increases the affinity for chloride at its binding site on the
symporter. When both ions are bound, the symporter transfers both Na+ and Cl- into the
tubular cells. TZDs inhibit the reabsorption of sodium and chloride by the symporter, but the
detailed way that the inhibition occurs is still unknown. It has been speculated that TZDs
compete with chloride for the chloride binding site37. TZDs also increase the excretion of
potassium and hydrogen ion for sodium at the DCT. It is not surprising then, that some
mutations in the NCC lead to the inherited hypokalemic alkalosis called Gitelman
syndrome38-40
The Veterans Administration Cooperative Study on Antihypertensive Agents41, trial
showed the importance of TZDs not only as antihypertensive drug therapy, but also as a
way to reduce CVD events (such Strokes, CHD and heart failure (HF)). Antihypertensive
drugs like aldosterone receptors blockers, angiotensin converting enzyme inhibitors, beta
blockers and calcium channel blockers have been used over the years in multiple clinical
trials33, 34, 42-46 with similar as in the case of TZDs. However, the ALLHAT clinical trial with
7
more than 40000 hypertensive individuals, showed that the incidence of HF was greater in
those randomized to the CCB arm compared to those to the TZDs.
1.4 Hydrochlorothiazide Treatment and its adverse effects
Hydrochlorothiazide (HCTZ), amongthethiazide diuretics, is one of the most common
prescribed drugs for BP control2, but some adverse effects have been reported. These
adverse effects can be classified into three main groups: physiological problems47, 48,
electrolyte defects (hyperuricemia, hyponatremia, and hypokalemia), and metabolic
abnormalities (hyperlipidemia and hyperglycemia)49. In the paragraphs below, I review each
of these adverse effects individually.
Hyperuricemia is defined as a serum uric acid concentration greater than 0.42mmol/L50.
It has been observed that patients treated with HCZT showed average levels of serum uric
acid of 0.54mmol/L51. When HCZT is taken, it competes with the uric acid for transport into
the cell52. This process results in hyperuricemia in HCZT-treated hypertensive patients.
Hyponatremia is defined as serum sodium level less than 134mmol/L and approximately
11% of geriatric patients treated with HCZT to control their blood pressure develop
hyponatremia53. Due to the activity of HCZT in the distal tubule, the activity of the antidiuretic
hormone (ADH) is enhanced so that water re-absorption occurs. As a result, the
concentration of Na in urine is higher than the concentration in plasma54, 55.
Hypokalemia is defined as serum K+ concentration less than 3.5mmol/L. Approximately
50% of patients treated with HCZT to control their blood pressure develop hypokalemia56.
The physiological mechanism responsible for the increase of K+ excretion in the urine is
thought to be inhibition of the renal sodium chloride co-transporter (symport) by HCZT57.
This inhibition increases the amount of sodium and water in the distal convolute tubule and
consequently the flow rate of urine. The increase in the flow rate stimulates distal potassium
secretion due to the wash-out of K from the lumen58.
Dyslipidemia is defined as the alteration of the amount of lipids in the blood. It has been
shown that patients using HZCT treatment for a short-term have modest increases in the
amount of LDL-cholesterol and triglycerides levels but HDL-cholesterol level does not show
any significant change49, 59, 60. As in the case of hyperglycemia, there is no agreed-upon
mechanism for how HZCT influences lipid concentration in the blood. The main hypothesis
involves increased insulin sensitivity in patients as well as increased activity in the RAA
system49.
8
Hyperglycemia is defined as high blood sugar. Two different epidemiologic studies61, 62
have reported an association between new-onset diabetes or hyperglycemia with HZCT
treatment for hypertension. The precise mechanisms of how HZCT influences
hyperglycemia are not well understood but there are two contemporary hypotheses. The first
one suggests that due to the block of the renal sodium chloride channel by HZCT, the
amount of excreted sodium increases, causing excretion of potassium in the urine63. The
second hypothesis states that due to the blood volume depletion resulting from HZCT, the
RAA system is activated, allowing aldosterone secretion which leads to increased potassium
secretion63. In either scenario, the hypotheses conclude that hypokalemia induces higher
proinsulin secretion over insulin. Proinsulin is less active than insulin. Therefore the
concentration of glucose in the blood increases56. It is my hope that additional insight into
the underlying mechanism of the metabolic side effects of diuretics will be obtained by
identifying genes contributing to the glucose-related response to diuretic therapy (Chapter 2
and 4).
In recent years, it has been theorized that HCTZ may promote kidney damage47, 48.
Although the main mechanisms remains unclear, animal models have shown that the use of
thiazide chronically induces the wrinkling and thickening of the glomerular basement64 as
well as apoptosis in distal tubule cells65, 66.
1.5 Role of potassium
On average, the total amount of potassium in the human body is 53.8mmol/kg body
weight; 2% is found in the extracellular spaces and 98% is intracellular67, 68. The plasma
concentration of potassium is kept between 3.5mEq/L to 5.0mEq/L. The balance of
potassium concentration and distribution is regulated by four main mechanisms: 1) the
gastrointestinal tract, 2) the Na+-K+-ATPase in the plasma membrane which is controlled by
several hormones, 3) activity of the sympathetic nervous system, and 4) the kidneys. Each
mechanism is discussed below:
1) The gastrointestinal tract absorbs most of the dietary intake of potassium, which
on average is 100mmol/day (80 to 120mmol/day)67, 69. However, 5% to 10% of
the dietary potassium is excreted through the feces. The colon is incapable of
increasing potassium secretion by itself, but during an episode of diarrhea68, the
loss of potassium could reach 30% to 60%.
9
2) The Na+-K+-ATPase pump keeps the transmembrane gradients of Na+ and K+70
in equilibrium. When sodium enters the cytosol, it produces a change in the
membrane potential (also known as hyperpolarization) due to the unequal exit of
potassium (three of Na+ for two of K+) to the lumen. Hyperpolarization is a
phenomenon that occurs before muscular movement.
3) Due to the interaction between the neurohumoral mediators (acetylcholine,
substance P) and their receptors in endothelial cells, the concentration of calcium
increases, the first step for the endothelium-derived hyperpolarizing factor or
EDHF-mediated response. The increase of intracellular calcium activates two
different potassium channels, known as the calcium-activated potassium
channels of small and intermediate conductance (SKCa, and IKCa respectively)70,
71. These channels release potassium to the lumen of the blood vessel as well as
to the intercellular space between endothelial and smooth muscle cells.
Endothelial cells take advantage of the hyperpolarization of vascular smooth cells
to regulate the diameter of blood vessels by the EDHF70, 71 in which potassium
plays an important role.
4) The last mechanism in the regulation of potassium concentration occurs in the
kidneys, where potassium is excreted by a combination of filtration, reabsorption
and secretion. All of these steps occur primarily in nephrons, which are formed
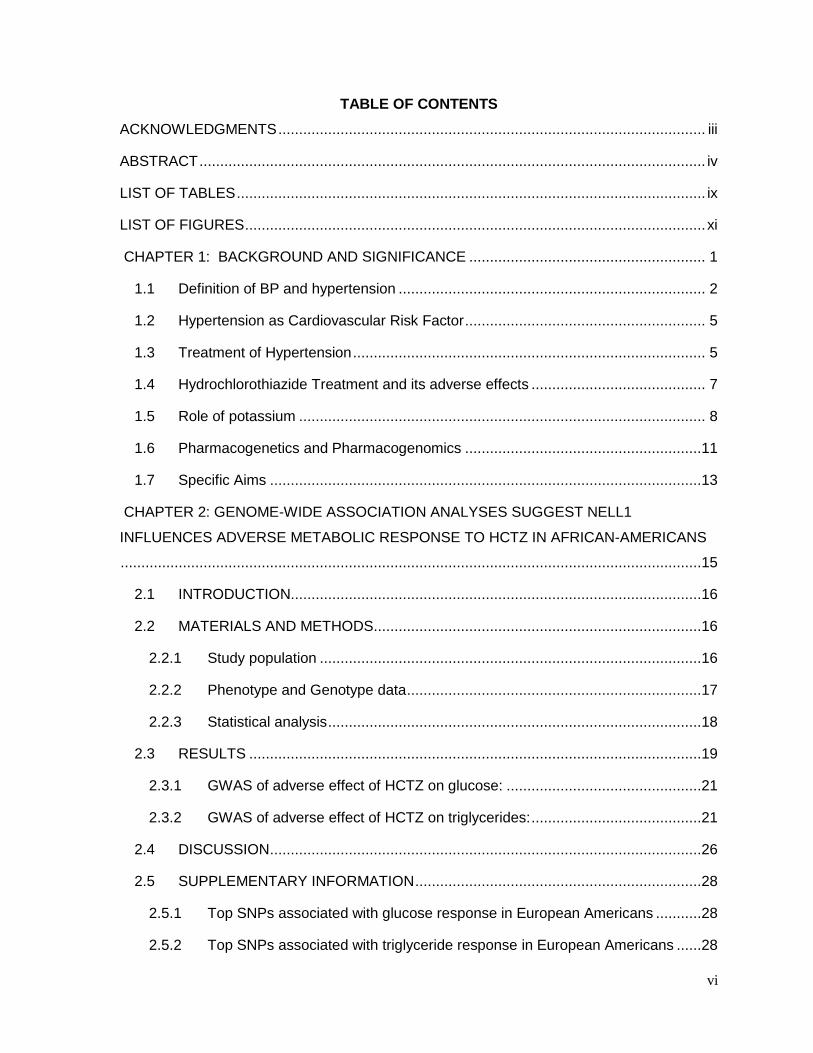
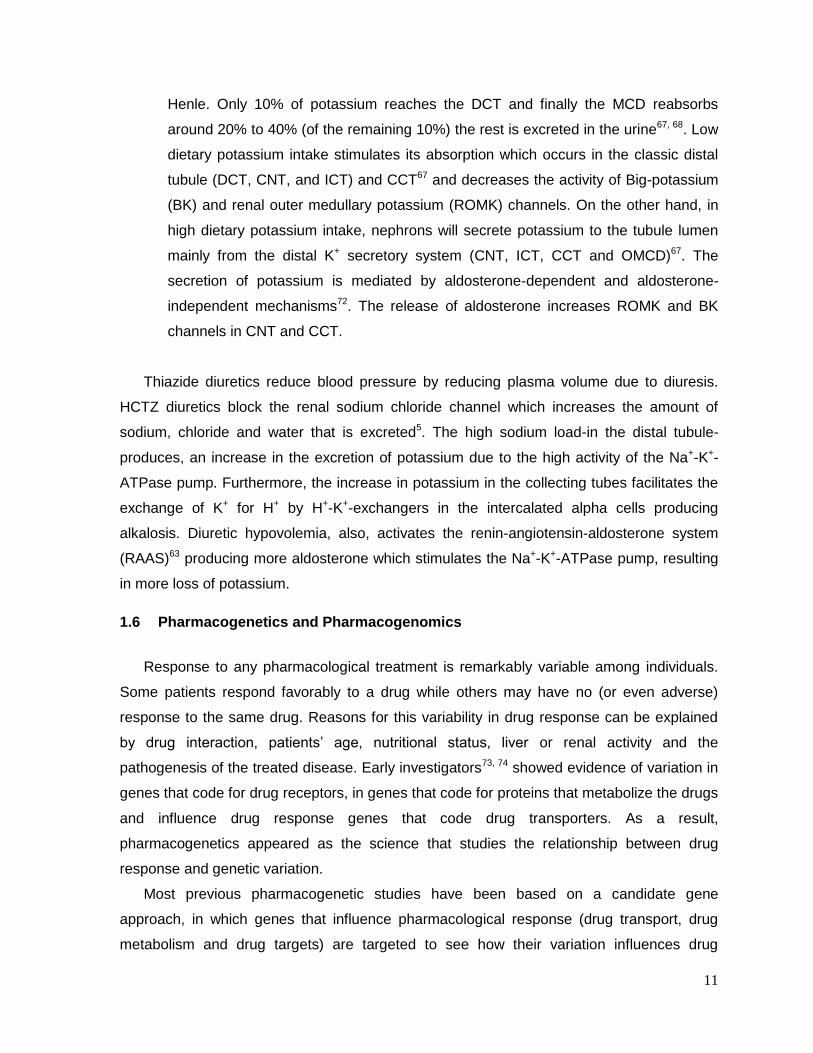
by eight parts (Figure 1.5.1): 1) the glomerulus, 2) the proximal tubule, divided in
two parts: the convoluted tubule (PCT) and the proximal straight tubule (PST),
3)Henle’s loop which consists of thin descending limb of Henle’s loop (tDHL), thin
ascending limb of Henle’s loop (tALH) and thick ascending limb of Henle’s loop
(TAL), 4) the distal convoluted tubule (DCT), 5) the connecting tubule (CNT), 6)
the initial convoluted tubule (ICT), 7) the cortical collecting tubule (CCT), and 8)
the medullary collecting tubule (MCD) which consists of the outer medullary
collecting duct (OMCD) and the inner medullary collecting tubule (IMCD).
Around ~800mmol of potassium is filtered in the glomerulus every day. Most of it,
approximately 80%, is reabsorbed by the PCT and 10% at the loop of
10
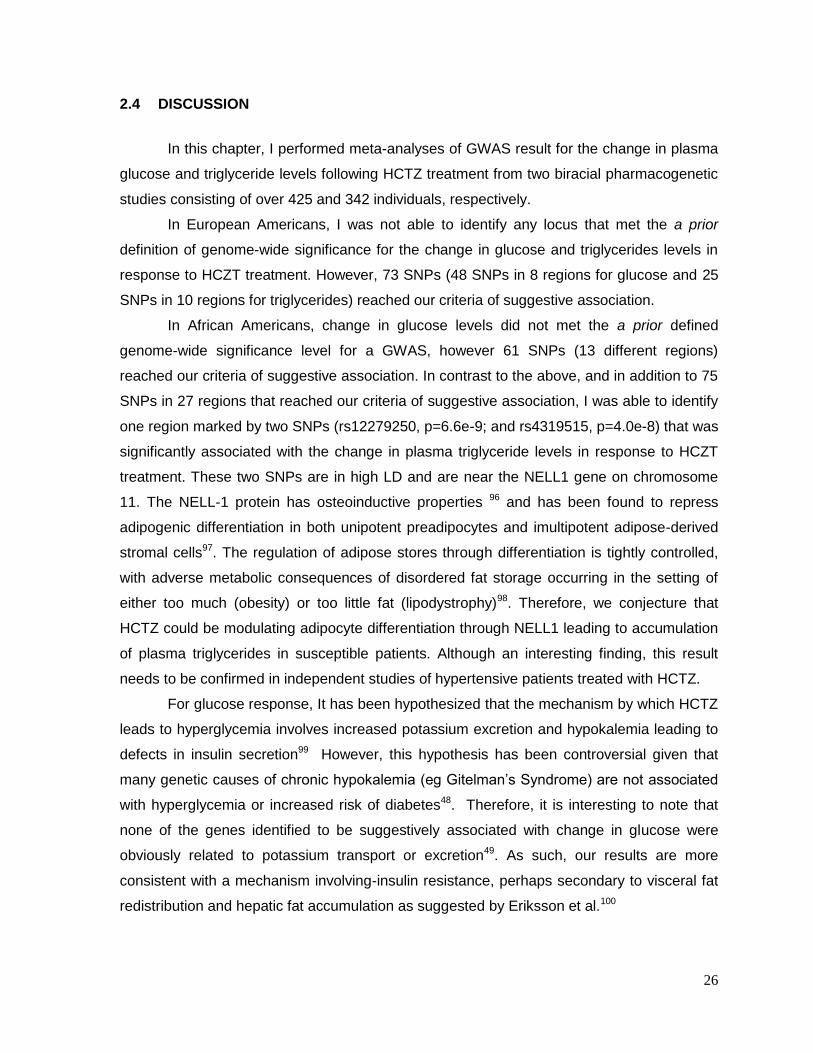
Figure 1.5.1: Potassium handling in superficial nephrons. Schematic was taken from Medical Physiology by Boron and Boulpaep67. PCT(proximal convoluted tubule), PST(proximal straight tubule), tDHL(thin descending limb of Henle’s loop), tALH(thin ascending limb of Henle’s loop), TAL(thick ascending limb of Henle’s loop), DCT(distal convoluted tubule), CNT(connecting tubule), ICT(initial convoluted tubule), CCT(cortical collecting tubule), OMCD(outer medullary collecting duct), IMCD(inner medullary collecting tubule)
11
Henle. Only 10% of potassium reaches the DCT and finally the MCD reabsorbs
around 20% to 40% (of the remaining 10%) the rest is excreted in the urine67, 68. Low
dietary potassium intake stimulates its absorption which occurs in the classic distal
tubule (DCT, CNT, and ICT) and CCT67 and decreases the activity of Big-potassium
(BK) and renal outer medullary potassium (ROMK) channels. On the other hand, in
high dietary potassium intake, nephrons will secrete potassium to the tubule lumen
mainly from the distal K+ secretory system (CNT, ICT, CCT and OMCD)67. The
secretion of potassium is mediated by aldosterone-dependent and aldosterone-
independent mechanisms72. The release of aldosterone increases ROMK and BK
channels in CNT and CCT.
Thiazide diuretics reduce blood pressure by reducing plasma volume due to diuresis.
HCTZ diuretics block the renal sodium chloride channel which increases the amount of
sodium, chloride and water that is excreted5. The high sodium load-in the distal tubule-
produces, an increase in the excretion of potassium due to the high activity of the Na+-K+-
ATPase pump. Furthermore, the increase in potassium in the collecting tubes facilitates the
exchange of K+ for H+ by H+-K+-exchangers in the intercalated alpha cells producing
alkalosis. Diuretic hypovolemia, also, activates the renin-angiotensin-aldosterone system
(RAAS)63 producing more aldosterone which stimulates the Na+-K+-ATPase pump, resulting
in more loss of potassium.
1.6 Pharmacogenetics and Pharmacogenomics
Response to any pharmacological treatment is remarkably variable among individuals.
Some patients respond favorably to a drug while others may have no (or even adverse)
response to the same drug. Reasons for this variability in drug response can be explained
by drug interaction, patients’ age, nutritional status, liver or renal activity and the
pathogenesis of the treated disease. Early investigators73, 74 showed evidence of variation in
genes that code for drug receptors, in genes that code for proteins that metabolize the drugs
and influence drug response genes that code drug transporters. As a result,
pharmacogenetics appeared as the science that studies the relationship between drug
response and genetic variation.
Most previous pharmacogenetic studies have been based on a candidate gene
approach, in which genes that influence pharmacological response (drug transport, drug
metabolism and drug targets) are targeted to see how their variation influences drug
12
response66. In most cases, multiple genes are acting in concert to influence drug response75.
To consider all possible genes, pharmacogenetics morphed its name to pharmacogenomics,
where a key approach is the genome-wide association (GWA) study, in which we do not
need to invoke a priori candidate genes but we can identify and estimate possible
associations among all genes and drug response.
Relevant to pharmacogenomics, there are two main problems that all clinicians face.
First, not everybody equally metabolizes a drug76. In real life, clinicians are forced to address
“trial and error” approach in order to administrate the right drug dose that can help every
patient. The second problem is Adverse Drug Reactions (ADR) that result from many drugs
treatments. These ADRs produce illness and in some cases even death. In a typical
hospital, 3 to 11% of its ER admissions are related ADRs77, which leads to 2 million
admissions in a year and 110,000 deaths in the same period of time due to ADRs. These
estimates put ADRs between the 4th to 6th leading causes of death in the United States77,
with an estimated cost of more than $4 billion78. A goal of pharmacogenomics is to tailor
therapy selection to improve drug treatment as well as to reduce ADRs. The warfarin drug
case is a good example of what pharmacogenetics can accomplish.
Warfarin is a common drug that is used as an oral anticoagulant79. It targets the vitamin
K cycle which is important in the carboxylation of the glutamic acid residues that are found in
clotting factors. Warfarin is metabolized by CYP2C9; there are two significant alternative
functional versions of the enzyme that are common in populations of European ancestry, the
CYP2C9*2 (Arg144Cys) and CYP2C9*3(Ile359Leu)79. If a patient is at risk for thrombosis
and has the CYP2C9*3/*3 variant, normal doses of warfarin will not be effective, and a lower
concentration of the drug will be needed. On the other hand, if the patient has the
CYP2C9*1/*1 variant of the enzyme, a normal dose of warfarin will be effective. Therefore,
knowing in advance the genotype of CYP2C9 enzyme in each patient will facilitate safe
initiation of warfarin therapy. This approach was the basis of a clinical trial reported by
Pirmohamed et al80, but contradicted by Kimmel at el81. It is the case that events measured
in both clinical trials, such as rates of bleeding or thromboembolic events did not differ
between groups, but these trials were not powered to calculate these outcomes.
In the case of Thiazide diuretics, there is not yet a clear result ready to make the
transition from the “bench to bedside”. However there are interesting polymorphisms that
have been reported using pharmacogenetics and pharmacogenomics during the past years.
Turner et al82 showed mean declines in SBP and DBP (6±2mmHg and 5±1mmHg) in TT
than in CC homozygotes in the C825T polymorphism of the gene G-protein β3-subunits
13
(GNB3) in association with HCTZ. A difference in gender response was also found between
ACE insertion/deletion (I/D) polymorphism and HCTZ by Schwartz et al83. Women with the II
genotype have greater mean declines in SBP and DBP than DD homozygotes meanwhile in
the case of men, DD were the ones with greater response than II homozygotes. The
Glu298Asp polymorphism of the endothelial nitric oxide synthase (NOS3), related to smooth
muscle relaxation, was associated between African-Americans and European-Americans
DBP (GG=-8.6±0.4 vs GT+TT=-7.1±0.6) response and HCTZ84. This polymorphism explains
1% of interindividual variation response to HCTZ. Matayoshi et al85 found a difference
between responders and non-responders to HCTZ in Japanese individuals with a
polymorphism in the Na+-Cl- cotransporter SLC12A3 C1784T and in the β3-adrenonergic
receptor (ADRB3) T727C. The odds ration of the former was 3.81 (C allele vs T allele) and
of, the latter was 4.59 (T allele vs C allele). The gene WNK lysine deficient protein kinase 1
(WNK1), has three SNPs86 that have been shown to be associated with ambulatory BP and
they predict 4% of variation in SBP and DBP responses to HCTZ. In Chinese individuals,
Lou et al87 found that rs4149601(G/A) in neural precursor cell-expressed developmentally
downregulated 4-like(NEDD4L) was associated to response in BP due to HCTZ. The A
carriers had a greater reduction in BP than GG homozygotes (SBP: 6.1mmHg, DBP:
2.7mmHg).
In one of the first pharmacogenomic studies of its kind, Turner et al88 identified novel
genes associated with DBP response to HCTZ in a region on chromosome 12. The following
genes were located in this region: lysozyme (LYS), YEAST domain-containing 4 (YEAST4)
and fibroblast growth receptor substrate 2 (FRS2). This association was replicated by
Duarte et al89 in an independent data set of 746 European-Americans and African-
Americans.
1.7 Specific Aims
My dissertation research investigated the association between genome-wide common
single nucleotide polymorphism (SNP) variation and the onset of thiazide-induced ADRs in
multiple samples of primary hypertensive patients. Following this introductory chapter, this
project dissertation consists in the following aims and chapters:
14
Aim 1 and Chapter 2: Use a genome wide association approach in the GERA and
PEAR studies to identify loci significantly associated with glucose and triglycerides
response.
Linear regression and meta-analysis were used to evaluate the association between
genome-wide SNP data and HCTZ-induced glucose and triglycerides response in
unrelated primary hypertensive individuals.
Aim 2 and Chapter 3: Use a genome-wide association approach in the CHARGE
consortium to identify loci influencing the change in fasting glucose and fasting
insulin levels after initiating diuretic treatment.
Longitudinal regression and meta-analysis were used to evaluate the influence single
nucleotide polymorphism on thiazide-associated changes in fasting glucose and
fasting insulin levels.
Aim 3 and Chapter 4: Use a genome wide association approach in the GERA and
PEAR studies to identify loci significantly associated with the change in blood
potassium levels following HCTZ therapy.
Linear regression and trans-ethnic meta-analysis were used to evaluate the
association between the genome data and change in potassium levels due to HCTZ
in unrelated primary hypertensive individuals.
The findings from studies are summarized and synthesized in a concluding Chapter 5
that contains thought regarding the pharmacogenomics antihypertensive field as well as
future research directions.
15
CHAPTER 2: GENOME-WIDE ASSOCIATION ANALYSES SUGGEST NELL1
INFLUENCES ADVERSE METABOLIC RESPONSE TO HCTZ IN AFRICAN-
AMERICANS
This chapter is based upon: Del-Aguila JL, Beitelshees AL, Cooper-Dehoff RM,
Chapman AB, Gums JG, Bailey K, Gong Y, Turner ST, Johnson JA, Boerwinkle E
Pharmacogenomics J. 2014 Feb;14(1):35-40. doi: 10.1038/tpj.2013.3 (permission from
Nature Publishing Group)
16
2.1 INTRODUCTION
Hydrochlorothiazide (HCTZ) is a prescribed drug for treatment of hypertension90 but
its ability to produce a variety of adverse drug reactions (ADR), such as hyperglycemia 61-63
and dyslipidemia 49, 59, 60, 63, is well-known. However, the mechanisms of these thiazide-
induced ADRs are not well understood.
There are two hypotheses about how HCTZ influence the change in concentration
plasma glucose. The first one states that a relationship between HCTZ-induced
hypokalemia 49, 91 and impairing insulin secretion is the main cause of the change in glucose.
The second hypothesis suggested that HCTZ increases visceral and hepatic fat
accumulation, which could promote insulin resistance [10].
Other two hypotheses try to explain the of HCTZ-induced dyslipidemia. The first
hypothesis, which is contradictory 92, 93, suggests that hemoconcentration, caused by the
volume depletion due to HCTZ, stimulates the renin-angiotensin-aldosterone system
(RAAS) thereby stimulating catecholamine release and subsequent adipose tissue lipolysis.
The second hypothesis is an incremental reduction of lipoprotein lipase activity due to
interference in the production, release or action of insulin by HCTZ [12].
This chapter tries to identify the possible molecular mechanisms of these ADR by
identifying genetic variations that are predictive of inter-individual variation in ADR after
HCTZ treatment using a genome-wide association study (GWAS).
2.2 MATERIALS AND METHODS
2.2.1 Study population
Phenotype and genotype data were collected from The Pharmacogenomic
Evaluation of Antihypertensive Responses (PEAR-clinicaltrials.gov identifier NCT00246519)
study and the Genetic Epidemiology of Responses to Antihypertensive (GERA-
clinicaltrials.gov identifier NCT00005520) study. In both studies, participants had mild to
moderate primary hypertension without a history of heart disease or diabetes mellitus.
Primary hypertension was defined as blood pressure levels greater than 140/90 mmHg or
current use of prescription antihypertensive medications in the absence of a known cause
for elevated BP. If at any time during the study protocols described below the average
diastolic blood pressure (DBP) rose to greater than 110 mmHg or the systolic blood
pressure (SBP) to greater than 180mmHg, participants were withdrawn from further study
17
participation and prescribed effective antihypertensive drug therapy. Details about the study
designs and exclusion and inclusion criteria have been described previously. Briefly, in the
PEAR study, individuals of any race-ethnicity and gender combination from age 17 to 65
years old with mild to moderate primary hypertension were recruited. Participants were
enrolled in Gainesville, Fl; Atlanta, GA; and Rochester, MN. All participants were newly
diagnosed hypertensives, untreated hypertensives or treated hypertensives taking less than
three antihypertensive drugs. The protocol of the study was as follows: A wash out period of
approximately 4 weeks was done in order to remove the effects of previous blood pressure
medication (if any) from the participants. If at the end of the wash out period the average
seated home DBP was > 85mmHg, office DBP was > 90 mmHg and the home and office
SBP was < 180mmHg the individuals were enrolled into the randomized phase. All biological
samples (blood and urine) were collected in the fasting state. As soon as the baseline
evaluations were completed, the individuals were randomized to HCTZ (thiazide diuretic
12.5mg orally once daily) or atenolol (β-blocker 50mg orally once daily) for three weeks, with
dose doubling (25 mg) for those with BP > 120/70 mmHg for an additional 6 weeks. More
than 90% of PEAR participants received the higher 25 mg dose of HCTZ. For this AME
GWAS analysis, we used only the patients randomized to the HCTZ from the PEAR study,
referred to hereafter as PEAR HCTZ monotherapy.
In the GERA study, African-Americans and European Americans with primary
hypertension were recruited at Emory University in Atlanta, GA and at the Mayo Clinic in
Rochester, MN, respectively. The protocol for the GERA study was as follows: a wash-out
period of at least 4 weeks was done in order to remove the effects of previous blood
pressure medication. If at the end of the wash out period the average office DBP was> 90
mmHg, qualifying individuals were treated with HCTZ (25 mg orally once daily) for 4 weeks.
Blood pressure was measured in the seated position using a mercury sphygmomanometer
and blood samples were obtained for baseline biochemical measurements. At the end of the
4 week diuretic treatment period, blood pressure was measured and blood samples were
again obtained for biochemical measurements. All blood collections were done in the
morning after 8 hours of fasting.
All patients enrolled in PEAR and GERA provided written informed consent, and the
institutional review boards of participating study centers approved the study protocols.94
2.2.2 Phenotype and Genotype data
18
All biomedical measurements were made in a central laboratory at the Mayo Clinic.
In the PEAR study, these methods were implemented on a Hitachi 911 Chemistry Analyzer
(Roche Diagnostics, Indianapolis, IN, USA). In the GERA study, plasma glucose
concentrations were determined by automated spectrophotometric methods implemented on
an IL Monarch Chemistry system 760 (Instrumentation Laboratories, Lexington, MA, USA).
Triglyceride concentrations were determined spectrophotometrically using Roche reagents
on a Cobas Mira analyzer. In both studies, plasma glucose and triglyceride concentrations
were measured at the end of the wash-out period (baseline) and at the end of the HCTZ
period (final). Glucose and triglyceride responses to HCTZ were defined as the difference
between the levels at the final and the baseline visits. Individuals with response values
under or over 3 standard errors from the mean response were removed from the analysis.
Plasma insulin, which was used as a covariate during statistical analyses, was measured
using the Access Ultrasensitive Insulin immunoassay system.
In the PEAR study, individuals were genotyped on the Illumina HumanOmni1-Quad
(Illumina, San Diego, California, USA). GERA participants from the opposite extremes of the
DBP response distribution were genotyped using the GeneChip Human Mapping 500k
Array, (Affymetrics, Santa Clara California, USA) using standard procedures. As part of
routine quality control steps, single nucleotide polymorphisms (SNPs) with minor allele
frequency (MAF) <1%, call rates <95%, Hardy-Weinberg equilibrium p-values ≥10-5 and
individuals with more than 10% missing genotypes were removed from the analysis. The
software MACH95 (www.sph.umich.edu/csg/abecasis/MACH/download) was used to impute
the approximate 2.5 million HapMap SNPs using the Phase II CEU as the reference panel
for European-Americans and a cosmopolitan sample of CEU and YRI for African-Americans.
Quality control for the imputed results was done using standard procedures (RSQ_HAT <0.3
and MAF ≤ 0.05). MACH generated a file with the highest posterior probabilities for each
imputed SNP which was used in the analysis. After quality control and imputation, there
were more than 2 million SNPs used for the genotype-phenotype association studies in
each race-study group.94
2.2.3 Statistical analysis
Analyses were done by self-reported race within each study and later the results
were combined across studies within races using meta-analysis using a fixed effect model
weighted by the inverse of the variance of the race and study-specific β-estimates. Linear
19
regression assuming an additive model was performed using ProbABEL to evaluate the
association between each SNP and metabolic responses to HCTZ. The variables sex, age,
waist circumference, baseline glucose or triglycerides, and baseline insulin were used as
covariates. The inclusion of the baseline value as covariate has both detractor and
supporters, and our goal was to identify loci that influence change in glucose and
triglycerides independent of any baseline effects.
To avoid the possibility of spurious association as the result of population
substructure, the two first principal component scores (PCS) were used as covariates in the
analysis. These PCS were obtained using the EIGENSTRAT software
(genepath.med.harvard.edu/~reich/EIGENSTRAT.htm). After meta-analysis, the definition of
statistical significance was p<5x10⁻⁸ and the same direction of effects (i.e. the sign of β) in
each study. A statistically suggestive p-value was defined as p<1x10⁻⁵ and the same
direction of effects and was used in order to avoid discounting true positive associations.94
2.3 RESULTS
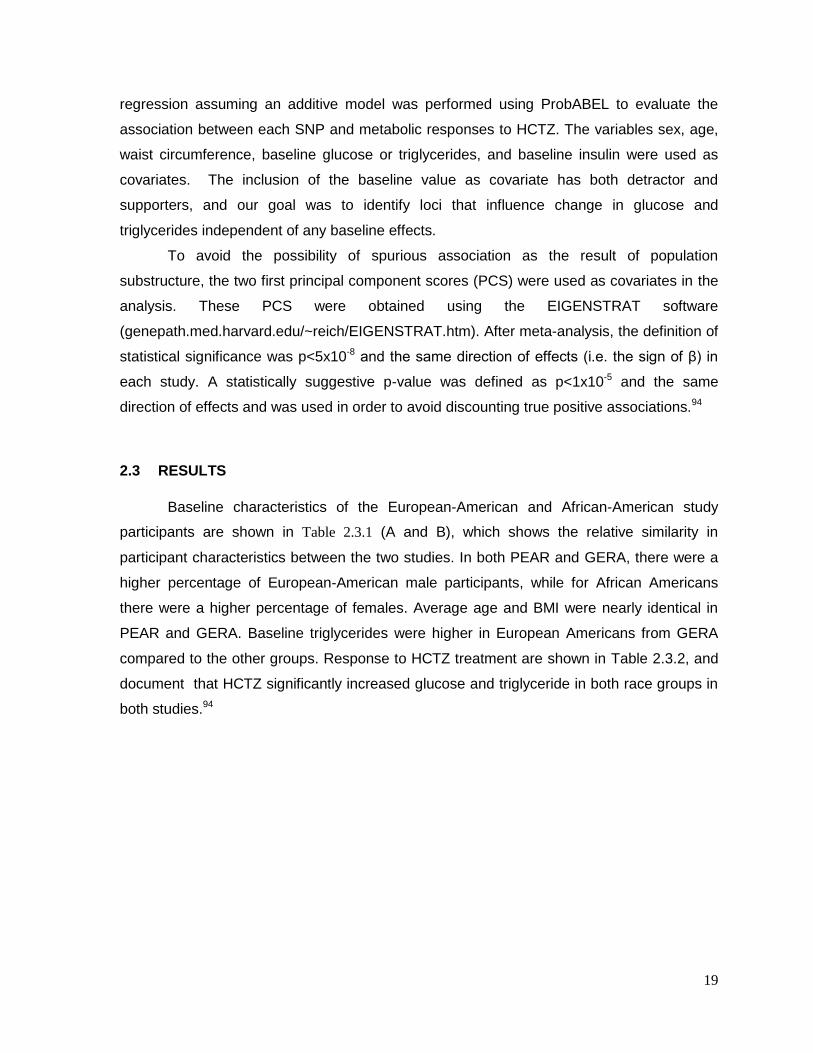
Baseline characteristics of the European-American and African-American study
participants are shown in Table 2.3.1 (A and B), which shows the relative similarity in
participant characteristics between the two studies. In both PEAR and GERA, there were a
higher percentage of European-American male participants, while for African Americans
there were a higher percentage of females. Average age and BMI were nearly identical in
PEAR and GERA. Baseline triglycerides were higher in European Americans from GERA
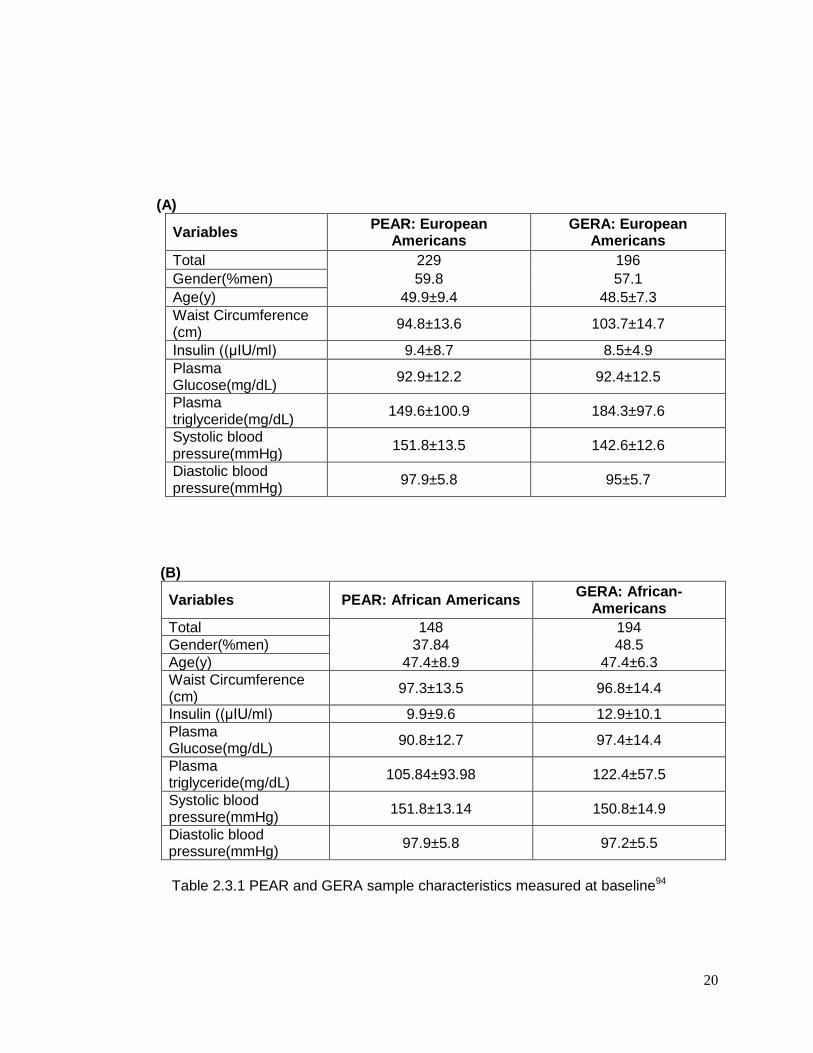
compared to the other groups. Response to HCTZ treatment are shown in Table 2.3.2, and
document that HCTZ significantly increased glucose and triglyceride in both race groups in
both studies.94
20
(A)
Variables PEAR: European
Americans GERA: European
Americans
Total 229 196
Gender(%men) 59.8 57.1
Age(y) 49.9±9.4 48.5±7.3
Waist Circumference (cm)
94.8±13.6 103.7±14.7
Insulin ((μIU/ml) 9.4±8.7 8.5±4.9
Plasma Glucose(mg/dL)
92.9±12.2 92.4±12.5
Plasma triglyceride(mg/dL)
149.6±100.9 184.3±97.6
Systolic blood pressure(mmHg)
151.8±13.5 142.6±12.6
Diastolic blood pressure(mmHg)
97.9±5.8 95±5.7
(B)
Variables PEAR: African Americans GERA: African-
Americans
Total 148 194
Gender(%men) 37.84 48.5
Age(y) 47.4±8.9 47.4±6.3
Waist Circumference (cm)
97.3±13.5 96.8±14.4
Insulin ((μIU/ml) 9.9±9.6 12.9±10.1
Plasma Glucose(mg/dL)
90.8±12.7 97.4±14.4
Plasma triglyceride(mg/dL)
105.84±93.98 122.4±57.5
Systolic blood pressure(mmHg)
151.8±13.14 150.8±14.9
Diastolic blood pressure(mmHg)
97.9±5.8 97.2±5.5
Table 2.3.1 PEAR and GERA sample characteristics measured at baseline94
21
(A)
Variables PEAR: European
Americans GERA: European
Americans
Plasma Glucose response (mg/dL)
1.44±8.9 (p =0.01) 3.03±7.6 (p<0.0001)
Plasma triglyceride response (mg/dL)
8.21±58.7 (p = 0.2) 14.57±59.9 (p<0.0001)
(B)
Variables PEAR: African Americans GERA: African
Americans
Plasma Glucose response (mg/dL)
2.55±10.8 (p <0.005) 4.3±9.5 (p <0.0001)
Plasma triglyceride response (mg/dL)
7.95±40.6 (p = 0.02) 9.56±40.3 (p <0.0001)
Table 2.3.2 HCTZ treatment response in PEAR and GERA sample94
2.3.1 GWAS of adverse effect of HCTZ on glucose:
The meta-analysis of glucose change during HCTZ treatment revealed no SNPs that
achieved the a priori definition of genome-wide significance in either European Americans or
African Americans. The Manhattan plots and QQ plots for these analyses are shown in
Supplement Figure 2.5.1 and Figure 2.5.3 (supplementary information pp. 28-48) However,
in European Americans 48 SNPs from 8 genomic regions achieved our definition of
suggestive significance with p < 1x10⁻⁵ having effects in the same direction in both studies.
Likewise, in African Americans 61 SNPs in 12 genomic regions met these criteria. Each of
these SNPs is summarized in Supplemental Table 2.5.1, Table 2.5.2 and Table 2.5.5,
Table 2.5.6 (supplementary information pp. 28-48).94
2.3.2 GWAS of adverse effect of HCTZ on triglycerides:
Among African Americans, two SNPs (rs12279250 and rs4319515 (r2=0.73)) on
chromosome 11, reached genome-wide significance (β=28 mg/dl, p=6.6x10⁻⁹and β=27
mg/dl, p=4.05x10⁻⁸ respectively). The Manhattan plot is shown in Figure 2.3.1, and Figure
2.3.3 displays the triglyceride response by genotype in both PEAR and GERA. These SNPs
22
are in the NELL1 gene, whose encoded protein is involved in adipose cell differentiation. No
SNPs achieved genome-wide significance for triglyceride response among European
Americans(supplementary Figure 2.5.2) .
As was the case with the HCTZ-induced change in glucose, the triglyceride response
also had many SNPs that met our suggestive significance threshold. In European
Americans 25 SNPs in 10 genomic regions met the threshold of p < 1x10⁻⁵ with a same
direction effect, with 77 SNPs in 27 genomic regions meeting this threshold in African
Americans. Many of these SNPs were genes previously associated with metabolic
syndrome, diabetes, insulin and other metabolic traits. These SNPs are described in detail
in Supplemental Table 2.5.3, Table 2.5.4 and Table 2.5.7, Table 2.5.8 (supplementary
information pp 28-48) 94
23
Figure 2.3.1 GWAS meta-analysis Manhattan plot showing the association of triglyceride
response to HCTZ treatment in African Americans in the PEAR and GERA studies. Two
SNP on chromosome 11 showed genome-wide significance (p=5 x 10⁻⁸). Eighteen loci
showed p-values less than the suggestive threshold (p=1 x 10⁻⁵).94
24
Figure 2.3.2: Regional Plot oon Chromosome 11 showing the position of the top signal
associated of triglyceride response to HCTZ treatment in African Americans in the PEAR
and GERA studies
25
Figure 2.3.3: Means change in triglycerides adjusted for sex, age, waist circumference, base
line insulin, base line triglycerides, and the two principle components depending on
rs12279250 genotype (CC, CT, TT) for PEAR and GERA studies. Error bars represent
standard error of the mean.94
26
2.4 DISCUSSION
In this chapter, I performed meta-analyses of GWAS result for the change in plasma
glucose and triglyceride levels following HCTZ treatment from two biracial pharmacogenetic
studies consisting of over 425 and 342 individuals, respectively.
In European Americans, I was not able to identify any locus that met the a prior
definition of genome-wide significance for the change in glucose and triglycerides levels in
response to HCZT treatment. However, 73 SNPs (48 SNPs in 8 regions for glucose and 25
SNPs in 10 regions for triglycerides) reached our criteria of suggestive association.
In African Americans, change in glucose levels did not met the a prior defined
genome-wide significance level for a GWAS, however 61 SNPs (13 different regions)
reached our criteria of suggestive association. In contrast to the above, and in addition to 75
SNPs in 27 regions that reached our criteria of suggestive association, I was able to identify
one region marked by two SNPs (rs12279250, p=6.6e-9; and rs4319515, p=4.0e-8) that was
significantly associated with the change in plasma triglyceride levels in response to HCZT
treatment. These two SNPs are in high LD and are near the NELL1 gene on chromosome
11. The NELL-1 protein has osteoinductive properties 96 and has been found to repress
adipogenic differentiation in both unipotent preadipocytes and imultipotent adipose-derived
stromal cells97. The regulation of adipose stores through differentiation is tightly controlled,
with adverse metabolic consequences of disordered fat storage occurring in the setting of
either too much (obesity) or too little fat (lipodystrophy)98. Therefore, we conjecture that
HCTZ could be modulating adipocyte differentiation through NELL1 leading to accumulation
of plasma triglycerides in susceptible patients. Although an interesting finding, this result
needs to be confirmed in independent studies of hypertensive patients treated with HCTZ.
For glucose response, It has been hypothesized that the mechanism by which HCTZ
leads to hyperglycemia involves increased potassium excretion and hypokalemia leading to
defects in insulin secretion99 However, this hypothesis has been controversial given that
many genetic causes of chronic hypokalemia (eg Gitelman’s Syndrome) are not associated
with hyperglycemia or increased risk of diabetes48. Therefore, it is interesting to note that
none of the genes identified to be suggestively associated with change in glucose were
obviously related to potassium transport or excretion49. As such, our results are more
consistent with a mechanism involving-insulin resistance, perhaps secondary to visceral fat
redistribution and hepatic fat accumulation as suggested by Eriksson et al.100
27
The strengths of this study include the population based design, the high quality of
genotyping and phenotyping, the wash out period between drugs as well as the detailed
follow-up of study participants. At the same time, we are aware of the limitation posed by
the small sample size. While under-powered, it is interesting to note that some of the
suggestive regions described in the Supplementary results were related to previous GWAS
signals or candidate genes for traits related to type 2 diabetes, obesity, fatty acid
metabolism, lipid metabolism, glucose metabolism or BMI.
28
2.5 SUPPLEMENTARY INFORMATION
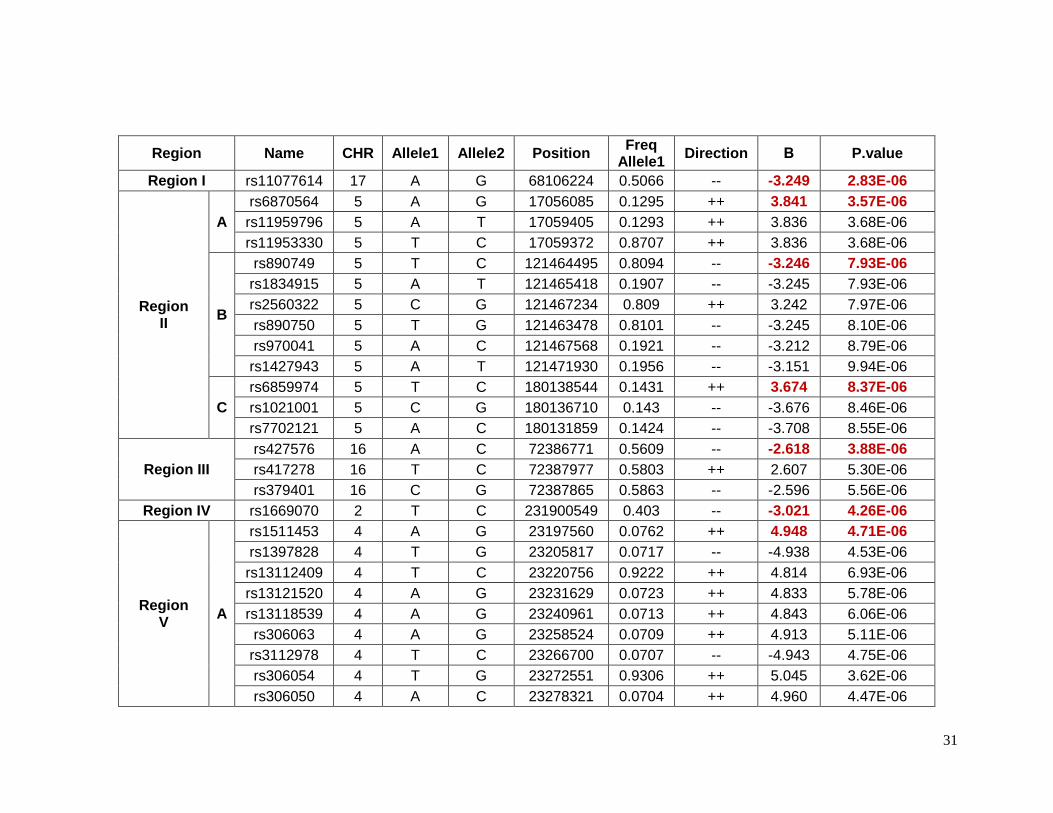
2.5.1 Top SNPs associated with glucose response in European Americans
Forty-eight SNPs reached the suggestive p-value of 1 X 10⁻⁵ for glucose response to
HCTZ in Non-Hispanic whites. These SNPs were located in 8 different chromosomes or
regions ( Table 2.5.1). The SNPs with the lowest p-values of association in each region
were selected as index SNPs. These index SNPs were also in high LD with the rest of the
SNPs in the same region. Table 2.5.2 shows detailed information for index SNPs.
Chromosome 17 contains the SNP rs11077614, which the lowest p-value (p=2.83e-6) for
this group. It has a β value indicating that with the presence of each minor allele (G) the
change in glucose levels are decreased by 3.25 mg/dL. The closest gene to this SNP is the
solute carrier family 39, member 11 (SLC39A11) which is a metal ion transporter. The index
SNPs rs6870564, rs890749 and rs6859974 were located on chromosome 5 but in different
loci. Three other lead SNPs (rs1974942, rs1511453 and rs17644018) were located on
chromosome 4 but also in different loci. Among the SNPs on chromosome 5, the SNP
rs6859974 is closed to mannosyl (alpha-1,3-)-glycoprotein beta-1,2-N-
acetylglucosaminyltransferase gene (MGAT1) which is related to fatty acid metabolism101.
MGAT1 was previously associated with obesity in linkage and GWAS. The SNP rs7762018
is located on chromosome 6 in the region known as insulin-dependent diabetes mellitus 8
(IDDM8). This region was associated with type 1 diabetes in an affected-sib-pair analysis,
and confirmed later in a larger family study and later in a GWAs studies. Other genes in
these regions have been previously associated with overweight and obesity include
neuromedin U receptor (NMUR1) and 5-hydroxytryptamine (serotonin) receptor 2B
(HTR2B). Both genes are closed to rs1669070 (p=4.26e-6) on chromosome 2. A previous
meta-analysis and candidate gene study have shown a significantly associated risk of Type
2 diabetes and the polymorphism Thr394Thr(G/A) in the gene peroxisome proliferator-
activated receptor gamma, coactivator 1 alpha (PPARGC1A) in Indians and Asians which is
close to rs1511453 (p= 4.71e-6) in chromosome 4 in our study. The Thr394Thr(G/A)
polymorphism is equivalent to rs2970847, which as a p-value of 0.93 in these data.94
2.5.2 Top SNPs associated with triglyceride response in European Americans
Twenty five SNP in 10 different chromosomes reached suggestive p-values for the
change in plasma triglycerides in non-Hispanics whites (Table 2.5.3). The SNP rs17560407
29
in chromosome 5 had the lowest p-value (p=5.41e-7) for this phenotype. This SNP is close
to the myocyte enhancer factor 2C gene (MEF2C) which is reported to be required for the
expression of GLUT4 gene as well as to be related to type 2 diabetes. Another gene related
to GLUT4 translocation in adipocytes is the pleckstrin homology-like domain, family B,
member 1(PHLDB1) located in chromosome 11 (rs11216831, p= 4.11e-6). The list of lead
SNPs are shown in Table S3.4. rs4722750 (p= 8.51E-6) on chromosome 7 is closed to the
JAZF zinc finger 1 gene (JAZF1) which was previously identified in a GWAS o type 2
diabetes. The gene cytochrome c oxidase subunit IV isoform 1 (COX4I1), close to
rs11648716 (p=7.05e-6) on chromosome 16, was identified as a potential factor in the
development of type 2 diabetes in a quantitative proteomics approach using mice as an
animal model. On chromosome 12, the SNP rs12303914 (p= 6.83e-6) is next to the killer
cell lectin-like receptor subfamily A1 gene (KLRA1), which was identified in a GWAS of end-
stage renal disease (ESRD). The genes cytochrome P450, family 7, subfamily B,
polypeptide 1 (CYP7B1) on chromosome 8 (rs2980003, p= 4.80e-6) and glutamate-cysteine
ligase, modifier subunit (GCLM) on chromosome 1 (rs22744788, p= 1.08e-6) have been
previously related to lipid metabolism.94
2.5.3 Top SNPs associated with glucose response in African-Americans
Sixty-one SNPs in 12 regions were suggested to be associated with change in
plasma glucose after HCTZ treatment in African-Americans (Table 2.5.5). Table 2.5.6
provides details for the lead SNPs within each region. The SNP rs225675, located on
chromosome 6, had the lowest p-value (p= 1.09e-7) for this phenotype. Among the closest
genes to this SNP, the G protein-coupled receptor 126 gene (GPR126) was associated with
BMI in a previous GWAS. Two genes, major facilitator superfamily domain containing 9
(MFSD9) and branched chain amino-acid transaminase 1 (BCAT1), located on chromosome
2 near to rs13402330 (p= 5.58e-6) and chromosome 12 near to rs7965364 (p= 6.00e-6),
respectively, were previously reported in other GWAS of T2D. In the same region on
chromosome 2 near rs13402330 resides SCL9A2, a known sodium/hydrogen exchanger
associated with hypertension. The SNP rs11599315 (p= 5.03e-6) is close to the WD repeat
domain 37 (WDR37), which was reported to be associated with estimated glomerular
filtration rate (eGFR). In another region on chromosome 12, the SNP rs7964748 (p=2.45e-6)
is next to the insulin-like growth factor 1 gene (IGF1) which is associated to fasting insulin
and insulin resistance (HOMA-IR).94
30
2.5.4 Top SNPs associated with triglyceride response in African-Americans
There were 77 SNPs in 27 regions that reached the suggestive p-value threshold for
triglyceride response in African-Americans (Table 2.5.7). Table 2.5.8 shows detailed
information for the lead SNP in each region. On chromosome 1 and close to rs11810574 (p=
3.60e-6) is the gene cholinergic receptor muscarinic 3 (CHRM3), which has been associated
with insulin secretion. The genes ER lipid raft associated 1 (ERLIN1) on chromosome 10
(rs9420790, p= 1.68e-6) and IQ motif containing GTPase activating protein 2 (IQGAP2) on
chromosome 5 (rs2460504, p=4.53e-6) have been previously related to liver function. The
former has been reported to associated with plasma levels of liver enzymes and the latter
with enhanced hepatic insulin sensitivity. Cholesterol levels have been reported to be
associated with Calpain 5 gene (CAPN5) located on chromosome 11 (rs10899383, p=6.27e-
6). Genes that have been related to the metabolic syndrome include angiopoietin-like 6
(ANGPTL6) on chromosome 19 (rs2116940, p=3.39e-6), growth differentiation factor 3
(GDF3) on chromosome 12 (rs12307997, p=6.24e-7) and ubiquitin-like 5102 (UBL5) on
chromosome 19 (rs2116940, p=3.39e-6).94
31
Region Name CHR Allele1 Allele2 Position Freq
Allele1 Direction Β P.value
Region I rs11077614 17 A G 68106224 0.5066 -- -3.249 2.83E-06
Region II
A
rs6870564 5 A G 17056085 0.1295 ++ 3.841 3.57E-06
rs11959796 5 A T 17059405 0.1293 ++ 3.836 3.68E-06
rs11953330 5 T C 17059372 0.8707 ++ 3.836 3.68E-06
B
rs890749 5 T C 121464495 0.8094 -- -3.246 7.93E-06
rs1834915 5 A T 121465418 0.1907 -- -3.245 7.93E-06
rs2560322 5 C G 121467234 0.809 ++ 3.242 7.97E-06
rs890750 5 T G 121463478 0.8101 -- -3.245 8.10E-06
rs970041 5 A C 121467568 0.1921 -- -3.212 8.79E-06
rs1427943 5 A T 121471930 0.1956 -- -3.151 9.94E-06
C
rs6859974 5 T C 180138544 0.1431 ++ 3.674 8.37E-06
rs1021001 5 C G 180136710 0.143 -- -3.676 8.46E-06
rs7702121 5 A C 180131859 0.1424 -- -3.708 8.55E-06
Region III
rs427576 16 A C 72386771 0.5609 -- -2.618 3.88E-06
rs417278 16 T C 72387977 0.5803 ++ 2.607 5.30E-06
rs379401 16 C G 72387865 0.5863 -- -2.596 5.56E-06
Region IV rs1669070 2 T C 231900549 0.403 -- -3.021 4.26E-06
Region V
A
rs1511453 4 A G 23197560 0.0762 ++ 4.948 4.71E-06
rs1397828 4 T G 23205817 0.0717 -- -4.938 4.53E-06
rs13112409 4 T C 23220756 0.9222 ++ 4.814 6.93E-06
rs13121520 4 A G 23231629 0.0723 ++ 4.833 5.78E-06
rs13118539 4 A G 23240961 0.0713 ++ 4.843 6.06E-06
rs306063 4 A G 23258524 0.0709 ++ 4.913 5.11E-06
rs3112978 4 T C 23266700 0.0707 -- -4.943 4.75E-06
rs306054 4 T G 23272551 0.9306 ++ 5.045 3.62E-06
rs306050 4 A C 23278321 0.0704 ++ 4.960 4.47E-06

32
rs306051 4 A G 23282627 0.9296 -- -4.962 4.46E-06
rs1948355 4 A G 23306856 0.9307 -- -5.05 5.07E-06
rs6830932 4 C G 23307048 0.9307 -- -5.051 5.09E-06
B rs1974942 4 A G 129915671 0.1046 -- -5.296 4.09E-06
C rs17644018 4 T C 70966894 0.7003 ++ 2.704 1.00E-05
Region VI
rs10989824 9 T C 103907659 0.0588 -- -5.850 6.82E-06
rs7034610 9 A G 103917056 0.0602 ++ 5.724 6.99E-06
rs10820064 9 A T 103909080 0.0662 ++ 5.632 8.48E-06
rs10989829 9 A C 103909525 0.0663 ++ 5.627 8.51E-06
rs10989833 9 T G 103909860 0.0663 -- -5.619 8.55E-06
rs10989837 9 T C 103910291 0.9336 ++ 5.607 8.65E-06
rs10989791 9 A G 103857420 0.058 ++ 5.696 9.26E-06
rs7020246 9 T G 103852964 0.9419 ++ 5.694 9.38E-06
rs10760837 9 T C 103879660 0.0579 -- -5.735 9.38E-06
rs1449650 9 T G 103883859 0.0578 -- -5.734 9.63E-06
rs10820051 9 T G 103884041 0.9422 ++ 5.734 9.67E-06
Region VII
rs7762018 6 A C 169855169 0.1325 ++ 3.647 7.50E-06
rs6923339 6 A T 169869958 0.1326 ++ 3.642 7.71E-06
rs6941766 6 A G 169873578 0.8673 -- -3.629 8.25E-06
rs6904601 6 T G 169873830 0.8673 ++ 3.629 8.27E-06
rs4716342 6 A G 169879884 0.8673 -- -3.628 8.32E-06
Region VIII rs1551678 10 C G 127819002 0.3706 ++ 2.645 9.30E-06
Table 2.5.1 Top 48 SNPs in 8 different regions associated with glucose response in European Americans94
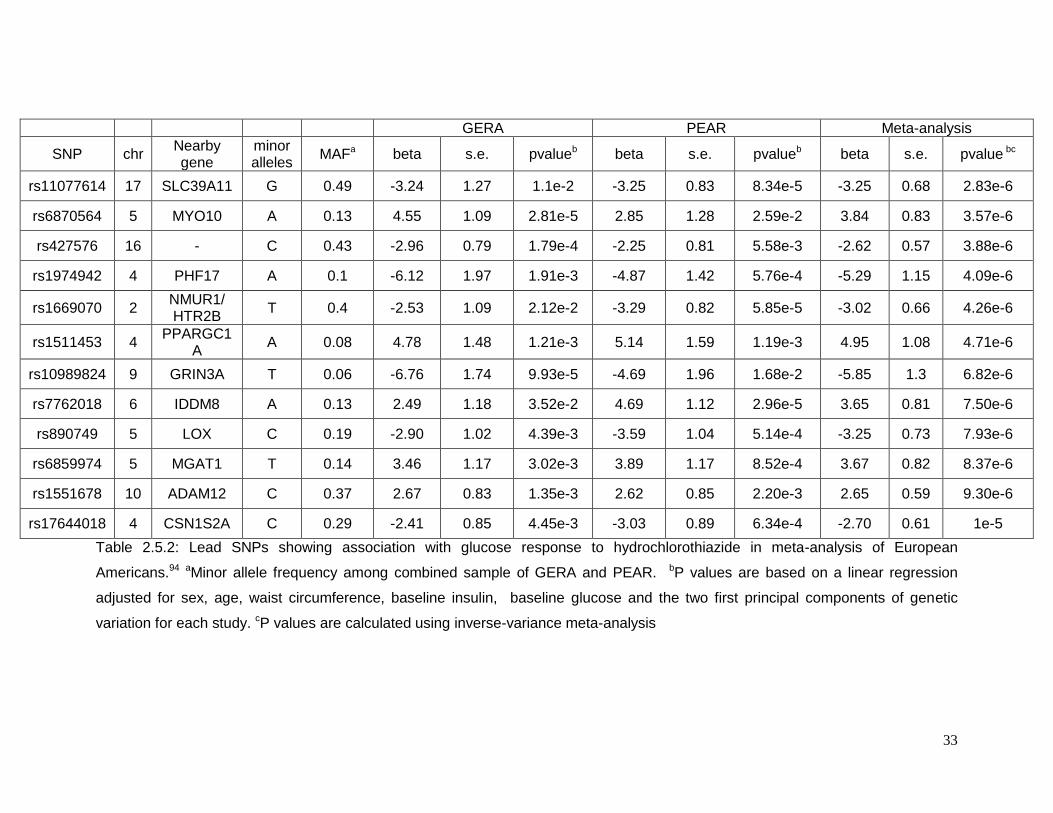
33
GERA PEAR Meta-analysis
SNP chr Nearby gene
minor alleles
MAFa beta s.e. pvalueb beta s.e. pvalueb beta s.e. pvalue bc
rs11077614 17 SLC39A11 G 0.49 -3.24 1.27 1.1e-2 -3.25 0.83 8.34e-5 -3.25 0.68 2.83e-6
rs6870564 5 MYO10 A 0.13 4.55 1.09 2.81e-5 2.85 1.28 2.59e-2 3.84 0.83 3.57e-6
rs427576 16 - C 0.43 -2.96 0.79 1.79e-4 -2.25 0.81 5.58e-3 -2.62 0.57 3.88e-6
rs1974942 4 PHF17 A 0.1 -6.12 1.97 1.91e-3 -4.87 1.42 5.76e-4 -5.29 1.15 4.09e-6
rs1669070 2 NMUR1/ HTR2B
T 0.4 -2.53 1.09 2.12e-2 -3.29 0.82 5.85e-5 -3.02 0.66 4.26e-6
rs1511453 4 PPARGC1
A A 0.08 4.78 1.48 1.21e-3 5.14 1.59 1.19e-3 4.95 1.08 4.71e-6
rs10989824 9 GRIN3A T 0.06 -6.76 1.74 9.93e-5 -4.69 1.96 1.68e-2 -5.85 1.3 6.82e-6
rs7762018 6 IDDM8 A 0.13 2.49 1.18 3.52e-2 4.69 1.12 2.96e-5 3.65 0.81 7.50e-6
rs890749 5 LOX C 0.19 -2.90 1.02 4.39e-3 -3.59 1.04 5.14e-4 -3.25 0.73 7.93e-6
rs6859974 5 MGAT1 T 0.14 3.46 1.17 3.02e-3 3.89 1.17 8.52e-4 3.67 0.82 8.37e-6
rs1551678 10 ADAM12 C 0.37 2.67 0.83 1.35e-3 2.62 0.85 2.20e-3 2.65 0.59 9.30e-6
rs17644018 4 CSN1S2A C 0.29 -2.41 0.85 4.45e-3 -3.03 0.89 6.34e-4 -2.70 0.61 1e-5
Table 2.5.2: Lead SNPs showing association with glucose response to hydrochlorothiazide in meta-analysis of European
Americans.94 aMinor allele frequency among combined sample of GERA and PEAR. bP values are based on a linear regression
adjusted for sex, age, waist circumference, baseline insulin, baseline glucose and the two first principal components of genetic
variation for each study. cP values are calculated using inverse-variance meta-analysis

34
Region Name chr Allele1 Allele2 Position Freq Allele1 Direction β P.value
Region I
rs17560407 5 A G 88219407 0.7389 -- -23.23 5.41E-07
rs17560451 5 T C 88219759 0.7392 ++ 23.17 5.81E-07
rs3850653 5 A G 88222710 0.7332 -- -22.99 8.76E-07
rs244760 5 C G 88146965 0.2657 ++ 23.08 4.34E-06
Region II
rs2274788 1 T C 94447314 0.7493 -- -23.07 1.08E-06
Region III
A rs11216831 11 A G 117622228 0.0675 ++ 42.47 4.11E-06
rs12361791 11 T G 117605386 0.9325 ++ 42.51 4.30E-06
B rs1559759 11 A C 35079627 0.1451 ++ 25.59 8.93E-06
Region IV
rs2980003 8 T C 66162517 0.2656 ++ 22.07 4.80E-06
rs2956307 8 A G 66166394 0.2496 -- -22.17 8.75E-06
Region V
rs12303914 12 A G 10362317 0.3459 ++ 20.39 6.83E-06
Region VI
rs11648716 16 A G 84464117 0.9213 -- -39.68 7.05E-06
rs11861580 16 C G 84456048 0.9255 -- -41.76 7.31E-06
Region VII
rs10943724 6 A C 81359524 0.3051 -- -19.77 7.15E-06
rs10943725 6 A T 81359702 0.6949 ++ 19.77 7.19E-06
rs10943726 6 T G 81360629 0.3051 ++ 19.78 7.20E-06
rs12207977 6 T C 81284893 0.6971 -- -19.53 7.89E-06
rs4706121 6 A C 81302889 0.2947 -- -19.80 9.68E-06
RegionVIII
rs17183114 4 T G 182459721 0.1432 ++ 26.49 7.58E-06
Region IX
rs4722750 7 T C 27970723 0.1 -- -31.88 8.51E-06
rs17156099 7 C G 27972967 0.1001 ++ 31.83 8.64E-06
rs17156100 7 C G 27974909 0.8999 -- -31.78 8.81E-06
rs2057671 7 T C 27965720 0.1003 -- -32.33 8.82E-06
rs17156102 7 C G 27975221 0.8999 -- -31.78 8.82E-06
Region X
rs1724611 15 A G 50647845 0.7341 ++ 30.09 1.05E-05
Table 2.5.3: Top 25 SNPs in 10 different regions associated with triglyceride response in European Americans94
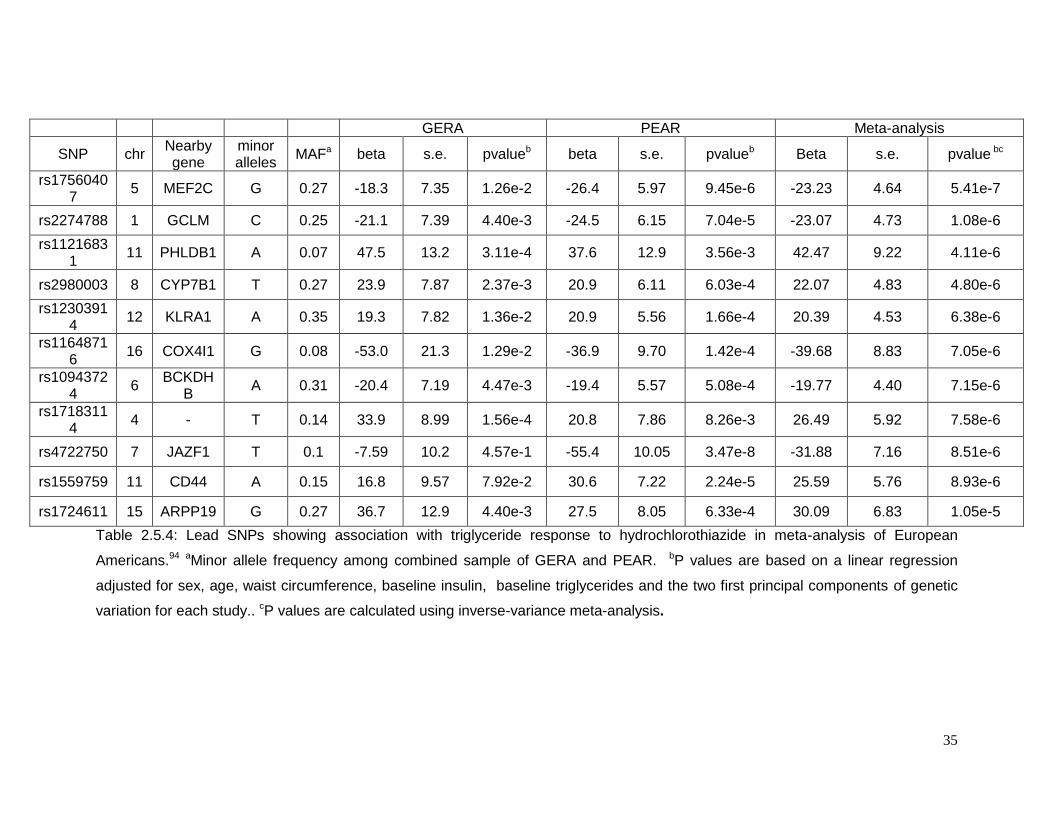
35
GERA PEAR Meta-analysis
SNP chr Nearby gene
minor alleles
MAFa beta s.e. pvalueb beta s.e. pvalueb Beta s.e. pvalue bc
rs17560407
5 MEF2C G 0.27 -18.3 7.35 1.26e-2 -26.4 5.97 9.45e-6 -23.23 4.64 5.41e-7
rs2274788 1 GCLM C 0.25 -21.1 7.39 4.40e-3 -24.5 6.15 7.04e-5 -23.07 4.73 1.08e-6
rs11216831
11 PHLDB1 A 0.07 47.5 13.2 3.11e-4 37.6 12.9 3.56e-3 42.47 9.22 4.11e-6
rs2980003 8 CYP7B1 T 0.27 23.9 7.87 2.37e-3 20.9 6.11 6.03e-4 22.07 4.83 4.80e-6
rs12303914
12 KLRA1 A 0.35 19.3 7.82 1.36e-2 20.9 5.56 1.66e-4 20.39 4.53 6.38e-6
rs11648716
16 COX4I1 G 0.08 -53.0 21.3 1.29e-2 -36.9 9.70 1.42e-4 -39.68 8.83 7.05e-6
rs10943724
6 BCKDH
B A 0.31 -20.4 7.19 4.47e-3 -19.4 5.57 5.08e-4 -19.77 4.40 7.15e-6
rs17183114
4 - T 0.14 33.9 8.99 1.56e-4 20.8 7.86 8.26e-3 26.49 5.92 7.58e-6
rs4722750 7 JAZF1 T 0.1 -7.59 10.2 4.57e-1 -55.4 10.05 3.47e-8 -31.88 7.16 8.51e-6
rs1559759 11 CD44 A 0.15 16.8 9.57 7.92e-2 30.6 7.22 2.24e-5 25.59 5.76 8.93e-6
rs1724611 15 ARPP19 G 0.27 36.7 12.9 4.40e-3 27.5 8.05 6.33e-4 30.09 6.83 1.05e-5
Table 2.5.4: Lead SNPs showing association with triglyceride response to hydrochlorothiazide in meta-analysis of European
Americans.94 aMinor allele frequency among combined sample of GERA and PEAR. bP values are based on a linear regression
adjusted for sex, age, waist circumference, baseline insulin, baseline triglycerides and the two first principal components of genetic
variation for each study.. cP values are calculated using inverse-variance meta-analysis.
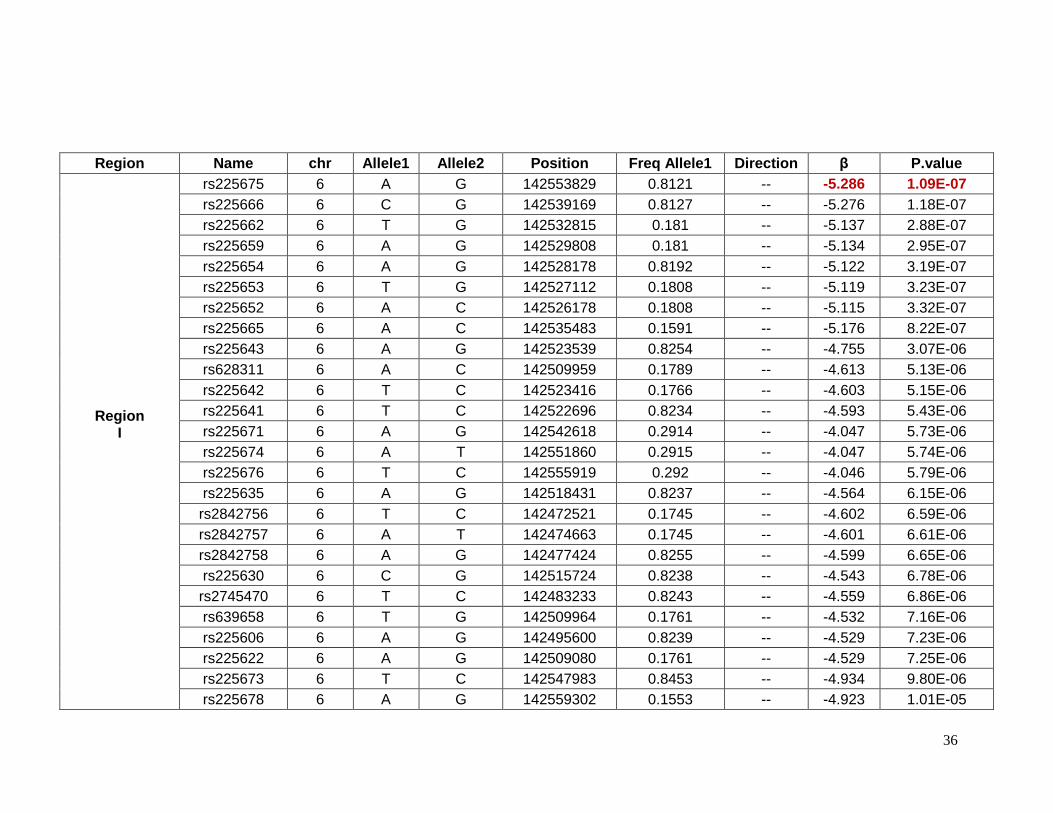
36
Region Name chr Allele1 Allele2 Position Freq Allele1 Direction β P.value
Region I
rs225675 6 A G 142553829 0.8121 -- -5.286 1.09E-07
rs225666 6 C G 142539169 0.8127 -- -5.276 1.18E-07
rs225662 6 T G 142532815 0.181 -- -5.137 2.88E-07
rs225659 6 A G 142529808 0.181 -- -5.134 2.95E-07
rs225654 6 A G 142528178 0.8192 -- -5.122 3.19E-07
rs225653 6 T G 142527112 0.1808 -- -5.119 3.23E-07
rs225652 6 A C 142526178 0.1808 -- -5.115 3.32E-07
rs225665 6 A C 142535483 0.1591 -- -5.176 8.22E-07
rs225643 6 A G 142523539 0.8254 -- -4.755 3.07E-06
rs628311 6 A C 142509959 0.1789 -- -4.613 5.13E-06
rs225642 6 T C 142523416 0.1766 -- -4.603 5.15E-06
rs225641 6 T C 142522696 0.8234 -- -4.593 5.43E-06
rs225671 6 A G 142542618 0.2914 -- -4.047 5.73E-06
rs225674 6 A T 142551860 0.2915 -- -4.047 5.74E-06
rs225676 6 T C 142555919 0.292 -- -4.046 5.79E-06
rs225635 6 A G 142518431 0.8237 -- -4.564 6.15E-06
rs2842756 6 T C 142472521 0.1745 -- -4.602 6.59E-06
rs2842757 6 A T 142474663 0.1745 -- -4.601 6.61E-06
rs2842758 6 A G 142477424 0.8255 -- -4.599 6.65E-06
rs225630 6 C G 142515724 0.8238 -- -4.543 6.78E-06
rs2745470 6 T C 142483233 0.8243 -- -4.559 6.86E-06
rs639658 6 T G 142509964 0.1761 -- -4.532 7.16E-06
rs225606 6 A G 142495600 0.8239 -- -4.529 7.23E-06
rs225622 6 A G 142509080 0.1761 -- -4.529 7.25E-06
rs225673 6 T C 142547983 0.8453 -- -4.934 9.80E-06
rs225678 6 A G 142559302 0.1553 -- -4.923 1.01E-05
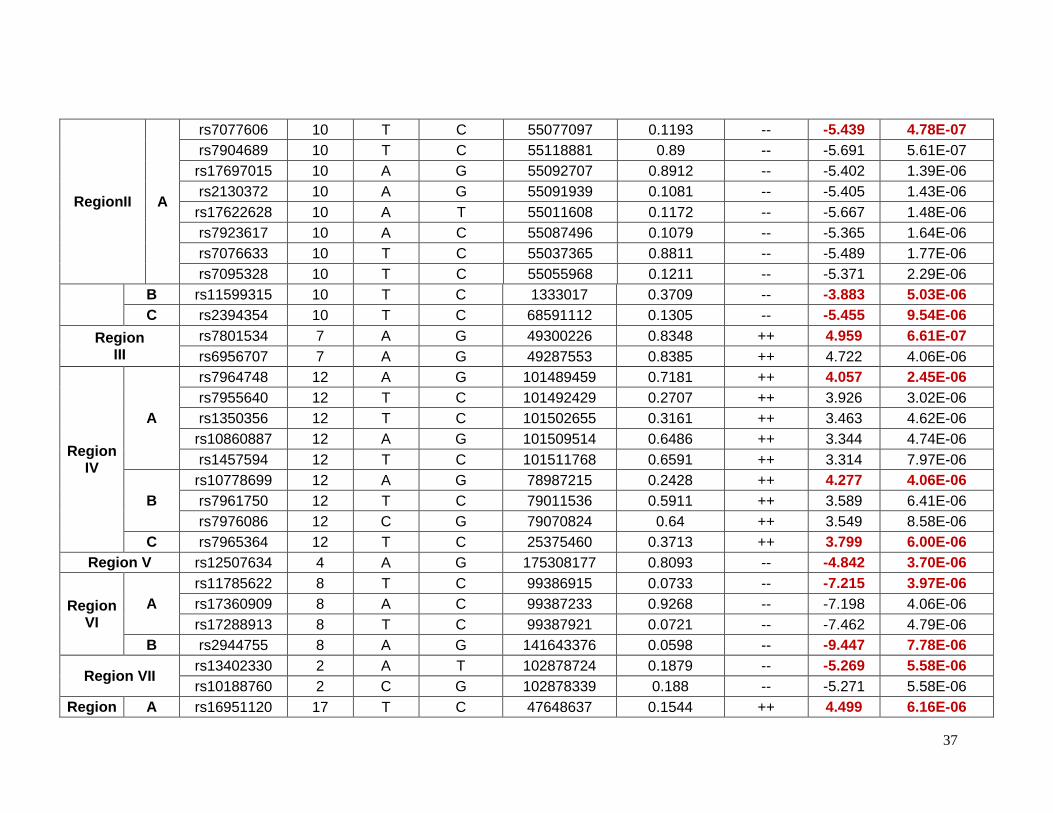
37
RegionII A
rs7077606 10 T C 55077097 0.1193 -- -5.439 4.78E-07
rs7904689 10 T C 55118881 0.89 -- -5.691 5.61E-07
rs17697015 10 A G 55092707 0.8912 -- -5.402 1.39E-06
rs2130372 10 A G 55091939 0.1081 -- -5.405 1.43E-06
rs17622628 10 A T 55011608 0.1172 -- -5.667 1.48E-06
rs7923617 10 A C 55087496 0.1079 -- -5.365 1.64E-06
rs7076633 10 T C 55037365 0.8811 -- -5.489 1.77E-06
rs7095328 10 T C 55055968 0.1211 -- -5.371 2.29E-06
B rs11599315 10 T C 1333017 0.3709 -- -3.883 5.03E-06
C rs2394354 10 T C 68591112 0.1305 -- -5.455 9.54E-06
Region III
rs7801534 7 A G 49300226 0.8348 ++ 4.959 6.61E-07
rs6956707 7 A G 49287553 0.8385 ++ 4.722 4.06E-06
Region IV
A
rs7964748 12 A G 101489459 0.7181 ++ 4.057 2.45E-06
rs7955640 12 T C 101492429 0.2707 ++ 3.926 3.02E-06
rs1350356 12 T C 101502655 0.3161 ++ 3.463 4.62E-06
rs10860887 12 A G 101509514 0.6486 ++ 3.344 4.74E-06
rs1457594 12 T C 101511768 0.6591 ++ 3.314 7.97E-06
B
rs10778699 12 A G 78987215 0.2428 ++ 4.277 4.06E-06
rs7961750 12 T C 79011536 0.5911 ++ 3.589 6.41E-06
rs7976086 12 C G 79070824 0.64 ++ 3.549 8.58E-06
C rs7965364 12 T C 25375460 0.3713 ++ 3.799 6.00E-06
Region V rs12507634 4 A G 175308177 0.8093 -- -4.842 3.70E-06
Region VI
A
rs11785622 8 T C 99386915 0.0733 -- -7.215 3.97E-06
rs17360909 8 A C 99387233 0.9268 -- -7.198 4.06E-06
rs17288913 8 T C 99387921 0.0721 -- -7.462 4.79E-06
B rs2944755 8 A G 141643376 0.0598 -- -9.447 7.78E-06
Region VII rs13402330 2 A T 102878724 0.1879 -- -5.269 5.58E-06
rs10188760 2 C G 102878339 0.188 -- -5.271 5.58E-06
Region A rs16951120 17 T C 47648637 0.1544 ++ 4.499 6.16E-06
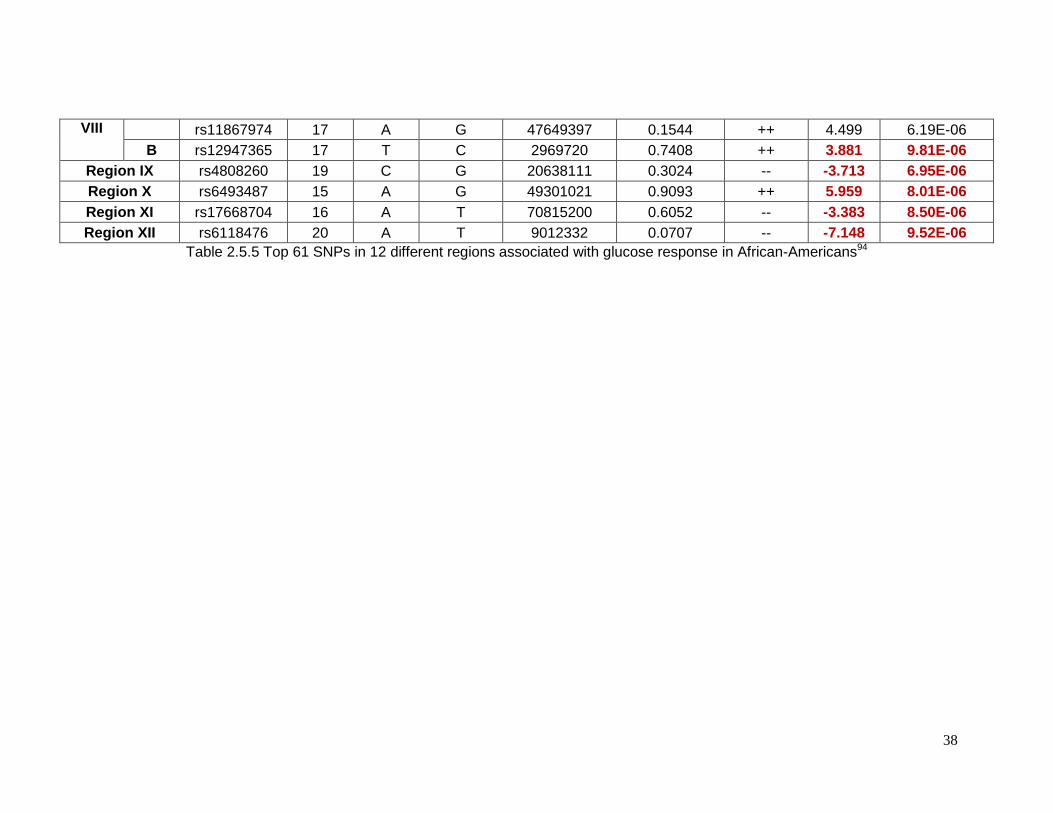
38
VIII rs11867974 17 A G 47649397 0.1544 ++ 4.499 6.19E-06
B rs12947365 17 T C 2969720 0.7408 ++ 3.881 9.81E-06
Region IX rs4808260 19 C G 20638111 0.3024 -- -3.713 6.95E-06
Region X rs6493487 15 A G 49301021 0.9093 ++ 5.959 8.01E-06
Region XI rs17668704 16 A T 70815200 0.6052 -- -3.383 8.50E-06
Region XII rs6118476 20 A T 9012332 0.0707 -- -7.148 9.52E-06
Table 2.5.5 Top 61 SNPs in 12 different regions associated with glucose response in African-Americans94
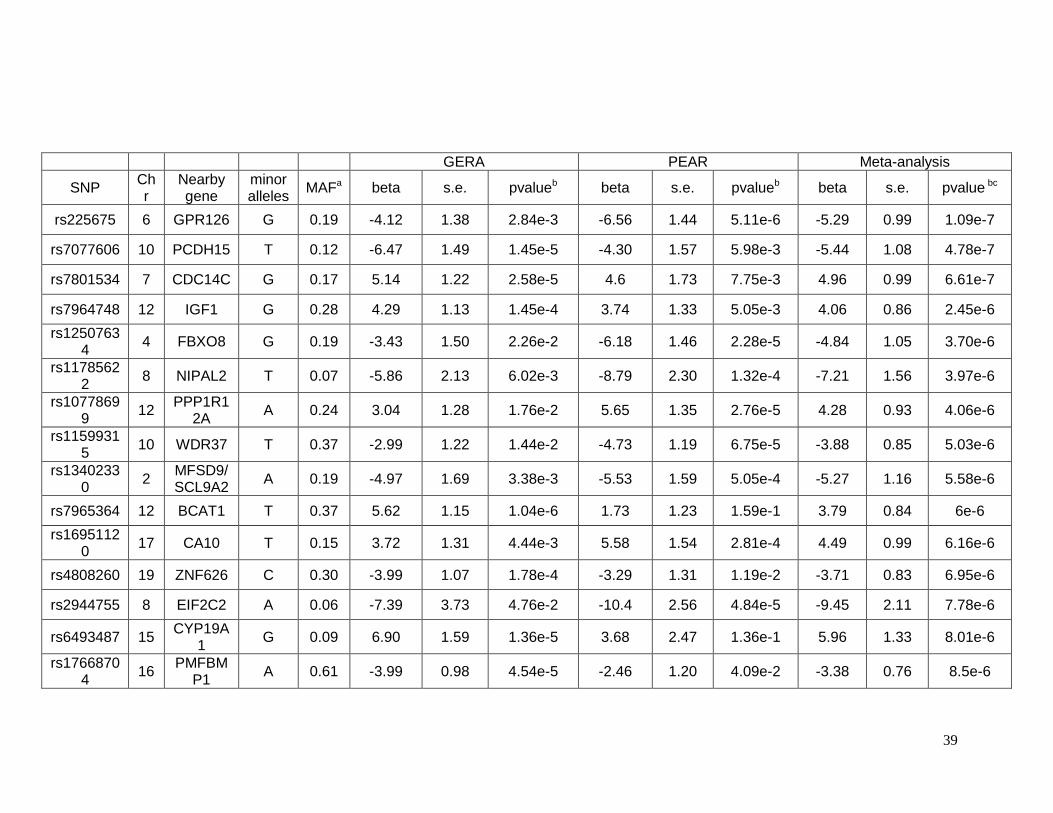
39
GERA PEAR Meta-analysis
SNP Chr
Nearby gene
minor alleles
MAFa beta s.e. pvalueb beta s.e. pvalueb beta s.e. pvalue bc
rs225675 6 GPR126 G 0.19 -4.12 1.38 2.84e-3 -6.56 1.44 5.11e-6 -5.29 0.99 1.09e-7
rs7077606 10 PCDH15 T 0.12 -6.47 1.49 1.45e-5 -4.30 1.57 5.98e-3 -5.44 1.08 4.78e-7
rs7801534 7 CDC14C G 0.17 5.14 1.22 2.58e-5 4.6 1.73 7.75e-3 4.96 0.99 6.61e-7
rs7964748 12 IGF1 G 0.28 4.29 1.13 1.45e-4 3.74 1.33 5.05e-3 4.06 0.86 2.45e-6
rs12507634
4 FBXO8 G 0.19 -3.43 1.50 2.26e-2 -6.18 1.46 2.28e-5 -4.84 1.05 3.70e-6
rs11785622
8 NIPAL2 T 0.07 -5.86 2.13 6.02e-3 -8.79 2.30 1.32e-4 -7.21 1.56 3.97e-6
rs10778699
12 PPP1R1
2A A 0.24 3.04 1.28 1.76e-2 5.65 1.35 2.76e-5 4.28 0.93 4.06e-6
rs11599315
10 WDR37 T 0.37 -2.99 1.22 1.44e-2 -4.73 1.19 6.75e-5 -3.88 0.85 5.03e-6
rs13402330
2 MFSD9/ SCL9A2
A 0.19 -4.97 1.69 3.38e-3 -5.53 1.59 5.05e-4 -5.27 1.16 5.58e-6
rs7965364 12 BCAT1 T 0.37 5.62 1.15 1.04e-6 1.73 1.23 1.59e-1 3.79 0.84 6e-6
rs16951120
17 CA10 T 0.15 3.72 1.31 4.44e-3 5.58 1.54 2.81e-4 4.49 0.99 6.16e-6
rs4808260 19 ZNF626 C 0.30 -3.99 1.07 1.78e-4 -3.29 1.31 1.19e-2 -3.71 0.83 6.95e-6
rs2944755 8 EIF2C2 A 0.06 -7.39 3.73 4.76e-2 -10.4 2.56 4.84e-5 -9.45 2.11 7.78e-6
rs6493487 15 CYP19A
1 G 0.09 6.90 1.59 1.36e-5 3.68 2.47 1.36e-1 5.96 1.33 8.01e-6
rs17668704
16 PMFBM
P1 A 0.61 -3.99 0.98 4.54e-5 -2.46 1.20 4.09e-2 -3.38 0.76 8.5e-6
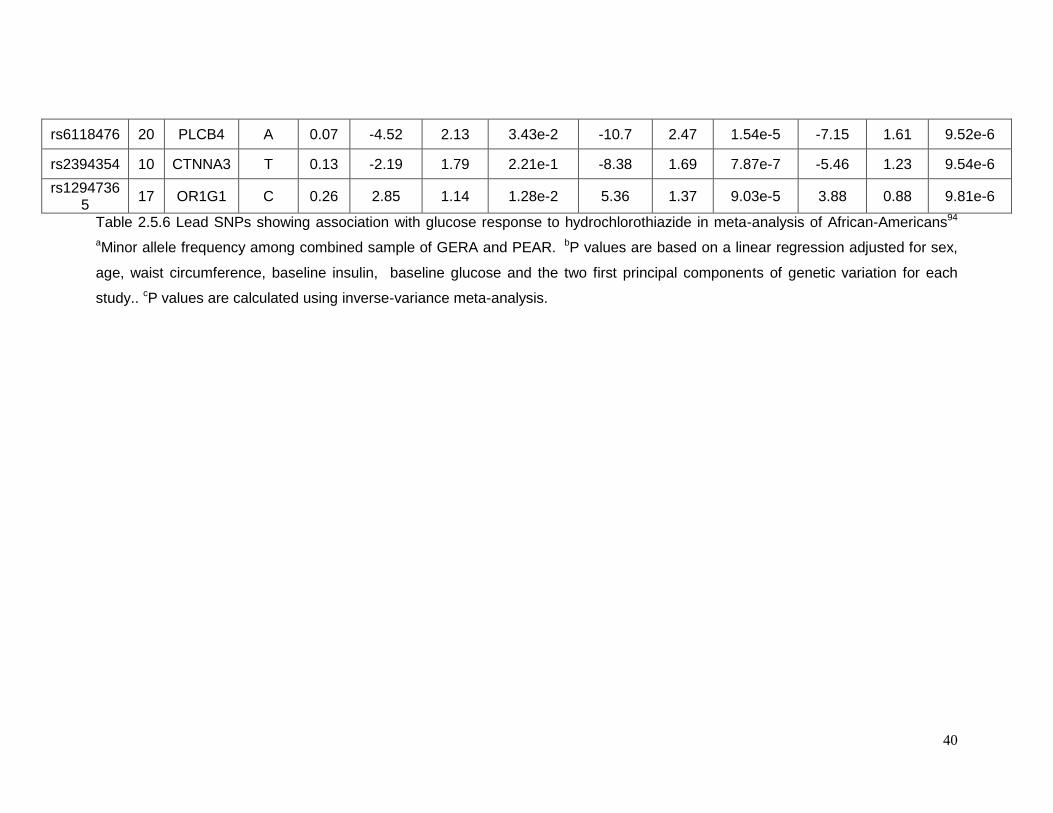
40
rs6118476 20 PLCB4 A 0.07 -4.52 2.13 3.43e-2 -10.7 2.47 1.54e-5 -7.15 1.61 9.52e-6
rs2394354 10 CTNNA3 T 0.13 -2.19 1.79 2.21e-1 -8.38 1.69 7.87e-7 -5.46 1.23 9.54e-6
rs12947365
17 OR1G1 C 0.26 2.85 1.14 1.28e-2 5.36 1.37 9.03e-5 3.88 0.88 9.81e-6
Table 2.5.6 Lead SNPs showing association with glucose response to hydrochlorothiazide in meta-analysis of African-Americans94
aMinor allele frequency among combined sample of GERA and PEAR. bP values are based on a linear regression adjusted for sex,
age, waist circumference, baseline insulin, baseline glucose and the two first principal components of genetic variation for each
study.. cP values are calculated using inverse-variance meta-analysis.
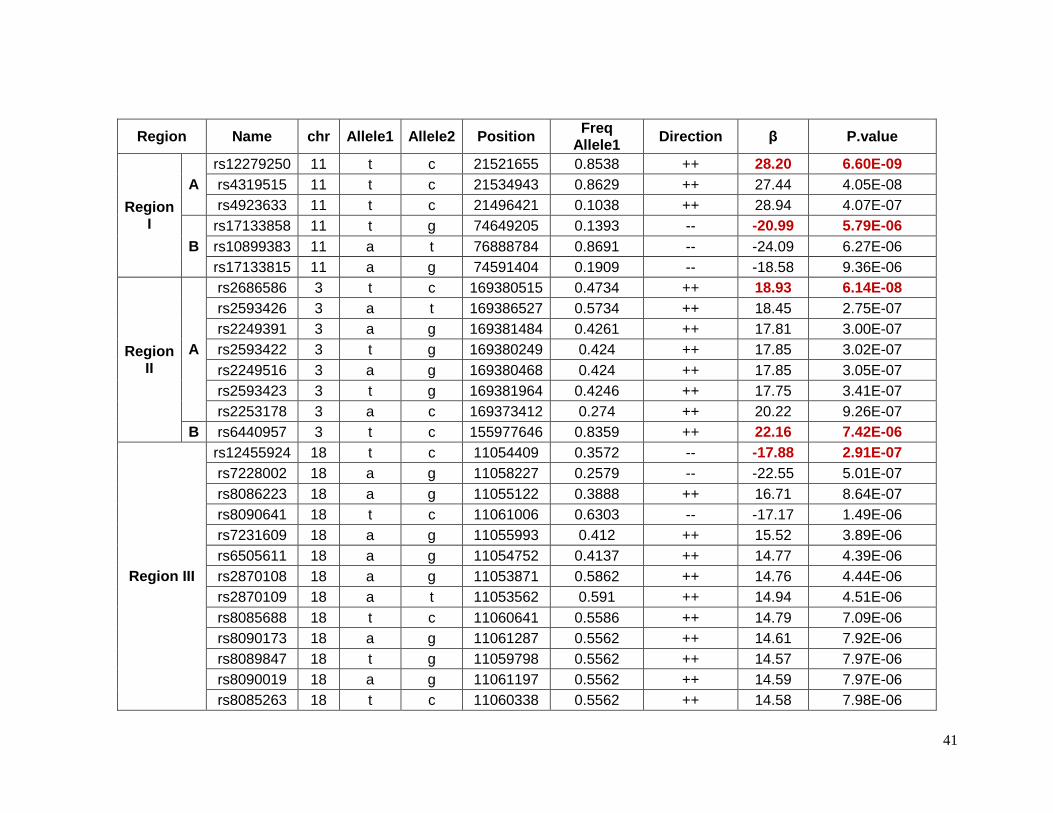
41
Region Name chr Allele1 Allele2 Position Freq
Allele1 Direction β P.value
Region I
A
rs12279250 11 t c 21521655 0.8538 ++ 28.20 6.60E-09
rs4319515 11 t c 21534943 0.8629 ++ 27.44 4.05E-08
rs4923633 11 t c 21496421 0.1038 ++ 28.94 4.07E-07
B
rs17133858 11 t g 74649205 0.1393 -- -20.99 5.79E-06
rs10899383 11 a t 76888784 0.8691 -- -24.09 6.27E-06
rs17133815 11 a g 74591404 0.1909 -- -18.58 9.36E-06
Region II
A
rs2686586 3 t c 169380515 0.4734 ++ 18.93 6.14E-08
rs2593426 3 a t 169386527 0.5734 ++ 18.45 2.75E-07
rs2249391 3 a g 169381484 0.4261 ++ 17.81 3.00E-07
rs2593422 3 t g 169380249 0.424 ++ 17.85 3.02E-07
rs2249516 3 a g 169380468 0.424 ++ 17.85 3.05E-07
rs2593423 3 t g 169381964 0.4246 ++ 17.75 3.41E-07
rs2253178 3 a c 169373412 0.274 ++ 20.22 9.26E-07
B rs6440957 3 t c 155977646 0.8359 ++ 22.16 7.42E-06
Region III
rs12455924 18 t c 11054409 0.3572 -- -17.88 2.91E-07
rs7228002 18 a g 11058227 0.2579 -- -22.55 5.01E-07
rs8086223 18 a g 11055122 0.3888 ++ 16.71 8.64E-07
rs8090641 18 t c 11061006 0.6303 -- -17.17 1.49E-06
rs7231609 18 a g 11055993 0.412 ++ 15.52 3.89E-06
rs6505611 18 a g 11054752 0.4137 ++ 14.77 4.39E-06
rs2870108 18 a g 11053871 0.5862 ++ 14.76 4.44E-06
rs2870109 18 a t 11053562 0.591 ++ 14.94 4.51E-06
rs8085688 18 t c 11060641 0.5586 ++ 14.79 7.09E-06
rs8090173 18 a g 11061287 0.5562 ++ 14.61 7.92E-06
rs8089847 18 t g 11059798 0.5562 ++ 14.57 7.97E-06
rs8090019 18 a g 11061197 0.5562 ++ 14.59 7.97E-06
rs8085263 18 t c 11060338 0.5562 ++ 14.58 7.98E-06
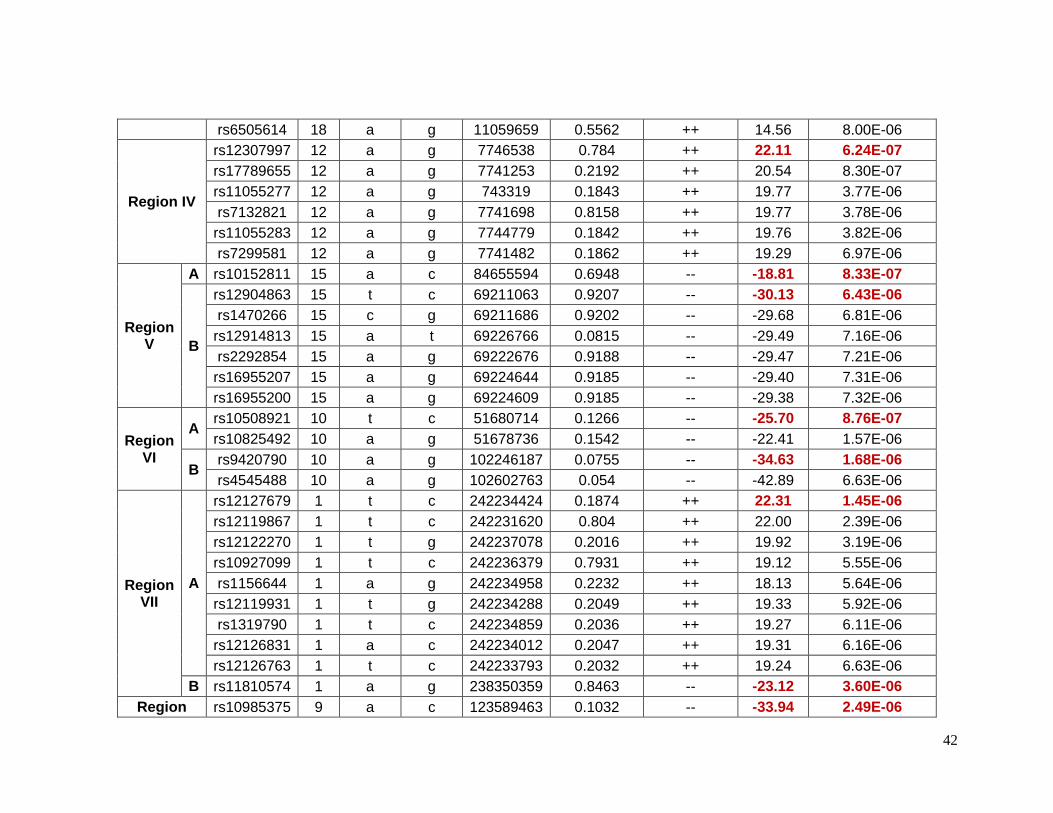
42
rs6505614 18 a g 11059659 0.5562 ++ 14.56 8.00E-06
Region IV
rs12307997 12 a g 7746538 0.784 ++ 22.11 6.24E-07
rs17789655 12 a g 7741253 0.2192 ++ 20.54 8.30E-07
rs11055277 12 a g 743319 0.1843 ++ 19.77 3.77E-06
rs7132821 12 a g 7741698 0.8158 ++ 19.77 3.78E-06
rs11055283 12 a g 7744779 0.1842 ++ 19.76 3.82E-06
rs7299581 12 a g 7741482 0.1862 ++ 19.29 6.97E-06
Region V
A rs10152811 15 a c 84655594 0.6948 -- -18.81 8.33E-07
B
rs12904863 15 t c 69211063 0.9207 -- -30.13 6.43E-06
rs1470266 15 c g 69211686 0.9202 -- -29.68 6.81E-06
rs12914813 15 a t 69226766 0.0815 -- -29.49 7.16E-06
rs2292854 15 a g 69222676 0.9188 -- -29.47 7.21E-06
rs16955207 15 a g 69224644 0.9185 -- -29.40 7.31E-06
rs16955200 15 a g 69224609 0.9185 -- -29.38 7.32E-06
Region VI
A rs10508921 10 t c 51680714 0.1266 -- -25.70 8.76E-07
rs10825492 10 a g 51678736 0.1542 -- -22.41 1.57E-06
B rs9420790 10 a g 102246187 0.0755 -- -34.63 1.68E-06
rs4545488 10 a g 102602763 0.054 -- -42.89 6.63E-06
Region VII
A
rs12127679 1 t c 242234424 0.1874 ++ 22.31 1.45E-06
rs12119867 1 t c 242231620 0.804 ++ 22.00 2.39E-06
rs12122270 1 t g 242237078 0.2016 ++ 19.92 3.19E-06
rs10927099 1 t c 242236379 0.7931 ++ 19.12 5.55E-06
rs1156644 1 a g 242234958 0.2232 ++ 18.13 5.64E-06
rs12119931 1 t g 242234288 0.2049 ++ 19.33 5.92E-06
rs1319790 1 t c 242234859 0.2036 ++ 19.27 6.11E-06
rs12126831 1 a c 242234012 0.2047 ++ 19.31 6.16E-06
rs12126763 1 t c 242233793 0.2032 ++ 19.24 6.63E-06
B rs11810574 1 a g 238350359 0.8463 -- -23.12 3.60E-06
Region rs10985375 9 a c 123589463 0.1032 -- -33.94 2.49E-06
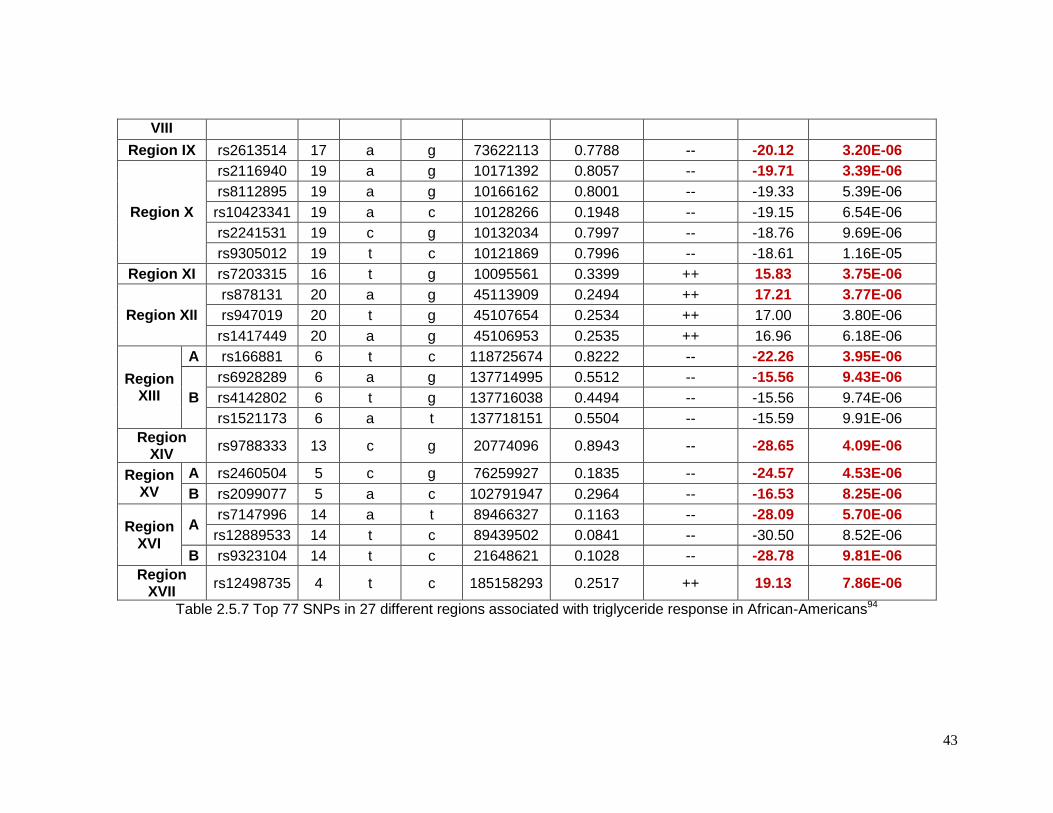
43
VIII
Region IX rs2613514 17 a g 73622113 0.7788 -- -20.12 3.20E-06
Region X
rs2116940 19 a g 10171392 0.8057 -- -19.71 3.39E-06
rs8112895 19 a g 10166162 0.8001 -- -19.33 5.39E-06
rs10423341 19 a c 10128266 0.1948 -- -19.15 6.54E-06
rs2241531 19 c g 10132034 0.7997 -- -18.76 9.69E-06
rs9305012 19 t c 10121869 0.7996 -- -18.61 1.16E-05
Region XI rs7203315 16 t g 10095561 0.3399 ++ 15.83 3.75E-06
Region XII
rs878131 20 a g 45113909 0.2494 ++ 17.21 3.77E-06
rs947019 20 t g 45107654 0.2534 ++ 17.00 3.80E-06
rs1417449 20 a g 45106953 0.2535 ++ 16.96 6.18E-06
Region XIII
A rs166881 6 t c 118725674 0.8222 -- -22.26 3.95E-06
B
rs6928289 6 a g 137714995 0.5512 -- -15.56 9.43E-06
rs4142802 6 t g 137716038 0.4494 -- -15.56 9.74E-06
rs1521173 6 a t 137718151 0.5504 -- -15.59 9.91E-06
Region XIV
rs9788333 13 c g 20774096 0.8943 -- -28.65 4.09E-06
Region XV
A rs2460504 5 c g 76259927 0.1835 -- -24.57 4.53E-06
B rs2099077 5 a c 102791947 0.2964 -- -16.53 8.25E-06
Region XVI
A rs7147996 14 a t 89466327 0.1163 -- -28.09 5.70E-06
rs12889533 14 t c 89439502 0.0841 -- -30.50 8.52E-06
B rs9323104 14 t c 21648621 0.1028 -- -28.78 9.81E-06
Region XVII
rs12498735 4 t c 185158293 0.2517 ++ 19.13 7.86E-06
Table 2.5.7 Top 77 SNPs in 27 different regions associated with triglyceride response in African-Americans94
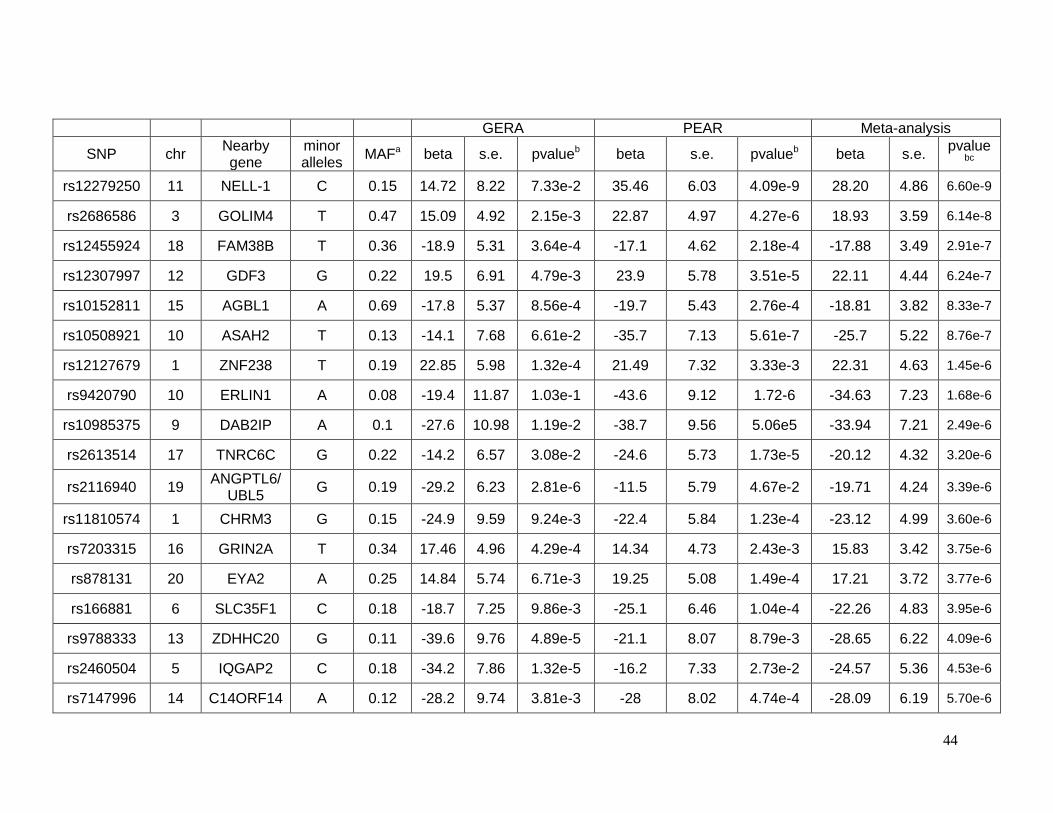
44
GERA PEAR Meta-analysis
SNP chr Nearby gene
minor alleles
MAFa beta s.e. pvalueb beta s.e. pvalueb beta s.e. pvalue
bc
rs12279250 11 NELL-1 C 0.15 14.72 8.22 7.33e-2 35.46 6.03 4.09e-9 28.20 4.86 6.60e-9
rs2686586 3 GOLIM4 T 0.47 15.09 4.92 2.15e-3 22.87 4.97 4.27e-6 18.93 3.59 6.14e-8
rs12455924 18 FAM38B T 0.36 -18.9 5.31 3.64e-4 -17.1 4.62 2.18e-4 -17.88 3.49 2.91e-7
rs12307997 12 GDF3 G 0.22 19.5 6.91 4.79e-3 23.9 5.78 3.51e-5 22.11 4.44 6.24e-7
rs10152811 15 AGBL1 A 0.69 -17.8 5.37 8.56e-4 -19.7 5.43 2.76e-4 -18.81 3.82 8.33e-7
rs10508921 10 ASAH2 T 0.13 -14.1 7.68 6.61e-2 -35.7 7.13 5.61e-7 -25.7 5.22 8.76e-7
rs12127679 1 ZNF238 T 0.19 22.85 5.98 1.32e-4 21.49 7.32 3.33e-3 22.31 4.63 1.45e-6
rs9420790 10 ERLIN1 A 0.08 -19.4 11.87 1.03e-1 -43.6 9.12 1.72-6 -34.63 7.23 1.68e-6
rs10985375 9 DAB2IP A 0.1 -27.6 10.98 1.19e-2 -38.7 9.56 5.06e5 -33.94 7.21 2.49e-6
rs2613514 17 TNRC6C G 0.22 -14.2 6.57 3.08e-2 -24.6 5.73 1.73e-5 -20.12 4.32 3.20e-6
rs2116940 19 ANGPTL6/
UBL5 G 0.19 -29.2 6.23 2.81e-6 -11.5 5.79 4.67e-2 -19.71 4.24 3.39e-6
rs11810574 1 CHRM3 G 0.15 -24.9 9.59 9.24e-3 -22.4 5.84 1.23e-4 -23.12 4.99 3.60e-6
rs7203315 16 GRIN2A T 0.34 17.46 4.96 4.29e-4 14.34 4.73 2.43e-3 15.83 3.42 3.75e-6
rs878131 20 EYA2 A 0.25 14.84 5.74 6.71e-3 19.25 5.08 1.49e-4 17.21 3.72 3.77e-6
rs166881 6 SLC35F1 C 0.18 -18.7 7.25 9.86e-3 -25.1 6.46 1.04e-4 -22.26 4.83 3.95e-6
rs9788333 13 ZDHHC20 G 0.11 -39.6 9.76 4.89e-5 -21.1 8.07 8.79e-3 -28.65 6.22 4.09e-6
rs2460504 5 IQGAP2 C 0.18 -34.2 7.86 1.32e-5 -16.2 7.33 2.73e-2 -24.57 5.36 4.53e-6
rs7147996 14 C14ORF14 A 0.12 -28.2 9.74 3.81e-3 -28 8.02 4.74e-4 -28.09 6.19 5.70e-6
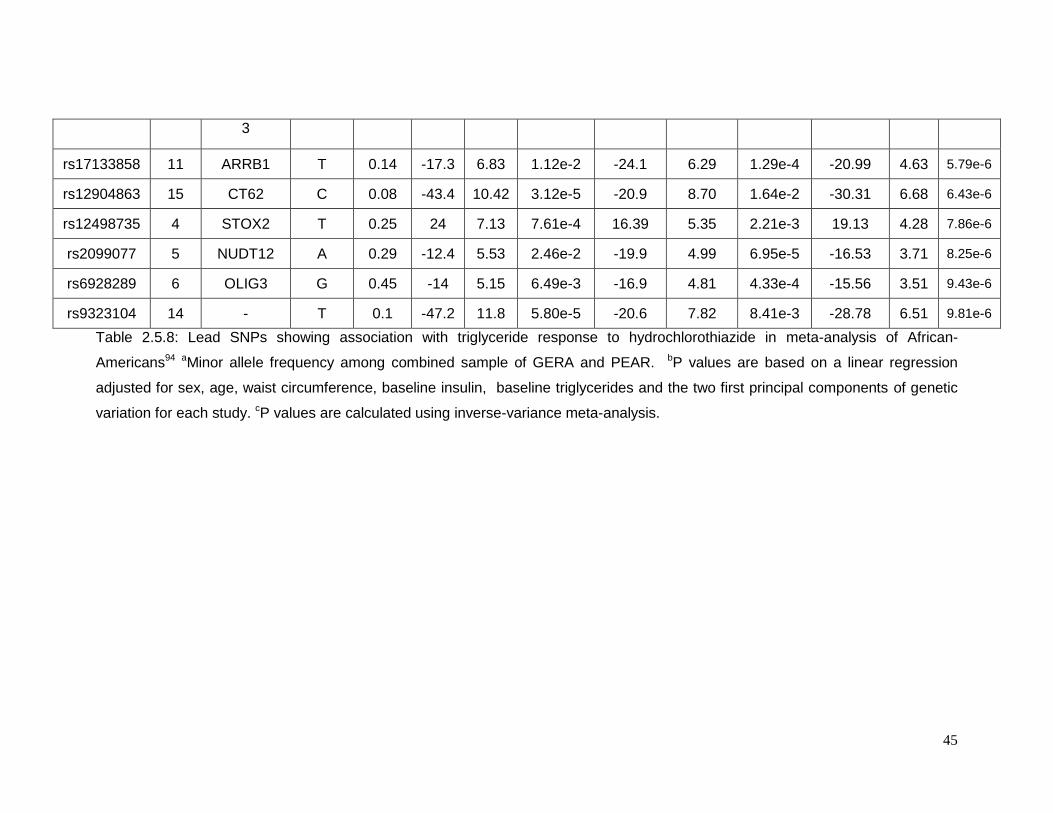
45
3
rs17133858 11 ARRB1 T 0.14 -17.3 6.83 1.12e-2 -24.1 6.29 1.29e-4 -20.99 4.63 5.79e-6
rs12904863 15 CT62 C 0.08 -43.4 10.42 3.12e-5 -20.9 8.70 1.64e-2 -30.31 6.68 6.43e-6
rs12498735 4 STOX2 T 0.25 24 7.13 7.61e-4 16.39 5.35 2.21e-3 19.13 4.28 7.86e-6
rs2099077 5 NUDT12 A 0.29 -12.4 5.53 2.46e-2 -19.9 4.99 6.95e-5 -16.53 3.71 8.25e-6
rs6928289 6 OLIG3 G 0.45 -14 5.15 6.49e-3 -16.9 4.81 4.33e-4 -15.56 3.51 9.43e-6
rs9323104 14 - T 0.1 -47.2 11.8 5.80e-5 -20.6 7.82 8.41e-3 -28.78 6.51 9.81e-6
Table 2.5.8: Lead SNPs showing association with triglyceride response to hydrochlorothiazide in meta-analysis of African-
Americans94 aMinor allele frequency among combined sample of GERA and PEAR. bP values are based on a linear regression
adjusted for sex, age, waist circumference, baseline insulin, baseline triglycerides and the two first principal components of genetic
variation for each study. cP values are calculated using inverse-variance meta-analysis.
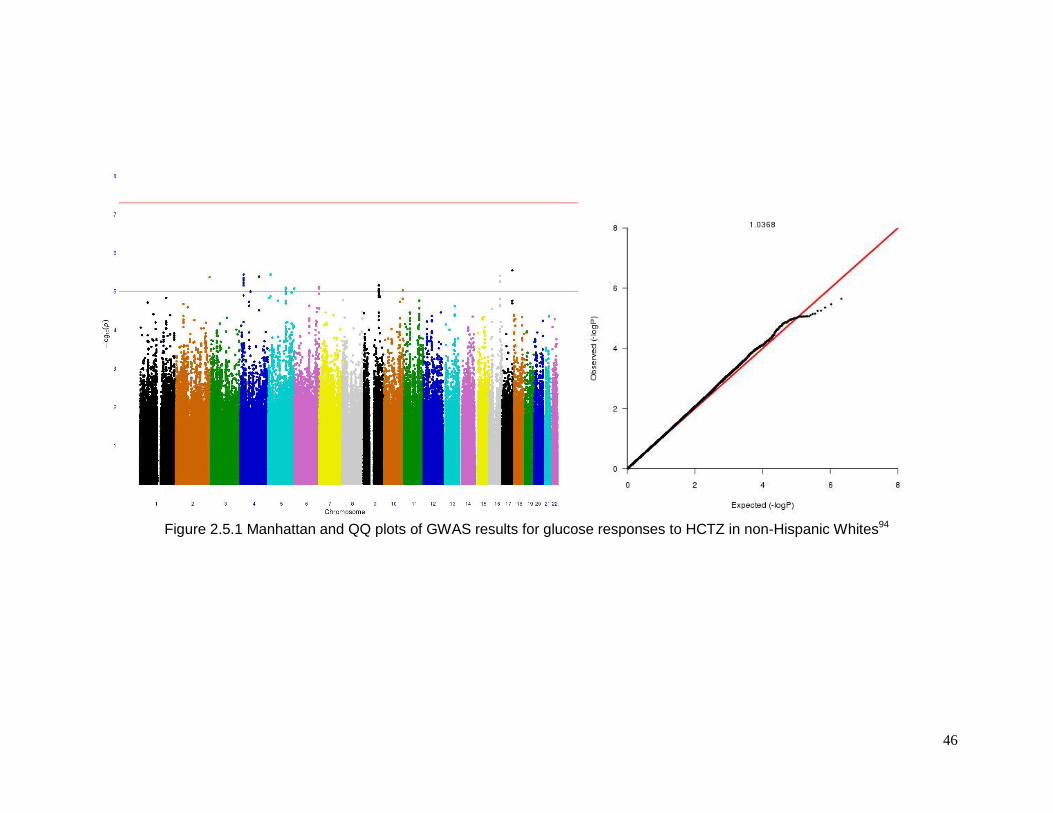
46
Figure 2.5.1 Manhattan and QQ plots of GWAS results for glucose responses to HCTZ in non-Hispanic Whites94
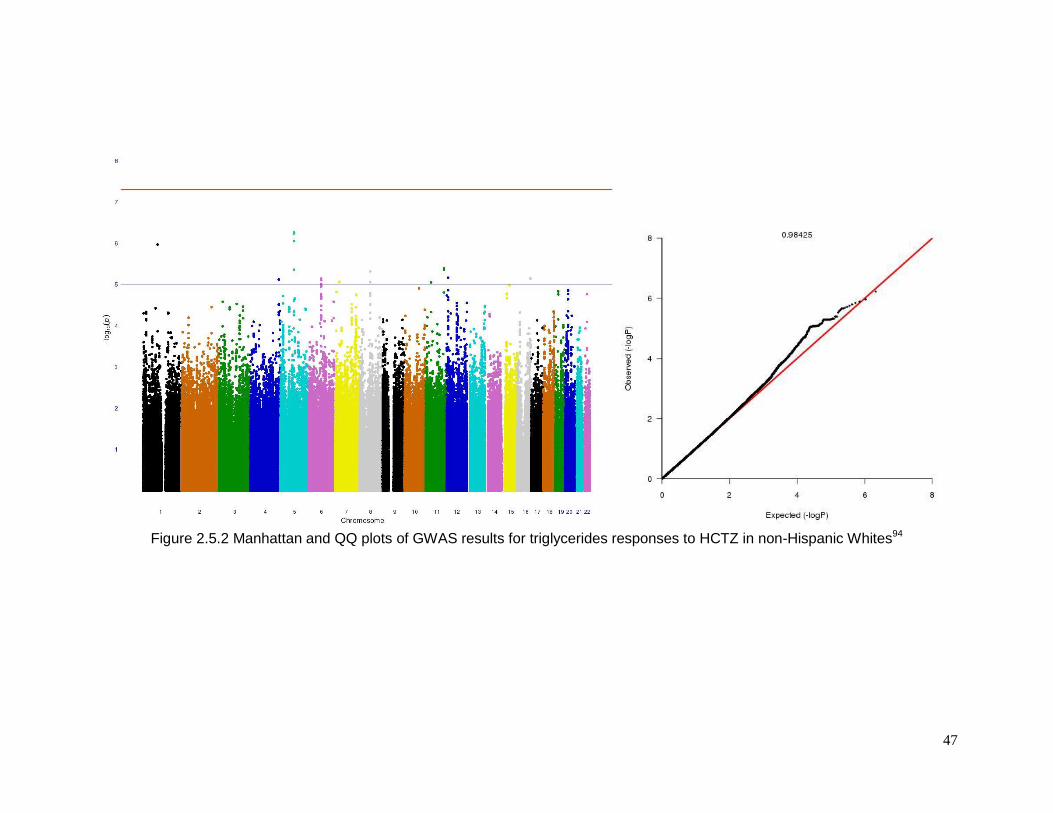
47
Figure 2.5.2 Manhattan and QQ plots of GWAS results for triglycerides responses to HCTZ in non-Hispanic Whites94
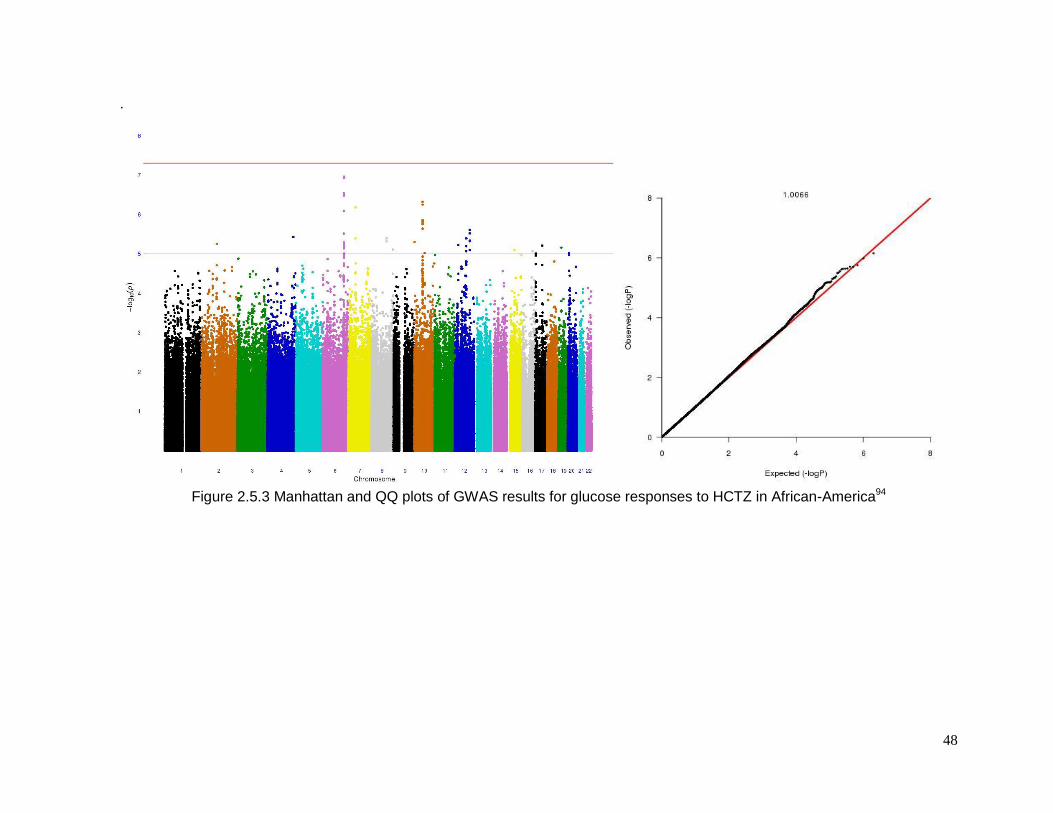
48
.
Figure 2.5.3 Manhattan and QQ plots of GWAS results for glucose responses to HCTZ in African-America94

49
CHAPTER 3: LONGITUDINAL GENOME-WIDE ASSOCIATION FOR INTERACTION OF
SNPS WITH THIAZIDE DIURETIC USE ON FASTING GLUCOSE AND INSULIN
LEVELS IN EUROPEAN AMERICANS IN THE CHARGE CONSORTIUM

50
3.1 INTRODUCTION
Diuretics are the most common prescribed antihypertensive drug in the USA89.
Thiazide diuretics are the first line drug treatment for patients with essential hypertension2
and 47.5 million filled prescriptions of this drug were dispensed in 200899. Although the
effectiveness and low cost of this drug are well known, so are its adverse metabolic effects.
Pharmacogenomics studies (PGXs) of thiazide diuretics seek to identify genetic variants that
may cause these adverse metabolic effects. Most PGXs are based on clinical trials or
intervention studies in which the drug is taken, the response for each individual is assessed,
and differences in response among genotypes are tested. Because of their intensity, these
intervention studies often suffer from small sample size and low statistical power. However,
it is possible to do PGX in an observational setting where the patterns of drug use and
phenotypes levels are measured longitudinally. I used a genome-wide association approach
with longitudinal data on fasting glucose and fasting insulin levels and diuretic use to identify
genomic regions influencing adverse metabolic effect. These genome wide association
studies were carried out in more than 40,000 individuals from the CHARGE consortium’s
population-based studies.
3.2 MATERIALS AND METHODS
3.2.1 Study populations
All participants were European American descendants that were enrolled in fourteen
population based cohorts [the Atherosclerosis Risk in Communities (ARIC) study 103, the
Age-Gene-Environment Susceptibility—Reykjavik Study(AGES)104, Cardiovascular Health
Study(CHS)105, The Heart and Vascular Health Study(HVH)106, Framingham Heart
Study(FHS)107, Multi-Ethnic Study of Atherosclerosis(MESA)108, Rotterdam Study 1(RS1)109-
112, Rotterdam Study 2(RS2)109-112, Prospective Study of Pravastatin in the Elderly at Risk /
Pharmacogenomic study of Statins in the Elderly at risk for cardiovascular
disease(PROSPER/PHASE)113, the Health, Aging, and Body Composition Study(Health
ABC)114, Hypertension Genetic Epidemiology Network(HyperGEN)115, Women’s Health
Initiative (WHI)116, and Coronary Artery Risk Development in Young Adults (CARDIA)
study117]. The analysis plan described in the statistical methods section was run for each
cohort. Later on, the findings within each cohort were combined by meta-analysis.
51
Participants from each cohort provided written informed consent, and each study was
approved by local ethics committees.
3.2.2 Study design exclusion and inclusion criteria
Participants with diabetes at baseline were excluded. The definition of diabetes was
self-reported history, physician-reported diagnosis of diabetes, fasting glucose levels of
more than 126mg/dL, non-fasting glucose more than 200mg/dL or use of anti-diabetic
medications. We also excluded all participants treated with only loop diuretics, due to their
different mechanism of action in the nephron, and all participants who did not give consent
for use of their DNA. Participants missing both fasting glucose and fasting insulin or missing
information on fasting state were excluded.
3.2.3 Definition of drug exposure
Drug exposure was assessed via the method of medication inventory in eleven
cohorts and by pharmacy information in the other two (RS1 and RS2). We classified a
participant as exposed to or users of the drug if he or she uses a thiazide or thiazide-like
diuretic, at each visit, in a single or combination preparation with or without concomitant use
of a loop diuretic, potassium-sparing diuretic, or potassium supplement.
3.2.4 Measurement of glucose and insulin
Fasting glucose (mmol/L) and fasting insulin (mmol/L) were quantified in each cohort
by using similar procedures as described previously118, 119. Fasting insulin was natural log-
transformed for analysis
3.2.5 Genotype arrays and imputation
Each cohort performed their own genome-wide SNP genotyping using different chip
arrays from either Illumina (San Diego, CA, USA) or Affymetrix (Santa Clara, CA, USA).
Common quality control steps were followed in all cohorts. SNP with minor allele frequency
≤1%, call rates <95% Hardy-Weinberg equilibrium p-values <10-5 and individuals with more
than 10% missing genotypes were excluded. To increase the coverage and facilitate
interrogation of each SNP among the cohorts, the genotypes were imputed with
52
approximately 2.5 million HapMap SNPs using the Phase II release 22 build 36 and the
HapMap CEU reference. Quality control for the imputed results was done using standard
procedures (RSQ_HAT <0.3 and MAF ≤ 0.05) but different algorithms were used among
cohorts to perform the imputation (Table 3.2.1), such as Bayesian Imputation-Based
Association Mapping120, Markov chain based haplotyper121 or BEAGLE122. All studies
inferred unobserved genotypes in a probabilistic manner.
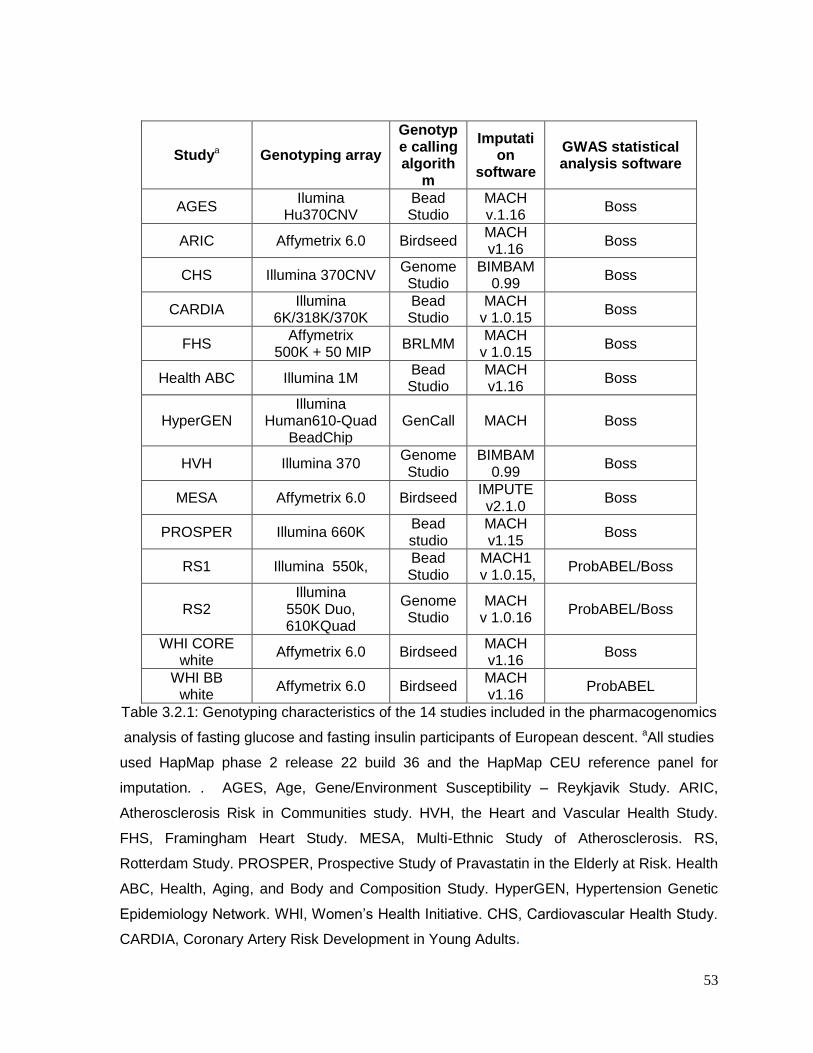
53
Studya Genotyping array
Genotype calling algorith
m
Imputation
software
GWAS statistical analysis software
AGES Ilumina
Hu370CNV Bead Studio
MACH v.1.16
Boss
ARIC Affymetrix 6.0 Birdseed MACH v1.16
Boss
CHS Illumina 370CNV Genome Studio
BIMBAM 0.99
Boss
CARDIA Illumina
6K/318K/370K Bead Studio
MACH v 1.0.15
Boss
FHS Affymetrix
500K + 50 MIP BRLMM
MACH v 1.0.15
Boss
Health ABC Illumina 1M Bead Studio
MACH v1.16
Boss
HyperGEN Illumina
Human610-Quad BeadChip
GenCall MACH Boss
HVH Illumina 370 Genome Studio
BIMBAM 0.99
Boss
MESA Affymetrix 6.0 Birdseed IMPUTE v2.1.0
Boss
PROSPER Illumina 660K Bead studio
MACH v1.15
Boss
RS1 Illumina 550k, Bead Studio
MACH1 v 1.0.15,
ProbABEL/Boss
RS2 Illumina
550K Duo, 610KQuad
Genome Studio
MACH v 1.0.16
ProbABEL/Boss
WHI CORE white
Affymetrix 6.0 Birdseed MACH v1.16
Boss
WHI BB white
Affymetrix 6.0 Birdseed MACH v1.16
ProbABEL
Table 3.2.1: Genotyping characteristics of the 14 studies included in the pharmacogenomics
analysis of fasting glucose and fasting insulin participants of European descent. aAll studies
used HapMap phase 2 release 22 build 36 and the HapMap CEU reference panel for
imputation. . AGES, Age, Gene/Environment Susceptibility – Reykjavik Study. ARIC,
Atherosclerosis Risk in Communities study. HVH, the Heart and Vascular Health Study.
FHS, Framingham Heart Study. MESA, Multi-Ethnic Study of Atherosclerosis. RS,
Rotterdam Study. PROSPER, Prospective Study of Pravastatin in the Elderly at Risk. Health
ABC, Health, Aging, and Body and Composition Study. HyperGEN, Hypertension Genetic
Epidemiology Network. WHI, Women’s Health Initiative. CHS, Cardiovascular Health Study.
CARDIA, Coronary Artery Risk Development in Young Adults.
54
3.2.6 Statistical analysis
Within each cohort and when the data were available, we performed either a
longitudinal analysis or a cross-sectional analysis. We used the overall population design
that includes drug users and non-users, to allow the separation of the SNP main effect and
interaction effect estimates. Each drug-genotype interaction was estimated under additive
genetic model, using the robust variance estimator and an independence working
correlation (for longitudinal analysis). In the case of cohorts studies, the analysis was carried
out using ProbABEL123 and “Boss” for longitudinal analysis 124. We used as covariates age,
sex, study site, body mass index, and ancestry principal components. Two different
phenotypes of interest were analyzed separately: fasting glucose and log fasting insulin
levels.
For all of the studies we used the t-distribution as the reference distribution, because the
number of genetic variants among participants on drug therapy was too small to use
standard asymptotic results. The total degrees of freedom were calculated as the product of
the number of drug users, the SNP imputation quality and the SNP minor allele frequencies.
The p-values were calculated using the original beta over the standard error estimated
under t-distribution.
The meta-analysis was done using METAL125, applying the standard weighted Z-statistic
method. The weights were based on the product of: the number of drug users and SNP
imputation quality. The genome-wide threshold for significant drug-SNP interaction was
p<5X10⁻⁸ and the suggestive threshold was defined as p<1X10⁻⁵
3.3 RESULTS
The total number of participants with European ancestry among the 14 cohorts for the
fasting glucose study was 40226. HVH, WHI and FHS were cohorts that did not use
longitudinal data for this analysis. In the case of fasting insulin, 12 cohorts out of the 14
(36923 total participants) have data for the analysis, and FHS, RS1, RS2 and WHI cohorts
only have baseline phenotype information available. Some basic descriptive statistics are
shown in Table 3.3.1. There were more women than men participants, and the sample was
largely middle-aged to elderly. The average range of follow-up data for fasting glucose was
55
0.25 to 11.1 years and for fasting insulin it was 1.7 to 9.5 years. The total number of
autosomal SNPs available for analysis after imputation was 2.5 million.
Figure 3.3.1 and Figure 3.3.2 show the Manhattan and Q-Q plots for fasting glucose and
fasting insulin, respectively. They show a conservative distribution, with no early departures
of the p-values from the null expectation. There were no genome-wide significant (p<5*10-8)
interactions detected for either phenotype. However, there were some suggestive signals
scattered across the genome that may be of interest to other studies (Table 3.3.2 and Table
3.3.3).
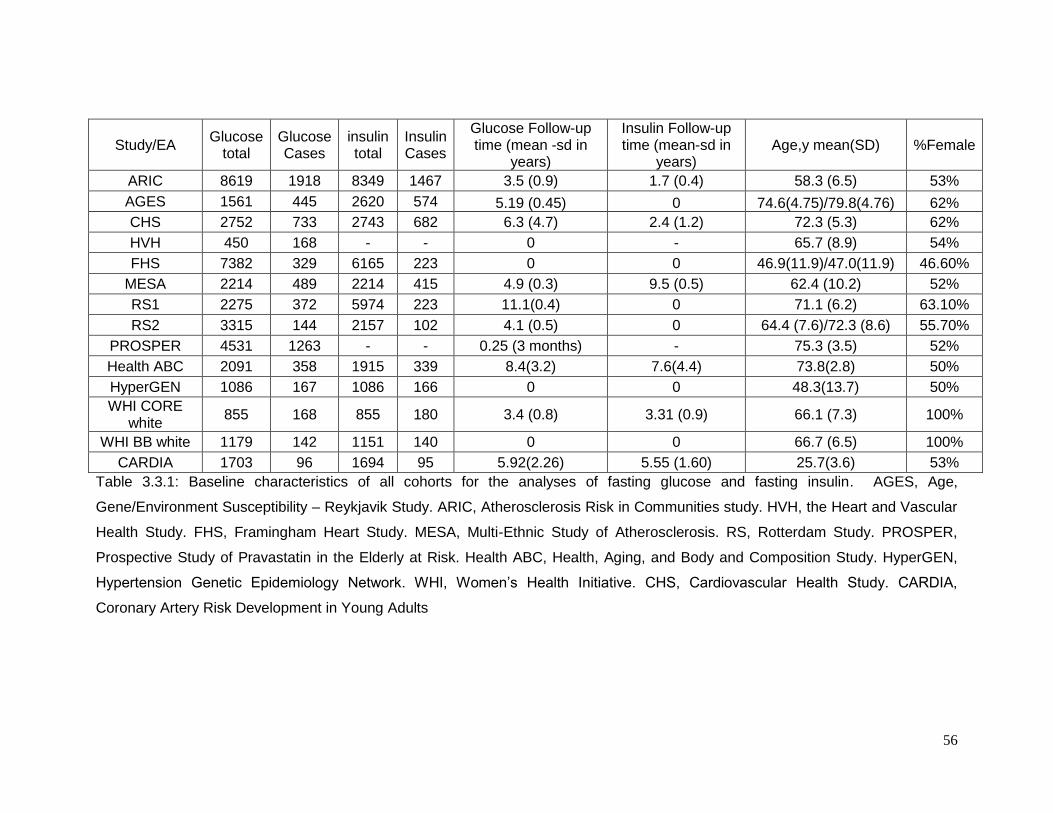
56
Study/EA Glucose
total Glucose Cases
insulin total
Insulin Cases
Glucose Follow-up time (mean -sd in
years)
Insulin Follow-up time (mean-sd in
years) Age,y mean(SD) %Female
ARIC 8619 1918 8349 1467 3.5 (0.9) 1.7 (0.4) 58.3 (6.5) 53%
AGES 1561 445 2620 574 5.19 (0.45) 0 74.6(4.75)/79.8(4.76) 62%
CHS 2752 733 2743 682 6.3 (4.7) 2.4 (1.2) 72.3 (5.3) 62%
HVH 450 168 - - 0 - 65.7 (8.9) 54%
FHS 7382 329 6165 223 0 0 46.9(11.9)/47.0(11.9) 46.60%
MESA 2214 489 2214 415 4.9 (0.3) 9.5 (0.5) 62.4 (10.2) 52%
RS1 2275 372 5974 223 11.1(0.4) 0 71.1 (6.2) 63.10%
RS2 3315 144 2157 102 4.1 (0.5) 0 64.4 (7.6)/72.3 (8.6) 55.70%
PROSPER 4531 1263 - - 0.25 (3 months) - 75.3 (3.5) 52%
Health ABC 2091 358 1915 339 8.4(3.2) 7.6(4.4) 73.8(2.8) 50%
HyperGEN 1086 167 1086 166 0 0 48.3(13.7) 50%
WHI CORE white
855 168 855 180 3.4 (0.8) 3.31 (0.9) 66.1 (7.3) 100%
WHI BB white 1179 142 1151 140 0 0 66.7 (6.5) 100%
CARDIA 1703 96 1694 95 5.92(2.26) 5.55 (1.60) 25.7(3.6) 53%
Table 3.3.1: Baseline characteristics of all cohorts for the analyses of fasting glucose and fasting insulin. AGES, Age,
Gene/Environment Susceptibility – Reykjavik Study. ARIC, Atherosclerosis Risk in Communities study. HVH, the Heart and Vascular
Health Study. FHS, Framingham Heart Study. MESA, Multi-Ethnic Study of Atherosclerosis. RS, Rotterdam Study. PROSPER,
Prospective Study of Pravastatin in the Elderly at Risk. Health ABC, Health, Aging, and Body and Composition Study. HyperGEN,
Hypertension Genetic Epidemiology Network. WHI, Women’s Health Initiative. CHS, Cardiovascular Health Study. CARDIA,
Coronary Artery Risk Development in Young Adults
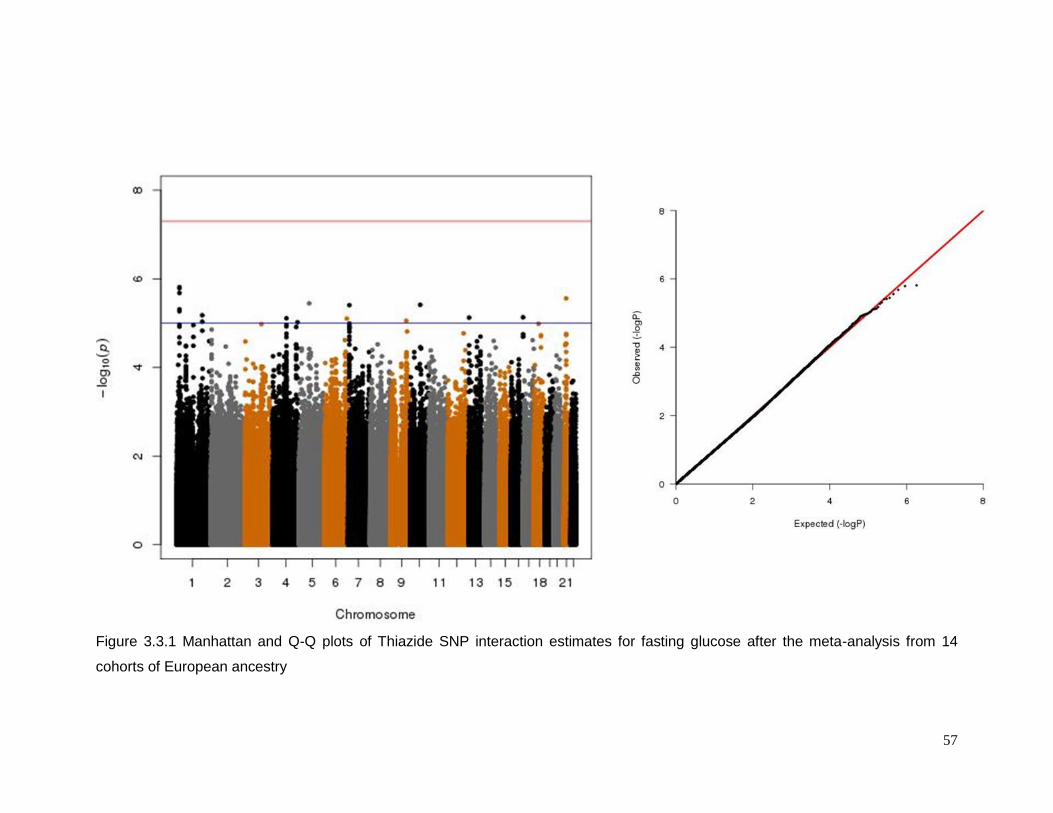
57
Figure 3.3.1 Manhattan and Q-Q plots of Thiazide SNP interaction estimates for fasting glucose after the meta-analysis from 14
cohorts of European ancestry
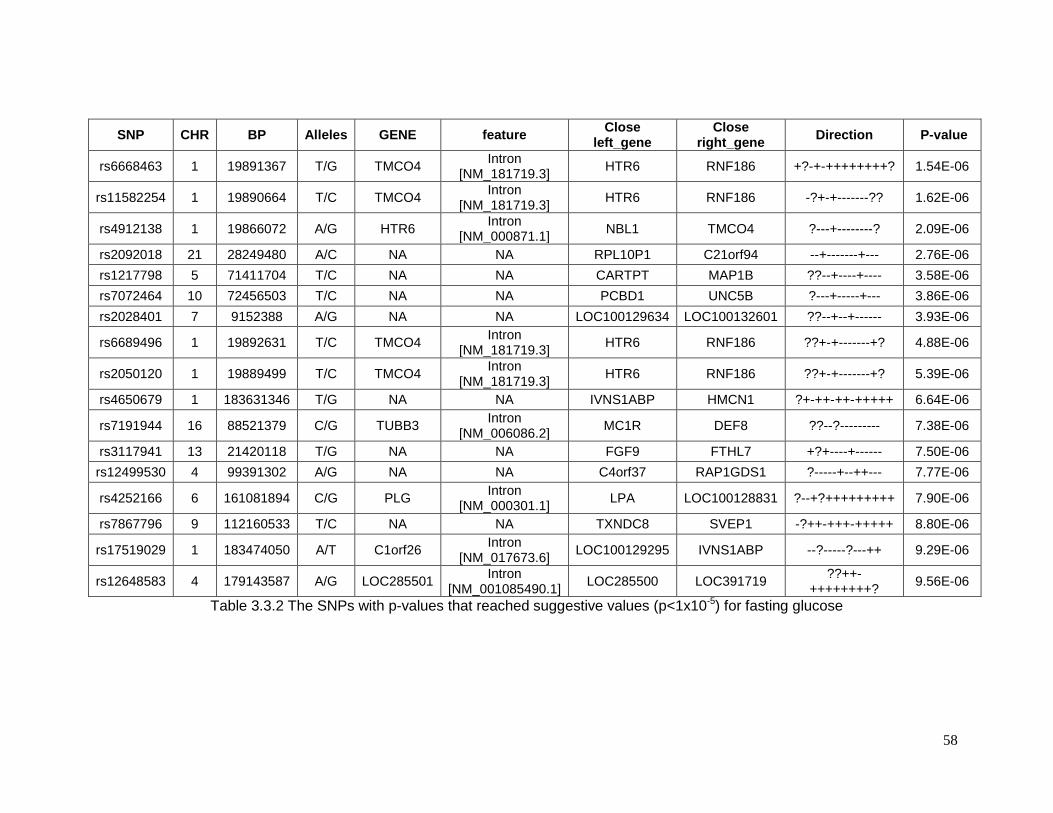
58
SNP CHR BP Alleles GENE feature Close
left_gene Close
right_gene Direction P-value
rs6668463 1 19891367 T/G TMCO4 Intron
[NM_181719.3] HTR6 RNF186 +?-+-++++++++? 1.54E-06
rs11582254 1 19890664 T/C TMCO4 Intron
[NM_181719.3] HTR6 RNF186 -?+-+-------?? 1.62E-06
rs4912138 1 19866072 A/G HTR6 Intron
[NM_000871.1] NBL1 TMCO4 ?---+--------? 2.09E-06
rs2092018 21 28249480 A/C NA NA RPL10P1 C21orf94 --+-------+--- 2.76E-06
rs1217798 5 71411704 T/C NA NA CARTPT MAP1B ??--+----+---- 3.58E-06
rs7072464 10 72456503 T/C NA NA PCBD1 UNC5B ?---+-----+--- 3.86E-06
rs2028401 7 9152388 A/G NA NA LOC100129634 LOC100132601 ??--+--+------ 3.93E-06
rs6689496 1 19892631 T/C TMCO4 Intron
[NM_181719.3] HTR6 RNF186 ??+-+-------+? 4.88E-06
rs2050120 1 19889499 T/C TMCO4 Intron
[NM_181719.3] HTR6 RNF186 ??+-+-------+? 5.39E-06
rs4650679 1 183631346 T/G NA NA IVNS1ABP HMCN1 ?+-++-++-+++++ 6.64E-06
rs7191944 16 88521379 C/G TUBB3 Intron
[NM_006086.2] MC1R DEF8 ??--?--------- 7.38E-06
rs3117941 13 21420118 T/G NA NA FGF9 FTHL7 +?+----+------ 7.50E-06
rs12499530 4 99391302 A/G NA NA C4orf37 RAP1GDS1 ?-----+--++--- 7.77E-06
rs4252166 6 161081894 C/G PLG Intron
[NM_000301.1] LPA LOC100128831 ?--+?+++++++++ 7.90E-06
rs7867796 9 112160533 T/C NA NA TXNDC8 SVEP1 -?++-+++-+++++ 8.80E-06
rs17519029 1 183474050 A/T C1orf26 Intron
[NM_017673.6] LOC100129295 IVNS1ABP --?-----?---++ 9.29E-06
rs12648583 4 179143587 A/G LOC285501 Intron
[NM_001085490.1] LOC285500 LOC391719
??++-++++++++?
9.56E-06
Table 3.3.2 The SNPs with p-values that reached suggestive values (p<1x10⁻⁵) for fasting glucose
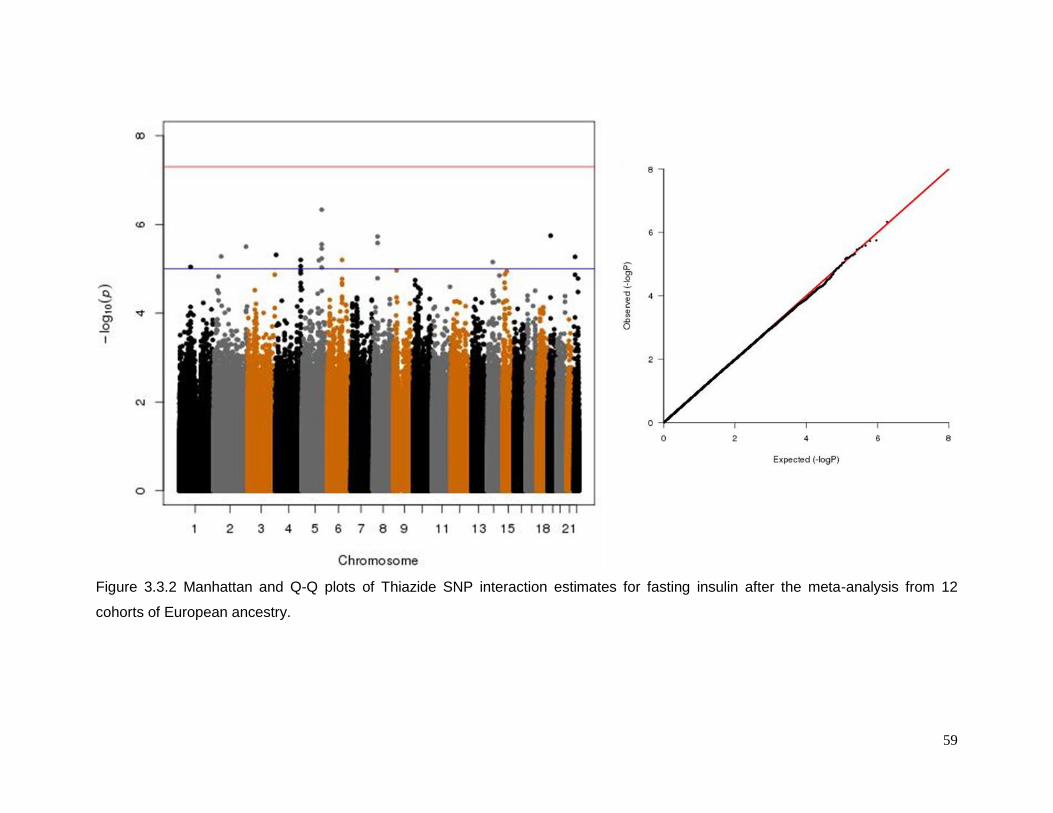
59
Figure 3.3.2 Manhattan and Q-Q plots of Thiazide SNP interaction estimates for fasting insulin after the meta-analysis from 12
cohorts of European ancestry.
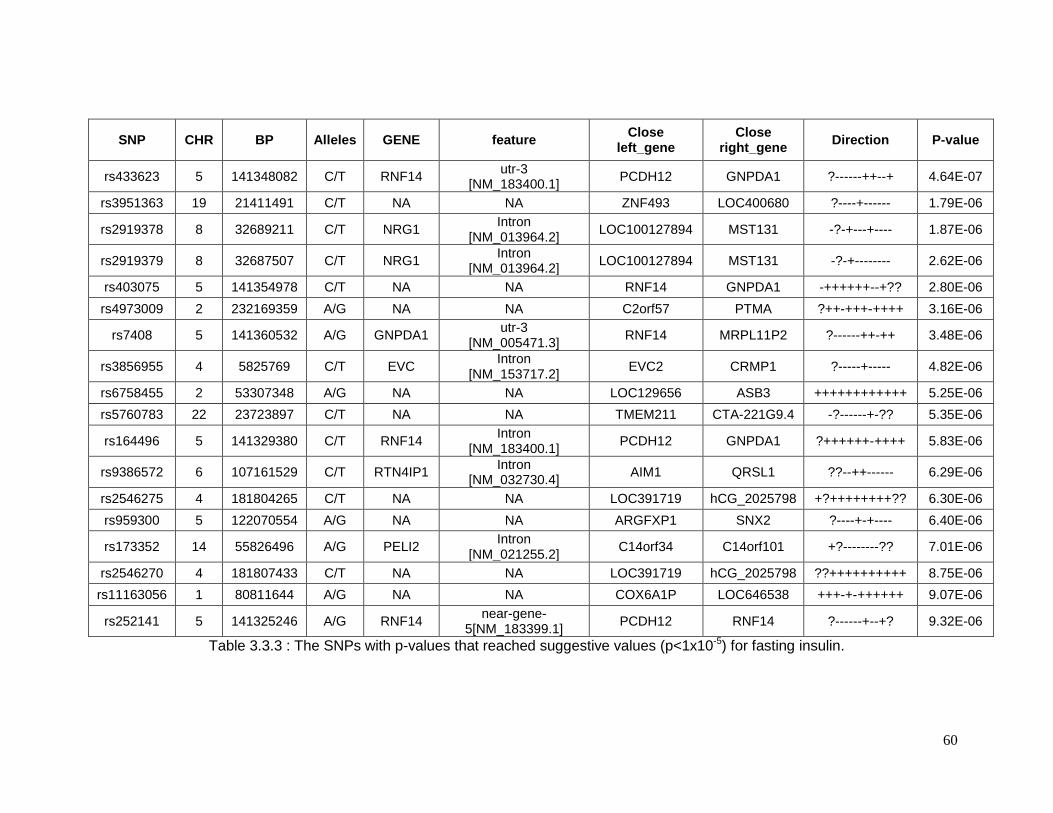
60
SNP CHR BP Alleles GENE feature Close
left_gene Close
right_gene Direction P-value
rs433623 5 141348082 C/T RNF14 utr-3
[NM_183400.1] PCDH12 GNPDA1 ?------++--+ 4.64E-07
rs3951363 19 21411491 C/T NA NA ZNF493 LOC400680 ?----+------ 1.79E-06
rs2919378 8 32689211 C/T NRG1 Intron
[NM_013964.2] LOC100127894 MST131 -?-+---+---- 1.87E-06
rs2919379 8 32687507 C/T NRG1 Intron
[NM_013964.2] LOC100127894 MST131 -?-+-------- 2.62E-06
rs403075 5 141354978 C/T NA NA RNF14 GNPDA1 -++++++--+?? 2.80E-06
rs4973009 2 232169359 A/G NA NA C2orf57 PTMA ?++-+++-++++ 3.16E-06
rs7408 5 141360532 A/G GNPDA1 utr-3
[NM_005471.3] RNF14 MRPL11P2 ?------++-++ 3.48E-06
rs3856955 4 5825769 C/T EVC Intron
[NM_153717.2] EVC2 CRMP1 ?-----+----- 4.82E-06
rs6758455 2 53307348 A/G NA NA LOC129656 ASB3 ++++++++++++ 5.25E-06
rs5760783 22 23723897 C/T NA NA TMEM211 CTA-221G9.4 -?------+-?? 5.35E-06
rs164496 5 141329380 C/T RNF14 Intron
[NM_183400.1] PCDH12 GNPDA1 ?++++++-++++ 5.83E-06
rs9386572 6 107161529 C/T RTN4IP1 Intron
[NM_032730.4] AIM1 QRSL1 ??--++------ 6.29E-06
rs2546275 4 181804265 C/T NA NA LOC391719 hCG_2025798 +?++++++++?? 6.30E-06
rs959300 5 122070554 A/G NA NA ARGFXP1 SNX2 ?----+-+---- 6.40E-06
rs173352 14 55826496 A/G PELI2 Intron
[NM_021255.2] C14orf34 C14orf101 +?--------?? 7.01E-06
rs2546270 4 181807433 C/T NA NA LOC391719 hCG_2025798 ??++++++++++ 8.75E-06
rs11163056 1 80811644 A/G NA NA COX6A1P LOC646538 +++-+-++++++ 9.07E-06
rs252141 5 141325246 A/G RNF14 near-gene-
5[NM_183399.1] PCDH12 RNF14 ?------+--+? 9.32E-06
Table 3.3.3 : The SNPs with p-values that reached suggestive values (p<1x10⁻⁵) for fasting insulin.
61
3.4 DISCUSSION
Onset of adverse metabolic effects following thiazide or thiazide-like therapy is
unpredictable. Therefore, if we can identify genomic markers that confer greater risk for
these adverse effects, we can use them to better understand the biology underlying the
phenomenon and perhaps predict those individuals who may be susceptible and advise
them (and their physician) to use alternative antihypertensive therapies. However, one of the
major limitations to identify the contributing genes (or genomic regions) is the small number
of individuals in previous GWAS studies using a controlled intervention approach94.
The CHARGE pharmacogenomics group with its 14 large multi-institutional cohorts
represents the largest effort in detecting genomic loci influencing diuretic response by
collecting a large number of participating individuals – 40226 in the case of fasting glucose
and 36923 for fasting insulin. Our meta-analysis did not identify a common SNP (p-value < 5
X 10-8) conferring high risk for hyperglycemia or hyperinsulinemia among European-
American participants. Lack of positive results in our analysis suggests that it is unlikely that
there is a single common SNP with a large influence on the adverse metabolic reaction to
diuretic therapy. I speculate that there may be multiple variants spread throughout the
genome each with modest effect sizes or a few rare variants with large effect that have a
greater role in these phenotypes.
This study has limitations. For example, environmental factors such as salt intake were not
controlled for in these observational studies. Confounding by contraindication resulting from
comorbidities influencing thiazide diuretic use may also be a factor. However a previous
simulation showed that these phenomena have very modest effects on estimates of
interaction in pharmacogenomics studies126. Ascertainment of drug use was based on
medication inventory or pharmacy data, and the latter is more accurate than the former to
gauge usage. Finally, the fact that our drug definition is thiazide or thiazide-like diuretic, in a
single or combination preparation with or without concomitant use of a loop diuretic,
potassium-sparing diuretic, or potassium supplement may have led to heterogeneous
effects. These realities may have reduced the sensitivity for detecting SNPs possessing
important interactive effects.
62
CHAPTER 4: TRANS ETHNIC META ANALYSIS SUGGESTS GENETIC VARIATION IN
THE HEME PATHWAY INFLUENCES POTASSIUM RESPONSE IN PATIENTS
TREATED WITH HYDROCHLOROTHIAZIDE.
This chapter is based upon: Del-Aguila JL, Cooper-Dehoff RM, Chapman AB, Gums
JG, Beitelshees AL, Bailey K, Turner ST, Johnson JA, Boerwinkle E
Pharmacogenomics J. “in press” (permission from Nature Publishing Group)
63
4.1 INTRODUCTION
One adverse effect of thiazide diuretic treatment of hypertension is hypokalemia49, 91.
Hypokalemia, in turn, may be responsible for impaired insulin secretion56, 127, although this
hypothesis is not universally supported100, 128. The process by which thiazide diuretics lead to
potassium wasting and hypokalemia in some patients but not others is not well-understood.
This chapter is an effort to identify genes or pathways associated with
hydrochlorothiazide (HCTZ)-induced hypokalemia. To accomplish this goal, I performed a
genome-wide association study (GWAS) and a Multi-Ethnic Meta-Analysis (MANTRA)129 in
European-American and African-American hypertensive patients from two different
pharmacogenetic studies.
The results presented here are the first GWAS to our knowledge of diuretic-induced
potassium loss, and the analysis was conducted in four different study samples (European-
Americans and African-Americans each from two different studies).
The data implicate the HEME pathway in affecting diuretic treatment-induced
hypokalemia.
4.2 MATERIALS AND METHODS
4.2.1 Study population
Details of the Pharmacogenomic Evaluation of Antihypertensive Responses (PEAR,
clinicaltrials.gov identifier NCT00246519) study and The Genetic Epidemiology of
Responses to Antihypertensive (GERA, clinicaltrials.gov identifier NCT00005520) study
have been previously published130, 131. PEAR and GERA study participants were African-
Americans and European-Americans with mild to moderate essential hypertension without a
history of heart disease or diabetes mellitus. In PEAR, after a wash out period of
approximately 4 weeks, blood and urine were collected in a fasting state. After the baseline
evaluations were completed, participants were randomized to HCTZ (thiazide diuretic
12.5mg orally once daily) or atenolol (β-blocker 50mg orally once daily) for three weeks, with
dose doubling (to 25 mg HCTZ) for those with BP > 120/70 mmHg for an additional 6 weeks.
More than 90% of PEAR participants received the higher 25 mg dose of HCTZ. For this
analysis of potassium (K+) response, we used only those randomized to the HCTZ arm,
referred to hereafter as PEAR HCTZ monotherapy.
64
In GERA, after a wash-out period of at least 4 weeks, blood samples were obtained
for baseline biochemical measurement, and then qualifying participants were treated with
HCTZ (25 mg orally once daily) for 4 weeks. At the end of the 4 week diuretic treatment
period, blood pressure was measured and blood samples were again obtained for
biochemical measurements. All blood collections were done in the morning after 8 hours of
fasting.
All participants enrolled in PEAR and GERA provided written informed consent, and
the institutional review boards of participating study centers approved the study protocols.
4.2.2 Phenotype and Genotype data
Serum potassium concentrations, in PEAR, were measured on a Hitachi 911
Chemistry Analyzer (Roche Diagnostics, Indianapolis, IN, USA). In GERA, serum potassium
concentrations were measured by flame photometer (Instrumentation Laboratories model
943, Lexington, MA). Plasma insulin, which was used as a covariate during statistical
analyses, was measured in both studies with the Access Ultrasensitive Insulin immunoassay
system.
In GERA, serum potassium concentration was determined after 2 weeks of HCTZ
therapy. In PEAR, serum potassium concentrations were measured at the end of the wash-
out period (baseline), after three weeks and at the end of the HCTZ monotherapy. In both
studies, there were protocol-mandated potassium supplementation requirements based on
serum potassium levels. Potassium supplementation was required for values < 3.6 mmol/L
in GERA and < 3.2 mmol/L in PEAR. Potassium supplementation was also available for
use by the study physician, at their discretion, at higher potassium levels. To avoid
confounding from prescribed potassium supplementation and to promote patient safety,
serum potassium response to HCTZ was defined as the difference between the levels
measured after the first visit (two weeks in GERA case and three in PEAR) of treatment and
the baseline visit, prior to initiation of potassium supplementation. Thirteen participants with
potassium response values under or over 3 standard deviations from the mean response
were removed from the analysis.
Participants were genotyped using the Illumina HumanOmni1-Quad (Illumina, San
Diego, California, USA) in the case of PEAR and the GeneChip Human Mapping 500k
Array, (Affymetrics, Santa Clara California, USA) in the case of GERA. Standard quality
control steps were applied to the raw genotype data in both studies: single nucleotide
polymorphisms (SNPs) with minor allele frequency (MAF) <1%, call rates <95%, Hardy-
65
Weinberg equilibrium p-values ≥10-5 and participants with more than 10% missing
genotypes were removed from the analysis. The software MACH95
(www.sph.umich.edu/csg/abecasis/MACH/download) was used to impute the approximate
2.5 million HapMap SNPs using the Phase II CEU as the reference panel for European-
Americans and a cosmopolitan sample of CEU and YRI for African-Americans. Quality
control filters for the imputed results were RSQ_HAT <0.3 and MAF ≤ 0.05. MACH
generated a file with the highest posterior probabilities for each imputed SNP (i.e. dosage)
which was used in the analysis. After quality control and imputation, there were more than 2
million SNPs used for the genotype-phenotype association studies in each race-study
group.
4.2.3 Statistical analysis
Additive genetic association analyses of potassium response to HCTZ were
performed by self-reported race within each study using ProbABEL123, while adjusting for
sex, age, waist circumference, the baseline values of potassium and insulin, and the two
first principal component scores (PCS), to avoid the possibility of spurious association as the
result of population substructure132, 133. The principal components were calculated using the
EIGENSTRAT132 software. The European-American and African-American GWAS analyses
were combined via transethnic meta-analysis using MANTRA (Meta-Analysis of Transethnic
Association studies)129. MANTRA clusters populations by the mean allele frequency
difference. If populations are in the same cluster, MANTRA assumes that they have the
same underlying allelic effects and a fixed effect model is performed. On the other hand, if
populations are in different cluster, the assumption will be that they do not have the same
underlying allelic effect and a random effect analysis is performed. MANTRA provides a
combined association signal called a Bayes Factor (BF) instead of a traditional p-value to
compare the null and alternative hypotheses. A BF of 105, roughly corresponding to a p-
value of 7.9x10⁻⁷, was considered significant evidence of association134 after accounting for
genome-wide multiple comparisons135.
4.3 RESULTS
Table 4.3.1 A and Table 4.3.1B summarize the baseline characteristics of the
European-American and African-American study participants, respectively. Both studies had
a higher percentage of European-Americans male and African American female study
participants. The average age and waist circumference were nearly identical between PEAR
66
and GERA. Baseline potassium was lower in African-Americans from GERA compared to
the other groups. The mean response in European Americans was lower compared to
African Americans. Figure 4.3.1 shows the distribution of potassium response in both
populations after removing 13 outlier individuals.
No genome-wide significant association was found in each separate study and race
group (supplementary information pp 77-90). After the multi-ethnic meta-analysis, the top
seven SNPs from MANTRA are shown in Table 4.3.2, and four of them, located in three
different loci, reached genome-wide significance. A Manhattan plot of the BFs is shown in
Figure 4.3.2. These significant SNPs are: 1) rs10845697 (BF=5.560) on chromosome 12,
near to the heme binding protein 1 gene (HEBP1), 2) rs1007869 and rs12596186 (LD:
r2>0.99, BF=5.347 and 5.114 respectively) on chromosome 16, near the junctophilin 3 gene
(JPH3) and 3) rs11135740 (BF=5.258) on chromosome 8, near to the Mitoferrin-1 gene
(SLC25A37 also known as MFRN1). The effects of rs10845697 were not consistent among
study samples (Table 4.3.2). Whether this inconsistency is due to chance sampling
variation, differences in linkage disequilibrium, or differences in allelic effects among the
study samples is not known rs12596186 (LD: r2>0.99, BF=5.347 and 5.114 respectively) on
chromosome 16, near the junctophilin 3 gene (JPH3) and 3) rs11135740 (BF=5.258) on
chromosome 8, near to the Mitoferrin-1 gene (SLC25A37 also known as MFRN1).
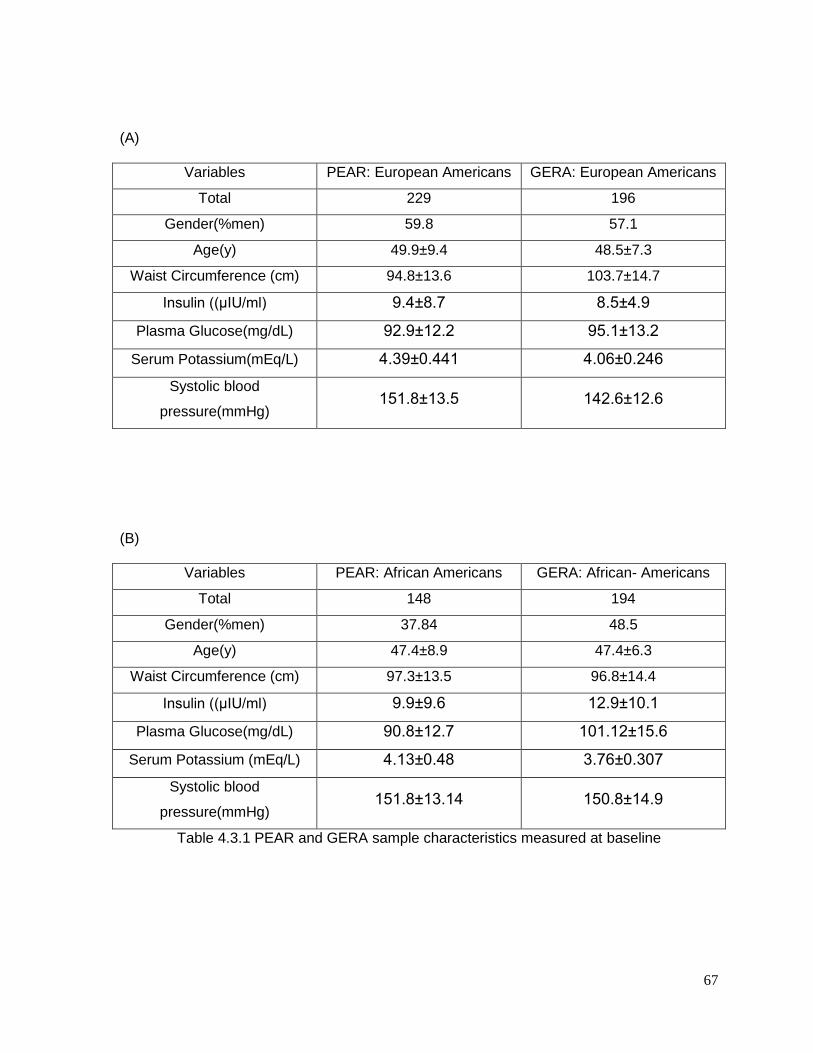
67
(A)
Variables PEAR: European Americans GERA: European Americans
Total 229 196
Gender(%men) 59.8 57.1
Age(y) 49.9±9.4 48.5±7.3
Waist Circumference (cm) 94.8±13.6 103.7±14.7
Insulin ((μIU/ml) 9.4±8.7 8.5±4.9
Plasma Glucose(mg/dL) 92.9±12.2 95.1±13.2
Serum Potassium(mEq/L) 4.39±0.441 4.06±0.246
Systolic blood
pressure(mmHg) 151.8±13.5 142.6±12.6
(B)
Variables PEAR: African Americans GERA: African- Americans
Total 148 194
Gender(%men) 37.84 48.5
Age(y) 47.4±8.9 47.4±6.3
Waist Circumference (cm) 97.3±13.5 96.8±14.4
Insulin ((μIU/ml) 9.9±9.6 12.9±10.1
Plasma Glucose(mg/dL) 90.8±12.7 101.12±15.6
Serum Potassium (mEq/L) 4.13±0.48 3.76±0.307
Systolic blood
pressure(mmHg) 151.8±13.14 150.8±14.9
Table 4.3.1 PEAR and GERA sample characteristics measured at baseline
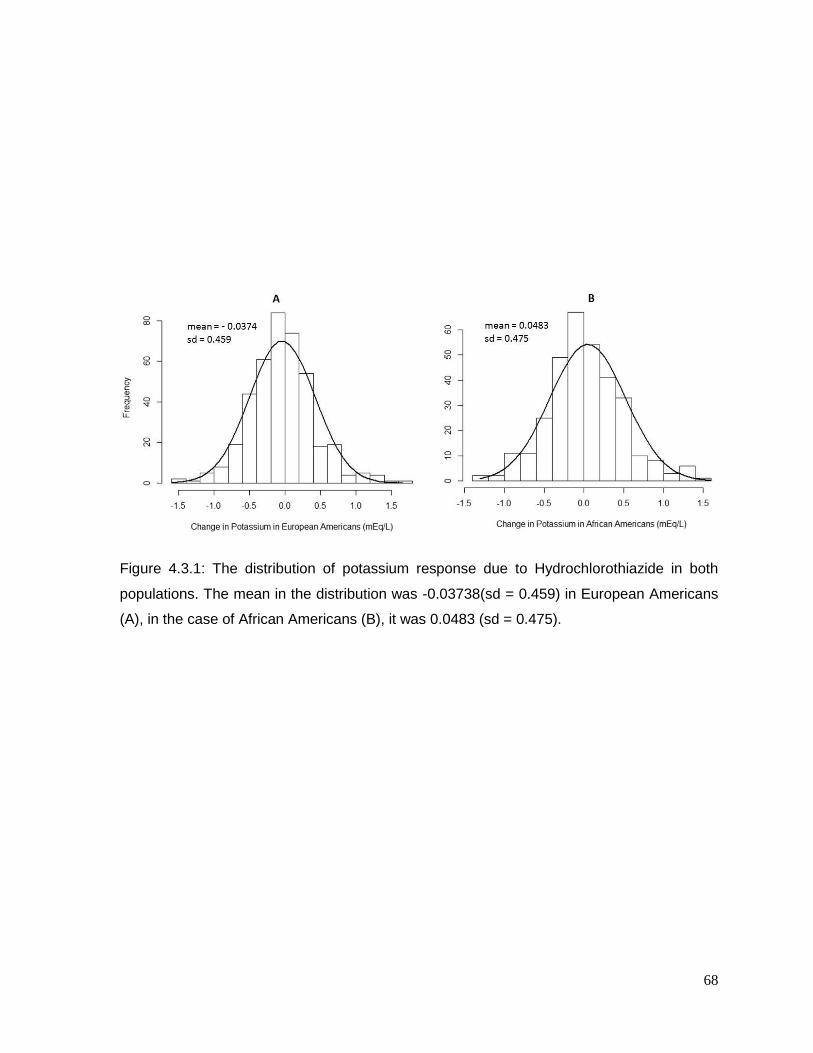
68
Figure 4.3.1: The distribution of potassium response due to Hydrochlorothiazide in both
populations. The mean in the distribution was -0.03738(sd = 0.459) in European Americans
(A), in the case of African Americans (B), it was 0.0483 (sd = 0.475).
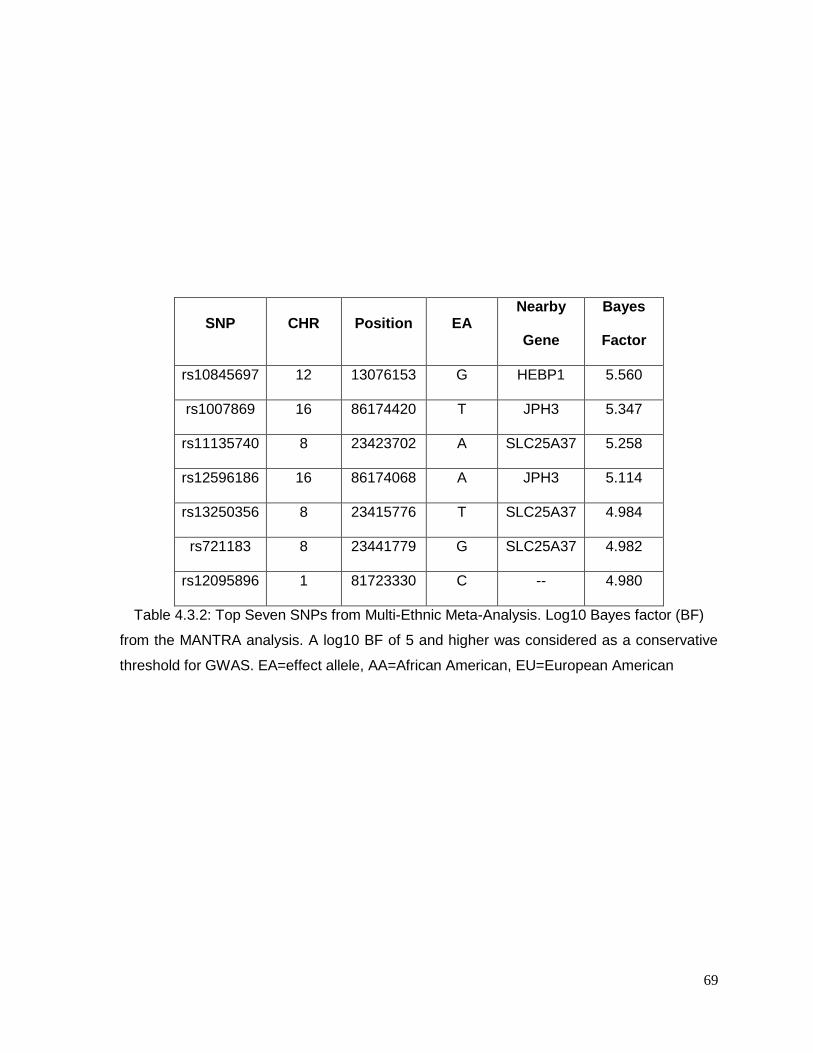
69
SNP CHR Position EA Nearby
Gene
Bayes
Factor
rs10845697 12 13076153 G HEBP1 5.560
rs1007869 16 86174420 T JPH3 5.347
rs11135740 8 23423702 A SLC25A37 5.258
rs12596186 16 86174068 A JPH3 5.114
rs13250356 8 23415776 T SLC25A37 4.984
rs721183 8 23441779 G SLC25A37 4.982
rs12095896 1 81723330 C -- 4.980
Table 4.3.2: Top Seven SNPs from Multi-Ethnic Meta-Analysis. Log10 Bayes factor (BF)
from the MANTRA analysis. A log10 BF of 5 and higher was considered as a conservative
threshold for GWAS. EA=effect allele, AA=African American, EU=European American
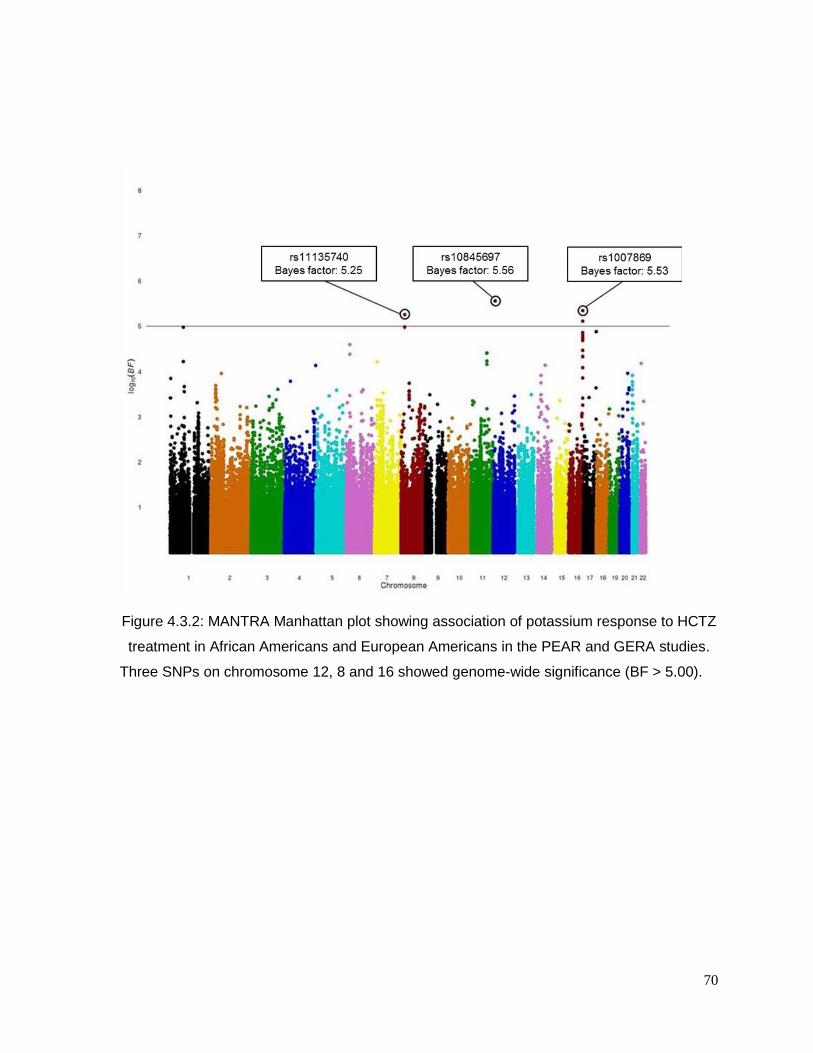
70
Figure 4.3.2: MANTRA Manhattan plot showing association of potassium response to HCTZ
treatment in African Americans and European Americans in the PEAR and GERA studies.
Three SNPs on chromosome 12, 8 and 16 showed genome-wide significance (BF > 5.00).
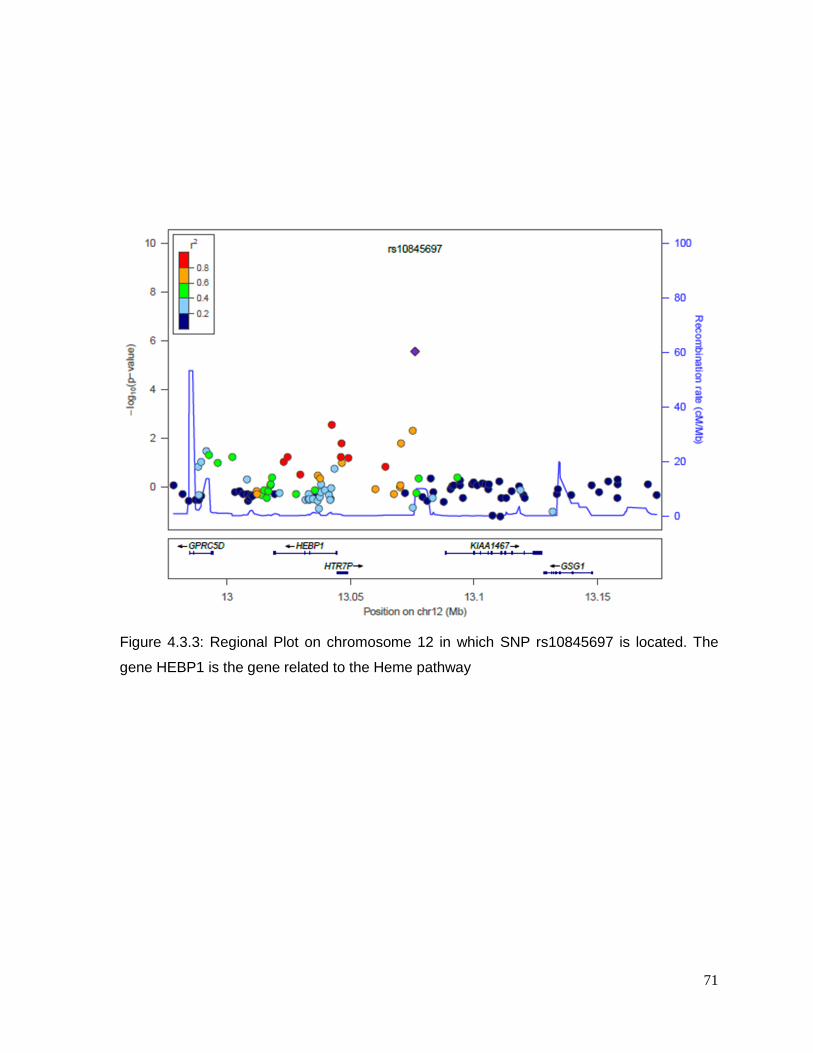
71
Figure 4.3.3: Regional Plot on chromosome 12 in which SNP rs10845697 is located. The
gene HEBP1 is the gene related to the Heme pathway

72
Figure 4.3.4: Regional Plot on Chromosome 16 shows the position of rs1007869. The gene
JPH3 is related to Huntington Disease and chronic kidney disease.
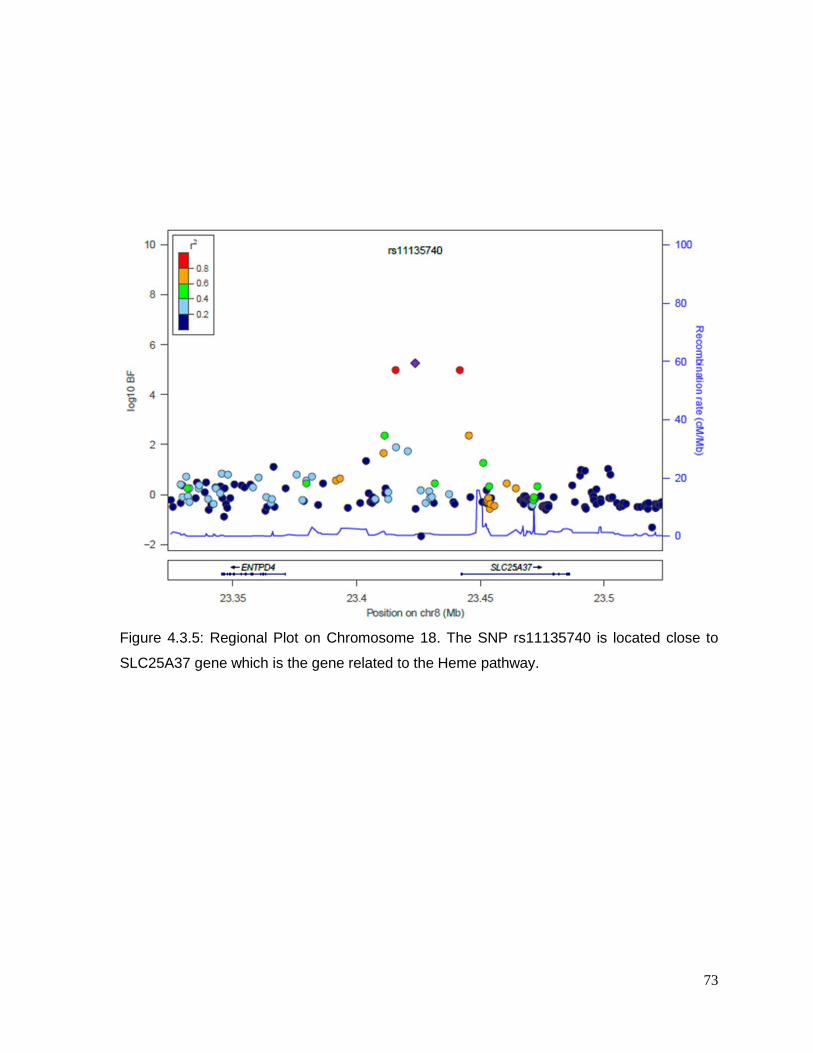
73
Figure 4.3.5: Regional Plot on Chromosome 18. The SNP rs11135740 is located close to
SLC25A37 gene which is the gene related to the Heme pathway.
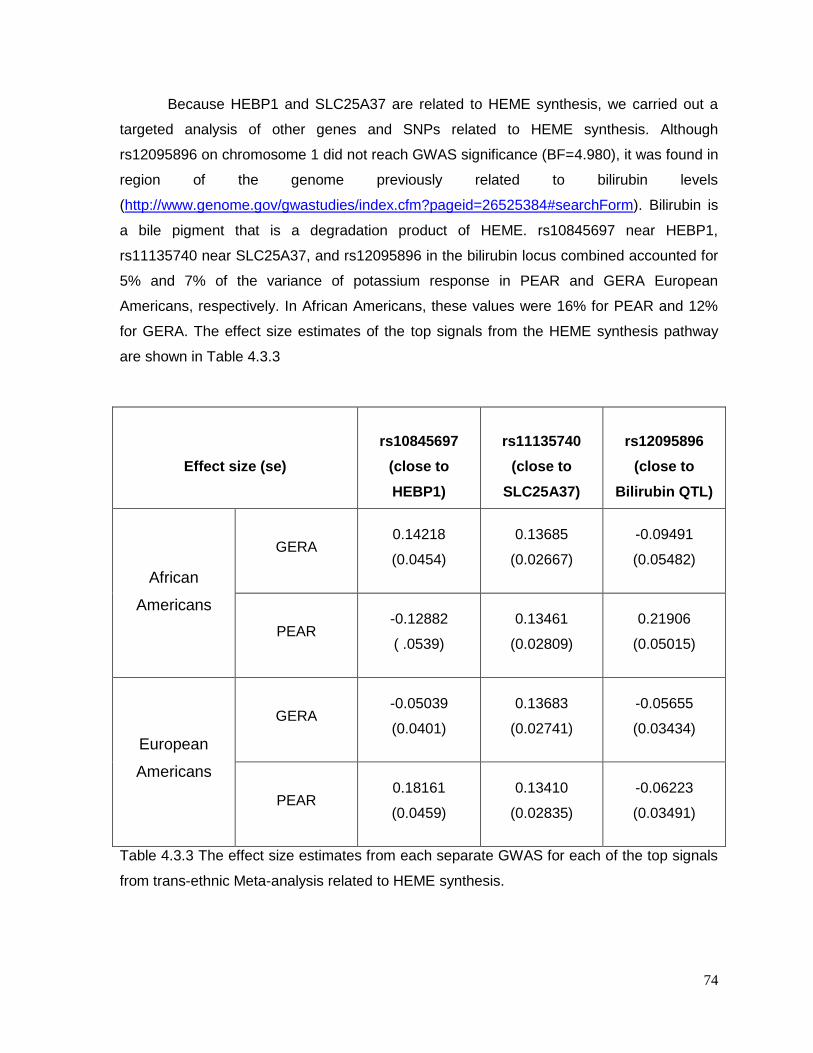
74
Because HEBP1 and SLC25A37 are related to HEME synthesis, we carried out a
targeted analysis of other genes and SNPs related to HEME synthesis. Although
rs12095896 on chromosome 1 did not reach GWAS significance (BF=4.980), it was found in
region of the genome previously related to bilirubin levels
(http://www.genome.gov/gwastudies/index.cfm?pageid=26525384#searchForm). Bilirubin is
a bile pigment that is a degradation product of HEME. rs10845697 near HEBP1,
rs11135740 near SLC25A37, and rs12095896 in the bilirubin locus combined accounted for
5% and 7% of the variance of potassium response in PEAR and GERA European
Americans, respectively. In African Americans, these values were 16% for PEAR and 12%
for GERA. The effect size estimates of the top signals from the HEME synthesis pathway
are shown in Table 4.3.3
Effect size (se)
rs10845697
(close to
HEBP1)
rs11135740
(close to
SLC25A37)
rs12095896
(close to
Bilirubin QTL)
African
Americans
GERA
0.14218
(0.0454)
0.13685
(0.02667)
-0.09491
(0.05482)
PEAR
-0.12882
( .0539)
0.13461
(0.02809)
0.21906
(0.05015)
European
Americans
GERA
-0.05039
(0.0401)
0.13683
(0.02741)
-0.05655
(0.03434)
PEAR
0.18161
(0.0459)
0.13410
(0.02835)
-0.06223
(0.03491)
Table 4.3.3 The effect size estimates from each separate GWAS for each of the top signals
from trans-ethnic Meta-analysis related to HEME synthesis.
75
4.4 DISCUSSION
Hypokalemia is a well-known adverse effect in patients taking HCTZ. The purpose of
this study was to identify genes or genomic regions associated with HCTZ-induced change
in potassium. I conducted a GWAS and MANTRA from two studies of hypertensive
European American and African American individuals. Four SNPs achieved a log 10 Bayes
Factor greater than 5 which was defined a priori to be GWAS significant. Confirmation of
these results will be required in an independent sample of hypertensive patients treated with
HCTZ. Among the top SNPs, rs10845697 near HEBP1 and rs11135740, near Mitoferrin-1
(SLC25A37) have a role in heme biosynthesis136-139. Heme has been identified as a
modulator of the large-conductance Ca2+-activated K+ channels (BK, or maxi K) channels140.
BK channels are located in the cortical thick ascending limbs141-143, the distal convoluted
tubule(DCT)144, connecting tubule (CNT)145 and the medullary collecting tubule (MCD) 141-143
in the kidney. They are sensitive to change in both voltage and calcium concentration and
they work as volume regulatory channels and secrete potassium146. In the CNT, Thiazide-
induced increased ultrafiltrate delivery to the CNT, this will result in augmented tubular flow
in CNT promoting BK-dependent K+ secretion at this site. However, they have not
previously been considered important contributors to renal potassium secretion because of
their low open probabilities (Po) as well as their low concentration on the principal cell in the
collecting ducts of the kidney 146. The main route for potassium secretion is considered to be
the inwardly-rectifying channel, subfamily J, member 1 (ROMK1) encoded by the gene
KCNJ1 which has higher Po and higher density on principal cells than BK channels147.
Although KCNJ1 has shown significant associations with change in glucose in multiple
studies148, 149, SNPs in and around KCNJ1 were not associated with potassium response to
HCTZ (data not shown) in this study.
I hypothesize that HCTZ affects serum K in part by influencing heme levels; the bulk
of the effect would be inhibition of Na-Cl cotransporter. Heme has been shown to increase
the Po of the BK channels at negative voltages and to decrease it at more positive
voltages150. As a result, the secretion of potassium by BK channels would be positively
associated with heme levels.
Herein, we report the first GWAS to our knowledge of HCTZ-induced hypokalemia
and provide evidence for a novel mechanism of HCTZ-induced hypokalemia. Our study is
unique in that it included a washout of all antihypertensive agents prior to initiation of HCTZ
and collected detailed data regarding potassium supplementation and levels. However,
there are weaknesses that must be acknowledged, for instance, although MANTRA can

76
provide an overall Bayes factor as the combined association signal, it fails in estimating a
proper combined effect size from the joint analysis of all the studies. Another weakness is
the absence of replication sample. During this study, we contacted multiple potential
collaborators in the United States and Europe, but none had appropriate potassium
response data to serve as a replication for this study. This experience underscores the need
for an international pharmacogenetics of antihypertinsives consortium.
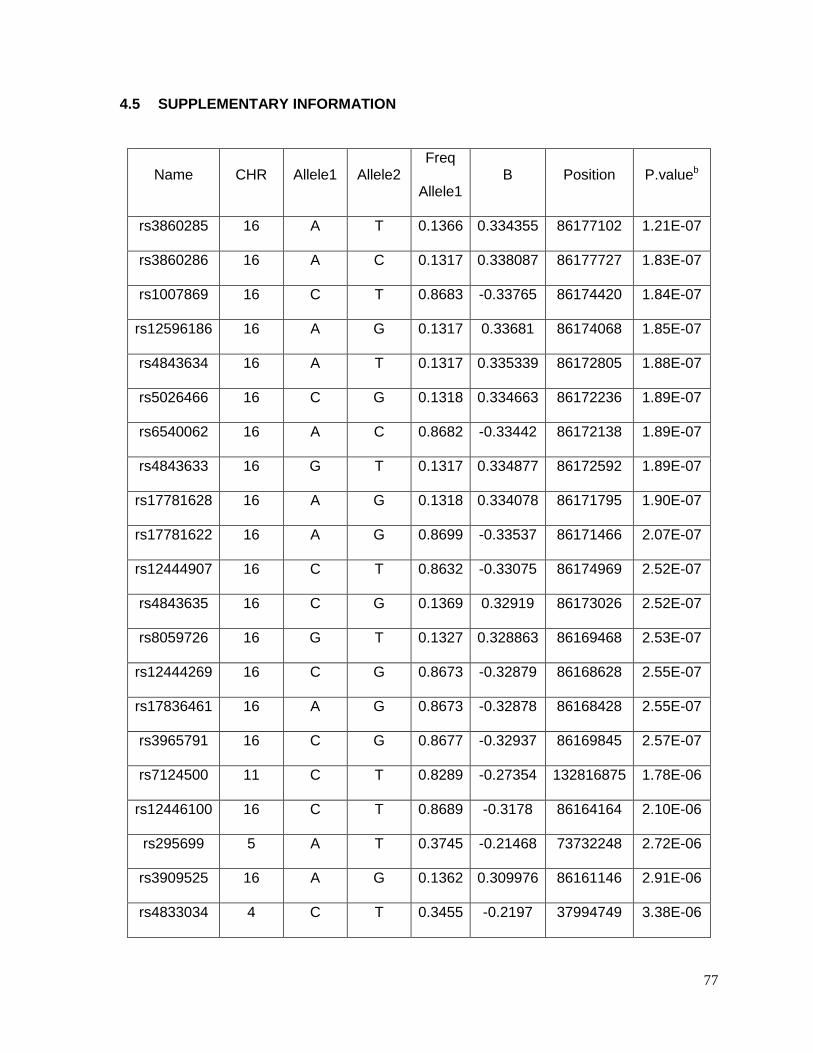
77
4.5 SUPPLEMENTARY INFORMATION
Name CHR Allele1 Allele2 Freq
Allele1 B Position P.valueb
rs3860285 16 A T 0.1366 0.334355 86177102 1.21E-07
rs3860286 16 A C 0.1317 0.338087 86177727 1.83E-07
rs1007869 16 C T 0.8683 -0.33765 86174420 1.84E-07
rs12596186 16 A G 0.1317 0.33681 86174068 1.85E-07
rs4843634 16 A T 0.1317 0.335339 86172805 1.88E-07
rs5026466 16 C G 0.1318 0.334663 86172236 1.89E-07
rs6540062 16 A C 0.8682 -0.33442 86172138 1.89E-07
rs4843633 16 G T 0.1317 0.334877 86172592 1.89E-07
rs17781628 16 A G 0.1318 0.334078 86171795 1.90E-07
rs17781622 16 A G 0.8699 -0.33537 86171466 2.07E-07
rs12444907 16 C T 0.8632 -0.33075 86174969 2.52E-07
rs4843635 16 C G 0.1369 0.32919 86173026 2.52E-07
rs8059726 16 G T 0.1327 0.328863 86169468 2.53E-07
rs12444269 16 C G 0.8673 -0.32879 86168628 2.55E-07
rs17836461 16 A G 0.8673 -0.32878 86168428 2.55E-07
rs3965791 16 C G 0.8677 -0.32937 86169845 2.57E-07
rs7124500 11 C T 0.8289 -0.27354 132816875 1.78E-06
rs12446100 16 C T 0.8689 -0.3178 86164164 2.10E-06
rs295699 5 A T 0.3745 -0.21468 73732248 2.72E-06
rs3909525 16 A G 0.1362 0.309976 86161146 2.91E-06
rs4833034 4 C T 0.3455 -0.2197 37994749 3.38E-06

78
rs17215757 4 C T 0.0559 0.455013 182896313 3.64E-06
rs7481213 11 C T 0.8288 -0.26326 132844528 4.11E-06
rs7481500 11 G T 0.8277 -0.26268 132839560 4.13E-06
rs7926647 11 C T 0.173 0.259554 132827521 4.55E-06
rs11223474 11 A T 0.8267 -0.259 132824185 4.66E-06
rs10474415 5 A C 0.3724 -0.21108 73730174 4.89E-06
rs3912201 14 C T 0.591 0.206028 55664173 5.00E-06
rs7349056 22 A G 0.8351 -0.49493 22061801 5.88E-06
rs7871887 9 C T 0.1336 -0.319 99611263 7.00E-06
rs3911953 3 A G 0.3848 -0.20546 73880249 7.56E-06
rs3845885 3 C T 0.3848 -0.20544 73881112 7.63E-06
rs2309536 4 C T 0.906 -0.35428 182870193 8.17E-06
rs2961071 7 A T 0.3574 0.204126 141407299 8.18E-06
rs11586466 1 C T 0.6833 0.349123 94892799 8.61E-06
rs17779898 4 A C 0.2737 0.22088 73987351 9.21E-06
rs6590698 11 C G 0.7902 -0.24367 132819450 9.44E-06
rs7127798 11 A G 0.2093 0.244889 132816986 9.59E-06
rs7112051 11 C T 0.2127 0.243601 132852125 9.97E-06
rs6590712 11 A C 0.7874 -0.24358 132854916 9.98E-06
Table 4.5.1: Top 40 SNPs associated with potassium response in European Americans in
the GERA study (p<10-5)bP-values are based on a linear regression adjusted for sex, age,
waist circumference, baseline insulin, baseline potassium and the two first principal
components.
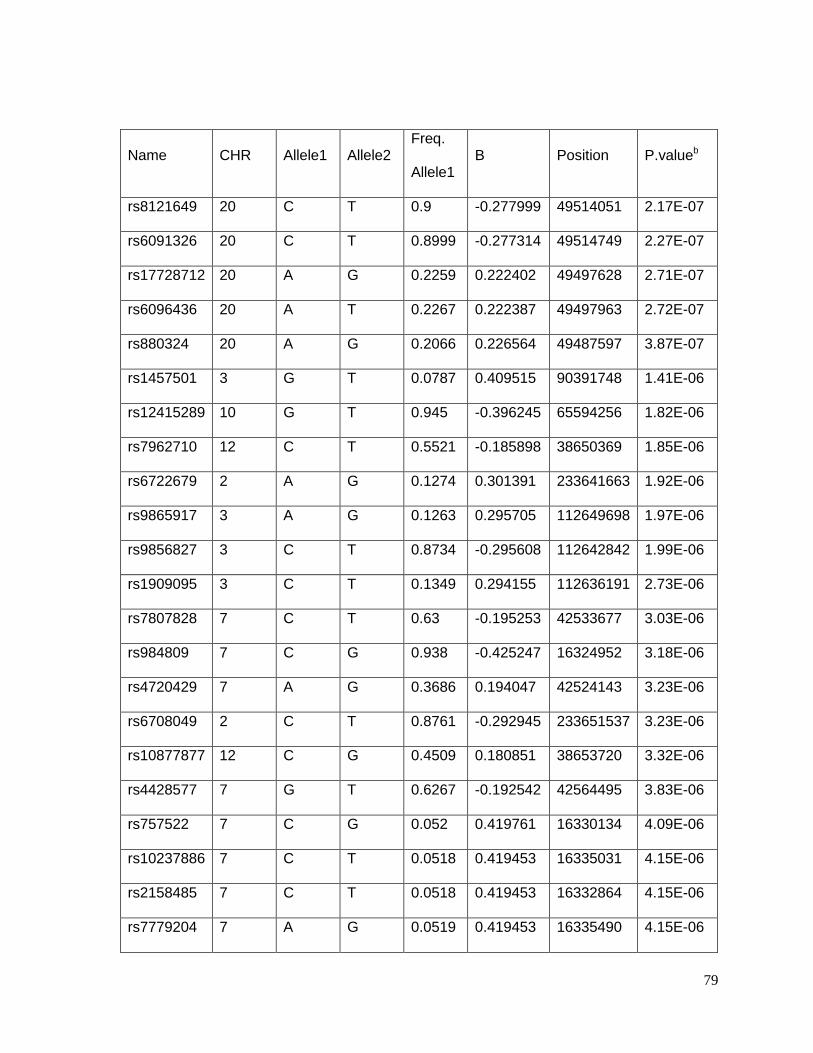
79
Name CHR Allele1 Allele2 Freq.
Allele1 B Position P.valueb
rs8121649 20 C T 0.9 -0.277999 49514051 2.17E-07
rs6091326 20 C T 0.8999 -0.277314 49514749 2.27E-07
rs17728712 20 A G 0.2259 0.222402 49497628 2.71E-07
rs6096436 20 A T 0.2267 0.222387 49497963 2.72E-07
rs880324 20 A G 0.2066 0.226564 49487597 3.87E-07
rs1457501 3 G T 0.0787 0.409515 90391748 1.41E-06
rs12415289 10 G T 0.945 -0.396245 65594256 1.82E-06
rs7962710 12 C T 0.5521 -0.185898 38650369 1.85E-06
rs6722679 2 A G 0.1274 0.301391 233641663 1.92E-06
rs9865917 3 A G 0.1263 0.295705 112649698 1.97E-06
rs9856827 3 C T 0.8734 -0.295608 112642842 1.99E-06
rs1909095 3 C T 0.1349 0.294155 112636191 2.73E-06
rs7807828 7 C T 0.63 -0.195253 42533677 3.03E-06
rs984809 7 C G 0.938 -0.425247 16324952 3.18E-06
rs4720429 7 A G 0.3686 0.194047 42524143 3.23E-06
rs6708049 2 C T 0.8761 -0.292945 233651537 3.23E-06
rs10877877 12 C G 0.4509 0.180851 38653720 3.32E-06
rs4428577 7 G T 0.6267 -0.192542 42564495 3.83E-06
rs757522 7 C G 0.052 0.419761 16330134 4.09E-06
rs10237886 7 C T 0.0518 0.419453 16335031 4.15E-06
rs2158485 7 C T 0.0518 0.419453 16332864 4.15E-06
rs7779204 7 A G 0.0519 0.419453 16335490 4.15E-06
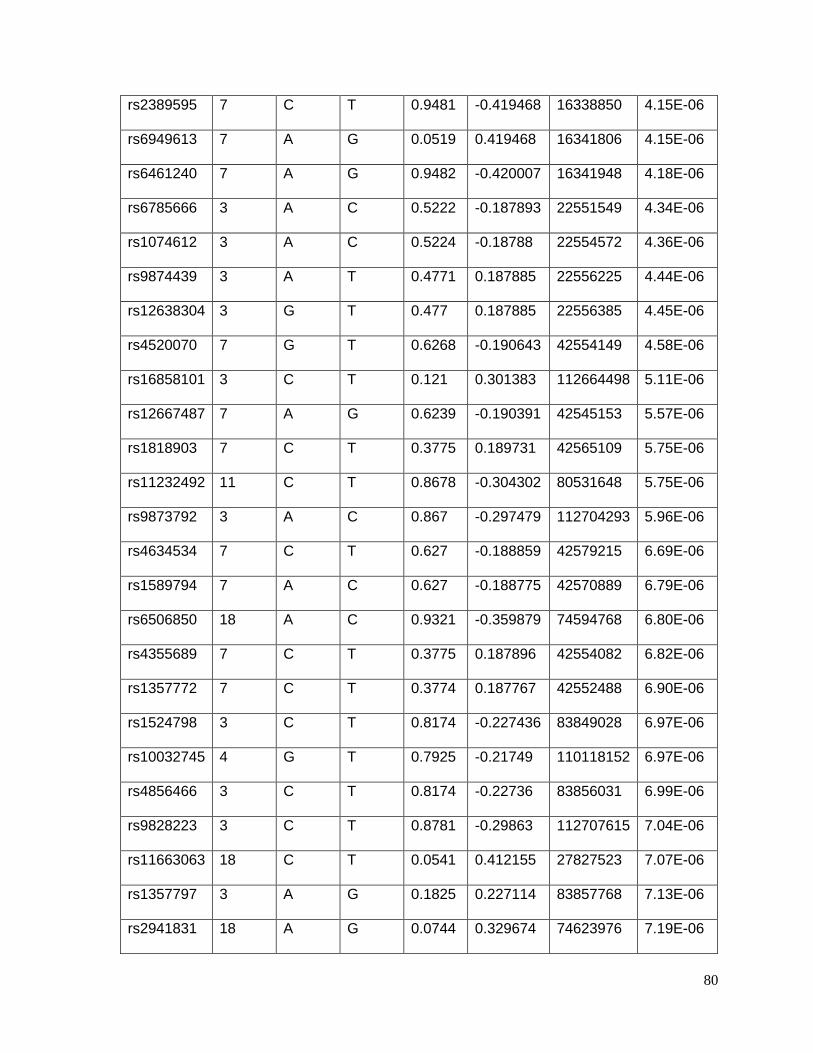
80
rs2389595 7 C T 0.9481 -0.419468 16338850 4.15E-06
rs6949613 7 A G 0.0519 0.419468 16341806 4.15E-06
rs6461240 7 A G 0.9482 -0.420007 16341948 4.18E-06
rs6785666 3 A C 0.5222 -0.187893 22551549 4.34E-06
rs1074612 3 A C 0.5224 -0.18788 22554572 4.36E-06
rs9874439 3 A T 0.4771 0.187885 22556225 4.44E-06
rs12638304 3 G T 0.477 0.187885 22556385 4.45E-06
rs4520070 7 G T 0.6268 -0.190643 42554149 4.58E-06
rs16858101 3 C T 0.121 0.301383 112664498 5.11E-06
rs12667487 7 A G 0.6239 -0.190391 42545153 5.57E-06
rs1818903 7 C T 0.3775 0.189731 42565109 5.75E-06
rs11232492 11 C T 0.8678 -0.304302 80531648 5.75E-06
rs9873792 3 A C 0.867 -0.297479 112704293 5.96E-06
rs4634534 7 C T 0.627 -0.188859 42579215 6.69E-06
rs1589794 7 A C 0.627 -0.188775 42570889 6.79E-06
rs6506850 18 A C 0.9321 -0.359879 74594768 6.80E-06
rs4355689 7 C T 0.3775 0.187896 42554082 6.82E-06
rs1357772 7 C T 0.3774 0.187767 42552488 6.90E-06
rs1524798 3 C T 0.8174 -0.227436 83849028 6.97E-06
rs10032745 4 G T 0.7925 -0.21749 110118152 6.97E-06
rs4856466 3 C T 0.8174 -0.22736 83856031 6.99E-06
rs9828223 3 C T 0.8781 -0.29863 112707615 7.04E-06
rs11663063 18 C T 0.0541 0.412155 27827523 7.07E-06
rs1357797 3 A G 0.1825 0.227114 83857768 7.13E-06
rs2941831 18 A G 0.0744 0.329674 74623976 7.19E-06
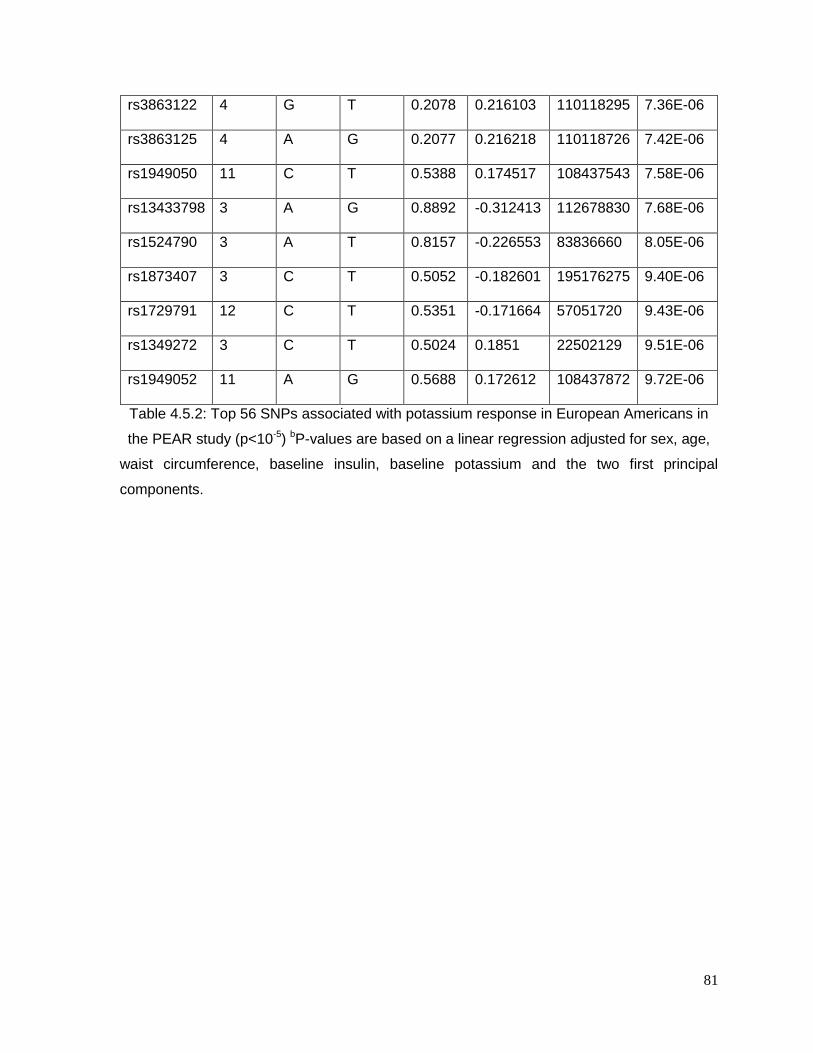
81
rs3863122 4 G T 0.2078 0.216103 110118295 7.36E-06
rs3863125 4 A G 0.2077 0.216218 110118726 7.42E-06
rs1949050 11 C T 0.5388 0.174517 108437543 7.58E-06
rs13433798 3 A G 0.8892 -0.312413 112678830 7.68E-06
rs1524790 3 A T 0.8157 -0.226553 83836660 8.05E-06
rs1873407 3 C T 0.5052 -0.182601 195176275 9.40E-06
rs1729791 12 C T 0.5351 -0.171664 57051720 9.43E-06
rs1349272 3 C T 0.5024 0.1851 22502129 9.51E-06
rs1949052 11 A G 0.5688 0.172612 108437872 9.72E-06
Table 4.5.2: Top 56 SNPs associated with potassium response in European Americans in
the PEAR study (p<10-5) bP-values are based on a linear regression adjusted for sex, age,
waist circumference, baseline insulin, baseline potassium and the two first principal
components.
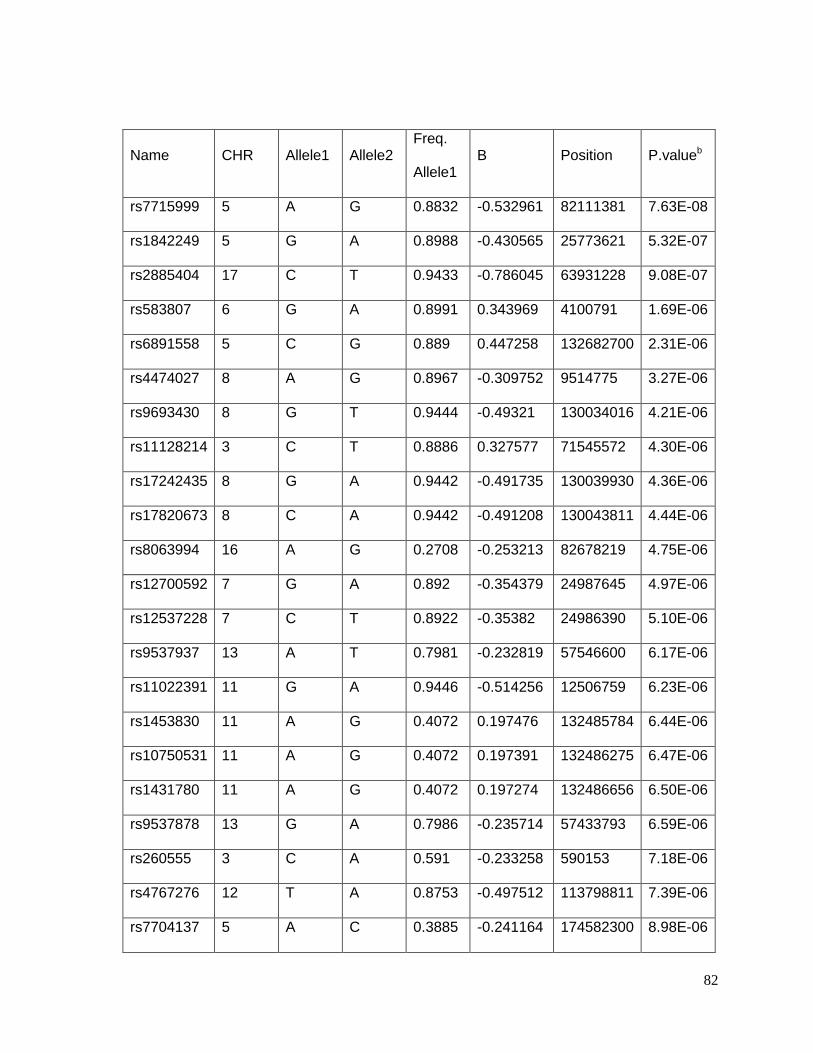
82
Name CHR Allele1 Allele2 Freq.
Allele1 B Position P.valueb
rs7715999 5 A G 0.8832 -0.532961 82111381 7.63E-08
rs1842249 5 G A 0.8988 -0.430565 25773621 5.32E-07
rs2885404 17 C T 0.9433 -0.786045 63931228 9.08E-07
rs583807 6 G A 0.8991 0.343969 4100791 1.69E-06
rs6891558 5 C G 0.889 0.447258 132682700 2.31E-06
rs4474027 8 A G 0.8967 -0.309752 9514775 3.27E-06
rs9693430 8 G T 0.9444 -0.49321 130034016 4.21E-06
rs11128214 3 C T 0.8886 0.327577 71545572 4.30E-06
rs17242435 8 G A 0.9442 -0.491735 130039930 4.36E-06
rs17820673 8 C A 0.9442 -0.491208 130043811 4.44E-06
rs8063994 16 A G 0.2708 -0.253213 82678219 4.75E-06
rs12700592 7 G A 0.892 -0.354379 24987645 4.97E-06
rs12537228 7 C T 0.8922 -0.35382 24986390 5.10E-06
rs9537937 13 A T 0.7981 -0.232819 57546600 6.17E-06
rs11022391 11 G A 0.9446 -0.514256 12506759 6.23E-06
rs1453830 11 A G 0.4072 0.197476 132485784 6.44E-06
rs10750531 11 A G 0.4072 0.197391 132486275 6.47E-06
rs1431780 11 A G 0.4072 0.197274 132486656 6.50E-06
rs9537878 13 G A 0.7986 -0.235714 57433793 6.59E-06
rs260555 3 C A 0.591 -0.233258 590153 7.18E-06
rs4767276 12 T A 0.8753 -0.497512 113798811 7.39E-06
rs7704137 5 A C 0.3885 -0.241164 174582300 8.98E-06
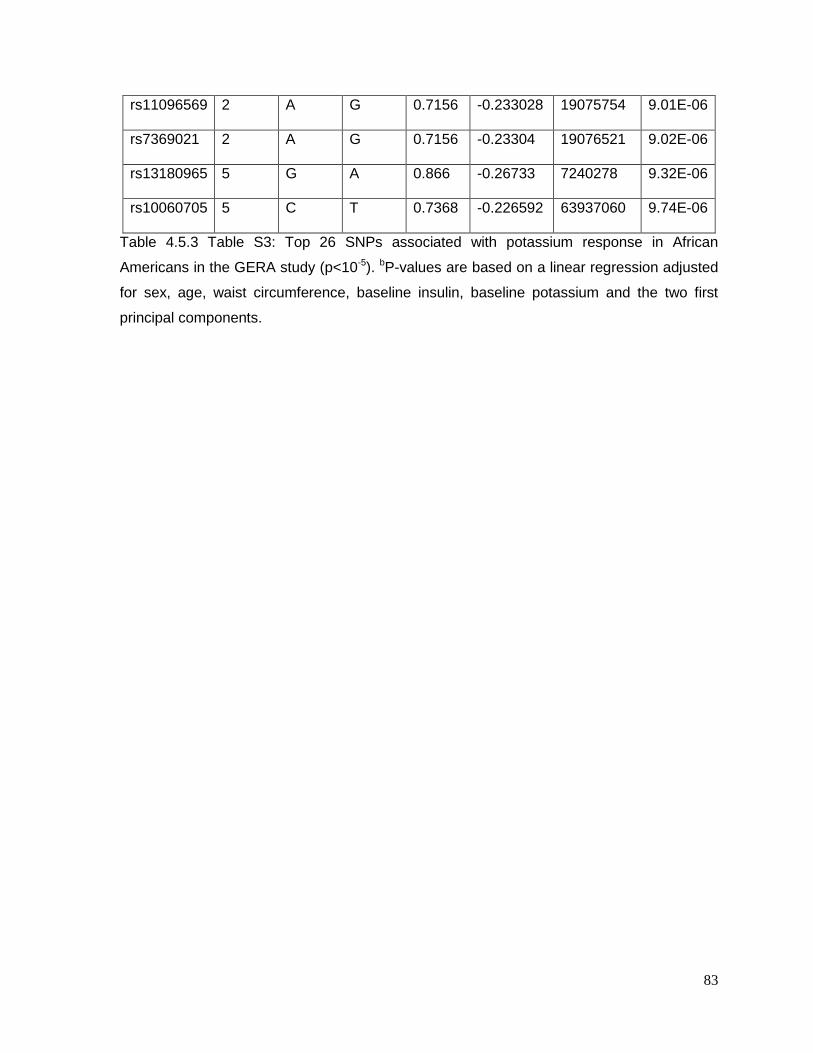
83
rs11096569 2 A G 0.7156 -0.233028 19075754 9.01E-06
rs7369021 2 A G 0.7156 -0.23304 19076521 9.02E-06
rs13180965 5 G A 0.866 -0.26733 7240278 9.32E-06
rs10060705 5 C T 0.7368 -0.226592 63937060 9.74E-06
Table 4.5.3 Table S3: Top 26 SNPs associated with potassium response in African
Americans in the GERA study (p<10-5). bP-values are based on a linear regression adjusted
for sex, age, waist circumference, baseline insulin, baseline potassium and the two first
principal components.
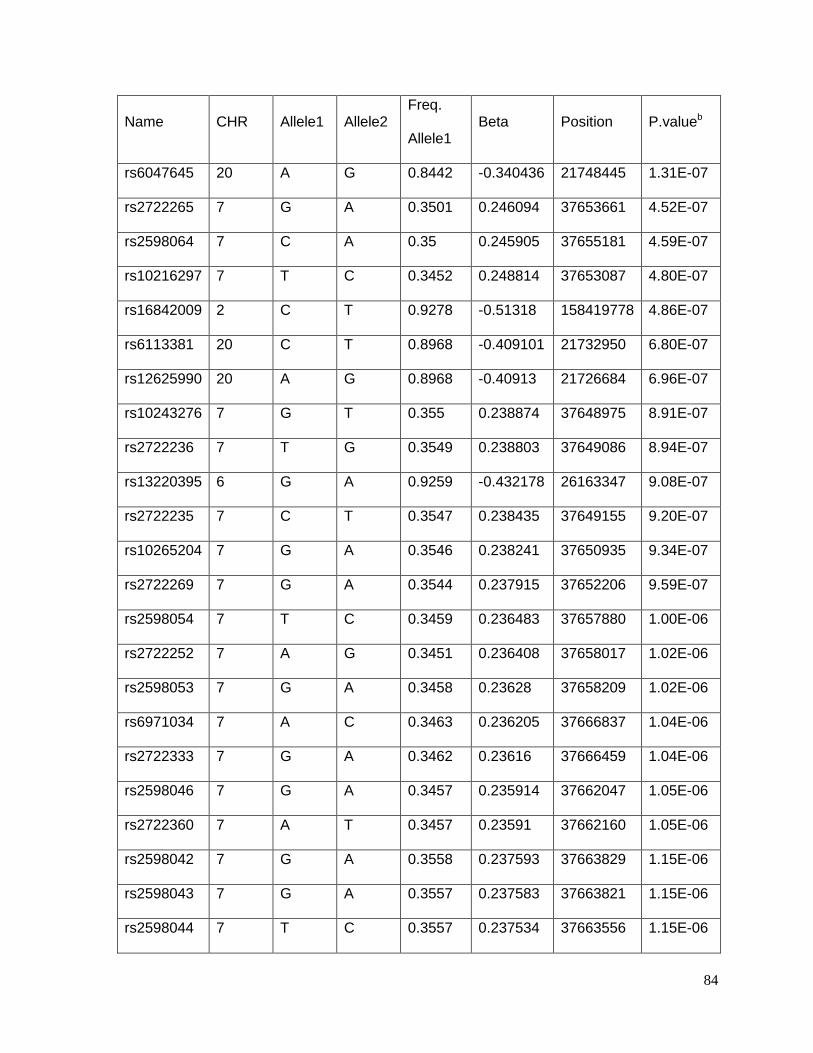
84
Name CHR Allele1 Allele2 Freq.
Allele1 Beta Position P.valueb
rs6047645 20 A G 0.8442 -0.340436 21748445 1.31E-07
rs2722265 7 G A 0.3501 0.246094 37653661 4.52E-07
rs2598064 7 C A 0.35 0.245905 37655181 4.59E-07
rs10216297 7 T C 0.3452 0.248814 37653087 4.80E-07
rs16842009 2 C T 0.9278 -0.51318 158419778 4.86E-07
rs6113381 20 C T 0.8968 -0.409101 21732950 6.80E-07
rs12625990 20 A G 0.8968 -0.40913 21726684 6.96E-07
rs10243276 7 G T 0.355 0.238874 37648975 8.91E-07
rs2722236 7 T G 0.3549 0.238803 37649086 8.94E-07
rs13220395 6 G A 0.9259 -0.432178 26163347 9.08E-07
rs2722235 7 C T 0.3547 0.238435 37649155 9.20E-07
rs10265204 7 G A 0.3546 0.238241 37650935 9.34E-07
rs2722269 7 G A 0.3544 0.237915 37652206 9.59E-07
rs2598054 7 T C 0.3459 0.236483 37657880 1.00E-06
rs2722252 7 A G 0.3451 0.236408 37658017 1.02E-06
rs2598053 7 G A 0.3458 0.23628 37658209 1.02E-06
rs6971034 7 A C 0.3463 0.236205 37666837 1.04E-06
rs2722333 7 G A 0.3462 0.23616 37666459 1.04E-06
rs2598046 7 G A 0.3457 0.235914 37662047 1.05E-06
rs2722360 7 A T 0.3457 0.23591 37662160 1.05E-06
rs2598042 7 G A 0.3558 0.237593 37663829 1.15E-06
rs2598043 7 G A 0.3557 0.237583 37663821 1.15E-06
rs2598044 7 T C 0.3557 0.237534 37663556 1.15E-06
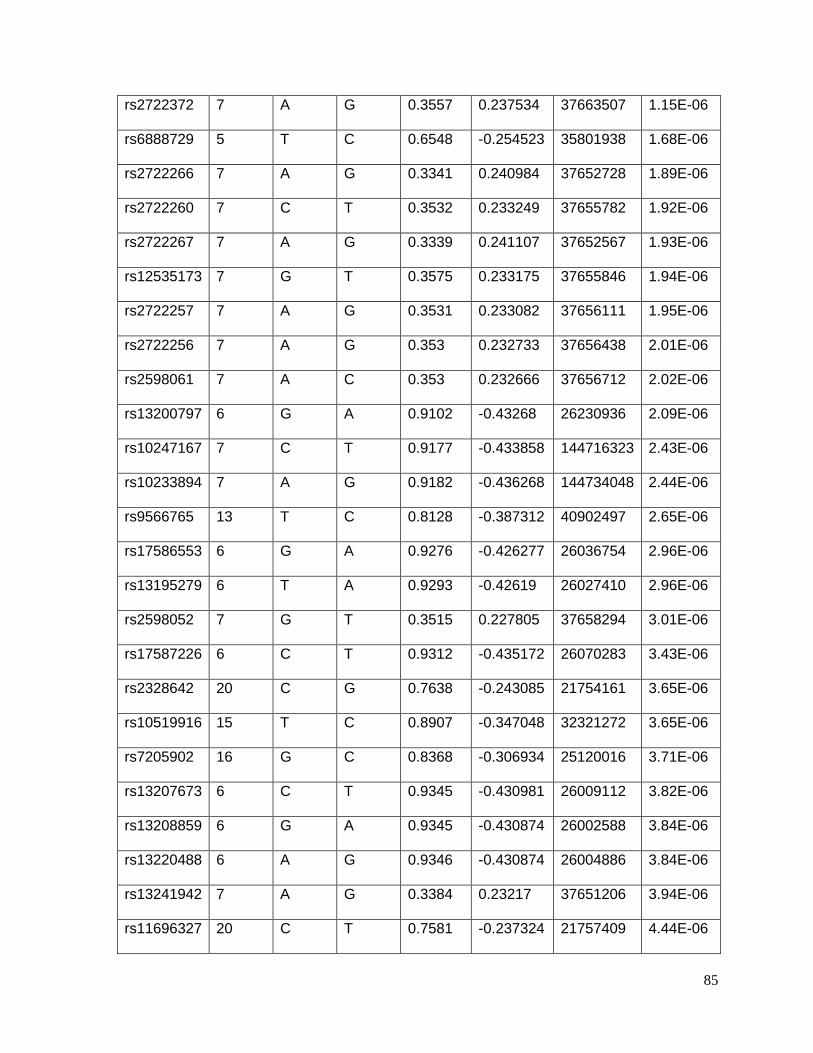
85
rs2722372 7 A G 0.3557 0.237534 37663507 1.15E-06
rs6888729 5 T C 0.6548 -0.254523 35801938 1.68E-06
rs2722266 7 A G 0.3341 0.240984 37652728 1.89E-06
rs2722260 7 C T 0.3532 0.233249 37655782 1.92E-06
rs2722267 7 A G 0.3339 0.241107 37652567 1.93E-06
rs12535173 7 G T 0.3575 0.233175 37655846 1.94E-06
rs2722257 7 A G 0.3531 0.233082 37656111 1.95E-06
rs2722256 7 A G 0.353 0.232733 37656438 2.01E-06
rs2598061 7 A C 0.353 0.232666 37656712 2.02E-06
rs13200797 6 G A 0.9102 -0.43268 26230936 2.09E-06
rs10247167 7 C T 0.9177 -0.433858 144716323 2.43E-06
rs10233894 7 A G 0.9182 -0.436268 144734048 2.44E-06
rs9566765 13 T C 0.8128 -0.387312 40902497 2.65E-06
rs17586553 6 G A 0.9276 -0.426277 26036754 2.96E-06
rs13195279 6 T A 0.9293 -0.42619 26027410 2.96E-06
rs2598052 7 G T 0.3515 0.227805 37658294 3.01E-06
rs17587226 6 C T 0.9312 -0.435172 26070283 3.43E-06
rs2328642 20 C G 0.7638 -0.243085 21754161 3.65E-06
rs10519916 15 T C 0.8907 -0.347048 32321272 3.65E-06
rs7205902 16 G C 0.8368 -0.306934 25120016 3.71E-06
rs13207673 6 C T 0.9345 -0.430981 26009112 3.82E-06
rs13208859 6 G A 0.9345 -0.430874 26002588 3.84E-06
rs13220488 6 A G 0.9346 -0.430874 26004886 3.84E-06
rs13241942 7 A G 0.3384 0.23217 37651206 3.94E-06
rs11696327 20 C T 0.7581 -0.237324 21757409 4.44E-06
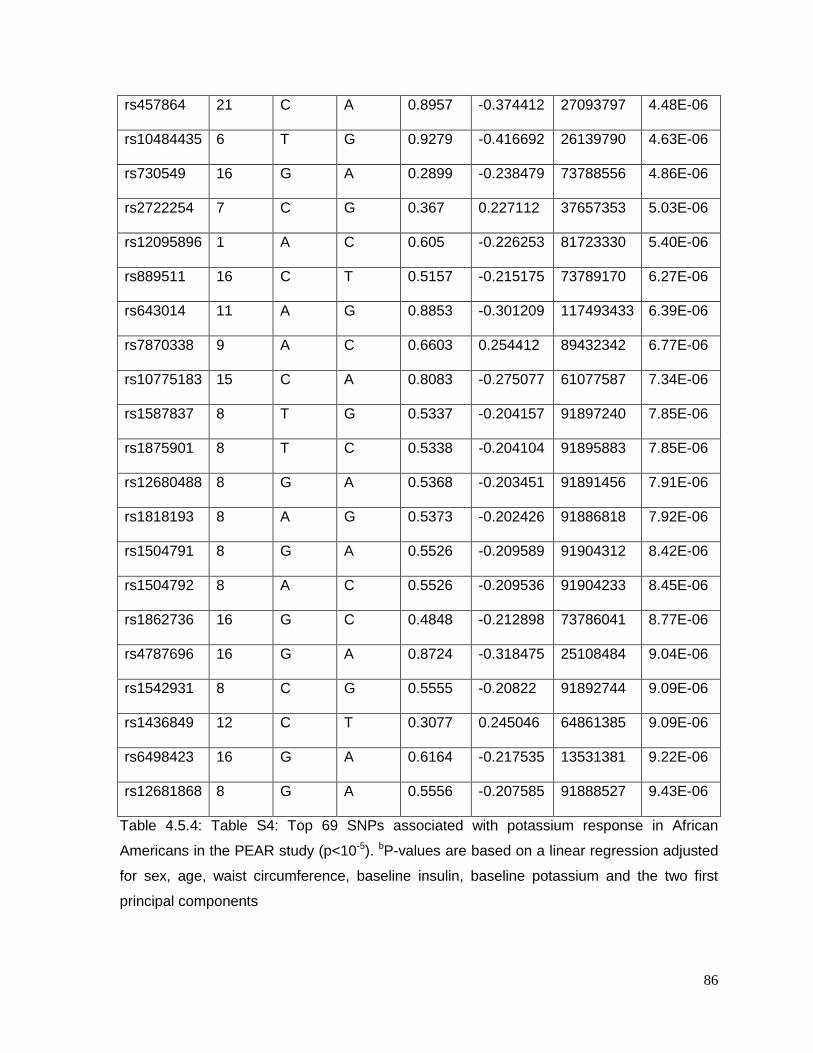
86
rs457864 21 C A 0.8957 -0.374412 27093797 4.48E-06
rs10484435 6 T G 0.9279 -0.416692 26139790 4.63E-06
rs730549 16 G A 0.2899 -0.238479 73788556 4.86E-06
rs2722254 7 C G 0.367 0.227112 37657353 5.03E-06
rs12095896 1 A C 0.605 -0.226253 81723330 5.40E-06
rs889511 16 C T 0.5157 -0.215175 73789170 6.27E-06
rs643014 11 A G 0.8853 -0.301209 117493433 6.39E-06
rs7870338 9 A C 0.6603 0.254412 89432342 6.77E-06
rs10775183 15 C A 0.8083 -0.275077 61077587 7.34E-06
rs1587837 8 T G 0.5337 -0.204157 91897240 7.85E-06
rs1875901 8 T C 0.5338 -0.204104 91895883 7.85E-06
rs12680488 8 G A 0.5368 -0.203451 91891456 7.91E-06
rs1818193 8 A G 0.5373 -0.202426 91886818 7.92E-06
rs1504791 8 G A 0.5526 -0.209589 91904312 8.42E-06
rs1504792 8 A C 0.5526 -0.209536 91904233 8.45E-06
rs1862736 16 G C 0.4848 -0.212898 73786041 8.77E-06
rs4787696 16 G A 0.8724 -0.318475 25108484 9.04E-06
rs1542931 8 C G 0.5555 -0.20822 91892744 9.09E-06
rs1436849 12 C T 0.3077 0.245046 64861385 9.09E-06
rs6498423 16 G A 0.6164 -0.217535 13531381 9.22E-06
rs12681868 8 G A 0.5556 -0.207585 91888527 9.43E-06
Table 4.5.4: Table S4: Top 69 SNPs associated with potassium response in African
Americans in the PEAR study (p<10-5). bP-values are based on a linear regression adjusted
for sex, age, waist circumference, baseline insulin, baseline potassium and the two first
principal components

87
Figure 4.5.1: Manhattan and QQ plots of GWAS results for potassium responses to HCTZ in European Americans in the GERA
Study.
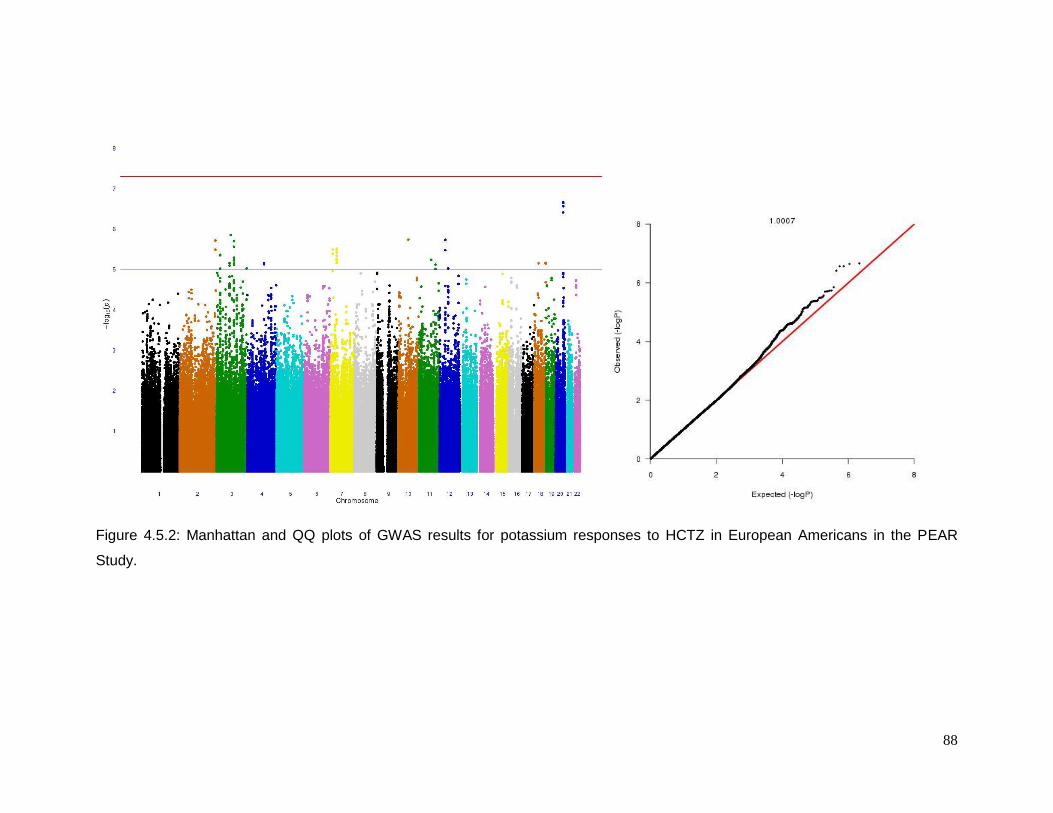
88
Figure 4.5.2: Manhattan and QQ plots of GWAS results for potassium responses to HCTZ in European Americans in the PEAR
Study.
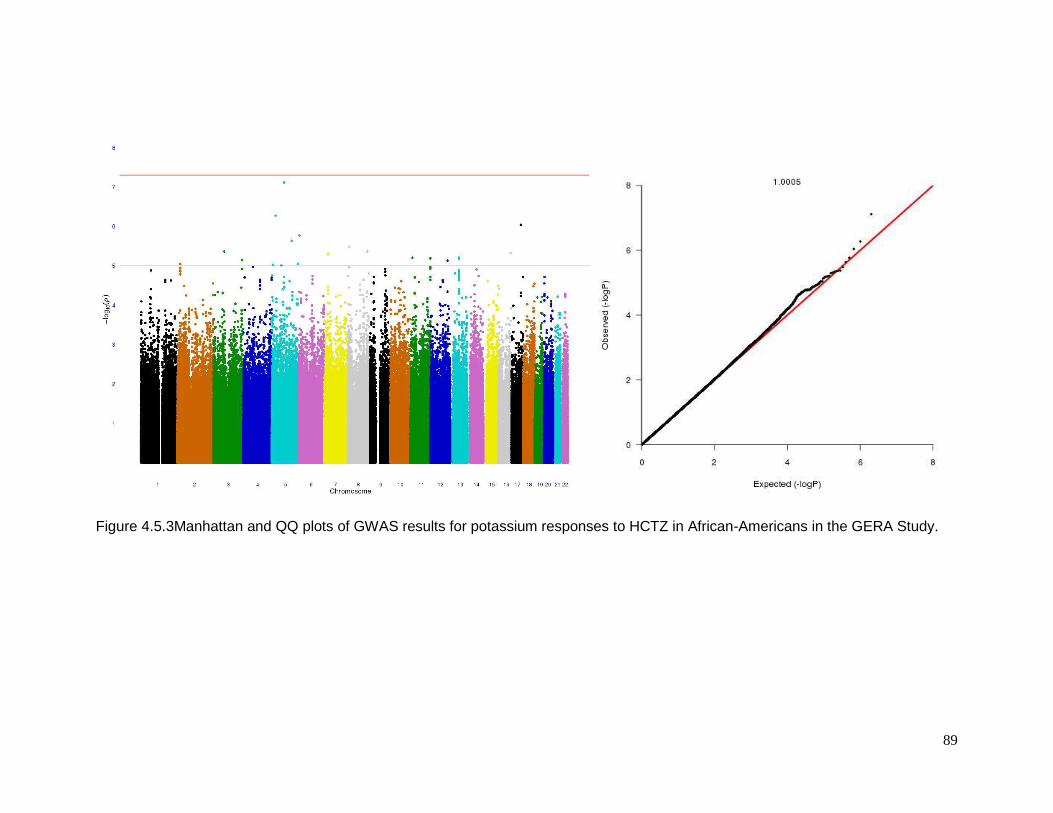
89
Figure 4.5.3Manhattan and QQ plots of GWAS results for potassium responses to HCTZ in African-Americans in the GERA Study.
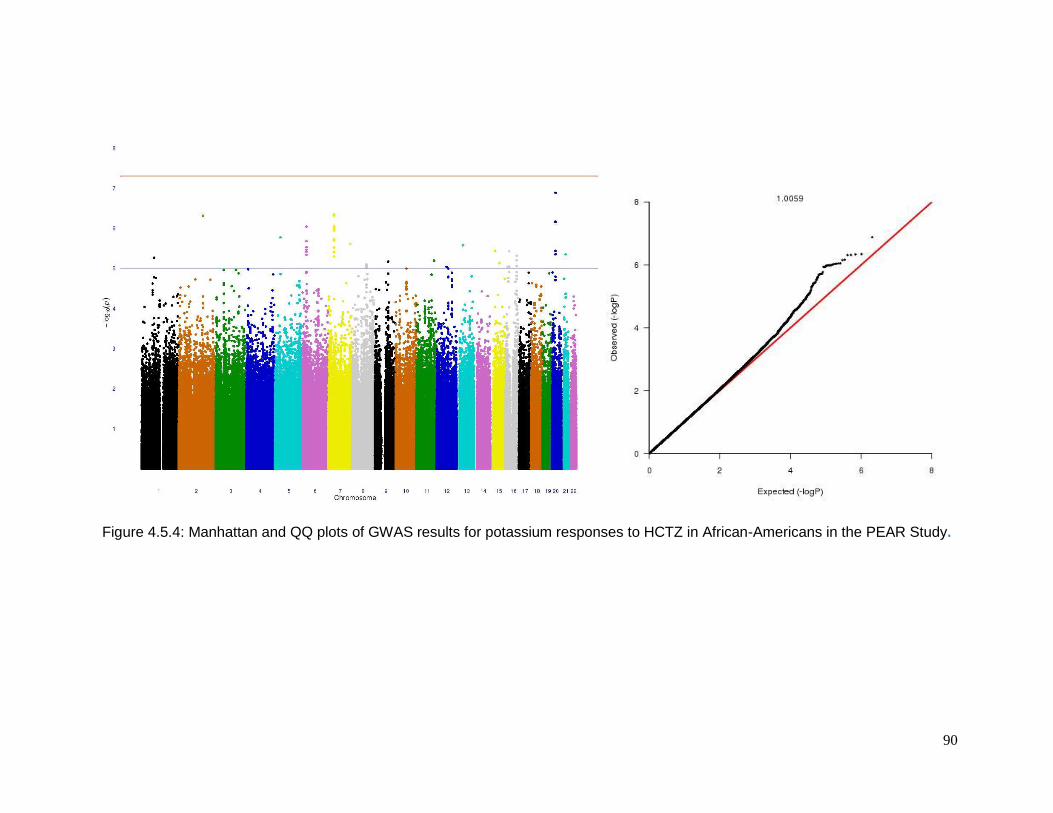
90
Figure 4.5.4: Manhattan and QQ plots of GWAS results for potassium responses to HCTZ in African-Americans in the PEAR Study.

91
CHAPTER 5: SYNTESIS AND FUTURE DIRECTIONS

92
5.1 SYNTHESIS
Pharmacogenomics is a promising component of the broader field of personalized
medicine. The concept behind it is to use genomic information to prescribe the right drug for
each person in order to increase efficacy and decrease side effects. This dissertation
focused on identifying and quantifying genetic factors that contribute to hydrochlorothiazide
adverse metabolic effects among European and African Americans. This final chapter
provides a brief synthesis of information across the previous chapters and an indication of
future directions of the field.
Chapter 2 showed the results of a GWAS performed to evaluate the association
between each SNP and change in glucose and triglycerides due to HCTZ treatment. Only
an intronic SNP at the NELL1 gene showed association between the change in triglycerides
and HCTZ treatment in African Americans. This gene is related to adipocyte differentiation
which led me to hypothesize that HCTZ could be modulating adipocyte biology through
NELL1 leading to an accumulation of plasma triglycerides in susceptible patients. It is worth
to mention that by the time that this dissertation was completed, a new GWAS paper was
published by Rudkowska151 in which NELL1 came up as a top hit in the association
between triglyceride response to n-3 PUFA supplementation. No significant association was
found in the case of change in glucose and HCTZ treatment.
The studies from the previous chapter were carried out in an interventional setting, but it
is possible to test pharmacogenetic hypotheses in an observational setting. Chapter 3 used
a longitudinal analysis approach in the CHARGE consortium to test hypotheses about the
genetic predictors of the change in fasting glucose levels after taking a diuretic over time.
This analysis consisted of 7,038 individuals from 14 cohort studies. No significant
interaction was found between diuretic usage and any SNP with the change in glucose
levels. This negative result suggested that the rare variant approach could have the answer
instead of the common variant approach for my question.
It has been hypothesized that the mechanism by which HCTZ leads to hyperglycemia
involves increased potassium excretion and hypokalemia leading to defects in insulin
secretion (Duarte et. al. 2010 Expert Rev CardiovascTher; 8, 793-802), but the
mechanisms underlying this phenomenon are not well-understood. Chapter 4 dealt with this
hypothesis. To increase the power of the analysis, I ran a trans-ethnic meta-analysis which
clusters populations by the mean allele frequency difference. If populations are in the same
cluster, we will assume that they have the same underlying allelic effects and a fixed effect
model is performed. On the other hand, if populations are in different clusters, the
93
assumption will be that they do not have the same underlying allelic effect and a random
effect analysis is performed. In this analysis, I was able to find an interesting relationship
between the Heme pathway and change in potassium. Heme has been identified as a
modulator of the large-conductance Ca2+-activated K+ channels (BK, or maxi K channels)
(Tang et. al. 2003 Nature; 425, 531-5). These channels are located in the medullary and,
the cortical thick ascending limbs and the distal convoluted tubule in the kidney and they
secrete potassium (Pluznick et. al. 2006; Am. J Physiol. Renal Physiol. 291, F517-F529).
However, they have not previously been considered important contributors to renal
potassium secretion because of their low open probabilities (Po). I hypothesize that HCTZ
affects serum K in part by increasing Heme.
This dissertation research showed some interesting results, but the question about the
genetic predictors of the change in glucose levels and the onset of diabetes levels following
diuretic usage remains elusive. One explanation is that the primary genetic predictors are
the result of rare variants with large effects. These rare variants would not have been
detected by the GWAS methods used here. Sequencing is becoming the norm in modern
human genetics152, and it will likely move in that direction for pharmacogenetics. The field is
moving from a common variant/common disease hypothesis or model to a rare
variant/common disease hypothesis or model. However, this does not mean that AME is a
simply inherited phenotype or Mendelian condition. Rather, this new hypothesis states that
multiple rare variants influence the trait of interest. Over the population, these variants can
reside in a single gene or multiple genes that have cumulative effects. Likewise, they may
reside in multiple genes in the sample pathway. Pharmacogenetic researchers can use
either whole-exome sequencing (WES) or whole-genome sequencing (WGS) to find
association with drug response traits. Such large scale sequencing efforts have already
begun in the CHARGE consortium.
5.2 THOUGHT AND FUTURE DIRECTIONS
Many polymorphisms associated with pharmacodynamics and pharmacokinetics have
been identified for drugs such as antithrombotic agents, B-adrenergic receptor blockers,
statins, and angiotensin-converting enzyme inhibitors and diuretics however most of these
results do not replicate in other studies or are inconsistent. Therefore, the impact of this
information in clinical outcomes as well as in clinical practice is still on hold

94
A possible reason for this inconsistent is the study design; some of them tend to be bias
or more likely confounding problems. I agree with Kurland et al153 that the ideal
pharmacogenomic study should be prospective, use one drug at the time, include naïve
hypertensive individuals and include a placebo arm. But, I know that followed these
conditions are logistically difficult, costly and unethical (placebo-treatment).
Another problem is the definition of the phenotype across different studies. For
instance, the use of clinical or ambulatory blood pressure measurements as outcome must
be the same in all the different studies that are used for comparison.
Sample size, which leads to problems with insufficient statistical power, is another
difficulty that we face in these pharmacogenomic studies and can produce spurious results.
As biologists, I tend to like a simple explanation for any disease or pathway, this
oversimplification in thoughts tend to create hypotheses that exclude biological and
environmental interaction, which gives us partial information of how diseases and its
response to treatment really behave.
Important variables, sometimes over-looked during the comparison of
pharmacogenomic antihypertensive studies, are not only drug dose but drugs within the
same class (hydrochlorothiazide vs chlorthalidone or atenolol vs metoprolol) that may have
different pharmacologic properties which lead to inconsistent results.
The formation of a new consortium known as International Consortium for
Antihypertensive Pharmacogenomics Studies (ICAPS) promises to faced most of the
problems describe in previous paragraphs in order to provide real genetic information that
can be used for clinical practice. The consortium is formed by different cohorts in different
continents. America is represented by Minesota-GERA and Florida-PEAR, Europe by Italy-
PHSS, MILAN, Scotalnd-NORDIL and Finland-GENRES and Asia by China-FEVER_PGx.
And although, most of the cohorts are based on European descends, other ethnicities are
part of it. These cohorts are based on interventional studies, most of them used one drug,
but if different drugs are used they were at different arms of the study or after some wash
out period. I am hoping that these cohorts will increase our sample size and power to detect
common and rare variants responsible for AMEs.
95
REFERENCES
(1) Guyton A. Human physiology and machanisms of disease. Saunders; 1982.
(2) Chobanian AV, Bakris GL, Black HR, Cushman WC, Green LA, Izzo JL, Jr., Jones
DW, Materson BJ, Oparil S, Wright JT, Jr., Roccella EJ. The Seventh Report of the
Joint National Committee on Prevention, Detection, Evaluation, and Treatment of
High Blood Pressure: the JNC 7 report. JAMA 2003 May 21;289(19):2560-72.
(3) Whelton PK. Epidemiology of hypertension. Lancet 1994 July 9;344(8915):101-6.
(4) Ward R. Familial Aggregation and Genetic Epidemiology of Blood Pressure. Raven
Press Ltd; 1995.
(5) Shaper AG. Cardiovascular disease in the tropics. 3. Blood pressure and
hypertension. Br Med J 1972 September 30;3(5830):805-7.
(6) Burt VL, Whelton P, Roccella EJ, Brown C, Cutler JA, Higgins M, Horan MJ,
Labarthe D. Prevalence of hypertension in the US adult population. Results from the
Third National Health and Nutrition Examination Survey, 1988-1991. Hypertension
1995 March;25(3):305-13.
(7) Kemper HC, Snel J, Verschuur R, Storm-van EL. Tracking of health and risk
indicators of cardiovascular diseases from teenager to adult: Amsterdam Growth
and Health Study. Prev Med 1990 November;19(6):642-55.
(8) Leumann EP, Bodmer HG, Isenschmid H, Vetter W, Epstein FH. Physiologic
increase and tracking of blood pressure in schoolchildren. Clin Exp Hypertens A
1986;8(4-5):557-62.
(9) Rowland M, Roberts J. Blood pressure levels and hypertension in persons ages 6-
74 years: United States, 1976-80. Adv Data 1982 October 8;(84):1-11.
(10) Kannel WB, Garrison RJ, Dannenberg AL. Secular blood pressure trends in
normotensive persons: the Framingham Study. Am Heart J 1993 April;125(4):1154-
8.

96
(11) Hofman A, Hazebroek A, Valkenburg HA. A randomized trial of sodium intake and
blood pressure in newborn infants. JAMA 1983 July 15;250(3):370-3.
(12) Effects of weight loss and sodium reduction intervention on blood pressure and
hypertension incidence in overweight people with high-normal blood pressure. The
Trials of Hypertension Prevention, phase II. The Trials of Hypertension Prevention
Collaborative Research Group. Arch Intern Med 1997 March 24;157(6):657-67.
(13) Stamler J, Rose G, Stamler R, Elliott P, Dyer A, Marmot M. INTERSALT study
findings. Public health and medical care implications. Hypertension 1989
November;14(5):570-7.
(14) Annest JL, Sing CF, Biron P, Mongeau JG. Familial aggregation of blood pressure
and weight in adoptive families. II. Estimation of the relative contributions of genetic
and common environmental factors to blood pressure correlations between family
members. Am J Epidemiol 1979 October;110(4):492-503.
(15) Annest JL, Sing CF, Biron P, Mongeau JG. Familial aggregation of blood pressure
and weight in adoptive families. I. Comparisons of blood pressure and weight
statistics among families with adopted, natural, or both natural and adopted children.
Am J Epidemiol 1979 October;110(4):479-91.
(16) Lynch M, Walsh B. Genetics and Analysis of Quantitative Traits. 1 ed. Sinauer
Associates; 1980.
(17) Oparil S, Zaman MA, Calhoun DA. Pathogenesis of hypertension. Ann Intern Med
2003 November 4;139(9):761-76.
(18) Insull W, Jr. The pathology of atherosclerosis: plaque development and plaque
responses to medical treatment. Am J Med 2009 January;122(1 Suppl):S3-S14.
(19) DellaCroce JT, Vitale AT. Hypertension and the eye. Curr Opin Ophthalmol 2008
November;19(6):493-8.
(20) Stamler J, Stamler R, Neaton JD. Blood pressure, systolic and diastolic, and
cardiovascular risks. US population data. Arch Intern Med 1993 March
8;153(5):598-615.
97
(21) Wang JG, Staessen JA, Franklin SS, Fagard R, Gueyffier F. Systolic and diastolic
blood pressure lowering as determinants of cardiovascular outcome. Hypertension
2005 May;45(5):907-13.
(22) Lewington S, Clarke R, Qizilbash N, Peto R, Collins R. Age-specific relevance of
usual blood pressure to vascular mortality: a meta-analysis of individual data for one
million adults in 61 prospective studies. Lancet 2002 December 14;360(9349):1903-
13.
(23) Vasan RS, Larson MG, Leip EP, Evans JC, O'Donnell CJ, Kannel WB, Levy D.
Impact of high-normal blood pressure on the risk of cardiovascular disease. N Engl
J Med 2001 November 1;345(18):1291-7.
(24) Klein RJ, Schoenborn CA. Age adjustment using the 2000 projected U.S.
population. Healthy People 2010 Stat Notes 2001 January;(20):1-10.
(25) Ostchega Y, Yoon SS, Hughes J, Louis T. Hypertension awareness, treatment, and
control--continued disparities in adults: United States, 2005-2006. NCHS Data Brief
2008 January;(3):1-8.
(26) Hansson L, Zanchetti A, Carruthers SG, Dahlof B, Elmfeldt D, Julius S, Menard J,
Rahn KH, Wedel H, Westerling S. Effects of intensive blood-pressure lowering and
low-dose aspirin in patients with hypertension: principal results of the Hypertension
Optimal Treatment (HOT) randomised trial. HOT Study Group. Lancet 1998 June
13;351(9118):1755-62.
(27) rauz-Pacheco C, Parrott MA, Raskin P. Treatment of hypertension in adults with
diabetes. Diabetes Care 2003 January;26 Suppl 1:S80-S82.
(28) He J, Whelton PK, Appel LJ, Charleston J, Klag MJ. Long-term effects of weight
loss and dietary sodium reduction on incidence of hypertension. Hypertension 2000
February;35(2):544-9.
(29) Sacks FM, Svetkey LP, Vollmer WM, Appel LJ, Bray GA, Harsha D, Obarzanek E,
Conlin PR, Miller ER, III, Simons-Morton DG, Karanja N, Lin PH. Effects on blood
pressure of reduced dietary sodium and the Dietary Approaches to Stop
98
Hypertension (DASH) diet. DASH-Sodium Collaborative Research Group. N Engl J
Med 2001 January 4;344(1):3-10.
(30) Whelton SP, Chin A, Xin X, He J. Effect of aerobic exercise on blood pressure: a
meta-analysis of randomized, controlled trials. Ann Intern Med 2002 April
2;136(7):493-503.
(31) Brugger-Andersen T, Ponitz V, Snapinn S, Dickstein K. Moderate alcohol
consumption is associated with reduced long-term cardiovascular risk in patients
following a complicated acute myocardial infarction. Int J Cardiol 2009 April
3;133(2):229-32.
(32) Freiberg MS, Cabral HJ, Heeren TC, Vasan RS, Curtis ER. Alcohol consumption
and the prevalence of the Metabolic Syndrome in the US.: a cross-sectional analysis
of data from the Third National Health and Nutrition Examination Survey. Diabetes
Care 2004 December;27(12):2954-9.
(33) Black HR, Elliott WJ, Grandits G, Grambsch P, Lucente T, White WB, Neaton JD,
Grimm RH, Jr., Hansson L, Lacourciere Y, Muller J, Sleight P, Weber MA, Williams
G, Wittes J, Zanchetti A, Anders RJ. Principal results of the Controlled Onset
Verapamil Investigation of Cardiovascular End Points (CONVINCE) trial. JAMA
2003 April 23;289(16):2073-82.
(34) Dahlof B, Devereux RB, Kjeldsen SE, Julius S, Beevers G, de FU, Fyhrquist F,
Ibsen H, Kristiansson K, Lederballe-Pedersen O, Lindholm LH, Nieminen MS,
Omvik P, Oparil S, Wedel H. Cardiovascular morbidity and mortality in the Losartan
Intervention For Endpoint reduction in hypertension study (LIFE): a randomised trial
against atenolol. Lancet 2002 March 23;359(9311):995-1003.
(35) Cushman WC, Ford CE, Cutler JA, Margolis KL, Davis BR, Grimm RH, Black HR,
Hamilton BP, Holland J, Nwachuku C, Papademetriou V, Probstfield J, Wright JT,
Jr., Alderman MH, Weiss RJ, Piller L, Bettencourt J, Walsh SM. Success and
predictors of blood pressure control in diverse North American settings: the
antihypertensive and lipid-lowering treatment to prevent heart attack trial (ALLHAT).
J Clin Hypertens (Greenwich ) 2002 November;4(6):393-404.

99
(36) Vallon V, Rieg T, Ahn SY, Wu W, Eraly SA, Nigam SK. Overlapping in vitro and in
vivo specificities of the organic anion transporters OAT1 and OAT3 for loop and
thiazide diuretics. Am J Physiol Renal Physiol 2008 April;294(4):F867-F873.
(37) Beaumont K, Vaughn DA, Fanestil DD. Thiazide diuretic drug receptors in rat
kidney: identification with [3H]metolazone. Proc Natl Acad Sci U S A 1988
April;85(7):2311-4.
(38) Simon DB, Nelson-Williams C, Bia MJ, Ellison D, Karet FE, Molina AM, Vaara I,
Iwata F, Cushner HM, Koolen M, Gainza FJ, Gitleman HJ, Lifton RP. Gitelman's
variant of Bartter's syndrome, inherited hypokalaemic alkalosis, is caused by
mutations in the thiazide-sensitive Na-Cl cotransporter. Nat Genet 1996
January;12(1):24-30.
(39) Mastroianni N, Bettinelli A, Bianchetti M, Colussi G, De FM, Sereni F, Ballabio A,
Casari G. Novel molecular variants of the Na-Cl cotransporter gene are responsible
for Gitelman syndrome. Am J Hum Genet 1996 November;59(5):1019-26.
(40) Jang HR, Lee JW, Oh YK, Na KY, Joo KW, Jeon US, Cheong HI, Kim J, Han JS.
From bench to bedside: diagnosis of Gitelman's syndrome -- defect of sodium-
chloride cotransporter in renal tissue. Kidney Int 2006 August;70(4):813-7.
(41) Effects of treatment on morbidity in hypertension. Results in patients with diastolic
blood pressures averaging 115 through 129 mm Hg. JAMA 1967 December
11;202(11):1028-34.
(42) Randomised trial of a perindopril-based blood-pressure-lowering regimen among
6,105 individuals with previous stroke or transient ischaemic attack. Lancet 2001
September 29;358(9287):1033-41.
(43) Neal B, MacMahon S, Chapman N. Effects of ACE inhibitors, calcium antagonists,
and other blood-pressure-lowering drugs: results of prospectively designed
overviews of randomised trials. Blood Pressure Lowering Treatment Trialists'
Collaboration. Lancet 2000 December 9;356(9246):1955-64.
(44) Psaty BM, Smith NL, Siscovick DS, Koepsell TD, Weiss NS, Heckbert SR, Lemaitre
RN, Wagner EH, Furberg CD. Health outcomes associated with antihypertensive
100
therapies used as first-line agents. A systematic review and meta-analysis. JAMA
1997 March 5;277(9):739-45.
(45) Wing LM, Reid CM, Ryan P, Beilin LJ, Brown MA, Jennings GL, Johnston CI,
McNeil JJ, Macdonald GJ, Marley JE, Morgan TO, West MJ. A comparison of
outcomes with angiotensin-converting--enzyme inhibitors and diuretics for
hypertension in the elderly. N Engl J Med 2003 February 13;348(7):583-92.
(46) Yusuf S, Sleight P, Pogue J, Bosch J, Davies R, Dagenais G. Effects of an
angiotensin-converting-enzyme inhibitor, ramipril, on cardiovascular events in high-
risk patients. The Heart Outcomes Prevention Evaluation Study Investigators. N
Engl J Med 2000 January 20;342(3):145-53.
(47) Reungjui S, Pratipanawatr T, Johnson RJ, Nakagawa T. Do thiazides worsen
metabolic syndrome and renal disease? The pivotal roles for hyperuricemia and
hypokalemia. Curr Opin Nephrol Hypertens 2008 September;17(5):470-6.
(48) Ellison DH, Loffing J. Thiazide effects and adverse effects: insights from molecular
genetics. Hypertension 2009 August;54(2):196-202.
(49) Sica DA. Diuretic-related side effects: development and treatment. J Clin Hypertens
(Greenwich ) 2004 September;6(9):532-40.
(50) Krishnan E, Kwoh CK, Schumacher HR, Kuller L. Hyperuricemia and incidence of
hypertension among men without metabolic syndrome. Hypertension 2007
February;49(2):298-303.
(51) Campion EW, Glynn RJ, DeLabry LO. Asymptomatic hyperuricemia. Risks and
consequences in the Normative Aging Study. Am J Med 1987 March;82(3):421-6.
(52) Uric acid, diuretics and the kidney. West J Med 1978 November;129(5):407-11.
(53) Liamis G, Milionis H, Elisaf M. A review of drug-induced hyponatremia. Am J Kidney
Dis 2008 July;52(1):144-53.
(54) Chow KM, Szeto CC, Wong TY, Leung CB, Li PK. Risk factors for thiazide-induced
hyponatraemia. QJM 2003 December;96(12):911-7.
101
(55) Szatalowicz VL, Miller PD, Lacher JW, Gordon JA, Schrier RW. Comparative effect
of diuretics on renal water excretion in hyponatraemic oedematous disorders. Clin
Sci (Lond) 1982 February;62(2):235-8.
(56) Zillich AJ, Garg J, Basu S, Bakris GL, Carter BL. Thiazide diuretics, potassium, and
the development of diabetes: a quantitative review. Hypertension 2006
August;48(2):219-24.
(57) Rose BD. Diuretics. Kidney Int 1991 February;39(2):336-52.
(58) Velazquez H, Wright FS. Control by drugs of renal potassium handling. Annu Rev
Pharmacol Toxicol 1986;26:293-309.
(59) Lakshman MR, Reda DJ, Materson BJ, Cushman WC, Freis ED. Diuretics and beta-
blockers do not have adverse effects at 1 year on plasma lipid and lipoprotein
profiles in men with hypertension. Department of Veterans Affairs Cooperative
Study Group on Antihypertensive Agents. Arch Intern Med 1999 March
22;159(6):551-8.
(60) Mantel-Teeuwisse AK, Kloosterman JM, Maitland-van der Zee AH, Klungel OH,
Porsius AJ, de BA. Drug-Induced lipid changes: a review of the unintended effects
of some commonly used drugs on serum lipid levels. Drug Saf 2001;24(6):443-56.
(61) Pepine CJ, Cooper-Dehoff RM. Cardiovascular therapies and risk for development
of diabetes. J Am Coll Cardiol 2004 August 4;44(3):509-12.
(62) Verdecchia P, Reboldi G, Angeli F, Borgioni C, Gattobigio R, Filippucci L, Norgiolini
S, Bracco C, Porcellati C. Adverse prognostic significance of new diabetes in
treated hypertensive subjects. Hypertension 2004 May;43(5):963-9.
(63) Houston MC. The effects of antihypertensive drugs on glucose intolerance in
hypertensive nondiabetics and diabetics. Am Heart J 1988 March;115(3):640-56.
(64) Reungjui S, Hu H, Mu W, Roncal CA, Croker BP, Patel JM, Nakagawa T, Srinivas T,
Byer K, Simoni J, Wesson D, Sitprija V, Johnson RJ. Thiazide-induced subtle renal
injury not observed in states of equivalent hypokalemia. Kidney Int 2007
December;72(12):1483-92.
102
(65) Loffing J, Loffing-Cueni D, Hegyi I, Kaplan MR, Hebert SC, Le HM, Kaissling B.
Thiazide treatment of rats provokes apoptosis in distal tubule cells. Kidney Int 1996
October;50(4):1180-90.
(66) Johnson JA. Pharmacogenetics: potential for individualized drug therapy through
genetics. Trends Genet 2003 November;19(11):660-6.
(67) Giebish G, Windhager E. Transport of Potassium. In: Boron WF, Boulpaep EL, eds.
Medical Physiology A Cellular and Molecular Approach. 2nd ed. 2009. p. 821-33.
(68) Kokot F, Hyla-Klekot L. Drug-induced abnormalities of potassium metabolism. Pol
Arch Med Wewn 2008 July;118(7-8):431-4.
(69) Anderson J, Young L, Long E. Potassium and Health. 8 A.D. Aug 8.
(70) Haddy FJ, Vanhoutte PM, Feletou M. Role of potassium in regulating blood flow and
blood pressure. Am J Physiol Regul Integr Comp Physiol 2006 March;290(3):R546-
R552.
(71) Grgic I, Kaistha BP, Hoyer J, Kohler R. Endothelial Ca+-activated K+ channels in
normal and impaired EDHF-dilator responses--relevance to cardiovascular
pathologies and drug discovery. Br J Pharmacol 2009 June;157(4):509-26.
(72) Wang WH, Giebisch G. Regulation of potassium (K) handling in the renal collecting
duct. Pflugers Arch 2009 May;458(1):157-68.
(73) Evans WE, Johnson JA. Pharmacogenomics: the inherited basis for interindividual
differences in drug response. Annu Rev Genomics Hum Genet 2001;2:9-39.
(74) Weber W. Pharmacogenetics. 1 ed. Oxford University Press; 1997.
(75) Marsh S, McLeod HL. Pharmacogenomics: from bedside to clinical practice. Hum
Mol Genet 2006 April 15;15 Spec No 1:R89-R93.
(76) Evans WE, McLeod HL. Pharmacogenomics--drug disposition, drug targets, and
side effects. N Engl J Med 2003 February 6;348(6):538-49.
103
(77) Lazarou J, Pomeranz BH, Corey PN. Incidence of adverse drug reactions in
hospitalized patients: a meta-analysis of prospective studies. JAMA 1998 April
15;279(15):1200-5.
(78) Steimer W, Potter JM. Pharmacogenetic screening and therapeutic drugs. Clin Chim
Acta 2002 January;315(1-2):137-55.
(79) Moyer TP, O'Kane DJ, Baudhuin LM, Wiley CL, Fortini A, Fisher PK, Dupras DM,
Chaudhry R, Thapa P, Zinsmeister AR, Heit JA. Warfarin sensitivity genotyping: a
review of the literature and summary of patient experience. Mayo Clin Proc 2009
December;84(12):1079-94.
(80) Pirmohamed M, Burnside G, Eriksson N, Jorgensen AL, Toh CH, Nicholson T,
Kesteven P, Christersson C, Wahlstrom B, Stafberg C, Zhang JE, Leathart JB,
Kohnke H, Maitland-van der Zee AH, Williamson PR, Daly AK, Avery P, Kamali F,
Wadelius M. A randomized trial of genotype-guided dosing of warfarin. N Engl J
Med 2013 December 12;369(24):2294-303.
(81) Kimmel SE, French B, Kasner SE, Johnson JA, Anderson JL, Gage BF, Rosenberg
YD, Eby CS, Madigan RA, McBane RB, bdel-Rahman SZ, Stevens SM, Yale S,
Mohler ER, III, Fang MC, Shah V, Horenstein RB, Limdi NA, Muldowney JA, III,
Gujral J, Delafontaine P, Desnick RJ, Ortel TL, Billett HH, Pendleton RC, Geller NL,
Halperin JL, Goldhaber SZ, Caldwell MD, Califf RM, Ellenberg JH. A
pharmacogenetic versus a clinical algorithm for warfarin dosing. N Engl J Med 2013
December 12;369(24):2283-93.
(82) Turner ST, Schwartz GL, Chapman AB, Boerwinkle E. C825T polymorphism of the
G protein beta(3)-subunit and antihypertensive response to a thiazide diuretic.
Hypertension 2001 February;37(2 Pt 2):739-43.
(83) Schwartz GL, Turner ST, Chapman AB, Boerwinkle E. Interacting effects of gender
and genotype on blood pressure response to hydrochlorothiazide. Kidney Int 2002
November;62(5):1718-23.
(84) Turner ST, Chapman AB, Schwartz GL, Boerwinkle E. Effects of endothelial nitric
oxide synthase, alpha-adducin, and other candidate gene polymorphisms on blood
104
pressure response to hydrochlorothiazide. Am J Hypertens 2003
October;16(10):834-9.
(85) Matayoshi T, Kamide K, Takiuchi S, Yoshii M, Miwa Y, Takami Y, Tanaka C, Banno
M, Horio T, Nakamura S, Nakahama H, Yoshihara F, Inenaga T, Miyata T, Kawano
Y. The thiazide-sensitive Na(+)-Cl(-) cotransporter gene, C1784T, and adrenergic
receptor-beta3 gene, T727C, may be gene polymorphisms susceptible to the
antihypertensive effect of thiazide diuretics. Hypertens Res 2004
November;27(11):821-33.
(86) Turner ST, Schwartz GL, Chapman AB, Boerwinkle E. WNK1 kinase polymorphism
and blood pressure response to a thiazide diuretic. Hypertension 2005
October;46(4):758-65.
(87) Luo F, Wang Y, Wang X, Sun K, Zhou X, Hui R. A functional variant of NEDD4L is
associated with hypertension, antihypertensive response, and orthostatic
hypotension. Hypertension 2009 October;54(4):796-801.
(88) Turner ST, Bailey KR, Fridley BL, Chapman AB, Schwartz GL, Chai HS, Sicotte H,
Kocher JP, Rodin AS, Boerwinkle E. Genomic association analysis suggests
chromosome 12 locus influencing antihypertensive response to thiazide diuretic.
Hypertension 2008 August;52(2):359-65.
(89) Duarte JD, Turner ST, Tran B, Chapman AB, Bailey KR, Gong Y, Gums JG,
Langaee TY, Beitelshees AL, Cooper-Dehoff RM, Boerwinkle E, Johnson JA.
Association of chromosome 12 locus with antihypertensive response to
hydrochlorothiazide may involve differential YEATS4 expression.
Pharmacogenomics J 2013 June;13(3):257-63.
(90) Ernst ME, Lund BC. Renewed interest in chlorthalidone: evidence from the Veterans
Health Administration. J Clin Hypertens (Greenwich ) 2010 December;12(12):927-
34.
(91) Kaplan NM. Clinical Hypertension. seventh edition ed. Willians & Wilkins; 1998.
(92) Perez-Stable E, Caralis PV. Thiazide-induced disturbances in carbohydrate, lipid,
and potassium metabolism. Am Heart J 1983 July;106(1 Pt 2):245-51.
105
(93) Grimm RH, Jr., Leon AS, Hunninghake DB, Lenz K, Hannan P, Blackburn H. Effects
of thiazide diuretics on plasma lipids and lipoproteins in mildly hypertensive patients:
a double-blind controlled trial. Ann Intern Med 1981 January;94(1):7-11.
(94) Del-Aguila JL, Beitelshees AL, Cooper-Dehoff RM, Chapman AB, Gums JG, Bailey
K, Gong Y, Turner ST, Johnson JA, Boerwinkle E. Genome-wide association
analyses suggest NELL1 influences adverse metabolic response to HCTZ in African
Americans. Pharmacogenomics J 2014 February;14(1):35-40.
(95) Li Y, Willer C, Sanna S, Abecasis G. Genotype imputation. Annu Rev Genomics
Hum Genet 2009;10:387-406.
(96) Zhang X, Kuroda S, Carpenter D, Nishimura I, Soo C, Moats R, Iida K, Wisner E, Hu
FY, Miao S, Beanes S, Dang C, Vastardis H, Longaker M, Tanizawa K, Kanayama
N, Saito N, Ting K. Craniosynostosis in transgenic mice overexpressing Nell-1. J
Clin Invest 2002 September;110(6):861-70.
(97) James AW, Pan A, Chiang M, Zara JN, Zhang X, Ting K, Soo C. A new function of
Nell-1 protein in repressing adipogenic differentiation. Biochem Biophys Res
Commun 2011 July 22;411(1):126-31.
(98) Lewis GF, Carpentier A, Adeli K, Giacca A. Disordered fat storage and mobilization
in the pathogenesis of insulin resistance and type 2 diabetes. Endocr Rev 2002
April;23(2):201-29.
(99) Duarte JD, Cooper-Dehoff RM. Mechanisms for blood pressure lowering and
metabolic effects of thiazide and thiazide-like diuretics. Expert Rev Cardiovasc Ther
2010 June;8(6):793-802.
(100) Eriksson JW, Jansson PA, Carlberg B, Hagg A, Kurland L, Svensson MK, Ahlstrom
H, Strom C, Lonn L, Ojbrandt K, Johansson L, Lind L. Hydrochlorothiazide, but not
Candesartan, aggravates insulin resistance and causes visceral and hepatic fat
accumulation: the mechanisms for the diabetes preventing effect of Candesartan
(MEDICA) Study. Hypertension 2008 December;52(6):1030-7.
(101) Jacobsson JA, Rask-Andersen M, Riserus U, Moschonis G, Koumpitski A,
Chrousos GP, Lannfelt L, Marcus C, Gyllensten U, Schioth HB, Fredriksson R.
106
Genetic variants near the MGAT1 gene are associated with body weight, BMI and
fatty acid metabolism among adults and children. Int J Obes (Lond) 2011 February
8.
(102) Jowett JB, Elliott KS, Curran JE, Hunt N, Walder KR, Collier GR, Zimmet PZ,
Blangero J. Genetic variation in BEACON influences quantitative variation in
metabolic syndrome-related phenotypes. Diabetes 2004 September;53(9):2467-72.
(103) The Atherosclerosis Risk in Communities (ARIC) Study: design and objectives. The
ARIC investigators. Am J Epidemiol 1989 April;129(4):687-702.
(104) Harris TB, Launer LJ, Eiriksdottir G, Kjartansson O, Jonsson PV, Sigurdsson G,
Thorgeirsson G, Aspelund T, Garcia ME, Cotch MF, Hoffman HJ, Gudnason V. Age,
Gene/Environment Susceptibility-Reykjavik Study: multidisciplinary applied
phenomics. Am J Epidemiol 2007 May 1;165(9):1076-87.
(105) Fried LP, Borhani NO, Enright P, Furberg CD, Gardin JM, Kronmal RA, Kuller LH,
Manolio TA, Mittelmark MB, Newman A, . The Cardiovascular Health Study: design
and rationale. Ann Epidemiol 1991 February;1(3):263-76.
(106) Psaty BM, Heckbert SR, Koepsell TD, Siscovick DS, Raghunathan TE, Weiss NS,
Rosendaal FR, Lemaitre RN, Smith NL, Wahl PW, . The risk of myocardial infarction
associated with antihypertensive drug therapies. JAMA 1995 August 23;274(8):620-
5.
(107) DAWBER TR, MEADORS GF, MOORE FE, Jr. Epidemiological approaches to heart
disease: the Framingham Study. Am J Public Health Nations Health 1951
March;41(3):279-81.
(108) Bild DE, Bluemke DA, Burke GL, Detrano R, ez Roux AV, Folsom AR, Greenland P,
Jacob DR, Jr., Kronmal R, Liu K, Nelson JC, O'Leary D, Saad MF, Shea S, Szklo M,
Tracy RP. Multi-ethnic study of atherosclerosis: objectives and design. Am J
Epidemiol 2002 November 1;156(9):871-81.
(109) Hofman A, Grobbee DE, de Jong PT, van den Ouweland FA. Determinants of
disease and disability in the elderly: the Rotterdam Elderly Study. Eur J Epidemiol
1991 July;7(4):403-22.
107
(110) Hofman A, Breteler MM, van Duijn CM, Krestin GP, Pols HA, Stricker BH, Tiemeier
H, Uitterlinden AG, Vingerling JR, Witteman JC. The Rotterdam Study: objectives
and design update. Eur J Epidemiol 2007;22(11):819-29.
(111) Hofman A, Breteler MM, van Duijn CM, Janssen HL, Krestin GP, Kuipers EJ,
Stricker BH, Tiemeier H, Uitterlinden AG, Vingerling JR, Witteman JC. The
Rotterdam Study: 2010 objectives and design update. Eur J Epidemiol
2009;24(9):553-72.
(112) Hofman A, van Duijn CM, Franco OH, Ikram MA, Janssen HL, Klaver CC, Kuipers
EJ, Nijsten TE, Stricker BH, Tiemeier H, Uitterlinden AG, Vernooij MW, Witteman
JC. The Rotterdam Study: 2012 objectives and design update. Eur J Epidemiol
2011 August;26(8):657-86.
(113) Trompet S, de Craen AJ, Postmus I, Ford I, Sattar N, Caslake M, Stott DJ, Buckley
BM, Sacks F, Devlin JJ, Slagboom PE, Westendorp RG, Jukema JW. Replication of
LDL GWAs hits in PROSPER/PHASE as validation for future (pharmaco)genetic
analyses. BMC Med Genet 2011;12:131.
(114) Park SW, Goodpaster BH, Strotmeyer ES, de RN, Harris TB, Schwartz AV,
Tylavsky FA, Newman AB. Decreased muscle strength and quality in older adults
with type 2 diabetes: the health, aging, and body composition study. Diabetes 2006
June;55(6):1813-8.
(115) Coon H, Leppert MF, Eckfeldt JH, Oberman A, Myers RH, Peacock JM, Province
MA, Hopkins PN, Heiss G. Genome-wide linkage analysis of lipids in the
Hypertension Genetic Epidemiology Network (HyperGEN) Blood Pressure Study.
Arterioscler Thromb Vasc Biol 2001 December;21(12):1969-76.
(116) Design of the Women's Health Initiative clinical trial and observational study. The
Women's Health Initiative Study Group. Control Clin Trials 1998 February;19(1):61-
109.
(117) Friedman GD, Cutter GR, Donahue RP, Hughes GH, Hulley SB, Jacobs DR, Jr., Liu
K, Savage PJ. CARDIA: study design, recruitment, and some characteristics of the
examined subjects. J Clin Epidemiol 1988;41(11):1105-16.

108
(118) Hruby A, Ngwa JS, Renstrom F, Wojczynski MK, Ganna A, Hallmans G, Houston
DK, Jacques PF, Kanoni S, Lehtimaki T, Lemaitre RN, Manichaikul A, North KE,
Ntalla I, Sonestedt E, Tanaka T, van Rooij FJ, Bandinelli S, Djousse L, Grigoriou E,
Johansson I, Lohman KK, Pankow JS, Raitakari OT, Riserus U, Yannakoulia M,
Zillikens MC, Hassanali N, Liu Y, Mozaffarian D, Papoutsakis C, Syvanen AC,
Uitterlinden AG, Viikari J, Groves CJ, Hofman A, Lind L, McCarthy MI, Mikkila V,
Mukamal K, Franco OH, Borecki IB, Cupples LA, Dedoussis GV, Ferrucci L, Hu FB,
Ingelsson E, Kahonen M, Kao WH, Kritchevsky SB, Orho-Melander M, Prokopenko
I, Rotter JI, Siscovick DS, Witteman JC, Franks PW, Meigs JB, McKeown NM,
Nettleton JA. Higher magnesium intake is associated with lower fasting glucose and
insulin, with no evidence of interaction with select genetic loci, in a meta-analysis of
15 CHARGE Consortium Studies. J Nutr 2013 March;143(3):345-53.
(119) Nettleton JA, McKeown NM, Kanoni S, Lemaitre RN, Hivert MF, Ngwa J, van Rooij
FJ, Sonestedt E, Wojczynski MK, Ye Z, Tanaka T, Garcia M, Anderson JS, Follis JL,
Djousse L, Mukamal K, Papoutsakis C, Mozaffarian D, Zillikens MC, Bandinelli S,
Bennett AJ, Borecki IB, Feitosa MF, Ferrucci L, Forouhi NG, Groves CJ, Hallmans
G, Harris T, Hofman A, Houston DK, Hu FB, Johansson I, Kritchevsky SB,
Langenberg C, Launer L, Liu Y, Loos RJ, Nalls M, Orho-Melander M, Renstrom F,
Rice K, Riserus U, Rolandsson O, Rotter JI, Saylor G, Sijbrands EJ, Sjogren P,
Smith A, Steingrimsdottir L, Uitterlinden AG, Wareham NJ, Prokopenko I, Pankow
JS, van Duijn CM, Florez JC, Witteman JC, Dupuis J, Dedoussis GV, Ordovas JM,
Ingelsson E, Cupples L, Siscovick DS, Franks PW, Meigs JB. Interactions of dietary
whole-grain intake with fasting glucose- and insulin-related genetic loci in individuals
of European descent: a meta-analysis of 14 cohort studies. Diabetes Care 2010
December;33(12):2684-91.
(120) Servin B, Stephens M. Imputation-based analysis of association studies: candidate
regions and quantitative traits. PLoS Genet 2007 July;3(7):e114.
(121) Li Y, Willer CJ, Ding J, Scheet P, Abecasis GR. MaCH: using sequence and
genotype data to estimate haplotypes and unobserved genotypes. Genet Epidemiol
2010 December;34(8):816-34.
109
(122) Nothnagel M, Ellinghaus D, Schreiber S, Krawczak M, Franke A. A comprehensive
evaluation of SNP genotype imputation. Hum Genet 2009 March;125(2):163-71.
(123) Aulchenko YS, Struchalin MV, van Duijn CM. ProbABEL package for genome-wide
association analysis of imputed data. BMC Bioinformatics 2010;11:134.
(124) Voorman A, Rice K, Lumley T. Fast computation for genome-wide association
studies using boosted one-step statistics. Bioinformatics 2012 July 15;28(14):1818-
22.
(125) Willer CJ, Li Y, Abecasis GR. METAL: fast and efficient meta-analysis of
genomewide association scans. Bioinformatics 2010 September 1;26(17):2190-1.
(126) Avery CL, Der JS, Whitsel EA, Sturmer T. Comparison of study designs used to
detect and characterize pharmacogenomic interactions in nonexperimental studies:
a simulation study. Pharmacogenet Genomics 2014 March;24(3):146-55.
(127) Shafi T, Appel LJ, Miller ER, III, Klag MJ, Parekh RS. Changes in serum potassium
mediate thiazide-induced diabetes. Hypertension 2008 December;52(6):1022-9.
(128) Smith SM, Anderson SD, Wen S, Gong Y, Turner ST, Cooper-Dehoff RM, Schwartz
GL, Bailey K, Chapman A, Hall KL, Feng H, Boerwinkle E, Johnson JA, Gums JG.
Lack of correlation between thiazide-induced hyperglycemia and hypokalemia:
subgroup analysis of results from the pharmacogenomic evaluation of
antihypertensive responses (PEAR) study. Pharmacotherapy 2009
October;29(10):1157-65.
(129) Morris AP. Transethnic meta-analysis of genomewide association studies. Genet
Epidemiol 2011 December;35(8):809-22.
(130) Johnson JA, Boerwinkle E, Zineh I, Chapman AB, Bailey K, Cooper-Dehoff RM,
Gums J, Curry RW, Gong Y, Beitelshees AL, Schwartz G, Turner ST.
Pharmacogenomics of antihypertensive drugs: rationale and design of the
Pharmacogenomic Evaluation of Antihypertensive Responses (PEAR) study. Am
Heart J 2009 March;157(3):442-9.

110
(131) Chapman AB, Schwartz GL, Boerwinkle E, Turner ST. Predictors of
antihypertensive response to a standard dose of hydrochlorothiazide for essential
hypertension. Kidney Int 2002 March;61(3):1047-55.
(132) Price AL, Patterson NJ, Plenge RM, Weinblatt ME, Shadick NA, Reich D. Principal
components analysis corrects for stratification in genome-wide association studies.
Nat Genet 2006 August;38(8):904-9.
(133) Campbell CD, Ogburn EL, Lunetta KL, Lyon HN, Freedman ML, Groop LC, Altshuler
D, Ardlie KG, Hirschhorn JN. Demonstrating stratification in a European American
population. Nat Genet 2005 August;37(8):868-72.
(134) Wang X, Chua HX, Chen P, Ong RT, Sim X, Zhang W, Takeuchi F, Liu X, Khor CC,
Tay WT, Cheng CY, Suo C, Liu J, Aung T, Chia KS, Kooner JS, Chambers JC,
Wong TY, Tai ES, Kato N, Teo YY. Comparing methods for performing trans-ethnic
meta-analysis of genome-wide association studies. Hum Mol Genet 2013 June
1;22(11):2303-11.
(135) Stephens M, Balding DJ. Bayesian statistical methods for genetic association
studies. Nat Rev Genet 2009 October;10(10):681-90.
(136) Chen W, Paradkar PN, Li L, Pierce EL, Langer NB, Takahashi-Makise N, Hyde BB,
Shirihai OS, Ward DM, Kaplan J, Paw BH. Abcb10 physically interacts with
mitoferrin-1 (Slc25a37) to enhance its stability and function in the erythroid
mitochondria. Proc Natl Acad Sci U S A 2009 September 22;106(38):16263-8.
(137) Micaelo NM, Macedo AL, Goodfellow BJ, Felix V. Tetrapyrrole binding affinity of the
murine and human p22HBP heme-binding proteins. J Mol Graph Model 2010
November;29(3):396-405.
(138) Shaw GC, Cope JJ, Li L, Corson K, Hersey C, Ackermann GE, Gwynn B, Lambert
AJ, Wingert RA, Traver D, Trede NS, Barut BA, Zhou Y, Minet E, Donovan A,
Brownlie A, Balzan R, Weiss MJ, Peters LL, Kaplan J, Zon LI, Paw BH. Mitoferrin is
essential for erythroid iron assimilation. Nature 2006 March 2;440(7080):96-100.
(139) Yuan X, Fleming MD, Hamza I. Heme transport and erythropoiesis. Curr Opin Chem
Biol 2013 April;17(2):204-11.
111
(140) Tang XD, Xu R, Reynolds MF, Garcia ML, Heinemann SH, Hoshi T. Haem can bind
to and inhibit mammalian calcium-dependent Slo1 BK channels. Nature 2003
October 2;425(6957):531-5.
(141) Taniguchi J, Guggino WB. Membrane stretch: a physiological stimulator of Ca2+-
activated K+ channels in thick ascending limb. Am J Physiol 1989 September;257(3
Pt 2):F347-F352.
(142) Guggino SE, Guggino WB, Green N, Sacktor B. Ca2+-activated K+ channels in
cultured medullary thick ascending limb cells. Am J Physiol 1987 February;252(2 Pt
1):C121-C127.
(143) Merot J, Poncet V, Bidet M, Tauc M, Poujeol P. Apical membrane ionic channels in
the rabbit cortical thick ascending limb in primary culture. Biochim Biophys Acta
1991 December 9;1070(2):387-400.
(144) Belfodil R, Barriere H, Rubera I, Tauc M, Poujeol C, Bidet M, Poujeol P. CFTR-
dependent and -independent swelling-activated K+ currents in primary cultures of
mouse nephron. Am J Physiol Renal Physiol 2003 April;284(4):F812-F828.
(145) Holtzclaw JD, Grimm PR, Sansom SC. Role of BK channels in hypertension and
potassium secretion. Curr Opin Nephrol Hypertens 2011 September;20(5):512-7.
(146) Pluznick JL, Sansom SC. BK channels in the kidney: role in K(+) secretion and
localization of molecular components. Am J Physiol Renal Physiol 2006
September;291(3):F517-F529.
(147) Gray DA, Frindt G, Palmer LG. Quantification of K+ secretion through apical low-
conductance K channels in the CCD. Am J Physiol Renal Physiol 2005
July;289(1):F117-F126.
(148) Karnes JH, McDonough CW, Gong Y, Vo TT, Langaee TY, Chapman AB, Gums
JG, Beitelshees AL, Bailey KR, Del-Aguila JL, Boerwinkle EA, Pepine CJ, Turner
ST, Johnson JA, Cooper-Dehoff RM. Association of KCNJ1 variation with change in
fasting glucose and new onset diabetes during HCTZ treatment.
Pharmacogenomics J 2012 August 21.

112
(149) Maitland-van der Zee AH, Turner ST, Schwartz GL, Chapman AB, Klungel OH,
Boerwinkle E. A multilocus approach to the antihypertensive pharmacogenetics of
hydrochlorothiazide. Pharmacogenet Genomics 2005 May;15(5):287-93.
(150) Horrigan FT, Heinemann SH, Hoshi T. Heme regulates allosteric activation of the
Slo1 BK channel. J Gen Physiol 2005 July;126(1):7-21.
(151) Rudkowska I, Guenard F, Julien P, Couture P, Lemieux S, Barbier O, Calder PC,
Minihane AM MD, Vohl MC. Genome-wide association study of the plasma
triglyceride response to an n-3 polyunsaturated fatty acid (PUFA) supplementation.
J Lipid Res 2014 May 19.
(152) Gonzaga-Jauregui C, Lupski JR, Gibbs RA. Human genome sequencing in health
and disease. Annu Rev Med 2012;63:35-61.
(153) Kurland L, Lind L, Melhus H. Using genotyping to predict responses to anti-
hypertensive treatment. Trends Pharmacol Sci 2005 September;26(9):443-7.
113
VITA
Jorge L Del Aguila was born in Lima, Peru on the 1st of September, 1975 to Norka Alvarez
Murillo and Luis Alberto Del Aguila Diaz. After completion of his work at Colegio Claretiano
in Lima, Peru, he attended the Universidad Nacional Mayor de San Marcos (UNMSM)
in Lima, Peru. He earned a degree of Bachelor of Science in Biology with major in Genetics
from UNMSM in 2002. He started his Master of Science in Biotechnology in the
collaborative graduate program between Stephen F. Austin State University at
Nacogdoches, Texas and University of Texas Health Center at Tyler, Texas in fall 2004 and
received his degree in August 2007. He entered the University of Texas Health Science
Center at Houston Graduate School of Biomedical Sciences in August of 2007.
Permanent address:
Jiron El Camino 340
La Ensenada, la Molina
Lima12
Lima, Peru