Embed Size (px)
Citation preview
Molecular Ecology (2012) doi: 10.1111/j.1365-294X.2012.05717.x
Genetics of gene expression responses to temperaturestress in a sea urchin gene network
DANIEL E. RUNCIE,* DAVID A. GARFIELD,* COURTNEY C. BABBITT,*† JENNIFER A.
WYGODA,* SAYAN MUKHERJEE,†,‡ and GREGORY A. WRAY*,†
*Department of Biology, Duke University, Box 90338, Durham, NC 27708, USA, †Duke Institute for Genome Sciences &
Policy, Duke University, Durham, NC 27708, USA, ‡Department of Statistical Science, Duke University, Box 90251, Durham,
NC 27708, USA
Corresponde
E-mail: danie
� 2012 Black
Abstract
Stress responses play an important role in shaping species distributions and robustness
to climate change. We investigated how stress responses alter the contribution of additive
genetic variation to gene expression during development of the purple sea urchin,
Strongylocentrotus purpuratus, under increased temperatures that model realistic climate
change scenarios. We first measured gene expression responses in the embryos by RNA-
seq to characterize molecular signatures of mild, chronic temperature stress in an
unbiased manner. We found that an increase from 12 to 18 �C caused widespread
alterations in gene expression including in genes involved in protein folding, RNA
processing and development. To understand the quantitative genetic architecture of this
response, we then focused on a well-characterized gene network involved in endome-
soderm and ectoderm specification. Using a breeding design with wild-caught individ-
uals, we measured genetic and gene–environment interaction effects on 72 genes within
this network. We found genetic or maternal effects in 33 of these genes and that the
genetic effects were correlated in the network. Fourteen network genes also responded to
higher temperatures, but we found no significant genotype–environment interactions in
any of the genes. This absence may be owing to an effective buffering of the temperature
perturbations within the network. In support of this hypothesis, perturbations to
regulatory genes did not affect the expression of the genes that they regulate. Together,
these results provide novel insights into the relationship between environmental change
and developmental evolution and suggest that climate change may not expose large
amounts of cryptic genetic variation to selection in this species.
Keywords: gene expression, gene network, gene–environment interaction, stress response,
Strongylocentrotus purpuratus
Received 28 February 2012; revision received 31 May 2012; accepted 6 June 2012
Introduction
Global climate change is exposing many species to
stressful, and often, novel environments (Parmesan &
Yohe 2003; Gienapp et al. 2008). Many species have
shown changes in their phenology or distribution over
the past century, and these changes are predominantly
in the direction predicted by increasing temperatures
(Parmesan & Yohe 2003; Root et al. 2003). However,
nce: Daniel Runcie, Fax: +919 660 7293;
well Publishing Ltd
organisms possess mechanisms to buffer their develop-
ment and physiology against the effects of deleterious
temperatures (Hochachka & Somero 2002). These
include the heat shock response (Lindquist 1986), devel-
opmental arrest (Lindsley & Poodry 1977) and behavio-
ural accommodation (Huey 1974). The robustness of
buffering mechanisms to increased temperatures may
be a key determinant of a species’ future health and
persistence (Huey et al. 2009; Somero 2010; Tomanek
2010).
While many buffering mechanisms (such as heat
shock gene regulation) are highly conserved over long
2 D. E . RUN CIE ET AL.
evolutionary periods (Lindquist 1986; Feder & Hofmann
1999), closely related species can differ drastically in
their tolerance of higher temperatures (Huey et al. 2009;
Kellermann et al. 2009). This observation suggests that
temperature tolerance can evolve rapidly. The mecha-
nisms and evolution of stress responses can be directly
linked: the way that a species responds to stress deter-
mines not only its immediate tolerance level, but can
affect its potential to evolve increased tolerance over
the long term. Stressful conditions can alter the expres-
sion of standing genetic variation, or expose novel
genetic variants, by activating different genes and path-
ways and by lifting internal buffers on noise and dis-
turbing homoeostasis. This ‘cryptic’ genetic variation
then becomes visible to selection (Hoffmann & Hercus
2000; Gibson & Dworkin 2004; Schlichting 2008; Pfennig
et al. 2010). These gene–environment interactions (GEIs)
modify the genetic architecture of traits and can acceler-
ate or hinder adaptations (Masel 2006). Near-term cli-
mate changes are likely to be too rapid for new
mutations to provide material for adaptation (Burger &
Lynch 1997), so evolutionary adaptations may rely on
standing (but potentially hidden or cryptic) genetic var-
iation within species.
The purple sea urchin, Strongylocentrotus purpuratus,
is a keystone species along the Pacific coast of North
America, found in intertidal and subtidal waters from
Alaska to Cedros Island, Mexico (Cochran & Engel-
mann 1975; Pearse 2006). It has an enormous population
size and high genetic diversity, averaging at least one
mismatch between two individuals every 50 bases along
the genome (Sodergren et al. 2006). S. purpuratus has
little large-scale genetic structure along its range
(Palumbi & Wilson 1990; Kenner 1992; Pespeni et al.
2011), although there may be local genetic differentia-
tion (Edmands et al. 1996). Seawater temperatures in
this region vary greatly with season, latitude and depth,
reaching 4 �C in the winter at the northern extreme,
and >20 �C during the summer in the south (Osovitz &
Hofmann 2005). However, not all temperatures are
equally permissive of growth and development. Season-
ality in temperature likely plays a role in determining
reproductive timing: temperatures above 17 �C are det-
rimental to gametogenesis (Basch & Tegner 2007) and
may prevent spawning (Cochran & Engelmann 1975).
Early embryonic stages are generally thought to be the
most sensitive to temperature stress (Andronikov 1975;
Fujisawa 1989; Fujisawa & Shigei 1990), and thus may
determine tolerance ranges for normal development
(Sewell & Young 1999). Climate changes this century
are predicted to warm global surface temperatures by
1.1–6.4 �C (IPCC 2007). While such an increase is unli-
kely to prevent development of embryos from all but
perhaps the most southern populations, it will expose
more populations to conditions that cause abnormal
development (Farmanfarmaian & Giese 1963; Strath-
mann 1987; Azad et al. 2011) and create stressful condi-
tions that affect dispersal and reproductive success
(Hammond & Hofmann 2010; Byrne et al. 2011). Here,
we investigated the response of S. purpuratus embryos
to a stressful, but realistic temperature range (12–18 �C),
and asked if such temperature variation exposed evolu-
tionary relevant GEIs by perturbing developmental
gene regulatory networks.
In doing so, we took advantage of both a key feature
of S. purpuratus biology and the rich history of prior
work on this system. S. purpuratus is a broadcast spaw-
ner that produces large numbers of synchronous
embryos (Strathmann 1987), making it amenable to
studies of functional genetic variation in wild outbred
individuals using controlled breeding designs (Lynch &
Walsh 1998). In part because of their high fecundity,
they have also become an important model system for
animal development (http://www.SpBase.org, Soder-
gren et al. 2006), and for responses to natural and
unnatural environmental stresses (Giese & Farmanfar-
maian 1963; Fujisawa 1993; Roepke et al. 2005; Todg-
ham & Hofmann 2009). Most importantly for this work
is the availability of an extremely well-characterized
gene regulatory network for endomesodermal and ecto-
dermal specification in embryos—probably among the
best-characterized developmental networks currently
available in any animal system (Davidson et al. 2002;
Angerer & Angerer 2003; Oliveri et al. 2008; Peter &
Davidson 2010). This network consists of transcription
factors, signalling molecules and terminal differentia-
tion (structural) genes that are expressed in distinct spa-
tial and temporal patterns during development. The
known regulatory relationships among these genes con-
stitute a large proportion of the regulatory interactions
necessary for specifying gene expression patterns and
determining cell fates throughout embryogenesis. We
used this network to test how genetic variation and
environmental perturbations during development may
be buffered or transmitted through known network
relationships.
Specifically, we took a novel systems-genetics
approach to study how environmental stress influences
gene–gene interactions and GEIs, and how this may be
important for future adaptation in this species. At the
molecular level, stress responses require the activation or
repression of specific genes and pathways to buffer other
critical cellular systems (Richter et al. 2010). Therefore,
measuring the activity and success of a stress response
requires characterizing both the responses of genes
involved in the buffering, and the stability of the buffered
systems. To do so, we measured transcriptome-wide
plasticity to identify components of the S. purpuratus
� 2012 Blackwell Publishing Ltd
T EM P E RA TU R E ST R E S S IN A G EN E N E T WO R K 3
stress response. Next, in a more in-depth analysis, we
focused on the critically important and well-character-
ized endomesodermal developmental gene regulatory
network to study how gene regulatory interactions are
buffered in the face of such perturbations. Lastly, we
tested for GEIs in this network across genetic back-
grounds from a natural population, and asked if the
response of the network to environmental stress was
genetically variable. These combined approaches provide
a powerful lens through which we can assess the func-
tional and evolutionary implications of environmental
change in an important developmental model species.
(a)
(c) (d)
(b)
Log 2
FC 1
2 °C
– 1
8 °C
EH1
GF1
HG1
37.5 h 28.5 h 23 h
12 °C 18 °C15 °C
1
2
3
01.
02.
03.
0
Hsp70 Hsp90
7090
Leng
th (μ
m)
12 °C 18 °C15 °C
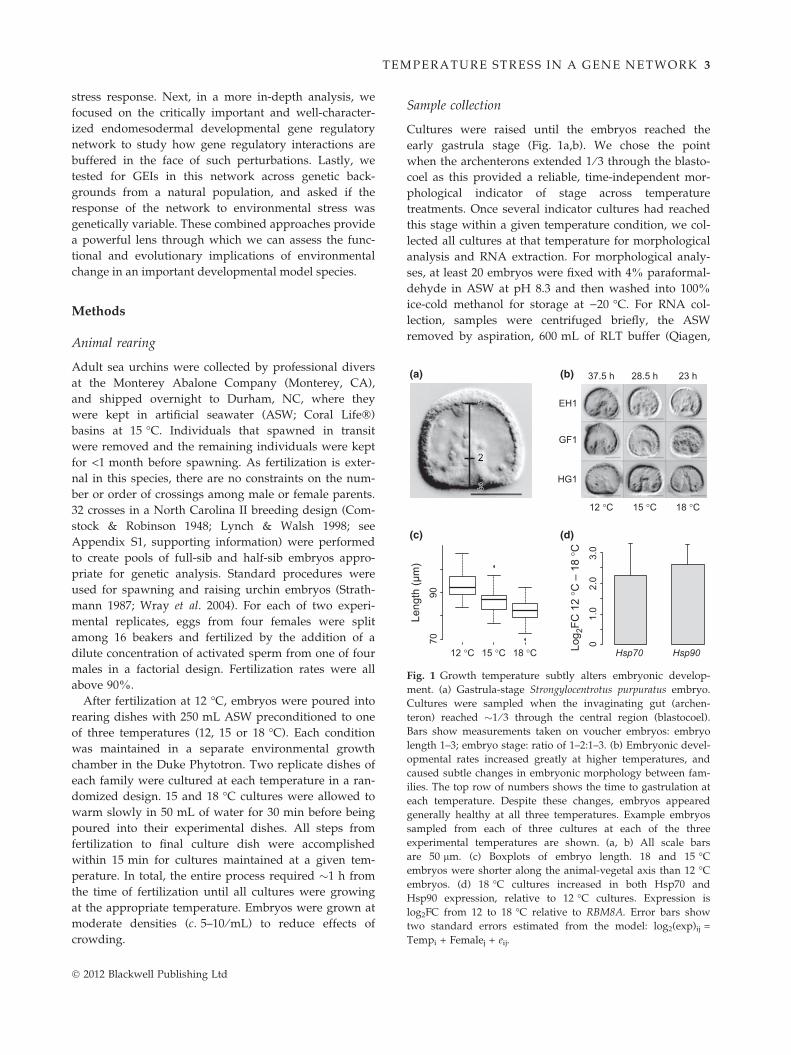
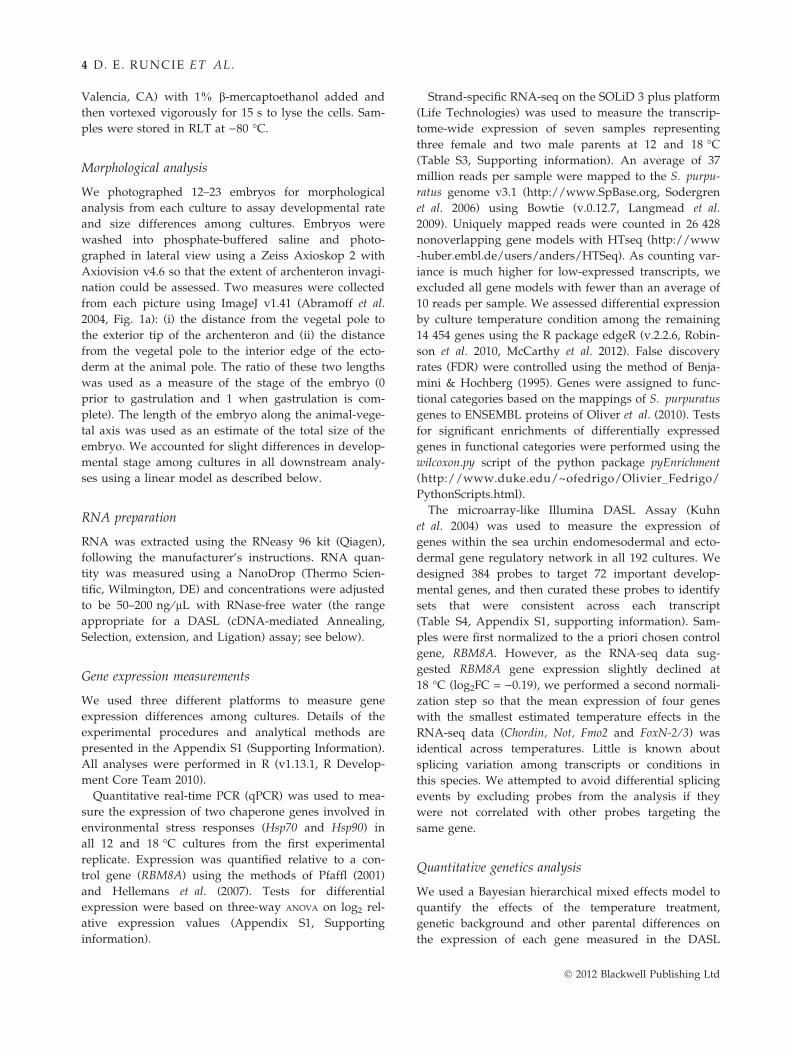
Fig. 1 Growth temperature subtly alters embryonic develop-
ment. (a) Gastrula-stage Strongylocentrotus purpuratus embryo.
Cultures were sampled when the invaginating gut (archen-
teron) reached �1 ⁄ 3 through the central region (blastocoel).
Bars show measurements taken on voucher embryos: embryo
length 1–3; embryo stage: ratio of 1–2:1–3. (b) Embryonic devel-
opmental rates increased greatly at higher temperatures, and
caused subtle changes in embryonic morphology between fam-
ilies. The top row of numbers shows the time to gastrulation at
each temperature. Despite these changes, embryos appeared
generally healthy at all three temperatures. Example embryos
sampled from each of three cultures at each of the three
experimental temperatures are shown. (a, b) All scale bars
are 50 lm. (c) Boxplots of embryo length. 18 and 15 �C
embryos were shorter along the animal-vegetal axis than 12 �C
embryos. (d) 18 �C cultures increased in both Hsp70 and
Hsp90 expression, relative to 12 �C cultures. Expression is
log2FC from 12 to 18 �C relative to RBM8A. Error bars show
two standard errors estimated from the model: log2(exp)ij =
Tempi + Femalej + eij.
Methods
Animal rearing
Adult sea urchins were collected by professional divers
at the Monterey Abalone Company (Monterey, CA),
and shipped overnight to Durham, NC, where they
were kept in artificial seawater (ASW; Coral Life�)
basins at 15 �C. Individuals that spawned in transit
were removed and the remaining individuals were kept
for <1 month before spawning. As fertilization is exter-
nal in this species, there are no constraints on the num-
ber or order of crossings among male or female parents.
32 crosses in a North Carolina II breeding design (Com-
stock & Robinson 1948; Lynch & Walsh 1998; see
Appendix S1, supporting information) were performed
to create pools of full-sib and half-sib embryos appro-
priate for genetic analysis. Standard procedures were
used for spawning and raising urchin embryos (Strath-
mann 1987; Wray et al. 2004). For each of two experi-
mental replicates, eggs from four females were split
among 16 beakers and fertilized by the addition of a
dilute concentration of activated sperm from one of four
males in a factorial design. Fertilization rates were all
above 90%.
After fertilization at 12 �C, embryos were poured into
rearing dishes with 250 mL ASW preconditioned to one
of three temperatures (12, 15 or 18 �C). Each condition
was maintained in a separate environmental growth
chamber in the Duke Phytotron. Two replicate dishes of
each family were cultured at each temperature in a ran-
domized design. 15 and 18 �C cultures were allowed to
warm slowly in 50 mL of water for 30 min before being
poured into their experimental dishes. All steps from
fertilization to final culture dish were accomplished
within 15 min for cultures maintained at a given tem-
perature. In total, the entire process required �1 h from
the time of fertilization until all cultures were growing
at the appropriate temperature. Embryos were grown at
moderate densities (c. 5–10 ⁄ mL) to reduce effects of
crowding.
� 2012 Blackwell Publishing Ltd
Sample collection
Cultures were raised until the embryos reached the
early gastrula stage (Fig. 1a,b). We chose the point
when the archenterons extended 1 ⁄ 3 through the blasto-
coel as this provided a reliable, time-independent mor-
phological indicator of stage across temperature
treatments. Once several indicator cultures had reached
this stage within a given temperature condition, we col-
lected all cultures at that temperature for morphological
analysis and RNA extraction. For morphological analy-
ses, at least 20 embryos were fixed with 4% paraformal-
dehyde in ASW at pH 8.3 and then washed into 100%
ice-cold methanol for storage at )20 �C. For RNA col-
lection, samples were centrifuged briefly, the ASW
removed by aspiration, 600 mL of RLT buffer (Qiagen,
4 D. E . RUN CIE ET AL.
Valencia, CA) with 1% b-mercaptoethanol added and
then vortexed vigorously for 15 s to lyse the cells. Sam-
ples were stored in RLT at )80 �C.
Morphological analysis
We photographed 12–23 embryos for morphological
analysis from each culture to assay developmental rate
and size differences among cultures. Embryos were
washed into phosphate-buffered saline and photo-
graphed in lateral view using a Zeiss Axioskop 2 with
Axiovision v4.6 so that the extent of archenteron invagi-
nation could be assessed. Two measures were collected
from each picture using ImageJ v1.41 (Abramoff et al.
2004, Fig. 1a): (i) the distance from the vegetal pole to
the exterior tip of the archenteron and (ii) the distance
from the vegetal pole to the interior edge of the ecto-
derm at the animal pole. The ratio of these two lengths
was used as a measure of the stage of the embryo (0
prior to gastrulation and 1 when gastrulation is com-
plete). The length of the embryo along the animal-vege-
tal axis was used as an estimate of the total size of the
embryo. We accounted for slight differences in develop-
mental stage among cultures in all downstream analy-
ses using a linear model as described below.
RNA preparation
RNA was extracted using the RNeasy 96 kit (Qiagen),
following the manufacturer’s instructions. RNA quan-
tity was measured using a NanoDrop (Thermo Scien-
tific, Wilmington, DE) and concentrations were adjusted
to be 50–200 ng ⁄ lL with RNase-free water (the range
appropriate for a DASL (cDNA-mediated Annealing,
Selection, extension, and Ligation) assay; see below).
Gene expression measurements
We used three different platforms to measure gene
expression differences among cultures. Details of the
experimental procedures and analytical methods are
presented in the Appendix S1 (Supporting Information).
All analyses were performed in R (v1.13.1, R Develop-
ment Core Team 2010).
Quantitative real-time PCR (qPCR) was used to mea-
sure the expression of two chaperone genes involved in
environmental stress responses (Hsp70 and Hsp90) in
all 12 and 18 �C cultures from the first experimental
replicate. Expression was quantified relative to a con-
trol gene (RBM8A) using the methods of Pfaffl (2001)
and Hellemans et al. (2007). Tests for differential
expression were based on three-way ANOVA on log2 rel-
ative expression values (Appendix S1, Supporting
information).
Strand-specific RNA-seq on the SOLiD 3 plus platform
(Life Technologies) was used to measure the transcrip-
tome-wide expression of seven samples representing
three female and two male parents at 12 and 18 �C
(Table S3, Supporting information). An average of 37
million reads per sample were mapped to the S. purpu-
ratus genome v3.1 (http://www.SpBase.org, Sodergren
et al. 2006) using Bowtie (v.0.12.7, Langmead et al.
2009). Uniquely mapped reads were counted in 26 428
nonoverlapping gene models with HTseq (http://www
-huber.embl.de/users/anders/HTSeq). As counting var-
iance is much higher for low-expressed transcripts, we
excluded all gene models with fewer than an average of
10 reads per sample. We assessed differential expression
by culture temperature condition among the remaining
14 454 genes using the R package edgeR (v.2.2.6, Robin-
son et al. 2010, McCarthy et al. 2012). False discovery
rates (FDR) were controlled using the method of Benja-
mini & Hochberg (1995). Genes were assigned to func-
tional categories based on the mappings of S. purpuratus
genes to ENSEMBL proteins of Oliver et al. (2010). Tests
for significant enrichments of differentially expressed
genes in functional categories were performed using the
wilcoxon.py script of the python package pyEnrichment
(http://www.duke.edu/~ofedrigo/Olivier_Fedrigo/
PythonScripts.html).
The microarray-like Illumina DASL Assay (Kuhn
et al. 2004) was used to measure the expression of
genes within the sea urchin endomesodermal and ecto-
dermal gene regulatory network in all 192 cultures. We
designed 384 probes to target 72 important develop-
mental genes, and then curated these probes to identify
sets that were consistent across each transcript
(Table S4, Appendix S1, supporting information). Sam-
ples were first normalized to the a priori chosen control
gene, RBM8A. However, as the RNA-seq data sug-
gested RBM8A gene expression slightly declined at
18 �C (log2FC = )0.19), we performed a second normali-
zation step so that the mean expression of four genes
with the smallest estimated temperature effects in the
RNA-seq data (Chordin, Not, Fmo2 and FoxN-2 ⁄ 3) was
identical across temperatures. Little is known about
splicing variation among transcripts or conditions in
this species. We attempted to avoid differential splicing
events by excluding probes from the analysis if they
were not correlated with other probes targeting the
same gene.
Quantitative genetics analysis
We used a Bayesian hierarchical mixed effects model to
quantify the effects of the temperature treatment,
genetic background and other parental differences on
the expression of each gene measured in the DASL
� 2012 Blackwell Publishing Ltd
T EM P E RA TU R E ST R E S S IN A G EN E N E T WO R K 5
assay. We fit models for each gene by Markov Chain
Monte Carlo simulation using a Gibbs sampler coded in
R. Details and derivation of this model are given in the
Appendix S1 (Supporting information), and code will
be posted on Dryad. Briefly, we fit the transcript
expression level of each gene as an unobserved latent
variable, using the 2–6 probe measurements of this tran-
script per sample as independent estimates of this
expression. We modelled the variation in transcript
expression using a linear mixed effect model with fixed
effect predictors of temperature and developmental
stage, and random effects corresponding to the male
and female parents of each culture. We also fit all pair-
wise interactions between male, female and temperature
as additional random effects. We used a heavy-tailed
t-distribution for the residual error structure to account
for the apparent non-normal error distribution of indi-
vidual probe measurements in the DASL assay. Poster-
ior distributions were summarized as a mean and
credible interval spanning the central 95% of posterior
samples. We assessed the significance of temperature or
parental effects on gene expression levels by asking
whether this credible interval overlapped zero.
Network-level analyses
We collected the set of known interactions among our
genes in the BioTapestry representations of the endo-
mesodermal network (http://www.biotapestry.org,
Longabaugh et al. 2005) and the ectodermal network
from the Davidson lab website (http://www.its.
caltech.edu/~mirsky/) as of 5 September 2011. In total, 52
of the 73 assayed genes contribute to 93 transcriptional
regulatory events (interactions) among genes between
28 and 30 h postfertilization (hpf), at 15 �C, equivalent
to the timing of sampling in the current study
(Table S5, Supporting information). When two genes
were known to form a complex that then regulates a
downstream gene, changes in the concentration of
either upstream gene could regulate the activity of the
complex, so we counted two interactions: one linking
each upstream gene to the downstream target.
We then explored the influence of network connec-
tions by measuring the correlation in gene expression
owing to either temperature or parental effects between
pairs of genes known to interact. Because some regula-
tory genes encode activators and others repressors, we
tested for positive correlations between activators and
their targets, and negative correlations between repres-
sors and their targets.
For temperature effects, we tested the Pearson corre-
lation of temperature effects of upstream and down-
stream genes. We also explored other metrics that may
be less sensitive to the distribution of temperature
� 2012 Blackwell Publishing Ltd
effects, such as a binary sign test in which we counted
the number of upstream–downstream pairs that either
both increased or both decreased more than an a
threshold of |log2FC| = 0.05. Results were similar for
all methods.
For male parent effects, we calculated the Pearson cor-
relation between the eight male parent effects for each
upstream gene–downstream gene pair, multiplied this
correlation by )1 if the upstream gene was a repressor
and averaged these correlations across the network. We
used the posterior means of male parent effects from the
quantitative genetics models described above for each
gene. Female effects were tested similarly.
To assess the significance of network effects, we used
randomization tests to account for the fact that each
interaction is not independent (for example, one
upstream gene can regulate several downstream genes).
For each of 10 000 randomizations, we permuted the
labels of all 52 genes involved in interactions and recal-
culated the test statistic. This preserved both the distri-
bution of responses among genes and the network
topology, but randomized the interaction partners of
each gene.
To test for an influence of spatial expression patterns
on gene expression variation, we extracted the anno-
tated expression domains for each gene at 27 hpf from
BioTapestry (Table S4, Supporting information). There
are 18 regions specified in BioTapestry, and most of the
72 target genes were expressed in one or more of these
regions. Three regions (skeletal micromeres, the oral
ectoderm and the veg 1 region) each had five or more
genes expressed throughout the region and nowhere
else. We tested if gene expression patterns were corre-
lated among genes if they shared entirely overlapping
expression domains. For temperature effects, we tested
the effect of expression domain using an F-test from a
one-way ANOVA with the three above regions (plus
‘other’) as predictors. To assess significance, we per-
muted the region labels as above and compared the
actual P-value to the distribution of randomized P-val-
ues. For male and female effects, we calculated the pair-
wise correlations of breeding values among all genes,
and tested if the mean correlation among genes with
entirely overlapping expression domains was higher
than for randomly selected genes.
Results
Higher temperatures cause mild developmental stress
Embryos raised at each temperature developed success-
fully through the gastrula stage. Even those at the high-
est temperature (18 �C) showed no obvious increase in
mortality or developmental abnormalities at gastrulation
6 D. E . RUN CIE ET AL.
(Fig. 1b) or through the pluteus stage (�5 days at
12 �C). Developmental rates were strongly dependent
on temperature (Loeb 1916; Fujisawa 1993): cultures
reached the mid-point of gastrulation after 23 h postfer-
tilization (hpf) at 18 �C, 28.5 hpf at 15 �C and 37.5 hpf
at 12 �C (Fig. 1b). Embryo morphology was also
affected by temperature: embryos grown at 18 �C were
significantly shorter along the animal-vegetal axis
(Fig. 1c). Decreased larval size has been observed previ-
ously in larvae grown at higher temperatures, possibly
owing to increased metabolic demands of development
(Chen & Chen 1992). Here, embryos cultured at higher
temperatures appeared to have more irregular-shaped
blastocoels, and slightly less ordered cells in the ecto-
derm. Additionally, the expression of two chaperone
genes, Hsp70 and Hsp90, was increased at 18 �C (Hsp70:
log2FC = 2.24, t39 = 4.22, P = 0.0001, Hsp90: log2FC =
2.60, t37 = 8.03, P = 1e-9. Both models were log2
(exp)ij = Tempi + Femalej + eij), providing additional
evidence that this temperature was stressful for devel-
opment (Fig. 1d).
Several important cellular processes are affected bytemperature
The higher heat shock gene expression but uncompro-
mised gastrulation at 18 �C suggests that the embryos
successfully buffered their development against temper-
ature stress. Before focusing in more detail on how our
focal network of developmental regulatory genes
responded to this stress, we used RNA-seq to perform
a relatively unbiased assay of temperature plasticity
throughout the sea urchin embryonic transcriptome.
−5 0 5 10
−4
−2
02
4
15
6
12 °C log2 RPKM
Log 2
fold
cha
nge
12 °
C to
18
°C NS
± 50% change5% FDR
(a)
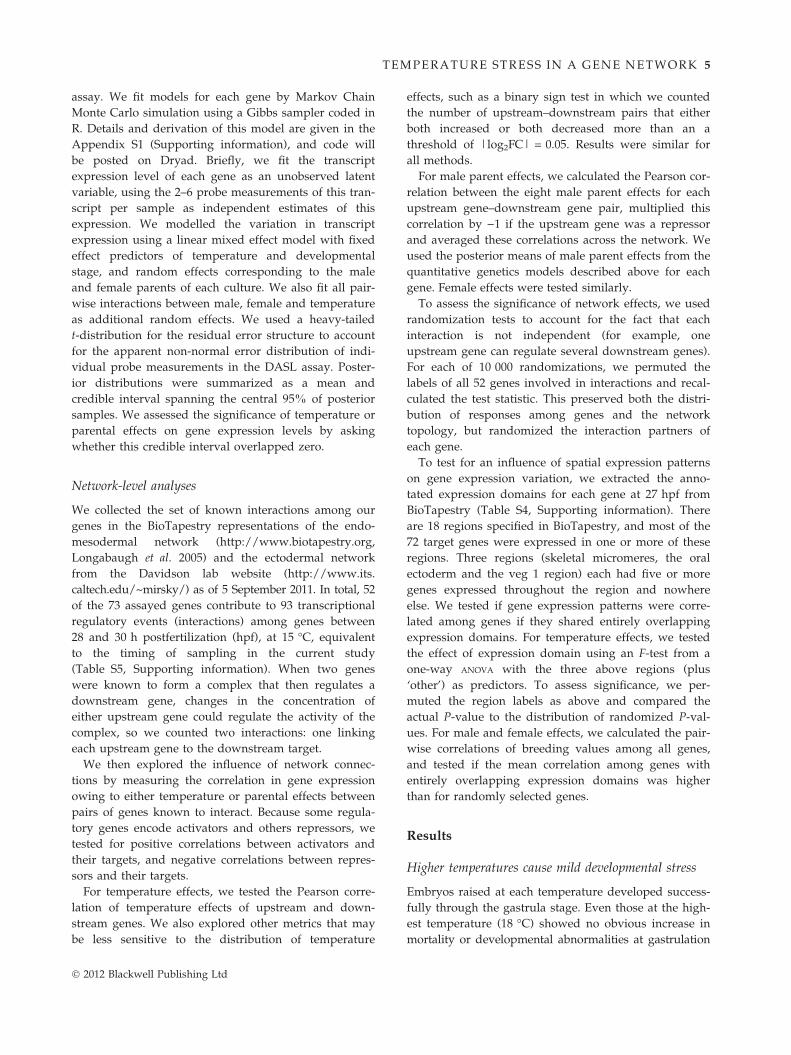
Fig. 2 The expression of many genes was affected by higher tempera
(in Reads per Kilobase per Million mapped reads, RPKM) of all 14 42
the log2 fold change of each gene from 12 to 18 �C. Genes with a sign
oured red. The horizontal blue lines show a ± 50% change in express
log2FC 6 for clarity, hiding 26 genes. (b) Genes that decreased at 18 �density curves of the expression (RPKM) those genes that increased (
ative to 12 �C at a FDR of 0.05.
This analysis allowed us to characterize the range of
developmental changes that occurred between cultures
grown at 12 �C or 18 �C and provided context for inter-
preting the observations of genetic and GEI variation
within the focal network. At a FDR of 5%, seawater
temperature affected 2036 of the 14 420 assayed genes
(�14%, Fig. 2a). Of the differentially expressed genes,
1207 changed more than 50% (absolute value of log2
fold change (log2FC) > 0.58) and 478 changed more
than twofold (|log2FC| > 1), with more genes in each
category increasing at 18 �C relative to 12 �C (50%: 696
up, 511 down, twofold: 325 up, 153 down). The genes
that decreased at 18 �C relative to 12 �C tended to be
moderate-to-highly expressed, while genes that
increased were similar in distribution to temperature-
insensitive genes (Fig. 2b). The lack of down-regulated
low-expressed genes was not due either to a floor effect,
which would occur if low-expressed genes could not
decrease further, or to reduced statistical power.
Indeed, some low-expressed genes did exhibit further
decreases in expression at 18 �C (Fig. 2a), and we
observed a similar lack of down-regulated low-
expressed genes if genes were ordered by their average
expression over both temperatures, instead of their
12 �C expression. By ordering genes in this way, we
removed the discrepancy in power between detecting
up- and down-regulated genes.
To explore cellular processes affected by temperature
stress, we tested for enrichment of specific functionally
related genes sets among the genes either up-regulated
or down-regulated at 18 �C. Each S. purpuratus gene model
was assigned functional classifications in the PANTHER
Molecular Function ontology (v6.1) as previously
12 °C log2 RPKM
0.00
0.05
0.10
0.15
Den
sity
18 °C > 12 °C12 °C > 18 °C12 °C ≈ 18 °C
−15 −10 −5 0 5 10 15
(b)
tures. (a) M-A plot showing the average 12 �C expression level
0 genes with an average of 10 RNA-seq counts per sample, and
ificant response at a False discovery rates (FDR) of 0.05 are col-
ion (log2FC = ±0.58). The figure is truncated at RPKM )5.8 and
C relative to 12 �C tended to be high expressed at 12 �C. Kernel
orange) decreased (green), or did not change (grey) at 18 �C rel-
� 2012 Blackwell Publishing Ltd
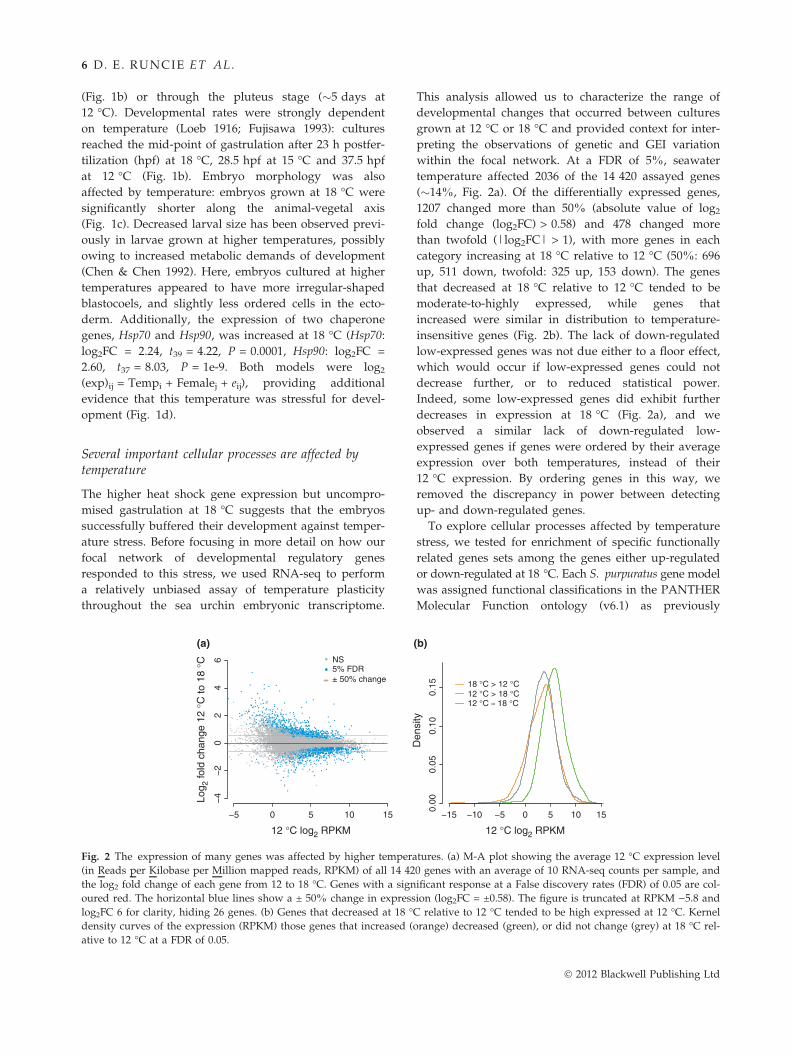
Table 1 PANTHER categories enriched for up- and down-reg-
ulated genes based on RNA-seq analysis
PANTHER molecular
function
Adjusted
PNo. of genes
in category
A)
Chaperone 8.23E)06 108
G-protein coupled receptor 8.23E)06 143
Glycosyltransferase 1.13E)05 196
Hsp 70 family chaperone 0.000470567 11
Other ligase 0.000470567 122
Chaperonin 0.000470567 18
Other ion channel 0.002488457 47
Ligase 0.0039995 343
Other chaperones 0.008856111 49
Vesicle coat protein 0.01024964 28
Transferase 0.01024964 761
Oxidoreductase 0.01684667 489
T EM P E RA TU R E ST R E S S IN A G EN E N E T WO R K 7
described (Oliver et al. 2010). Among genes
up-regulated at 18 �C, we found 14 Molecular Function
categories with a significant enrichment at a FDR of 5%
(Table 1A, Fig. S1A, supporting information). These cat-
egories were consistent with induction of cellular
responses to unfolded proteins and reactive oxygen spe-
cies, and alterations in membrane properties (ion chan-
nels), cell–cell signalling (G-protein coupled receptors)
and protein or energy metabolism (transferases). At the
same FDR threshold, 26 Molecular Function categories
were enriched for down-regulated genes (Table 1B,
Fig. S1B, Supporting information). These categories
included genes involved in energy-expensive processes
such as transcription and RNA processing, as well as cell
structure and skeletal elements, cellular defence compo-
nents and developmental processes.
Kinase activator 0.02111923 37
Dehydrogenase 0.03509571 216
B)
Nucleic acid binding 0.00E+00 1583
Ribosomal protein 1.57E)09 124
Ribonucleoprotein 1.27E)08 49
Tubulin 2.90E)08 30
mRNA processing factor 0.000194877 132
mRNA splicing factor 0.000194877 93
Other RNA-binding protein 0.000226697 136
Membrane-bound signalling
molecule
0.000247238 122
Transcription factor 0.003690222 803
Other zinc finger transcription
factor
0.0060876 56
Amino acid transporter 0.006321818 40
Homoeobox transcription
factor
0.007221357 76
RNA helicase 0.007221357 82
Cytoskeletal protein 0.007221357 555
Actin binding cytoskeletal
protein
0.01309733 244
Cadherin 0.01668833 23
Signalling molecule 0.01668833 350
Defence ⁄ immunity protein 0.01668833 133
Translation initiation factor 0.01756 57
Serine protease inhibitor 0.018069 15
Cell adhesion molecule 0.01904318 231
Protein kinase 0.01904318 369
Exoribonuclease 0.02502217 26
Other transcription factor 0.0341525 144
Kinase 0.0356668 483
Translation factor 0.04440885 84
Genes were assigned to PANTHER Molecular Function
categories as in Oliver et al. (2010). Categorical enrichments
were performed using scripts written by O. Fedrigo (See
Methods), with significance assigned using a Wilcoxon signed
rank test. Adjusted P-values were assigned based on the
Benjamini & Hochberg (1995) multiple comparisons method
using the R function p.adjust. A) PANTHER Molecular
Function categories enriched for up-regulated genes with
adjusted P < 0.05. B) PANTHER Molecular Function categories
enriched for down-regulated genes with adjusted P < 0.05.
Gene network analysis reveals a well-bufferedtemperature response
While the RNA-seq data were useful for identifying
developmental and physiological processes altered at
high temperatures, with such a modest sample size,
they provide limited insight into the genetic architec-
ture of these responses. Genetic variation in responses
to the environment (gene–environment interactions, or
GEIs) may be important for a species to evolve under
changing climates. Gene expression traits offer an
opportunity to understand the mechanisms that create
GEIs by studying the effects of the environment on the
control of gene expression. GEIs can arise because of
environmental effects on the upstream (trans-acting)
regulatory genes, interactions of these regulatory genes
with promoter regions or from changes in post-tran-
scriptional regulation. As such, transcriptional gene reg-
ulatory networks that control gene expression may be
important for understanding GEIs in gene expression.
To explore how transcriptional regulatory networks
influence GEIs, we investigated the transmission of tem-
perature effects (an environmental perturbation) and
genetic effects (a genetic perturbation) through the well-
characterized endomesodermal and ectodermal gene
regulatory network that controls cell type specification
and development in sea urchin embryos. To do so, we
used a DASL assay to greatly expand our sample size
relative to the RNA-seq data set to capture these
responses both across a larger set of genetic back-
grounds, and over three temperatures (12, 15 and
18 �C) instead of two. Higher temperatures caused con-
siderable changes in the expression of genes in the net-
work (Fig. 3). Overall, 14 of the 72 assayed genes
exhibited changes in gene expression between the 12
and 18 �C temperature conditions, with similar num-
bers increasing and decreasing with temperature
� 2012 Blackwell Publishing Ltd
15 °C Expression
18 °C Expression
12 °C vs 18 °C Significant 12 °C vs 18 °C Not significant
−0.
20.
00.
20.
4
Fox
BE
rgR
BM
8AV
EG
F−
3cy
clop
hilin
Su(
H)
dead
ringe
rH
esC
Hex
BM
P2−
4ga
tae
P16
Gsk
−3
Sox
CM
if−7
Fox
OB
raM
sp13
0F
mo2
gata
CR
hoA
Lefty
friz
zled
9C
−le
ctin
Alx
1Ir
xAN
kx22
Pax
2−5−
6P
19 Dlx
Fox
n2−
3S
M50
Cho
rdin
gcm
soxb
1de
ltaT
gif
notc
hS
M32
Hnf
6A
PO
BE
CE
ts1
Blim
p1−
Kro
xO
tp tbr
Lim
1fic
olin
SM
30−
EH
ox11
−13
bsn
ail
End
o16
G−
cadh
erin
Lhx2
noda
lot
xF
oxG
Pm
ar1
TC
FE
veB
−ca
teni
nV
EG
FR
−10
−Ig
Fox
AW
nt8
Mitf
SM
27S
pCol
l−C
olA
lpha Not
gsc
Tel
Gel
solin
brn1
−2−
4D
kk
Log 2
FC
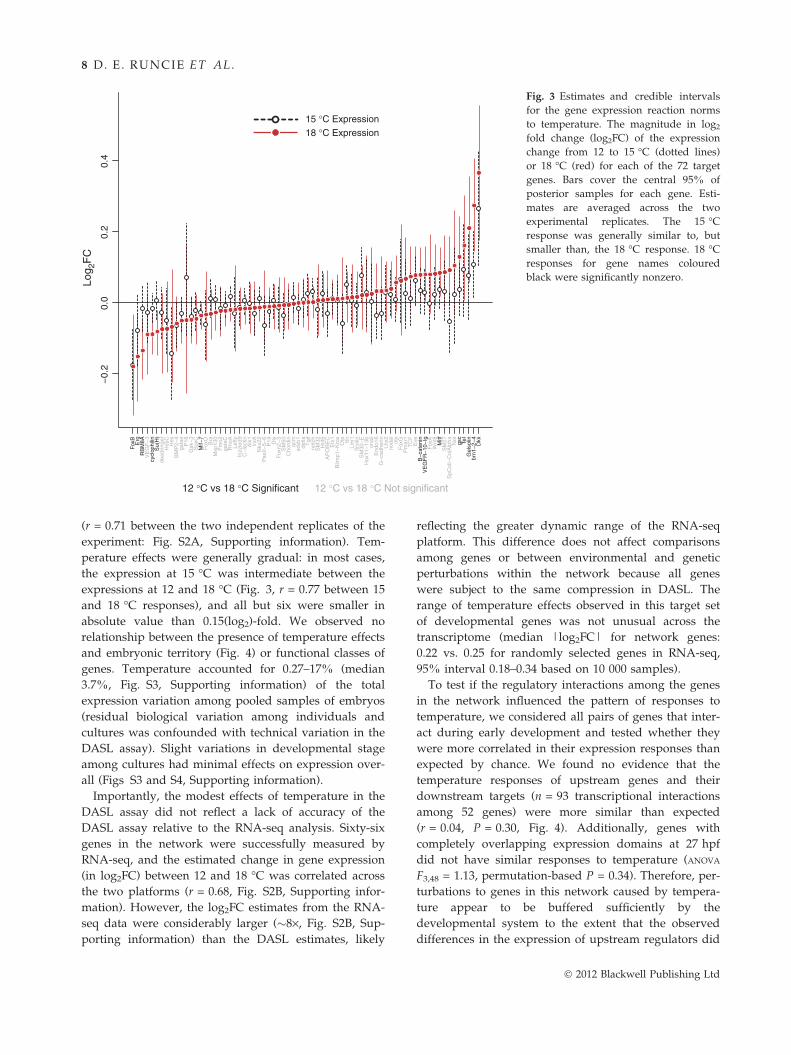
Fig. 3 Estimates and credible intervals
for the gene expression reaction norms
to temperature. The magnitude in log2
fold change (log2FC) of the expression
change from 12 to 15 �C (dotted lines)
or 18 �C (red) for each of the 72 target
genes. Bars cover the central 95% of
posterior samples for each gene. Esti-
mates are averaged across the two
experimental replicates. The 15 �C
response was generally similar to, but
smaller than, the 18 �C response. 18 �C
responses for gene names coloured
black were significantly nonzero.
8 D. E . RUN CIE ET AL.
(r = 0.71 between the two independent replicates of the
experiment: Fig. S2A, Supporting information). Tem-
perature effects were generally gradual: in most cases,
the expression at 15 �C was intermediate between the
expressions at 12 and 18 �C (Fig. 3, r = 0.77 between 15
and 18 �C responses), and all but six were smaller in
absolute value than 0.15(log2)-fold. We observed no
relationship between the presence of temperature effects
and embryonic territory (Fig. 4) or functional classes of
genes. Temperature accounted for 0.27–17% (median
3.7%, Fig. S3, Supporting information) of the total
expression variation among pooled samples of embryos
(residual biological variation among individuals and
cultures was confounded with technical variation in the
DASL assay). Slight variations in developmental stage
among cultures had minimal effects on expression over-
all (Figs S3 and S4, Supporting information).
Importantly, the modest effects of temperature in the
DASL assay did not reflect a lack of accuracy of the
DASL assay relative to the RNA-seq analysis. Sixty-six
genes in the network were successfully measured by
RNA-seq, and the estimated change in gene expression
(in log2FC) between 12 and 18 �C was correlated across
the two platforms (r = 0.68, Fig. S2B, Supporting infor-
mation). However, the log2FC estimates from the RNA-
seq data were considerably larger (�8·, Fig. S2B, Sup-
porting information) than the DASL estimates, likely
reflecting the greater dynamic range of the RNA-seq
platform. This difference does not affect comparisons
among genes or between environmental and genetic
perturbations within the network because all genes
were subject to the same compression in DASL. The
range of temperature effects observed in this target set
of developmental genes was not unusual across the
transcriptome (median |log2FC| for network genes:
0.22 vs. 0.25 for randomly selected genes in RNA-seq,
95% interval 0.18–0.34 based on 10 000 samples).
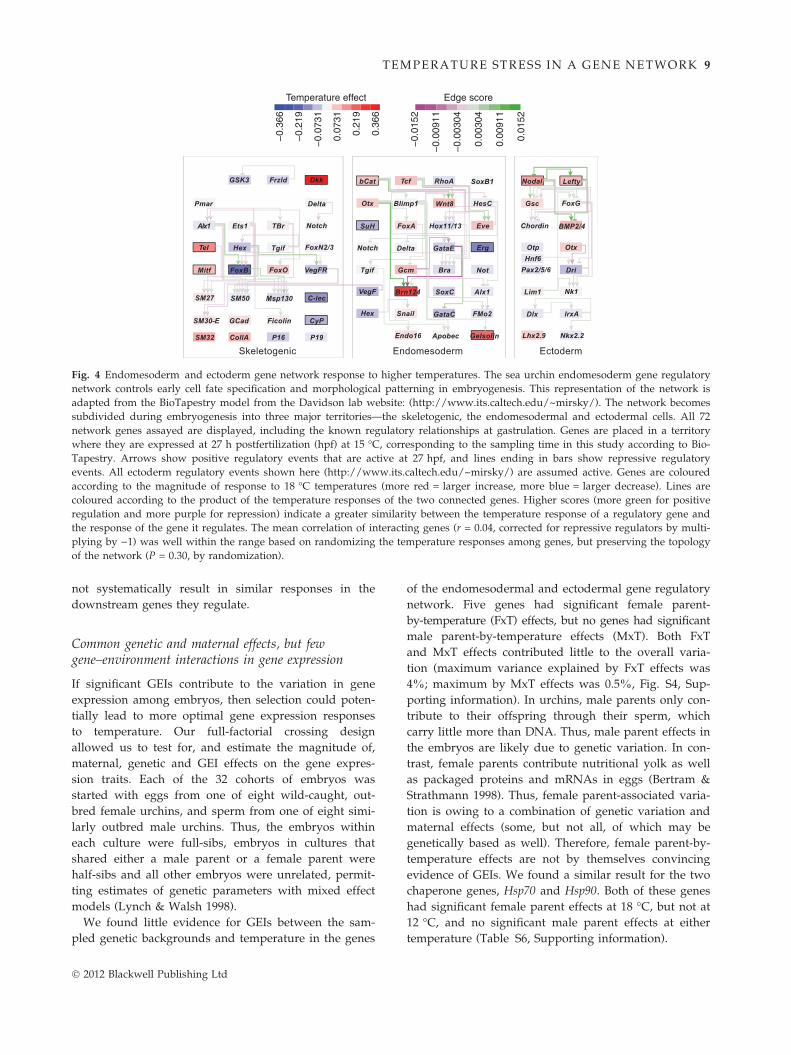
To test if the regulatory interactions among the genes
in the network influenced the pattern of responses to
temperature, we considered all pairs of genes that inter-
act during early development and tested whether they
were more correlated in their expression responses than
expected by chance. We found no evidence that the
temperature responses of upstream genes and their
downstream targets (n = 93 transcriptional interactions
among 52 genes) were more similar than expected
(r = 0.04, P = 0.30, Fig. 4). Additionally, genes with
completely overlapping expression domains at 27 hpf
did not have similar responses to temperature (ANOVA
F3,48 = 1.13, permutation-based P = 0.34). Therefore, per-
turbations to genes in this network caused by tempera-
ture appear to be buffered sufficiently by the
developmental system to the extent that the observed
differences in the expression of upstream regulators did
� 2012 Blackwell Publishing Ltd
Skeletogenic Endomesoderm Ectoderm
−0.
366
−0.
219
−0.
0731
0.07
31
0.21
9
0.36
6
Temperature effect Edge score
−0.
0152
−0.
0091
1
−0.
0030
4
0.00
304
0.00
911
0.01
52
Alx1 Ets1
Not
Notch
Notch
Lhx2.9
Alx1
Pmar
TBr
Tel Hex Tgif FoxN2/3
TcfGSK3 Frzld Dkk bCat
Mitf FoxO VegFR
SM27 SM50 Msp130
SM30-E GCad Ficolin CyP
C-lec
SM32 CollA P16 P19
FoxB
Nodal Lefty
Chordin
Gsc FoxG
BMP2/4
Otx
Hnf6
Apobec GelsolinEndo16
GataCHex Snail
Brn124
Tgif Gcm
Blimp1
EveHox11/13FoxASuH
Wnt8
DriPax2/5/6
Nkx2.2
Dlx IrxA
Nk1Lim1
SoxB1RhoA
Bra
SoxC
HesC
Delta GataE
VegF
FMo2
Erg
Delta
OtxOtp
Fig. 4 Endomesoderm and ectoderm gene network response to higher temperatures. The sea urchin endomesoderm gene regulatory
network controls early cell fate specification and morphological patterning in embryogenesis. This representation of the network is
adapted from the BioTapestry model from the Davidson lab website: (http://www.its.caltech.edu/~mirsky/). The network becomes
subdivided during embryogenesis into three major territories—the skeletogenic, the endomesodermal and ectodermal cells. All 72
network genes assayed are displayed, including the known regulatory relationships at gastrulation. Genes are placed in a territory
where they are expressed at 27 h postfertilization (hpf) at 15 �C, corresponding to the sampling time in this study according to Bio-
Tapestry. Arrows show positive regulatory events that are active at 27 hpf, and lines ending in bars show repressive regulatory
events. All ectoderm regulatory events shown here (http://www.its.caltech.edu/~mirsky/) are assumed active. Genes are coloured
according to the magnitude of response to 18 �C temperatures (more red = larger increase, more blue = larger decrease). Lines are
coloured according to the product of the temperature responses of the two connected genes. Higher scores (more green for positive
regulation and more purple for repression) indicate a greater similarity between the temperature response of a regulatory gene and
the response of the gene it regulates. The mean correlation of interacting genes (r = 0.04, corrected for repressive regulators by multi-
plying by )1) was well within the range based on randomizing the temperature responses among genes, but preserving the topology
of the network (P = 0.30, by randomization).
T EM P E RA TU R E ST R E S S IN A G EN E N E T WO R K 9
not systematically result in similar responses in the
downstream genes they regulate.
Common genetic and maternal effects, but fewgene–environment interactions in gene expression
If significant GEIs contribute to the variation in gene
expression among embryos, then selection could poten-
tially lead to more optimal gene expression responses
to temperature. Our full-factorial crossing design
allowed us to test for, and estimate the magnitude of,
maternal, genetic and GEI effects on the gene expres-
sion traits. Each of the 32 cohorts of embryos was
started with eggs from one of eight wild-caught, out-
bred female urchins, and sperm from one of eight simi-
larly outbred male urchins. Thus, the embryos within
each culture were full-sibs, embryos in cultures that
shared either a male parent or a female parent were
half-sibs and all other embryos were unrelated, permit-
ting estimates of genetic parameters with mixed effect
models (Lynch & Walsh 1998).
We found little evidence for GEIs between the sam-
pled genetic backgrounds and temperature in the genes
� 2012 Blackwell Publishing Ltd
of the endomesodermal and ectodermal gene regulatory
network. Five genes had significant female parent-
by-temperature (FxT) effects, but no genes had significant
male parent-by-temperature effects (MxT). Both FxT
and MxT effects contributed little to the overall varia-
tion (maximum variance explained by FxT effects was
4%; maximum by MxT effects was 0.5%, Fig. S4, Sup-
porting information). In urchins, male parents only con-
tribute to their offspring through their sperm, which
carry little more than DNA. Thus, male parent effects in
the embryos are likely due to genetic variation. In con-
trast, female parents contribute nutritional yolk as well
as packaged proteins and mRNAs in eggs (Bertram &
Strathmann 1998). Thus, female parent-associated varia-
tion is owing to a combination of genetic variation and
maternal effects (some, but not all, of which may be
genetically based as well). Therefore, female parent-by-
temperature effects are not by themselves convincing
evidence of GEIs. We found a similar result for the two
chaperone genes, Hsp70 and Hsp90. Both of these genes
had significant female parent effects at 18 �C, but not at
12 �C, and no significant male parent effects at either
temperature (Table S6, Supporting information).
10 D. E . RUN CIE ET AL.
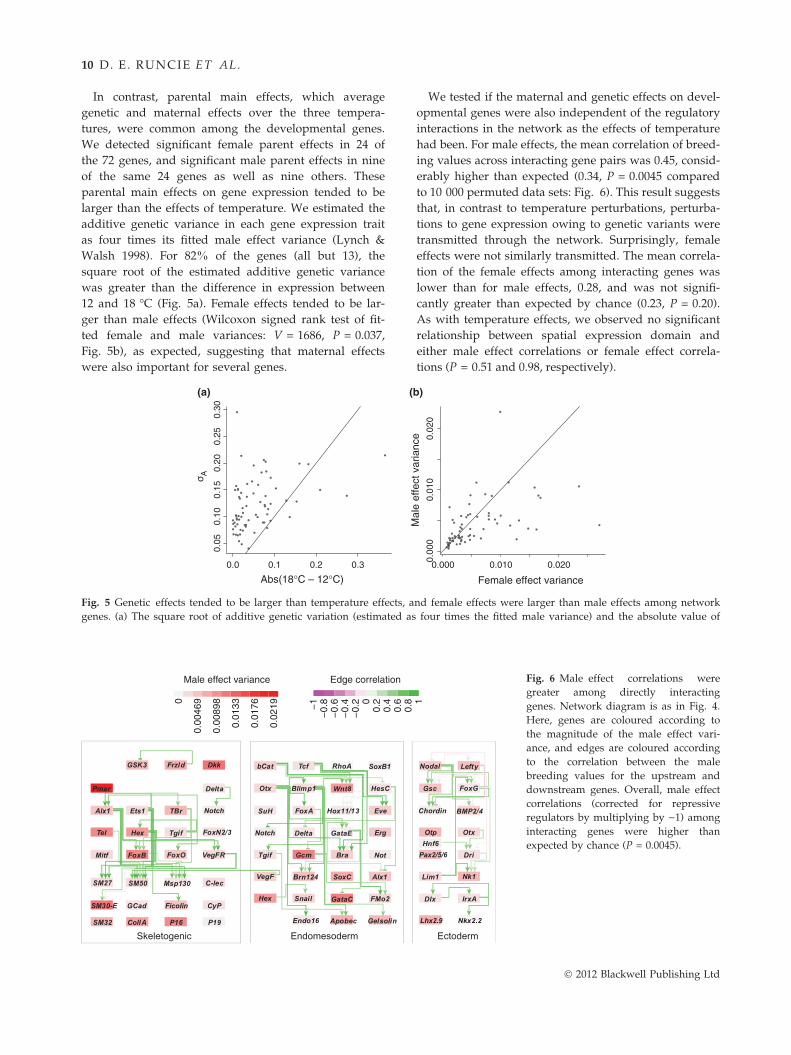
In contrast, parental main effects, which average
genetic and maternal effects over the three tempera-
tures, were common among the developmental genes.
We detected significant female parent effects in 24 of
the 72 genes, and significant male parent effects in nine
of the same 24 genes as well as nine others. These
parental main effects on gene expression tended to be
larger than the effects of temperature. We estimated the
additive genetic variance in each gene expression trait
as four times its fitted male effect variance (Lynch &
Walsh 1998). For 82% of the genes (all but 13), the
square root of the estimated additive genetic variance
was greater than the difference in expression between
12 and 18 �C (Fig. 5a). Female effects tended to be lar-
ger than male effects (Wilcoxon signed rank test of fit-
ted female and male variances: V = 1686, P = 0.037,
Fig. 5b), as expected, suggesting that maternal effects
were also important for several genes.
Abs(18°C – 12°C)
σ A
0.0 0.1 0.2 0.3
0.05
0.10
0.15
0.20
0.25
0.30
(a) (
Fig. 5 Genetic effects tended to be larger than temperature effects, a
genes. (a) The square root of additive genetic variation (estimated as
Skeletogenic Endomesoderm
0
0.00
469
0.00
898
0.01
33
0.01
76
0.02
19
Male effect variance
−1
−0.
8−
0.6
−0.
4−
0.2 0
0.2
0.4
0.6
0.8
Edge correlation
Alx1 Ets1
Not
Notch
Notch
Alx1
Pmar
TBr
Tel Hex Tgif FoxN2/3
TcfGSK3 Frzld Dkk bCat
Mitf FoxO VegFR
SM27 SM50 Msp130
SM30-E GCad Ficolin CyP
C-lec
SM32 CollA P16 P19
FoxB
Otx
Apobec GelsolinEndo16
GataCHex Snail
Brn124
Tgif Gcm
Blimp1
EveHox11/13FoxASuH
Wnt8
SoxB1RhoA
Bra
SoxC
HesC
Delta GataE
VegF
FMo2
Erg
Delta
We tested if the maternal and genetic effects on devel-
opmental genes were also independent of the regulatory
interactions in the network as the effects of temperature
had been. For male effects, the mean correlation of breed-
ing values across interacting gene pairs was 0.45, consid-
erably higher than expected (0.34, P = 0.0045 compared
to 10 000 permuted data sets: Fig. 6). This result suggests
that, in contrast to temperature perturbations, perturba-
tions to gene expression owing to genetic variants were
transmitted through the network. Surprisingly, female
effects were not similarly transmitted. The mean correla-
tion of the female effects among interacting genes was
lower than for male effects, 0.28, and was not signifi-
cantly greater than expected by chance (0.23, P = 0.20).
As with temperature effects, we observed no significant
relationship between spatial expression domain and
either male effect correlations or female effect correla-
tions (P = 0.51 and 0.98, respectively).
0.000 0.010 0.020
0.00
00.
010
0.02
0
Female effect variance
Mal
e ef
fect
var
ianc
e
b)
nd female effects were larger than male effects among network
four times the fitted male variance) and the absolute value of
Ectoderm
1
Lhx2.9
Nodal Lefty
Chordin
Gsc FoxG
BMP2/4
Hnf6DriPax2/5/6
Nkx2.2
Dlx IrxA
Nk1Lim1
OtxOtp
Fig. 6 Male effect correlations were
greater among directly interacting
genes. Network diagram is as in Fig. 4.
Here, genes are coloured according to
the magnitude of the male effect vari-
ance, and edges are coloured according
to the correlation between the male
breeding values for the upstream and
downstream genes. Overall, male effect
correlations (corrected for repressive
regulators by multiplying by )1) among
interacting genes were higher than
expected by chance (P = 0.0045).
� 2012 Blackwell Publishing Ltd
T EM P ERA T U R E ST R E SS IN A G EN E N E T WO R K 11
Discussion
In Monterey Bay, on the central coast of California,
warming temperatures over the past century have been
linked to widespread changes in species distributions
and abundances (Barry et al. 1995). We collected adult
S. purpuratus from this region and tested the robustness
of their embryos to further increases in seawater tem-
perature. Current seasonal variation in sea surface tem-
perature in the bay ranges from about 12 �C in the
winter to about 15 �C in the summer (NOAA NVODS
ferret.pmel.noaa.gov ⁄ NVODS). The typical spawning
season of S. purpuratus across its range is December to
March (Strathmann 1987), although ripe females can be
found in June (Pearse et al. 1986). Thus, early embryos
in Monterey Bay are unlikely to experience tempera-
tures above 13–14 �C. However, climate models such as
the A1B scenario of the International Panel on Climate
Change predict that by the year 2010, temperatures in
the bay will increase 1–3 �C (CM2.1U-H2_SresA1B_X1
model from NOAA GFDL, Delworth et al. 2006), poten-
tially bringing June temperatures as high as 17 �C. Even
today, in the southern-most portion of the species’
range, June sea surface temperatures are 17.5 �C (Ced-
ros Island, Mexico. NOAA NVODS), suggesting that
our experimental treatment of 18 �C, while high, is not
unreasonable for this species, and may even be a com-
mon temperature for early embryos from southern pop-
ulations within a century.
In embryos cultured at 18 �C, we observed both an
up-regulation of stress response pathways and changes
in embryonic morphology at the gastrula stage, suggest-
ing that this environment was stressful for embryogene-
sis. Specifically, we observed a decrease in size along the
embryonic animal-vegetal axis in embryos raised at
18 �C, potentially signifying a more rapid depletion of
energy stores during development (Koehn & Bayne
1989; Chen & Chen 1992) or increased asynchrony
between cell division and morphogenesis at a greatly
increased (60% faster) growth rate. On the molecular
level, these effects were reflected by signatures of tem-
perature-induced stress throughout the embryonic tran-
scriptome: a dramatic up-regulation of chaperones;
consistent changes in the regulation of genes involved in
development, RNA processing and metabolism reflective
of developmental stress (Gasch et al. 2000); and subtle,
but potentially important alterations in the expression of
key developmental regulatory genes involved in the sea
urchin endomesodermal and ectodermal gene regulatory
network. Together, these results provide insight into the
molecular mechanisms by which sea urchin embryos use
global stress responses to buffer critical developmental
pathways, and how developmental systems can affect
evolutionary responses to climate change.
� 2012 Blackwell Publishing Ltd
An induction of heat shock gene expression was
expected given similar observations in a wide array of
species (reviewed in Lindquist 1986; Feder & Hofmann
1999). However, such an induction of Hsp70 (or any
other Hsp) had not been previously demonstrated in
S. purpuratus embryos cultured at 18 �C, a relatively
subtle but environmentally relevant thermal stress. All
previous studies on Hsp70 expression in S. purpuratus
embryos had tested the gene expression response to a
sudden, transient and larger increase in temperature
(e.g. Bedard & Brandhorst 1986; Sanders & Martin 1994;
Hammond & Hofmann 2010). In these prior experi-
ments, increased Hsp70 expression was not observed
until temperature shocks reached 21–25 �C. Here, we
have shown that chronic exposure to much lower inten-
sities of thermal stress can induce clear and consistent
heat shock gene expression responses. This is signifi-
cant, given that global climate change will probably
involve continual exposure to more moderate tempera-
ture increases. A detailed comparison of gene expres-
sion responses to chronic vs. transient high
temperatures is an important avenue for future study.
While transcriptome-wide measures of stress
responses are useful for discovering important cellular,
developmental and physiological processes, we were
also interested in how developmental mechanisms of
gene regulation would be affected by environmental
stress. By themselves, changes in the expression of indi-
vidual genes provide little insight into the impact of
environmental change on developmental processes. It is
difficult to know whether a given change in the expres-
sion of a particular gene might have functional conse-
quences within the organism, as the threshold for
downstream effects is likely to be different for every
gene (Oleksiak et al. 2005).
We therefore focused attention on the regulation of a
smaller set of genes that compose an exceptionally well-
studied gene regulatory network (Davidson et al. 2002;
Angerer & Angerer 2003; Oliveri et al. 2008; Peter &
Davidson 2010), namely the endomesodermal and ecto-
dermal developmental network. Within the context of
this network, we hypothesized that the importance of a
perturbation to a particular gene could be measured, at
least in part, by assessing the correlation between that
perturbation and perturbations to the downstream
genes that the focal gene is known to regulate. In this
way, an explicit regulatory network provides a partial
solution to the problem of classifying ‘important’ vs.
‘unimportant’ changes in gene expression. Certainly,
many developmental genes have functions beyond their
role within known networks. However, within a net-
work, specific predictions can be made about the out-
come of perturbations to particular genes, and these
predictions can be tested by comparison with the
12 D. E . RUN CIE ET AL.
observed data. Here, we tested if either temperature
perturbations or functional genetic variants segregating
in wild sea urchins are transmitted through known
gene regulatory relationships.
Overall, we found that environmental perturbations
to the expression of the network genes were well buf-
fered, at least at the 15 and 18 �C temperatures we
tested. We did observe effects of higher temperature on
several genes in the network, but there was no evidence
that perturbations to upstream genes were transmitted
through the network to their downstream regulatory
targets. For example, the two most up- and down-
regulated genes with known upstream regulators in the
network were Brn1 ⁄ 2 ⁄ 4 and FoxB, respectively (Figs 3
and 4). Brn1 ⁄ 2 ⁄ 4 is a midgut-specific transcription factor
with a later role in the regulation of Endo16 (Yuh et al.
2005). FoxB is a forkhead transcription factor involved
in skeletal differentiation in the embryos (Tu et al.
2006). At the developmental stage we measured,
Brn1 ⁄ 2 ⁄ 4 has no known downstream targets but is itself
positively regulated by GataE, Blimp1-Krox and Otx
(Fig. 4). Brn1 ⁄ 2 ⁄ 4 was significantly up-regulated at
18 �C, but GataE appeared slightly down-regulated, Otx
slightly up-regulated and Blimp1-Krox was unchanged
at 18 �C (Fig. 3, although none of these latter effects
were significant). FoxB is activated by three other skele-
togenic transcription factors: Alx1, Ets1 and Tbr (Fig. 4,
Oliveri et al. 2008). While FoxB was down-regulated at
18 �C, Alx1, Ets1 and Tbr were all virtually unchanged
(Figs 3 and 4). In both of these cases, the expression
plasticity of the downstream genes (Brn1 ⁄ 2 ⁄ 4 or FoxB)
could not be explained by similar plasticity in their reg-
ulators. We observed similar patterns of low correlation
between the expression levels of regulatory genes and
their targets throughout the network (Fig. 4).
Furthermore, temperature effects on individual genes
increased gradually with higher temperatures, suggest-
ing that the overall network state did not change dra-
matically at 18 �C. One explanation for the observed
robustness of this network to temperature may be that
the parameters we measured—slight variations in
steady-state transcript levels—were not sufficient to per-
turb its dynamics. Using a dynamic model of a devel-
opmental network, Bolouri & Davidson (2003) showed
that when transcription factors act cooperatively to acti-
vate downstream genes, the behaviour of each interac-
tion becomes switch like. Above some threshold,
further increases in the expression of an upstream regu-
lator have little effect on downstream expression. In this
model, steady-state transcript levels do not dictate net-
work dynamics. Instead, it is primarily the rates of ini-
tial activation of each gene that determine the
progression of network states during development. Sea
urchin development does accelerate at higher tempera-
tures. However, previous studies have shown that this
acceleration is constant across stages such that the tim-
ing of emergence of different structures is reliable (Fu-
jisawa 1993). Thus, switch-like regulation of genes in
this network may buffer temperature effects on the
steady-state transcript levels as long as the relative rates
of induction among genes do not change.
It is perhaps not surprising that these sea urchins are
highly capable of buffering the effects of thermal stress
on development: given this species’ enormous effective
population size, abundant genetic variation and the
extensive gene flow among populations that experience
widely varying temperatures (Palumbi & Wilson 1990;
Pespeni et al. 2011), selection for alleles that promote
robust development across temperatures may be very
efficient. However, while temperature effects and
female parent effects (which include nongenetic mater-
nal influences) did not appear to perturb network func-
tion, male parent (purely genetic) effects did. This was
not simply owing to the fact that male parent effects
were larger than temperature effects; female parent
effects were larger still and yet were buffered in the
network. Population genetic models predict that a large
population size and high genetic variation should also
promote the evolution of genetic robustness. In these
models, only pleiotropy among the genes involved
should limit the evolution of environmental robustness,
but genetic robustness may not be favoured with strong
stabilizing selection (Wagner et al. 1997; Rice 2000).
Under these conditions, deleterious alleles are rapidly
purged before buffering (canalization) mechanisms can
evolve. Given the critical role that the endomesoderm
and ectoderm genetic network plays in sea urchin
development, and the conservation of modules of the
network over long evolutionary periods (Hinman &
Davidson 2007), it is reasonable to assume that the net-
work’s function is under strong stabilizing selection.
Thus, it may be that the observed genetic variation in
the network is at this canalization limit.
This contrast between genetic effects and temperature
effects provides insight into a long-standing unresolved
question regarding the evolution of robustness: whether
environmental and genetic perturbations are buffered
by the same mechanisms (Meiklejohn & Hartl 2002;
Visser et al. 2003). In this comparison at least, it appears
that the effects of temperature on expression were buf-
fered out by the system almost immediately, while
genetic effects persisted and influenced downstream
developmental events. Nevertheless, the overall devel-
opmental system was robust to both forms of perturba-
tion: embryos at all temperatures and from all parents
developed successfully through embryogenesis to the
larval stage. At this very local level of regulation, the
mechanisms of robustness appear distinct.
� 2012 Blackwell Publishing Ltd
T EM P ERA T U R E ST R E SS IN A G EN E N E T WO R K 13
The robustness of our network to female parent
effects seems to contradict this hypothesis as the same
diversity of genetic effects passed on by male parents
will also contribute to female parent effects. However,
a dominant source of maternal effect variation in sea
urchin development is thought to be variability in the
quality and quantity of nutritional stores provided in
the egg. Variation in egg provisioning is known to be
common in echinoderms—between females from deep
and shallow water (Bertram & Strathmann 1998), or
from sheltered and exposed habitats (George 1999).
Thus, buffers may have evolved to compensate for
variability in egg quality, swamping the signal of the
remaining female-associated genetic perturbations. In
support of this hypothesis, we observed variation in
the heat shock response (Hsp70 and Hsp90 expression)
among embryos with different female parents, but not
male parents. Confirming these trends will require
further study across networks, species and environ-
ments.
Finally, despite abundant functional genetic variation
for gene expression among genes in the network, we
observed very little evidence that genetic effects were
altered by environmental stress. Such GEIs are impor-
tant for evolving phenotypic plasticity and tolerance of
novel environments (Via & Lande 1985; Schlichting &
Pigliucci 1993). We found only five examples of parent-
by-temperature variation in gene expression, and all
involved differences in female effect responses to tem-
perature. Thus, we could not rule out the possibility
that all such apparent GEIs were entirely owing to non-
genetic maternal effects. We can only conclude that, at
least in this network, the higher temperatures that
southern populations of S. purpuratus will soon experi-
ence (according to climate models of near-future climate
change) are unlikely to lead to a sudden release of pre-
viously cryptic genetic variation and a boost in evolu-
tionary innovation (Masel 2006). This scenario may
stem directly from effective buffering of temperature
effects in the network: if regulatory function (rather
than just expression level) is robust to perturbations,
there may be little opportunity for GEIs to arise.
The buffering of environmental and genetic perturba-
tions we have documented is a system-level feature of
this gene regulatory network; they could not have been
detected by studying individual genes, nor studied with-
out detailed prior knowledge of gene interrelations.
Analyses of similar networks will be crucial to placing
our results in context. Based on our RNA-seq analysis,
the genes of the endomesodermal and ectodermal devel-
opmental network in the embryo were typical in both
their frequency and magnitude of plasticity to tempera-
ture stress relative to most other genes transcriptome-
wide. As in our focal network, higher temperatures only
� 2012 Blackwell Publishing Ltd
subtly altered the expressions of the majority of genes in
the embryo. Instead, major temperature responses
appeared restricted to a limited number of stress
response, metabolic and signalling pathways. Thus, it
seems likely that the patterns of functional genetic varia-
tion and GEIs in gene expression that we observed in
the endomesodermal and ectodermal developmental
network will be typical of many other regulatory net-
works in the embryos. However, it will be interesting to
assess levels of genetic and GEI variation in networks
directly related to thermal stress or immunity and
defence in embryos, as evolution in these pathways may
be the most critical for near-term adaptation. Impor-
tantly, the organization of the gene regulatory network
may influence the course of evolution by allowing popu-
lations to tolerate rapid temperature changes, or by
channelling the pleiotropy of genetic variants in ways
that could affect responses of the developmental system
to natural selection. Tracking this system in the future as
marine climates continue to change will be broadly
informative for understanding the evolution of robust-
ness during development and the behaviour of genetic
systems under environmental change.
Acknowledgements
This work was supported by the NSF (DEB 0614509 to GAW),
NIH (5P-50-GM-081883 to the Duke Center for Systems Biol-
ogy) and the Sigma Xi (Grant-in-Aid to DER). The authors
would like to thank the staff of the Duke University Phytotron
for technical assistance and L Warner, J Tung, D Des Marais, D
McCandlish and two anonymous reviewers for helpful com-
ments on this manuscript.
References
Abramoff MD, Magelhaes PJ, Ram SJ (2004) Image processing
with ImageJ. Biophotonics international, 11, 36–42.
Andronikov V (1975) Heat resistance of gametes of marine
invertebrates in relation to temperature conditions under
which the species exist. Marine Biology, 30, 1–11.
Angerer LM, Angerer RC (2003) Patterning the Sea urchin
embryo: gene regulatory networks, signaling pathways, and
cellular interactions. Current Topics in Developmental Biology,
53, 159–198.
Azad AK, Pearce CM, McKinley RS (2011) Influence of
stocking density and temperature on early development and
survival of the purple sea urchin, Strongylocentrotus
purpuratus (Stimpson, 1857). Aquaculture Research, 1–15. DOI:
10.1111/j.1365-2109.2011.02960.x.
Barry JP, Baxter CH, Sagarin RD, Gilman SE (1995) Climate-
related, long-term faunal changes in a California rocky
intertidal community. Science, 267, 672–675.
Basch L, Tegner M (2007) Reproductive responses of purple
sea urchin (Strongylocentrotus purpuratus) populations to
environmental conditions across a coastal depth gradient.
Bulletin of Marine Science, 81, 255–282.
14 D. E . RUN CIE ET AL.
Bedard PA, Brandhorst BP (1986) Translational activation of
maternal mRNA encoding the heat-shock protein hsp90
during sea urchin embryogenesis. Developmental Biology, 117,
286–293.
Benjamini Y, Hochberg Y (1995) Controlling the false discovery
rate—a practical and powerful approach to multiple testing.
Journal of the Royal Statistical Society. Series B (Methodological),
57, 289–300.
Bertram D, Strathmann R (1998) Effects of maternal and larval
nutrition on growth and form of planktotrophic larvae.
Ecology, 79, 315–327.
Bolouri H, Davidson EH (2003) Transcriptional regulatory
cascades in development: initial rates, not steady state,
determine network kinetics. Proceedings of the National Academy
of Sciences of the United States of America, 100, 9371–9376.
Burger R, Lynch M (1997) Evolution and extinction in a
changing environment: a quantitative-genetic analysis.
Evolution, 49, 151–163.
Byrne M, Selvakumaraswamy P, Ho MA, Woolsey E, Nguyen
HD (2011) Sea urchin development in a global change
hotspot, potential for southerly migration of thermotolerant
propagules. Deep Sea Research Part II: Topical Studies in
Oceanography, 58, 712–719.
Chen C, Chen B (1992) Effects of high temperature on larval
development and metamorphosis of Arachnoides placenta
(Echinodermata: Echinoidea). Marine Biology, 122, 445–449.
Cochran RC, Engelmann F (1975) Environmental regulation of
the annual reproductive season of Strongylocentrotus
purpuratus (Stimpson). Biological Bulletin, 148, 393–401.
Comstock R, Robinson H (1948) The components of genetic
variance in populations of biparental progenies and their use
in estimating the average degree of dominance. Biometrics, 4,
254–266.
Davidson EH, Rast JP, Oliveri P, et al. (2002) A genomic
regulatory network for development. Science, 295, 1669–1678.
Delworth TL, Broccoli AJ, Rosati A, et al. (2006) GFDL’s CM2
global coupled climate models. Part I: formulation and
simulation characteristics. Journal of Climate, 19, 643–674.
Edmands S, Moberg P, Burton R (1996) Allozyme and
mitochondrial DNA evidence of population subdivision in
the purple sea urchin Strongylocentrotus purpuratus. Marine
Biology, 126, 443–450.
Farmanfarmaian A, Giese A (1963) Thermal tolerance and
acclimation in the western Purple Sea urchin,
Strongylocentrotus purpuratus. Physiological Zoology, 36, 237–243.
Feder ME, Hofmann GE (1999) Heat-shock proteins, molecular
chaperones, and the stress response: evolutionary and
ecological physiology. Annual Review of Physiology, 61, 243–282.
Fujisawa H (1989) Differences in temperature dependence of
early development of sea urchins with different growing
seasons. Biological Bulletin, 176, 96.
Fujisawa H (1993) Temperature sensitivity of a hybrid between
two species of sea urchin differing in thermotolerance.
Development Growth and Differentiation, 35, 395–401.
Fujisawa H, Shigei M (1990) Correlation of embryonic
temperature sensitivity of sea-urchins with spawning season.
Journal of Experimental Marine Biology and Ecology, 136, 123–
139.
Gasch AP, Spellman PT, Kao CM, et al. (2000) Genomic expression
programs in the response of yeast cells to environmental
changes. Molecular Biology of the Cell, 11, 4241–4257.
George SB (1999) Egg quality, larval growth and phenotypic
plasticity in a forcipulate seastar. Journal of Experimental
Marine Biology and Ecology, 237, 203–224.
Gibson G, Dworkin I (2004) Uncovering cryptic genetic
variation. Nature Reviews Genetics, 5, 681–690.
Gienapp P, Teplitsky C, Alho JS, Mills JA, Merila J (2008)
Climate change and evolution: disentangling environmental
and genetic responses. Molecular Ecology, 17, 167–178.
Giese A, Farmanfarmaian A (1963) Resistance of the purple sea
urchin to osmotic stress. Biological Bulletin, 124, 182.
Hammond LM, Hofmann GE (2010) Thermal tolerance of
Strongylocentrotus purpuratus early life history stages:
mortality, stress-induced gene expression and biogeographic
patterns. Marine Biology, 157, 2677–2687.
Hellemans J, Mortier G, Paepe AD, Speleman F, Vandesompele J
(2007) qBase relative quantification framework and software
for management and automated analysis of real-time
quantitative PCR data. Genome Biology, 8, R19.
Hinman VF, Davidson EH (2007) Evolutionary plasticity of
developmental gene regulatory network architecture.
Proceedings of the National Academy of Sciences, 104, 19404–
19409.
Hochachka PW, Somero GN (2002) Biochemical Adaptation:
Mechanism and Process in Physiological Evolution, 1st edn.
Oxford University Press, New York, NY, USA.
Hoffmann AA, Hercus M (2000) Environmental stress as an
evolutionary force. BioScience, 50, 217–226.
Huey RB (1974) Behavioral thermoregulation in lizards—
importance of associated costs. Science, 184, 1001–1003.
Huey RB et al. (2009) Why tropical forest lizards are
vulnerable to climate warming. Proceedings of the Royal
Society. B, Biological Sciences, 276, 1939–1948.
IPCC (2007) Climate Change 2007: Synthesis Report. IPCC,
Cambridge University Press, Cambridge, UK.
Kellermann V, Heerwaarden BV, Sgro C, Hoffmann AA
(2009) Fundamental evolutionary limits in ecological traits
drive Drosophila species distributions. Science, 325, 1244–
1246.
Kenner MC (1992) Population dynamics of the sea urchin
Strongylocentrotus purpuratus in a Central California kelp
forest: recruitment, mortality, growth, and diet. Marine
Biology, 112, 107–118.
Koehn RK, Bayne BL (1989) Towards a physiological and
genetical understanding of the energetics of the stress
response. Biological Journal of the Linean Society, 37, 157–171.
Kuhn K, Baker S, Chudin E, et al. (2004) A novel, high-
performance random array platform for quantitative gene
expression profiling. Genome Research, 14, 2347–2356.
Langmead B, Trapnell C, Pop M, Salzberg SL (2009) Ultrafast
and memory-efficient alignment of short DNA sequences to
the human genome. Genome Biology, 10, R25.
Lindquist S (1986) The heat-shock response. Annual Reviews
Biochemistry, 55, 1151–1191.
Lindsley DE, Poodry CA (1977) A reversible temperature-
induced developmental arrest in Drosophila. Developmental
Biology, 56, 213–218.
Loeb J (1916) The Organism as a Whole, From a Physicochemical
Viewpoint. Putnam’s Sons, New York, NY.
Longabaugh WJR, Davidson EH, Bolouri H (2005)
Computational representation of developmental genetic
regulatory networks. Developmental Biology, 283, 1–16.
� 2012 Blackwell Publishing Ltd
T EM P ERA T U R E ST R E SS IN A G EN E N E T WO R K 15
Lynch M, Walsh B (1998) Genetics and Analysis of Quantitative
Traits, 1st edn. Sinauer Associates Inc, Sunderland, MA.
Masel J (2006) Cryptic genetic variation is enriched for
potential adaptations. Genetics, 172, 1985–1991.
McCarthy DJ, Chen Y, Smyth GK (2012) Differential expression
analysis of multifactor RNA-Seq experiments with respect to
biological variation. Nucleic Acids Research, 40, 4288–4297.
Meiklejohn C, Hartl D (2002) A single mode of canalization.
Trends in Ecology & Evolution, 17, 468–473.
Oleksiak MF, Roach JL, Crawford DL (2005) Natural variation
in cardiac metabolism and gene expression in Fundulus
heteroclitus. Nature Genetics, 37, 67–72.
Oliver TA, Garfield DA, Manier MK, Haygood R, Wray GA,
Palumbi SR (2010) Whole-genome positive selection and
habitat-driven evolution in a shallow and a deep-sea urchin.
Genome Biology and Evolution, 2, 800–814.
Oliveri P, Tu Q, Davidson E (2008) Global regulatory logic for
specification of an embryonic cell lineage. Proceedings of the
National Academy of Sciences of the United States of America,
105, 5955–5962.
Osovitz C, Hofmann GE (2005) Thermal history-dependent
expression of the hsp70 gene in purple sea urchins:
biogeographic patterns and the effect of temperature
acclimation. Journal of Experimental Marine Biology and
Ecology, 327, 134–143.
Palumbi SR, Wilson AC (1990) Mitochondrial DNA diversity in
the sea urchins Strongylocentrotus purpuratus and
S. droebachiensis. Evolution, 44, 403–415.
Parmesan C, Yohe G (2003) A globally coherent fingerprint of
climate change impacts across natural systems. Nature, 421,
37–42.
Pearse JS (2006) Ecological role of purple sea urchins. Science,
314, 940–941.
Pearse JS, Pearse VB, Davis KK (1986) Photoperiodic regulation
of gametogenesis and growth in the sea urchin
Strongylocentrotus purpuratus. Journal of Experimental Zoology,
237, 107–118.
Pespeni MH, Garfield DA, Manier MK, Palumbi SR (2011)
Genome-wide polymorphisms show unexpected targets of
natural selection. Proceedings of the Royal Society. B, Biological
Sciences, 279, 1412–1420.
Peter IS, Davidson EH (2010) The endoderm gene regulatory
network in sea urchin embryos up to mid-blastula stage.
Developmental Biology, 340, 188–199.
Pfaffl M (2001) A new mathematical model for relative
quantification in real-time RT-PCR. Nucleic Acids Research, 29,
e45.
Pfennig DW, Wund MA, Snell-Rood EC, Cruickshank T,
Schlichting CD, Moczek AP (2010) Phenotypic plasticity’s
impacts on diversification and speciation. Trends in Ecology &
Evolution, 25, 459–467.
R Development Core Team (2010) R: A Language and
Environment for Statistical Computing. R Foundation for
Statistical Computing, Vienna, Austria.
Rice SH (2000) The evolution of developmental interactions:
epistasis, canalization, and integration. In: Epistasis and
the Evolutionary Process (eds Wolf JBW, Brodie ED and
Wade MJ), pp. 1–17. Oxford University Press, New York, NY
USA.
Richter K, Haslbeck M, Buchner J (2010) The heat shock
response: life on the verge of death. Molecular Cell, 40, 253–266.
� 2012 Blackwell Publishing Ltd
Robinson MD, McCarthy DJ, Smyth GK (2010) edgeR: a
Bioconductor package for differential expression analysis of
digital gene expression data. Bioinformatics, 26, 139–140.
Roepke TA, Snyder MJ, Cherr GN (2005) Estradiol and
endocrine disrupting compounds adversely affect
development of sea urchin embryos at environmentally
relevant concentrations. Aquatic Toxicology, 71, 155–173.
Root TL, Price JT, Hall KR, Schneider SH, Rosenzweig C,
Pounds JA (2003) Fingerprints of global warming on wild
animals and plants. Nature, 421, 57–60.
Sanders B, Martin L (1994) Copper inhibits the induction of
stress protein synthesis by elevated temperatures in embryos
of the sea urchin Strongylocentrus purpuratus. Comparative
Biochemistry and Physiology. Part C, Pharmacology, Toxicology
& Endocrinology, 109C(3), 295–307.
Schlichting CD (2008) Hidden reaction norms, cryptic genetic
variation, and evolvability. Annals of the New York Academy of
Sciences, 1133, 187–203.
Schlichting CD, Pigliucci M (1993) Control of phenotypic
plasticity via regulatory genes. The American Naturalist,
142(2), 366–370.
Sewell M, Young C (1999) Temperature limits to fertilization
and early development in the tropical sea urchin Echinometra
lucunter. Journal of Experimental Marine Biology and Ecology,
236, 291–305.
Sodergren E, Weinstock G, Davidson E, et al. (2006) The
genome of the sea urchin Strongylocentrotus purpuratus.
Science, 314, 941–952.
Somero GN (2010) The physiology of climate change: how
potentials for acclimatization and genetic adaptation will
determine ‘winners’ and ‘‘losers’’. Journal of Experimental
Biology, 213, 912–920.
Strathmann MF (1987) Reproduction and Development of Marine
Invertebrates of the Northern Pacific Coast, data and methods
for the study of eggs, embryos, and larvae. Univ of
Washington Pr, Seattle, WA, USA.
Todgham AE, Hofmann GE (2009) Transcriptomic response of
sea urchin larvae Strongylocentrotus purpuratus to CO2-driven
seawater acidification. Journal of Experimental Biology, 212,
2579–2594.
Tomanek L (2010) Variation in the heat shock response and its
implication for predicting the effect of global climate change
on species’ biogeographical distribution ranges and
metabolic costs. Journal of Experimental Biology, 213, 971–979.
Tu Q, Brown CT, Davidson EH, Oliveri P (2006) Sea urchin
Forkhead gene family: phylogeny and embryonic expression.
Developmental Biology, 300, 49–62.
Via S, Lande R (1985) Genotype-environment interaction
and the evolution of phenotypic plasticity. Evolution, 39, 505–
522.
Visser J, Hermisson J, Wagner G (2003) Perspective: evolution
and detection of genetic robustness. Evolution, 57, 1959–1972.
Wagner G, Booth G, Bagheri H (1997) A population genetic
theory of canalization. Evolution, 51, 329–347.
Wray G, Kitazawa C, Miner B (2004) Culture of echinoderm
larvae through metamorphosis. Methods in Cell Biology, 74,
75–86.
Yuh C-H, Dorman ER, Davidson EH (2005) Brn1 ⁄ 2 ⁄ 4, the
predicted midgut regulator of the endo16 gene of the sea
urchin embryo. Developmental Biology, 281, 286–298.
16 D. E . RUN CIE ET AL.
The authors are broadly interested in linking population genet-
ics, developmental biology, ecology and genetics in the study
of evolution and climate change. D.E.R. studies quantitative
genetics and ecological developmental biology, primarily
focusing on climate change factors in sea urchins. D.A.G. stu-
dies the population genetics of developmental evolution.
C.C.B. studies human and primate evolution and is interested
in the evolution of gene regulation. J.A.W. studies sea urchin
development and morphogenesis. SM studies statistical
approaches to high dimensional data. G.A.W. focuses on the
evolution of evolution of development and genomes.
Data accessibility
qPCR and morphology data are in the supporting online mate-
rials. DASL and RNA-seq gene expression data are deposited
in NCBI GEO: Series GSE29504. R scripts for all analyses have
been deposited in the Dryad repository: http://dx.doi:10.5061/
dryad.36md8.
DR designed research, performed research, analysed data and
wrote the paper. DG designed research and performed
research. CB performed RNA-seq. JW performed qPCR. SM
analysed data. GW designed research.
Supporting information
Additional supporting information may be found in the online
version of this article.
Table S1 Primer sequences, amplification efficiencies and origi-
nal citations for the qPCR assays used to assay Hsp 70 and Hsp
90 expression.
Table S2 Raw qPCR data on Hsp70 and Hsp90.
Table S3 Sample info for RNA-seq.
Table S4 Annotation information for developmental genes
assayed by DASL.
Table S5 Gene network relationships among target develop-
mental genes.
Table S6 Female parent effects on heat shock gene expression
at 18C but not 12C.
Table S7 Embryo morphology data.
Table S8 Prior hyperparameters used in this study.
Fig. S1 Dendrograms showing relationships among signifi-
cantly enriched PANTHER categories for up- (A) and down-
(B) regulated genes.
Fig. S2 Estimates of temperature responses by RNA-seq and
DASL were consistent.
Fig. S3 Percentage of variation in gene expression explained by
temperature, stage and parental effects.
Fig. S4 Cultures were slightly more variable at higher tempera-
tures, and differences in sampling time by temperature was
small.
Appendix S1 Supplemental methods.
Please note: Wiley-Blackwell are not responsible for the content
or functionality of any supporting information supplied by the
authors. Any queries (other than missing material) should be
directed to the corresponding author for the article.
� 2012 Blackwell Publishing Ltd