Embed Size (px)
Citation preview

RHEOLOGY OF POROUS RHYOLITE
by
GENEVIEVE ROBERT
B.Sc. (Honours), McGill University, 2005
A THESIS SUBMITThD IN PARTIAL FULLFILMENT OFTHE REQUIREMENTS FOR THE DEGREE OF
MASTER OF SCIENCE
in
THE FACULTY OF GRADUATE STUDIES
(Geological Sciences)
THE UNIVERSITY OF BRITISH COLUMBIA(Vancouver)
March 2008
© Genevieve Robert, 2008

ABSTRACT
I describe an experimental apparatus used to perform deformation experiments
relevant to volcanology. The apparatus supports low-load, high-temperature deformation
experiments under dry and wet conditions on natural and synthetic samples. The
experiments recover the transient rheology of complex (melt ± porosity ± solids) volcanic
materials during uniaxial deformation. The key component to this apparatus is a steel
cell designed for high-temperature deformation experiments under controlled water
pressure. Experiments are run under constant displacement rates or constant loads; the
range of accessible experimental conditions include: 25 - 1100 °C, load stresses 0 to 150
MPa, strain rates 106 to 102 i, and fluid pressures 0-150 MPa.
I present a suite of high-temperature, uniaxial deformation experiments performed
on 25 by 50 mm unjacketed cores of porous (-0.8) sintered rhyolitic ash. The
experiments were performed at, both, atmospheric (dry) and elevated water pressure
conditions (wet). Dry experiments were conducted mainly at 900 °C, but also included a
suite of lower temperature experiments at 850, 800 and 750 °C. Wet experiments were
performed at —650 °C under water pressures of 1, 2.5, 3, and 5 IVJPa, and at a fixed PH2O
of 2.5 MPa for temperatures of -385, 450, and 550 °C. During deformation, strain is
manifest by shortening of the cores, reduction of porosity, flattening of ash particles, and
radial bulging of the cores. The continuous reduction of porosity leads to a dynamic
transient strain-dependent rheology and requires strain to be partitioned between a
volume (porosity loss) and a shear (radial bulging) component. The effect of increasing
porosity is to expand the window for viscous deformation for dry melts by delaying the
onset of brittle deformation by -50 °C (875 °C to 825 °C). The effect is more
11

pronounced in hydrous melts (--0.67 — 0.78 wt. % H20) where the viscous to brittle
transition is depressed by --140 to 150 °C. Increasing water pressure also delays the onset
of strain hardening due to compaction-driven porosity reduction. These rheological data
are pertinent to volcanic processes where high-temperature porous magmas I liquids are
encountered (e.g., magma flow in conduits, welding of pyroclastic materials).
111

TABLE OF CONTENTS
ABSTRACT iiTABLE OF CONTENTS ivLIST OF TABLES viLIST OF FIGURES viiPREFACE viiiACKNOWLEDGEMENTS xCO-AUTHORSHIP STATEMENT xii
CHAPTER I: Introduction 11.1 Context 11.2 Previous studies 11.3 Goals and approach 51.4 References 7
CHAPTER II: The fluid cell 92.1 Introduction 92.2 Experimental apparatus 10
2.2.1 Fluid cell 112.2.2 Temperature calibration 13
2.3 Calibration for viscosity 142.4 Volcanological experiments 15
2.4.1 Materials 152.4.2 Experiments 192.4.3 Textural analysis of experiments 23
2.5 Discussion 24
2.6 Acknowledgements 27
2.7 Appendix 2.A: Melt viscosity of the Rattlesnake Tuff ash 28
2.8 References 30
CHAPTER III: Deformation experiments 34
3.1 Introduction 34
3.2 Experimental methods 37
3.2.1 Experimental apparatus 37
3.2.2 Fabrication of experimental cores 38
3.2.3 Pre-experimental sample characterization 41
3.3 Experimental results 44
3.3.1 Overview 44
3.3.2 Dry high-T experiments 44
3.3.3 Wet high-T experiments 46
3.3.4 Textural analysis of experimental cores 48
3.4 Post-experimental physical properties 50
3.4.1 Porosity 50
3.4.2 Water content 54
3.5 Analysis of experimental results 56
iv

3.5.1 Effect of temperature and PH2O 563.5.2 Analysis of strain 603.5.3 Effective viscosity 63
3.6 Discussion 673.7 Acknowledgements 753.8 Appendix 3.A: Correction for dwell-time effects 753.9 Appendix 3.B: Water contents of samples 783.10 References 82
CHAPTER IV: Discussion 864.1 Water 864.2 Experimental design modifications 904.3 Temperature gradient 914.4 Pore size distribution and pore shape 924.5 References 94
CHAPTER V: Summary 96
APPENDIX A: Cell design 98APPENDIX B: Data acquisition 100APPENDIX C: Experimental data 101APPENDIX D: Data processing 103
v

LIST OF TABLES
Table 2.1 Summary of calibration and deformation experiments, including conditions,properties, and composition of samples 16
Table 2.2 Measured values of viscosity for glass from melted Rattlesnake Tuff ash andVFT coefficients (A, B, C) 25
Table 3.1 Chemical composition of the Rattlesnake Tuff ash 40Table 3.2 Experimental conditions used in deformation experiments and geometry of
sample cores pre- and post-experiment 42Table 3.3 Measured values of density and porosity for pre- and post-experiment sample
cores 43Table 3.4 Analysis of strain 45Table 3.B Values of H20 and LOT (wt.%) for post-experiment cores 80
vi

LIST OF FIGURES
Figure 2.1 Experimental apparatus 12Figure 2.2 Temperature and viscosity calibration 18Figure 2.3 Pre- and post-experimental products 20Figure 2.4 Experimental results 22Figure 3.1 Overview of previous experimental studies 35Figure 3.2 Starting experimental materials 39Figure 3.3 Summary of experimental data 47Figure 3.4 Textural evolution of samples due to deformation 49Figure 3.5 Nature and distribution of porosity in sample cores 52Figure 3.6 Volume strain 55Figure 3.7 Effect of temperature and PH2O 59Figure 3.8 Analysis of strain 62Figure 3.9 Summary of apparent viscosity 64Figure 3.10 Textural comparison of samples run under dry and wet conditions 69Figure 3.11 Glass transition and relaxation timescale 73Figure 3.A Systematic corrections to experimental data 77Figure 3.B Bulk water contents of experimental samples 79Figure 4.1 Proportion of isolated porosity with deformation 87Figure A.1 Water cell design 99Figure C.1 Experiment RSO3 102
vii

PREFACE
This research comprises two complementary manuscripts prepared for publication
in peer-reviewed international scientific journals. Chapter II is published in the
American Mineralogist, under the title “High-temperature deformation of volcanic
materials in the presence of water”. I am senior author, and my co-authors are 3. K.
Russell, Daniele Giordano, and Claudia Romano. Cliff Shaw (University of New
Brunswick) and Luigi Burlini (ETH Zurich) were journal reviewers. This chapter
presents the design and calibration of a new apparatus to run uniaxial deformation
experiments on volcanic materials under temperature and water pressure conditions
relevant to volcanologic processes. The original design of the apparatus is by Daniele
Giordano with technical advice from Oliver Spieler. Ray Rodway is responsible for
machining the apparatus and helping with subsequent design changes. My experimental
work was the basis for making design modifications to improve the performance of the
apparatus.
Chapter III has been submitted for publication under the title “Rheology of porous
volcanic materials: High-temperature experimentation under controlled water pressure”
in a special volume of Chemical Geology (8th Silicate Melt Workshop, Eds. D.B.
Dingwell, R. Moretti, P. Richet), and is currently under review. I co-authored the
manuscript with 3. K. Russell and Daniele Giordano. Chapter III presents a series of
high-temperature deformation experiments run on porous aggregates of sintered volcanic
ash under both wet and dry conditions. The experiments are organized to show the
effects of (i) water pressure, and (ii) temperature on the rheological behaviour porous
volcanic materials.
viii

Pre- and post-experimental physical properties of samples, including length,
radius, mass, density, total, connected, and isolated porosity are reported in chapter III, as
well as characteristic textures of the run-products, bulk water content and whole rock
chemistry. Whole rock analyses of starting materials and run-products, including bulk
water, were performed by ALS Chemex. Karl-Fischer Titration analyses of water content
on the samples were performed by Daniele Giordano at ETH Zurich.
Chapters IV and V provide a discussion of the entire research program, including
a summary of the main results and the potential avenues for future work, respectively.
The discussion also addresses issues that were not necessarily considered prior to or
during experimentation. Four appendices are used to include detailed cell design,
complete data sets, and data processing methods.
ix

ACKNOWLEDGEMENTS
Financial support for my M.Sc. was provided by an NSERC PGS-M Scholarship.
Costs to build the experimental apparatus were met by an NSERC RTI Grant “High
temperature experiments on porosity and permeability evolution in volcanic systems”
held by J.K. Russell, G.M. Dipple, and L.A. Kennedy. Operational costs for the research
were covered by an NSERC Discovery Grant held by J.K. Russell.
Nils, I wouldn’t have made it through any of this without you, and I definitely
wouldn’t have had this much fun. I owe you a lifetime supply of Sortilège, and I shall
deliver it myself, wherever in the world you may be. Stephen, thank you for your great
listening skills, and thanks for all the fish. Krista, R-E, Curtis, Jackie, thanks for letting
me shuffle your workspace whenever i so desired. You have all contributed to my
success by keeping me in equilibrium. I am grateful I have such great people around me
making this academic experience a great life experience too. I have made friends here I
wish to keep for life.
Kelly, I want to thank you for giving me so many great opportunities and for your
guidance and unconditional support throughout this Masters, but especially for countless
scientific discussions where I felt like a colleague rather than a student. Lori, it is always
a pleasure to discuss ideas, problems and results from my experiments with someone who
understands how many hours of work one little piece of experimental data actually
represents. Mark, you brought thoughtful and unexpected arguments to our scientific
discussions, making me think and investigate further.
Thank you to Daniele, Ben and Steve for being such enthusiastic experimental lab
colleagues, and to Ben especially for bringing a different perspective to my research,
x

always being available and interested, and for being such a great friend on top of it all. I
am forever grateful to Ray Rodway for providing the technical support that made it all
possible. En terminant, je tiens a remercier tout particulièrement ma famille. Papa,
maman et Polo, tout au long de mes etudes, votre soutien et vos encouragements
m’ auront permis de réaliser mes ambitions. Je vous aime.
xi

CO-AUTHORSHIP STATEMENT
This thesis comprises two complementary manuscripts prepared for publication in
peer-reviewed international scientific journals. Chapter II is published in the American
Mineralogist, under the title “High-temperature deformation of volcanic materials in the
presence of water”. I am senior author, and my co-authors are J. K. Russell, Daniele
Giordano, and Claudia Romano. Chapter II presents the design and calibration of a new
apparatus to run uniaxial deformation experiments on volcanic materials under
temperature and water pressure conditions relevant to volcanologic processes. The
experimental cell was conceptualized by my supervisor (J.K. Russell) and was originally
designed by Daniele Giordano with technical advice from Oliver Spieler. Ray Rodway is
responsible for machining the apparatus and helping with subsequent design changes.
My experimental work was the basis for making design modifications to improve the
performance of the apparatus. I performed all calibration experiments, all experiments on
natural materials, and all experimental data reduction and analysis.
Chapter III has been submitted for publication under the title “Rheology of porous
volcanic materials: High-temperature experimentation under controlled water pressure”
in a special volume of Chemical Geology (8th Silicate Melt Workshop, Eds. D.B.
Dingwell, R. Moretti, P. Richet), and is currently under review. I am senior author, and
my co-authors are J. K. Russell and Daniele Giordano. Chapter III presents a series of
high-temperature deformation experiments that I performed on porous aggregates of
sintered volcanic ash under both wet and dry conditions.
In chapter III, I report measurements I made of pre- and post-experimental
physical properties of samples, including length, radius, mass, density, total, connected,
xii

and isolated porosity, as well as characteristic textures of the run-products, bulk water
content and whole rock chemistry. The whole rock analyses of starting materials and
run-products, including bulk water, were performed by ALS Chemex. Karl-Fischer
Titration analyses of water content on the samples were performed by Daniele Giordano
at ETH Zurich. I am responsible for data reduction and analysis of the physical and
chemical properties of the experimental samples, as well as for the reduction and analysis
of the rheological data obtained from the deformation experiments.
xiii

CHAPTER I: Introduction
1.1 Context
Experimental volcanology is an expanding field of research driven by new
methods for exploring volcanic processes through high-temperature experimentation
(Dingwell, 1998; Gardner, 1999; Tinker et al., 2004; Quane et al., 2004; Grunder et al.,
2005). Dynamic deformation of complex volcanic materials (melt ± crystals ± pores) in
the laboratory is of great interest because of the direct applications to the flow of volcanic
materials, notably in volcanic conduits, during lava transport, and during welding of
pyroclastic volcanics. Porous and hydrous volcanic materials are of special interest
because of the ubiquity of water, and consequently bubbles, in volcanic systems. There
are several sets of high-temperature experiments on natural volcanic materials that have
been performed under dry conditions (e.g., Yagi, 1966; Bierwirth, 1982; Bagdassarov and
Dingwell, 1992; Quane, 2004). However, performing similar experiments under
controlled water pressures is inhibited by the technical difficulties involved (Friedman et
al., 1963; Grunder et al., 2005). Thus, establishing the rheology of hydrous volcanic
materials remains one of the principal challenges in volcanology (Grunder and Russell,
2005).
1.2 Previous studies
Bierwirth (1982) studied the compaction and welding of the rhyolitic Bandelier
Tuff ash, New Mexico and dacitic air fall deposit from Mount St. Helens, Washington,
under dry conditions and temperatures between 650 °C and 800 °C. His experiments
were conducted on jacketed samples of loose ash, at constant load pressures between 0.72
1

and 3.62 MPa. Higher loads and higher temperatures resulted in more compaction
(greater porosity loss). Bierwirth developed an equation to describe the compaction of
Bandelier Tuff ash. The equation expresses strain, decomposed into time and strain rate,
as a function of density and material properties, which depend on a temperature-
dependent activation energy.
Bagdassarov and Dingwell (1992) performed uniaxial deformation experiments
on core samples of vesiculated natural obsidian from Little Glass Butte, Oregon. They
used constant stress (510 to i0 Pa) uniaxial deformation experiments (E = 0.01-0.015)
to determine the viscosity of the samples with low (-0-0.5), moderate (—P0.25-0.35), and
high (-4165) pore fractions at temperatures near the glass transition (—850 °C) of the melt.
They observed a decrease of apparent viscosity with increasing pore fraction and fit their
experimental data to a viscosity () vs. porosity (1) relationship of the form:
(1.1)
using a dimensionless constant C of 22.4.
Lejeune et al. (1999) performed uniaxial deformation experiments on calcium
aluminium synthetic silicate melt samples. They vesiculated the synthesized melts in air
to obtain low (t = 0-0.13) to moderately (1 = 0.32-0.47) porous samples. Deformation
experiments were conducted at temperatures ranging from 830 to 960 °C, and at a
constant stress varying from 1.1 to 67.7 MPa. The experiments of Lejeune et a!. clearly
show that the apparent viscosity of porous melt decreases with increasing porosity. The
measured decrease in viscosity due to the addition of 47% porosity in their experiments
corresponds to a viscosity change caused by an increase in temperature of 10 °C.
2

Quane (2004) used both soda lime silica glass beads as an analogue for silicate
melt and natural ash from the Rattlesnake Tuff, Oregon, to investigate the rheology of
porous volcanic materials via a series of dry, high-temperature experiments conducted at
constant displacement rate or constant load. Results from the experiments are also
reported in Quane and Russell (2005) and Quane and Russell (2006). Cores of sintered
beads or Rattlesnake Tuff ash were fabricated to produce large cores. The physical
properties of each core were fully characterized before and after each experiment. The
displacement rates used in the glass bead core deformation experiments ranged between
2.510 and ii03 cmls, and the loads between 5 and 50 kg for temperatures of 535, 550,
600, and 650 °C and starting porosities between —27 and -37%. The displacement rates
used in the Rattlesnake Tuff ash experiments ranged from 1 .25 i04 to 5.0 i04 cmls, and
the loads ranged from 22.5 to 90 kg for temperatures ranging from 800 to 900 °C and
starting porosities ranging from -.-70 to 80%. The rheology of both materials was found
to be strain dependent, and the changes in temperature to have a much greater effect on
rheology than changes in load or displacement rate. In the glass bead experiments, strain
accumulates dominantly by porosity loss at low amounts of total strain. At higher strain,
radial strain becomes more important. In contrast, deformation of natural ash cores
shows radial bulging to be dominant at lower amounts of strain with porosity loss
becoming more important at higher amounts of total strain. Strain accommodated by
porosity loss is described by the following relationship:
(1.2)1-f
where is initial total porosity and I is final total porosity. The results of Quane and
Russell (2005) suggest that, in analogue and especially in high-porosity natural materials,
3

porosity distributions control the mechanisms and extent of welding. They developed a
constitutive relationship relating porosity to melt viscosity at constant temperature by an
empirical factor (a), reflecting the starting porosity of the material, the geometry and
character of individual glass clasts and the ability of individual clasts to rearrange or
rotate during deformation to describe the rheological behaviour of the Rattlesnake Tuff
ash:
flehloe (1.3)
where 1e is the sample viscosity, rio the melt viscosity and the sample porosity.
Experiments investigating the rheology of porous hydrous volcanic materials in
which water pressure is controlled independently of the load applied to the sample or the
rate of deformation are few. Friedman et al. (1963) published the only set of deformation
experiments performed on natural volcanic ash in which water pressure was
independently controlled. They investigated the viscosity of crushed porous rhyolite
glass at temperatures between 400°C and 850 °C and at water pressures between 0 and
6.89 MPa. Most experiments were performed at temperatures above 485 °C and water
pressures below 2.07 MPa, conditions at which welded ignimbrites can form. The
deformation experiments of Friedman et al. were performed on jacketed samples of loose
ash from the Bandelier rhyolite tuff, New Mexico. They estimated the initial porosity of
the samples to be —50% on the basis of geometry, and they controlled temperature, load,
and water pressure for the duration of each experiment. The sample was brought to
temperature by a resistance furnace that surrounded the lower part of the experimental
assembly. Fluid pressure was controlled with a hand pump, and load was applied to the
sample by placing weights on a lever that was connected to the piston used to deform the
4

sample. They recorded the compaction rates of the ash and compared the results to
compaction rate curves for Pyrex glass under dry conditions to obtain viscosity values for
the Bandelier Tuff ash. For a given experimental temperature, Friedman et al. (1963)
report an increase in viscosity with increasing strain or with reduction of porosity, and
compactions rates were observed to be faster at higher water pressures. It should be
noted that the figures in Friedman et al. (1963) are mislabelled to indicate incorrectly that
compaction rate decreases with increasing water pressure (cf. Sparks et al., 1999).
The experiments reported in this thesis are the only other wet experiments that
investigate the rheology of porous volcanic materials.
1.3 Goals and approach
The objectives for this project were: (i) to build a deformation apparatus capable
of holding water pressures relevant to volcanic processes at high-temperature, (ii) to
calibrate the apparatus for viscosity and temperature, (iii) to run wet and dry experiments
on porous volcanic materials, and (iv) to use the resultant data to understand porosity in
collapsing volcanic materials. Specifically, constant displacement rate, parallel-plate
deformation experiments (Gent, 1960) were performed on the porous cores of ash from
the Rattlesnake Tuff, at high temperatures and at controlled water pressures, in a new
apparatus designed for high-temperature, uniaxial deformation experiments in the
presence of water. Strain in the experiments is expressed by a shortening and radial
increase of the sample, and a reduction in porosity from the pre-experimental values.
These goals are organized as two manuscripts. The first two objectives were met
and are published as an article in American Mineralogist (Robert et al., 2008). The latter
5

two parts of the project are in a manuscript submitted to a special volume of Chemical
Geology (Robert et al., In Review). Because of the chosen thesis format, the appendices
to this thesis are critical and more of the technical background, methods used and raw
data from the experiments are presented there. The final design of the cell is presented in
the first appendix. The second appendix explains the data acquisition process, and
contains all the experimental data files. The raw experimental data is compiled in
electronic format in the third appendix. The MATLAB code used to process the
experimental data is in the final appendix. Some repetition in the introductory sections of
Chapters II and III is unavoidable as each chapter is a separate manuscript for different
publications.
6

1.4 References
Bagdassarov, N.Sh., Dingwell, D.B., 1992. A rheological investigation of vesicular
rhyolite. Journal of Volcanology and Geothermal Research 50, 307-322.
Bierwirth, P.N., 1982. Experimental welding of volcanic ash. B.Sc. Honours Thesis,
Monash University, 74.p.
Dingwell, D.B., 1998. Recent experimental progress in the physical description of silicic
magma relevant to explosive volcanism. In: Gilbert, J.S. and Sparks, R.S.J. (eds.)
The Physics of Explosive Volcanic Eruptions, Geological Society, London,
Special Publications 145, 9-26.
Friedman, I., Long, W., Smith, R.L., 1963. Viscosity and water content of rhyolite glass.
Journal of Geophysical Research 68, 6523-6535.
Gardner, J.E., Hilton, M., Carroll, M.R., 1999. Experimental constraints on degassing
magma; isothermal bubble growth during continuous decompression from high
pressure. Earth and Planetary Science Letters 168, 201-218.
Grunder, A., Russell, J.K., 2005. Welding processes in volcanology: insights from field,
experimental, and modeling studies. Journal of Volcanology and Geothermal
Research 142, 1-9.
Grunder, A.L., Laporte, D., Druitt, T. H., 2005. Experimental and textural investigation
of welding: effects of compaction, sintering, and vapor-phase crystallization in the
rhyolitic Rattlesnake Tuff. Journal of Volcanology and Geothermal Research 142,
89-104.
Lejeune, A.M., Bottinga, Y., Trull, T.W., Richet, P., 1999. Rheology of bubble-bearing
magmas. Earth and Planetary Science Letters 166, 7 1-84.
7

Quane, S.L., 2004. Welding in pyroclastic materials, PhD Thesis, University of British
Columbia, 2O8p.
Quane, S.L., Russell, J.K., Kennedy, L.A., 2004. A low-load, high-temperature
deformation apparatus for volcanological studies. American Mineralogist 89, 873-
877.
Quane, S.L., Russell, J.K., 2005. Welding: insights from high-temperature analogue
experiments. Journal of Volcanology and Geothermal Research 142, 67-87.
Quane, S.L., Russell, J.K., 2006. Bulk and particle strain analysis in high-temperature
deformation experiments. Journal of Volcanology and Geothermal Research 154,
63-73.
Robert, G., Russell, J.K., Giordano, D., Romano, C., 2008. High-temperature
deformation of volcanic materials in the presence of water. American
Mineralogist 93, 74-80.
Robert, G., Russell, J.K., Giordano, D., In Review. Rheology of porous volcanic
materials: High-temperature experimentation under controlled water pressure.
Chemical Geology Special Issue, 8t Silicate Melt Workshop.
Sparks, R.S.J., Tait, S.R., Yanev, Y., 1999. Dense welding caused by volatile resorption.
Journal of the Geological Society, London 156, 2 17-225.
Tinker, D., Lesher, C.E., Baxter, G. M., Uchida, T., Wang, Y., 2004. High-pressure
viscometry of polymerized silicate melts and limitations of the Eyring equation.
American Mineralogist 89, 1701-1708.
Yagi, K., 1966. Experimental study on pumice and obsidian. Bulletin of Volcanology 29,
559-572.
8

CHAPTER II: The fluid cell’
2.1 Introduction
Experimental volcanology is an expanding field driven by new methods for
exploring volcanic processes through high-temperature experimentation (Dingwell, 1998;
Gardner, 1999; Tinker et al., 2004; Quane et al., 2004; Grunder et al., 2005). High-
temperature experiments are used to retrieve data on the rheological behaviour of natural
melts (e.g., Dingwell et al., 1993; Dingwell, 1998; Richet and Bottinga, 1995; Giordano
et al., 2004), the properties of pyroclastic materials (e.g., Friedman et al., 1963;
Bierwirth, 1982; Quane et al., 2004; 2005; Giordano et al., 2005), the conditions
attending explosive collapse of lava and domes (e.g., Spieler et al., 2004), and the
mechanisms of fragmentation processes in volcanic conduits (Tuffen et al., 2003;
Kennedy et al., 2005).
The explosive or effusive behaviour of volcanic systems is governed by magma
rheology, which largely reflects the abundance and nature (e.g., dissolved vs. exsolved)
of volatile components. However, the rheological properties of volcanic materials in the
presence of a fluid phase as ubiquitous as water in volcanic systems remain poorly known
(Bagdassarov and Dingwell, 1992; Lejeune et al., 1999; Stein and Spera, 1992). This gap
in knowledge results from the technical difficulties in designing and running the
appropriate experiments. Establishing the rheology of hydrous volcanic materials,
therefore, remains one of the principal challenges in volcanology (Grunder and Russell,
2005).
‘A version of this chapter has been published. Robert, G., Russell, J.K., Giordano, D.,Romano, C., 2008. High-temperature deformation of volcanic materials in the presence
of water. American Mineralogist 93, 74-80.
9

The purpose of this paper is two-fold. First, we describe a new experimental cell
for high-temperature deformation experiments of samples under controlled fluid
pressures. The “fluid cell” can be used with the Volcanology-Deformation-Rig (VDR;
Quane et al., 2004) for rheological studies of volcanic materials (e.g., pumice, ash, lava)
over T-PH2O conditions pertinent to volcanological processes. Second, we report on a
series of experiments used to: a) calibrate the apparatus; and to b) explore the properties
(e.g., viscosity) of natural pyroclastic materials at volcanic T-PH2O conditions. These data
are critical for the understanding of a variety of volcanic processes such as: welding and
compaction of ignimbrites; fragmentation and annealing of magma in volcanic conduits;
flow of volcanic domes; and amalgamation and flow of clastogenic lavas.
2.2 Experimental apparatus
The VDR (Fig. 2. la) was designed to explore the rheology of volcanic materials
by performing high-temperature, low-load (<1136 kg) deformation experiments at
constant load, or displacement rate, or at controlled load rates (Quane et al., 2004). The
apparatus comprises a GeoComp LoadTracll reinforced “T”-frame equipped with a step-
motor that moves a lower platen upwards at specified rates, or applies a prescribed load.
An S-beam type load transducer measures load; displacement is measured by a linear
variable displacement transducer (LVD transducer). A commercially purchased Zircar®
fiber-insulated heater furnace with helically-wound Fe-Cr-Al alloy resistance wire
elements allows for temperatures up to 1100 °C. The main attributes of the VDR are that
it accommodates large (D < 7.5 cm; L < 10 cm) sample cores and covers temperatures,
10

load stresses and strain rates consistent with natural volcanic processes (see Fig. 3 in
Quane et al., 2004).
The original VDR was restricted to high-temperature experiments at ambient
atmospheric conditions. We have now built a steel, sealable cell (Fig. 2. lb) that allows
high-temperature experimentation at elevated fluid pressures. The fluid cell can be used
in the VDR after only minor modifications of the original assembly. The current sample
assembly comprises, from bottom to top, a lower cooling plate, a stainless steel holder for
a ceramic spacer, the sample cell, and a stainless steel spacer (Fig. 2.1 a). The upper steel
spacer has a machined lip that aligns the water cell to the central axis of the rig.
2.2.1 Fluid cell
All parts of the fluid cell are machined out of a corrosion-resistant, high-
temperature stainless steel (grade 310) suited for experimentation involving fluids. The
cell can operate at temperatures of 25-1100°C and fluid pressures of 0-150 MPa. The
sample chamber is a 25 cm tall cylinder with a wall thickness of 1 cm and outside
diameter of 5 cm. It can accommodate sample cores up to 3 cm in diameter and 10 cm in
length. An internal piston is connected to the VDR by a 31 cm long piston shaft that
slides out of a sealed opening at the top of the fluid cell (Fig. 2.1). The VDR controls
displacement of the piston and, thus, deformation of sample.
The cell is sealed metal-on-metal at either end. The lower and upper metal seals
are fastened to the sample chamber by socket head cap screws. The top seal has a long,
narrow neck used to align the piston shaft. A high-temperature Viton® 0-ring, cooled by
a water-cooling jacket, provides a tight seal on the piston shaft. Dow Corning® high
11

piston
4—thermocouple
o-ring—— :1cIamp—
sample
Figure 2.1 (A) Volcanology-Deformation-Rig (VDR) modified from Quane et al. (2004)
for experiments using the fluid cell. (B) Cross-section of fluid cell and sample arrange
ment. Detailed line diagrams and parts list for the water cell can be found at
http://www.eos .ubc.calresearchlinfrastructure/cesl.html
0
thermocouple
valve and/ transducer
I complex
—to H20 system
loadtransducer
fiberinsulation —
ceramic __1spacer
coolingplate
to temperaturecontroller
displacement
to computer
valve andtransducercomplex
invalve
sample chamber _—
12

temperature lubricant is applied to the 0-ring to minimize friction on the piston shaft
during experiments. Normally, the piston-shaft slides into the cell under its own weight
and, for dry experiments, all applied load is used to deform the sample.
The upper part of the piston shaft is threaded so that the top of the piston can be
removed without taking apart the top of the cell. The outer diameter of the lower piston
head is slightly less (<1 mm) than the inner diameter of the cell which ensures that: (i)
there are no frictional effects between piston head and cell wall during an experiment,
and that (ii) the piston head does not create an impermeable barrier to the fluid phase;
fluid pressure is hydrostatic and equal on either side of the piston. The piston shaft is
hollow and allows a thermocouple to be placed at the lower piston head (e.g., 2 mm
above top of sample).
The valve and transducer complex comprises a safety valve, a water pressure
transducer, an air valve, and a line for introducing distilled water via a 2-way manual
fluid pressure intensifier. The intensifier serves as a fluid delivery system that allows the
operator to control fluid pressure during the experiment by adding or removing fluid (Fig.
2.1). The system can be used to compensate for slow leaks or to allow for experiments
having a variable or cyclical fluid pressure (e.g., degassing or fluid pressurization events).
2.2.2 Temperature calibration
A factory-built fiber insulated tube furnace is used to heat the sample assembly
and fluid cell. The lower cooling plate and ceramic spacer have a hole drilled in their
centers to accept a type K thermocouple (Fig. 2.1) which controls temperature at the base
of the cell. The thermocouple inside the piston reads temperature at the top of the sample
13
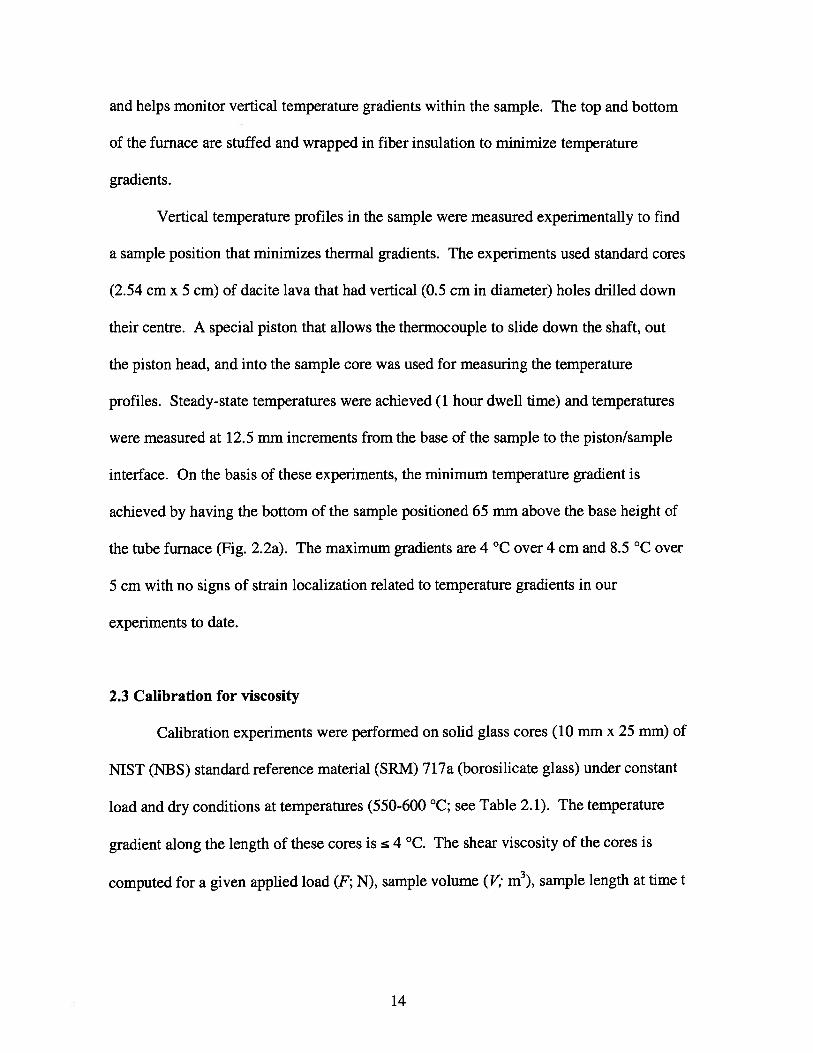
and helps monitor vertical temperature gradients within the sample. The top and bottom
of the furnace are stuffed and wrapped in fiber insulation to minimize temperature
gradients.
Vertical temperature profiles in the sample were measured experimentally to find
a sample position that minimizes thermal gradients. The experiments used standard cores
(2.54 cm x 5 cm) of dacite lava that had vertical (0.5 cm in diameter) holes drilled down
their centre. A special piston that allows the thermocouple to slide down the shaft, out
the piston head, and into the sample core was used for measuring the temperature
profiles. Steady-state temperatures were achieved (1 hour dwell time) and temperatures
were measured at 12.5 mm increments from the base of the sample to the piston/sample
interface. On the basis of these experiments, the minimum temperature gradient is
achieved by having the bottom of the sample positioned 65 mm above the base height of
the tube furnace (Fig. 2.2a). The maximum gradients are 4 °C over 4 cm and 8.5 °C over
5 cm with no signs of strain localization related to temperature gradients in our
experiments to date.
2.3 Calibration for viscosity
Calibration experiments were performed on solid glass cores (10 mm x 25 mm) of
NIST (NBS) standard reference material (SRM) 717a (borosilicate glass) under constant
load and dry conditions at temperatures (550-600 °C; see Table 2.1). The temperature
gradient along the length of these cores is °C. The shear viscosity of the cores is
computed for a given applied load (F; N), sample volume (V; m3), sample length at time t
14

(L; m), and rate of shortening (ãLIãt; m s’) using the no-slip (Eq. 2.1) and perfect-slip
(Eq. 2.2) models of Gent (1960) (cf. Dingwell et al., 1993):
2irL5Fc9L
(2.1)3V—(2rL3+ V)
and ?‘,(Pa s)=
(2.2)
respectively. Based on the geometry of the run-product cores (i.e. little bulging) we
chose the perfect-slip end-member model to compare viscosity values from the
deformation experiments to the temperature-dependent viscosity curve for NIST 7 17a
glass (Fig. 2.2b). The shaded field on the curve indicates the is uncertainty on the
standard glass. The uncertainty on each experimental determination of viscosity (boxes)
includes variations in temperature during the experiment (Table 2.1). Our calibration
experiments reproduce the viscosity of the standard well and suggest an experimental
accuracy of 0.2 log units.
2.4 Volcanological experiments
2.4.1 Materials
High-temperature deformation experiments were performed on fabricated cores of
ash from the Rattlesnake Tuff: a high silica rhyolite (SiO2 >75%; Table 2.1; cf. Streck
and Grunder, 1995). The ash is sieved to a 0.6-2 mm size fraction (coarse ash) and cores
are sintered by heating loose ash in a mold (2.54 cm x 8 cm) at 900 °C for 20 minutes.
Samples are trimmed to —5 cm lengths creating cores with a 2:1 aspect ratio (Fig. 2.3a).
There is little change in composition after sintering (Table 2.1).
15

*C
ompo
siti
onof
Rat
tles
nake
ash
core
sas
Si02,
Ti02,
Al
203,Fe
O(T
),M
nO,
MgO
,C
aO,
(i)
Post
-sin
teri
ng:
77.6
4;0.
17;
12.4
8;1.
17;
0.07
;0.
00;
0.31
;3.
38;
4.62
;0.
01;
0.15
.(i
i)P
ost-
expe
rim
enta
l:77
.17;
0.16
;12
.81;
1.16
;0.
07;
0.00
;0.
30;
3.44
;4.
65;
0.00
;0.
24.
aVa l
ues
ofst
rain
calc
ulat
edfr
omm
achi
nedi
spla
cem
ent
(Am
),sh
orte
ning
ofco
re(A
l).bV
alue
sof
orig
inal
and
fina
lto
talp
oros
ity.
eVal
ues
ofsh
ear
visc
osity
asst
ress
over
stra
inra
te(1
)an
dfr
ompe
rfec
tsl
ipm
odel(ri
13
).
Tab
le2.
1Su
mm
ary
ofca
libr
atio
nan
dde
form
atio
nex
peri
men
ts,
incl
udin
gco
nditi
ons,
prop
erti
es,
and
com
posi
tion*
of
sam
ples
.N
o.Se
t-U
pT
P(H
20)
Loa
dA
l/At
Stra
ina
Poro
sity
bV
isco
sity
(Pa
)C
(°C
)(M
Pa)
(N)
(rn
s’)
m1p
srt
fO2
Cel
l87
8±1
Dry
—1.
25.1
060.
300.
300.
730.
6410
6.61
0b03
—
rtfo4
Cel
l65
6±10
3.3-
1.7
—1.2
5106
0.30
0.34
0.72
0.63
108.
210b
01—
rtfO
5C
ell
645±
53
—2.5
0.1
06
0.30
0.35
0.73
0.69
i07°-i0
94
—
nist
Ol
VD
R56
2±13
Dry
48.4
—0.
160.
15—
——
1010
110b02
nist
03V
DR
571±
11D
ry48
.4—
0.25
0.24
——
—10
9810
99
nist
04C
ell
575±
2D
ry48
.4—
0.30
0.30
——
—10
9610
97
nist
05C
ell
568±
1D
ry48
.4—
0.24
0.23
——
—109.8
10b00
Na
20,K20,P205,
LOT:

Figure 2.2 Calibration results for VDR and fluid cell. (A) Calibration of thermalgradient across 4 cm (grey) and 5 cm (hatch) sample cores. (B) Results of experimentsplotted against known viscosity (upper inset) of NIST glass cores (lower inset). Mainfigure shows expected values of viscosity for NIST glass over experimental range oftemperatures (shaded grey). Viscosity values derived from: (i) dry experimentsperformed in the VDR (open rectangles), and (ii) experiments performed in the fluid cellunder dry conditions (closed rectangles). See Table 2.1 for experimental conditions andresults.
17

5
4
C-)
0.
5200
1
0560 600
T(°C)620 600 580 560 540
Cl)cr3Q10
0
0)0
12.5
1 0000/T(K)
Figure 2.2 See previous page for figure caption.
570 580 590
T(°C)
11
9
11.5 12
18

The sintering process causes point annealing of shards and forms a highly-porous,
floating, shard-supported framework (Fig. 2.3b). Cores of ash comprise curvilinear and
Y-shaped bubble wall shards, complete vesicles (e.g., bubble shards), smaller proportions
of pumiceous shards, and up to 1% crystals. There are two types of bubble shards (Fig.
2.3b): (i) a population of thick-walled vesicles characteristic of the original ash, and (ii) a
subordinate population of thinner-walled vesicles produced during the sintering process.
The latter population may have resulted from nucleation and growth of new bubbles or,
more likely, represent original closed bubbles (isolated porosity) that expanded during the
heating and sintering of the cores. Total porosity of sintered cores is slightly in excess of
70% (Table 2.1). The cores have an essentially isotropic texture (e.g., little to no fabric).
The shards do not appear deformed except around bubbles that grew during sintering,
where the shards appear to conform to the shape of the thin-walled bubbles.
2.4.2 Experiments
Three unjacketed experiments were run in the fluid cell system under constant
displacement rate (_.106 m s’) and to strains of -3O% (Table 2.1). The dry experiment
(rtf2) was at 878 °C; two experiments under -3 MPa PH2O (rtf4 and rtf5) were performed
at 656 °C and 645 °C, respectively. The corresponding experimental run-products are
shown in Figure 2.3c, d. Figure 2.4a shows the relationship between applied load stress
and total strain for experiments rtf2 and rtf5. The data have been filtered to compensate
for the fact that the high sampling rate captures the oscillations of the step motor that
drives piston displacement. Smoothing the data before processing gives a more accurate
record of the changing properties (e.g., rheology) of the system with increasing strain.
19

Figure 2.3 Pre- and post-experimental products (Table 2.1). (A) Sample core of sinteredash used in deformation experiments. (B) Scanning electron micrograph of thin-sectionof sintered core of Rattlesnake Tuff ash (e.g., starting material). (C) SEM backscatteredelectron micrographs of thin section of (C) run-product rtf2 and (D) run product rtf4(load stress had a vertical orientation in these images). Ash particles are light grey andpore space is dark grey to black. White boxes highlight two populations of bubbles:thick-walled and thin-walled (see text).
20

For the dry experiment, increased load is required to maintain a constant rate of
displacement. In order to achieve 30 % shortening of the core, load stress increases from
0.1 to 0.6 MPa. This increase in load stress, at constant displacement rate, is a direct
indication of the transient properties of the core during progressive deformation.
Increasing strain causes shortening of the core by porosity reduction (volume strain),
which has the concomitant effect of increasing the effective strength (e.g., viscosity) of
the material. This trend is as described by Quane et al. (2004) and Quane and Russell
(2005) in their deformation experiments on cores of glass beads. We have also calculated
the apparent viscosity of the core sample as a function of strain (Fig. 2.4b). Once steady
deformation is achieved, viscosity rises from Pa s during the first 1-2% of strain, to
i’° Pa s at 30% strain. The increase in viscosity during deformation is broadly
consistent with constitutive relationships established for the viscosity of hot porous
aggregates (e.g., Sura and Panda, 1990; Bagdassarov and Dingwell, 1992; Quane and
Russell, 2005). The deformation path of the dry core shows a steady increase in viscosity
of -1 order of magnitude for a porosity reduction of 10%.
Experiments run at fixed PH2O (3-3.2 MPa) use similar displacement rates,
achieve similar values of strain, but are performed at -200 °C lower temperatures. At the
same temperatures and strain rates, under dry conditions, experiments on Rattlesnake ash
cores produce brittle (rather than viscous) deformation. The load in the wet experiments
is corrected for the effects of FH2O by subtracting a constant value of load from the data
set; that value is recorded at time zero before any deformation has occurred. At PH2O < 3
IVIPa piston friction is negligible. At higher water pressures a correction is needed; future
21

0. 11
0.1 0.2 0.3
Figure 2.4 Results of two experiments on cores of Rattlesnake Tuff ash: (i) rtf2 (dry at
878 °C), and (ii) rtf5 (wet at 645 °C). (A) Stress evolution vs. strain for two experimentsand corresponding water pressure for rtf5 (see text). (B) Calculated effective viscosity
vs. total strain for data in (A). (C) Results compared to independent values of melt
viscosity (solid line) and Tg for melt (e.g., i 1012 Pa s). Effect of porosity is to reduce
viscosity of the melt. Open symbols show results of two experiments (see B); arrows
indicate direction of increased strain. (D) Melt viscosity (solid line) as shown in (C).
Dashed lines are calculated effects of dissolved water (0.1, 0.25, 0.5, and 1.0 wt.% H20;
Giordano et al. 2008) and grey squares show depression of Tg for hydrous melts. Experi
mental results from two deformation experiments are plotted as in (C) (see text). The star
represents the viscosity of the Rattlesnake melt at 645 °C having 0.73 wt.% water (see
text).
0.5
0.4
0.3Cl)ci)
0.2
0.1
/1/
P(H2O)forrtf5/ —
(dry)
-D
F’)
0
2D
10
Cl)
C90
0)8C
7
0 rtf2
0.1Strain
0.2Strain
V)
CDC
0
6 8 10 121 0000/T(K)
6 81 0000/T(K)
10 12
22

work includes calibrating this effect to allow for experimentation at higher >50 MPa
PH2O.
Experiment rtf5 shows substantially different behaviour than seen in the dry
experiment (Fig. 2.4a). The load stress curve for rtf5 is essentially flat with increasing
strain, implying that a single critical load is required to maintain a constant displacement
rate throughout the entire experiment (Fig. 2.4a). The load stress shows a maximum of
120 kPa at small amounts of strain (<10%), decreases to 80 kPa after 15-20% strain and
then increases slightly to 120 kPa at 30% strain. The calculated effective viscosity is also
nearly constant (109.2 to i0 Pa s) despite the core undergoing 30% strain via porosity
loss (Table 2.1). The presence of a fluid pressure not only lowers the material strength (<
100 kPa vs. 100 - 600 kPa), but also compensates for the expected increase in viscosity
due to lower temperature (645 °C vs. 878 °C) and delays the onset of “strain hardening”
of the sample as porosity is reduced.
2.4.3 Textural analysis of experiments
Samples rtf2 (dry; Fig. 2.3c) and rtf4 (wet; Fig. 2.3d) have undergone similar
strain (-30%) and have lost identical amounts of porosity (Table 2.1). Porosity in
deformed samples occurs as intraclast voids between annealed shards, as bubble voids
(thick- and thin-walled) and as smaller (<0.01 mm) isolated pores in vitric clasts (Fig.
2.3c, 2.3d). After 30% strain, the samples develop a pronounced planar fabric caused
by rotation and flattening of shards to create a foliation. The intensity of the foliation is
virtually identical in the two experiments (cf. Fig. 2.3b vs. 2.3c and 2.3d). Thick- and
thin-walled bubble shards Fig. 2.3b) exhibit quite different behaviours during
23

deformation. The thinner-walled bubbles show much higher degrees of flattening than do
the thick-walled bubbles; this disparate behaviour is independent of bubble size although,
in general, smaller bubbles are less deformed. Another form of strain localization occurs
in curvilinear and Y-shaped shards that are near flattened bubbles. These shards show a
stronger alignment and higher degree of deformation than do shards away from large
deformed bubbles.
In summary, the SEM images of run-products from the dry and wet experiments
provide no obvious means to differentiate between them. It is somewhat enigmatic that
very similar run-products were produced even though: (i) the dry experiment was
performed at -.2OO °C higher temperature; under dry conditions the 645 °C experiment
would not support viscous deformation, and (ii) the dry experiment showed a continuous
increase in load stress and viscosity as a function of progressive strain, whereas the wet
experiment underwent the same amount of strain and porosity reduction but showed little
to no strain hardening or increase in effective viscosity.
2.5 Discussion
Our experiments address the viscosity of highly vesicular (70%) melts (Fig. 2.4c,
2.4d). The highest viscosity achieved in the dry (rtf2) experiment after 30% strain is
i00’4 Pa s, which is close to the viscosity of the Rattlesnake melt at this temperature
(1O08 Pa s; Fig. 2.4c; Table 2.2 and see Appendix A). The results of the deformation
experiment performed at -3 MPa PH2O and 645 °C (rtf5; Fig. 2.4c) indicate apparent
viscosities of 109.2- i0 Pa s. The viscosity of the Rattlesnake Tuff melt (anhydrous)
24

Table 2.2 Measured values of viscosity for glass* from melted ash from Rattlesnake Tuffash and VFT coefficients (A, B, C).T(°C) Log Ti Expta
917.80 9.92 MP975.25 9.14 MP1421.67 4.60 CC1446.28 4.43 CC1470.89 4.26 CC1495.50 4.09 CC1520.11 3.93 CC1544.72 3.78 CC1569.33 3.62 CC1593.94 3.48 CC1618.55 3.34 CC
A B CVFT -7.43 19,766 52.9
* Composition of glass by EMP as Si02 (77.42), Ti02 (0.14), Al203 (12.22), FeO(T)(1.39), MnO (0.08), MgO (0.04), CaO (0.31), Na20 (3.44), K20 (4.96), P205 (0.01).a See Appendix 2.A.
25

extrapolated to this temperature would be iO’54 Pa s (Table 2.2; Appendix 2.A), which is
substantially higher than observed. Although the wet experiment experiences the same
strain as the dry experiment, its effective viscosity remains very much lower than the
viscosity of the corresponding dry melt.
Both porosity and dissolved water serve to reduce effective viscosity. Dissolved
water causes a strong decrease in viscosity and is most pronounced in melts having the
highest values of viscosity (e.g., low temperature). There are several ways in which fluid
pressure might operate to reduce the effective viscosity of these samples during
deformation. Firstly, elevated fluid pressure will cause hydration of the shards
comprising the cores. The cores are very porous, feature high surface area to volume
ratios, and were held above Tg for several hours (Figs. 2.4c, 2.4d). The calculated effects
of H20 on melt viscosity are shown by the dashed curves in Fig. 2.4d (Giordano et al., in
Press). These elements suggest that H20 may be dissolved into the glass shards causing
a reduction in the viscosity of the framework material and, thus, a reduction in the
apparent viscosity of the deforming core. At 3 MPa the maximum (equilibrium)
dissolved water content for the shards would be 0.73 wt% (VolatileCaic 1.1; Newman
and Lowenstern, 2002). This would reduce the viscosity of the melt at 645 °C from i0’
to iO”3 Pa s (Fig. 2.4d; star symbol), which remains substantially higher than the
observed apparent viscosity of rtf5 (1092- Pa s; Fig. 2.4d). This suggests that the
low apparent viscosity recorded by experiment rtf5 reflects the combined effects of an
elevated H20 pressure and a residual porosity.
Secondly, the presence of the fluid phase itself (rather than dissolved H20) may
also cause a reduction in effective viscosity. The presence of a fluid will create a pore
26

fluid pressure (Pfljd) that can lower the (dry) strength (ai.) of the sample such that the
effective strength is: 0eff = Gdry — Pflujd (Terzaghi, 1943). Furthermore, the high porosity
ensures that virtually all the interfaces between shards are wetted by H20 vapour which
may allow for development of hydroxylated monolayers (Schlegel et al., 2002). The
hydroxylated monolayers may serve as a lubricant to the glass shards allowing shards to
glide past each other without having to deform internally. This is analogous to rock
systems in which partial wetting of crystals by a melt phase facilitates grain boundary
sliding (de Kloe et a!., 2000).
Our experiments demonstrate the importance of porosity and the fluid phase
during high-temperature deformation processes. They show that the combined effects of
porosity and a fluid (H20) phase greatly expand the window for viscous deformation of
volcanic materials. The viscosity recorded by experiments under 3 MPa PH2O (e.g., rtf5)
is too low to be ascribed solely to the effects of residual porosity or to elevated dissolved
water contents.
2.6 Acknowledgements
This research is funded by the Natural Sciences and Engineering Research
Council (NSERC) via the Research Tools and Instruments program (JKR), the Discovery
Grants program (JKR), and the PGS fellowship program (GR) and by the Italian
Dipartimiento della Protezione Civile (2004-06 Agreement, Instituto Nazionale di
Geofisica e Vulcanologia — INGV). Chemical analyses of cores of Rattlesnake Tuff ash
were generously provided by Steve Quane. We thank Don Dingwell for lab privileges to
measure viscosity at the LMU, Munich, Germany. We also thank P. Ardia at ETH
27

Zurich for microprobe analysis of silicate glasses (e.g., fused samples of Rattlesnake
Tuff). The manuscript benefited from critical reviews by Luigi Burlini and Cliff Shaw.
Finally, we would like to especially thank UBC’s Earth & Ocean Sciences machinists
Ray Rodway and JOrn Unger.
2.7 Appendix 2.A: Melt viscosity of the Rattlesnake Tuff ash
The viscosity of melted Rattlesnake Tuff ash (Streck and Grunder, 1995) was
measured independently by concentric cylinder and micropenetration techniques at the
LM(J Munich. The Vogel-Tamman-Fulcher equation (cf. Richet and Bottinga, 1995) has
been fit to the data to model the temperature dependence of viscosity for the dry and non-
vesicular melt (Table 2.2). Concentric cylinder and micropenetration techniques measure
viscosity in the ranges (10’-10 Pa s) and (1081012 Pa s), respectively, and are calibrated
against NIST SRM 717a glass. Homogeneous melts were prepared by fusing samples in
a thin-walled Pt-crucible in a MoSi2 element furnace (1 atm and 1500 — 1650 °C). The
original glass shards contained minor water, which caused vesiculation during fusion.
The sample was kept in the melting furnace for more than 1 week until all bubbles had
escaped. The sample was then transferred to the concentric cylinder viscometer furnace
and a stirring spindle was used to stir the melt. The spindle was periodically lifted out of
the melt to determine when the melt was free of crystals and bubbles. Concentric
cylinder measurements were performed once the melt was devoid of crystals and bubbles.
The crucible was removed from the furnace and allowed to cool in air to quench the
sample to a glass. The composition of the glass was determined by electron microprobe
analysis using the JEOL JXA 8200 device at ETH-Zentrum, Zurich (Table 2.2). The
28

sample was then cored to produce 3 mm thick, doubly polished disks for low-temperature
measurements of viscosity using micropenetration techniques (Giordano et al., 2005).
Measurements were performed under Argon atmosphere using a modified Bähr 802 V
vertical push-rod dilatometer (Dingwell et al., 1993; Giordano et al., 2004; 2005), and the
samples were held at temperature for 1 hour to achieve structural relaxation before each
measurement. Shear viscosity (ii) was calculated as described by Pocklington (1940) and
Toboisky and Taylor (1963).
29

2.8 References
Bagdassarov, N.Sh., Dingwell, D.B., 1992. A rheological investigation of vesicular
rhyolite. Journal of Volcanology and Geothermal Research 50, 307-322.
Bierwirth, P.N., 1982. Experimental welding of volcanic ash. B.Sc. Honours Thesis,
Monash University, 74p.
De Kloe, R., Drury, M.R., van Roermund, H.L.M., 2000. Evidence for stable grain
boundary melt films in experimentally deformed olivine-orthopyroxene rocks.
Physics and Chemistry of Minerals 27, 480-494.
Dingwell, D.B., 1998. Recent experimental progress in the physical description of silicic
magma relevant to explosive volcanism. In: Gilbert, J.S. and Sparks, R.S.J. (eds.)
The Physics of Explosive Volcanic Eruptions, Geological Society, London,
Special Publications 145, 9-26
Dingwell, D.B., Bagdassarov, N.S., Bussod, G.Y., Webb, S.L., 1993. Magma rheology.
In: Luth, R.W. (ed) Experiments at high pressure and applications to the Earth’s
mantle, Mineralogical Association of Canada, Short Course Handbook 21, 131-
196
Friedman, I., Long, W., Smith, R.L., 1963. Viscosity and water content of rhyolite glass.
Journal of Geophysical Research 68, 6523-6535.
Gardner, J.E., Hilton, M., Carroll, M.R., 1999. Experimental constraints on degassing
magma; isothermal bubble growth during continuous decompression from high
pressure. Earth and Planetary Science Letters 168, 201-218.
Gent, A.N., 1960. Theory of the parallel-plate viscometer. British Journal of Applied
Physics 11, 85-87.
30

Giordano, D., Romano, C., Papale, P., Dingwell, D.B., 2004. The viscosity of trachytes,
and comparison with basalts, phonolites, and rhyolites. Chemical Geology 213,
49-61.
Giordano, D., Nichols, A.R.L., Dingwell, D. B., 2005. Glass transition temperatures of
natural hydrous melts: a relationship with shear viscosity and implications for the
welding process. Journal of Volcanology and Geothermal Research 142, 105-118.
Giordano, D., Russell, J.K., Dingwell, D.B., In Press. Viscosity of magmatic liquids: A
model. Earth and Planetary Science Letters.
Grunder, A., Russell, J.K., 2005. Welding processes in volcanology: insights from field,
experimental, and modeling studies. Journal of Volcanology and Geothermal
Research 142, 1-9.
Grunder, A.L., Laporte, D., Druitt, T. H., 2005. Experimental and textural investigation
of welding: effects of compaction, sintering, and vapor-phase crystallization in the
rhyolitic Rattlesnake Tuff. Journal of Volcanology and Geothermal Research 142,
89-104.
Kennedy, B., Spieler, 0., Scheu, B., Kueppers, U., Taddeucci, J., Dingwell, D.B., 2005.
Conduit implosion during Vulcanian eruptions. Geology 33, 58 1-584.
Lejeune, A.M., Bottinga, Y., Trull, T., Richet, P., 1999. Rheology of bubble-bearing
magmas. Earth and Planetary Science Letters 166, 71-84.
Newman, S. and Lowenstern, B., 2002. VolatileCaic: a silicate melt-H20-C02solution
model written in Visual Basic for Excel. Computers and Geosciences 28, 597-
604.
31

Pocklington, H.C., 1940. Rough measurement of high viscosities. Proceedings of the
Cambridge Philosophical Society 36, 507—508.
Quane, S.L., Russell, J.K., 2005. Welding: insights from high-temperature analogue
experiments. Journal of Volcanology and Geothermal Research 142, 67-87.
Quane, S.L., Russell, J.K., Kennedy, L.A., 2004. A low-load, high-temperature
deformation apparatus for volcanological studies. American Mineralogist 89, 873-
877.
Richet, P., Bottinga, Y., 1995. Rheology and configurational entropy of silicate melts. In
Mineralogical Society of America, Reviews in Mineralogy 32, 67-93.
Schlegel, M.L., Nagy, K.L., Fenter, P., Sturchio, N.C., 2002. Structures of quartz (1010)-
and (1011)-water interfaces determined by X-ray reflectivity and atomic force
microscopy of natural growth surfaces. Geochimica et Cosmochimica Acta 66,
3037-3054.
Sparks, R.S.J., Tait, S.R., Yanev, Y., 1999. Dense welding caused by volatile resorption.
Journal of the Geological Society, London 156, 2 17-225.
Spieler, 0., Kennedy, B., Kueppers, U., Dingwell, D.B., Scheu, B., Taddeucci, J., 2004.
The fragmentation threshold of pyroclastic rocks. Earth and Planetary Science
Letters 226, 139-148.
Stein, D.J., Spera, F.J., 1992. Rheology and microstructure of magmatic emulsions;
theory and experiments. Journal of Volcanology and Geothermal Research 49,
157-174.
32

Streck, M.J., Grunder, A.L., 1995. Crystallization and welding variations in a widespread
ignimbrite sheet; the Rattlesnake Tuff, eastern Oregon, USA. Bulletin of
Volcanology 57, 151-169.
Sura, V.M., Panda, P.C., 1990. Viscosity of porous glasses. Journal of the American
Ceramic Society 73, 2697-2701.
Terzaghi, K., 1943. Theoretical Soil Mechanics. John Wiley and Sons, New York, NY.,
510 pages.
Tinker, D., Lesher, C.E., Baxter, G. M., Uchida, T., Wang, Y., 2004. High-pressure
viscometry of polymerized silicate melts and limitations of the Eyring equation.
American Mineralogist 89, 1701-1708.
Tobolsky, A.V., Taylor, R.B., 1963. Viscoelastic properties of a simple organic glass.
Journal of Physical Chemistry 67, 2439—2442
Tuffen, H., Dingwell, D.B., Pinkerton, H., 2003. Repeated fracture and healing of silicic
magma generate flow banding and earthquakes? Geology 31, 1089-1092.
33

CHAPTER III: Deformation experiments’
3.1 Introduction
Many volcanic processes involve the production and growth of gas-filled bubbles,
the connection of bubbles to produce permeability, and the subsequent collapse of the
bubbles. These cycles of bubble growth and collapse are important elements in processes
as diverse as magma ascent, transition from explosive to effusive volcanic eruption,
fragmentation processes in volcanic conduits, dome growth and collapse, and the
inflation, collapse, and welding of pyroclastic density currents.
Despite its obvious importance for understanding and modelling volcanic
processes, our knowledge of the rheological properties of porous magmas is incomplete.
Compaction and sintering of particulate materials in the ceramics industry has provided
insights on the effects of porosity on the viscosity of composite materials (Fig. 3.1;
Rahaman et al., 1987; Ducamp and Raj, 1989; Sura and Panda, 1990) and, more
importantly, has inspired experimentation on materials pertinent to volcanology (Fig.
3.1). For example, there are a now a number of high-temperature experimental studies on
synthetic melt systems that elucidate the rheological behaviour of porous melts (i.e., Stein
and Spera, 1992; Lejeune et al., 1999; Quane et al., 2004). There also are a smaller
number of parallel experimental studies on natural volcanic materials (i.e. Friedman et
al., 1963; Bierwirth, 1982; Bagdassarov and Dingwell, 1992; Quane, 2004; Quane and
Russell, 2005) and these studies report a wide range of rheological behaviours (see Quane
and Russell, 2005; Grunder and Russell 2005 for reviews).
‘A version of this chapter has been submitted for publication. Robert, G., Russell, J.K.,Giordano, D., In Review. Rheology of porous volcanic materials: High-temperatureexperimentation under controlled water pressure. Chemical Geology Special Issue, 8th
Silicate Melt Workshop.
34
1
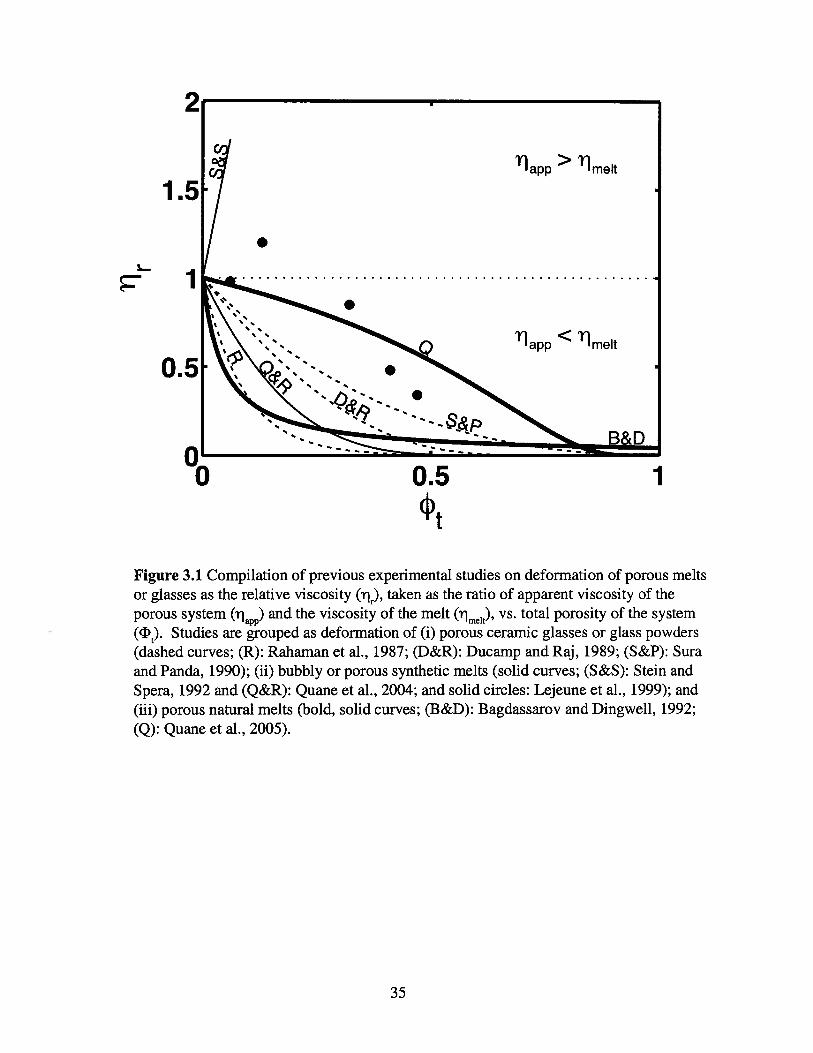
Figure 3.1 Compilation of previous experimental studies on deformation of porous meltsor glasses as the relative viscosity (ii,.), taken as the ratio of apparent viscosity of theporous system (lapp) and the viscosity of the melt (1ieit)’ vs. total porosity of the system(I). Studies are grouped as deformation of (i) porous ceramic glasses or glass powders(dashed curves; (R): Rahaman et al., 1987; (D&R): Ducamp and Raj, 1989; (S&P): Suraand Panda, 1990); (ii) bubbly or porous synthetic melts (solid curves; (S&S): Stein andSpera, 1992 and (Q&R): Quane et al., 2004; and solid circles: Lejeune et al., 1999); and(iii) porous natural melts (bold, solid curves; (B&D): Bagdassarov and Dingwell, 1992;(Q): Quane et a!., 2005).
0.
35
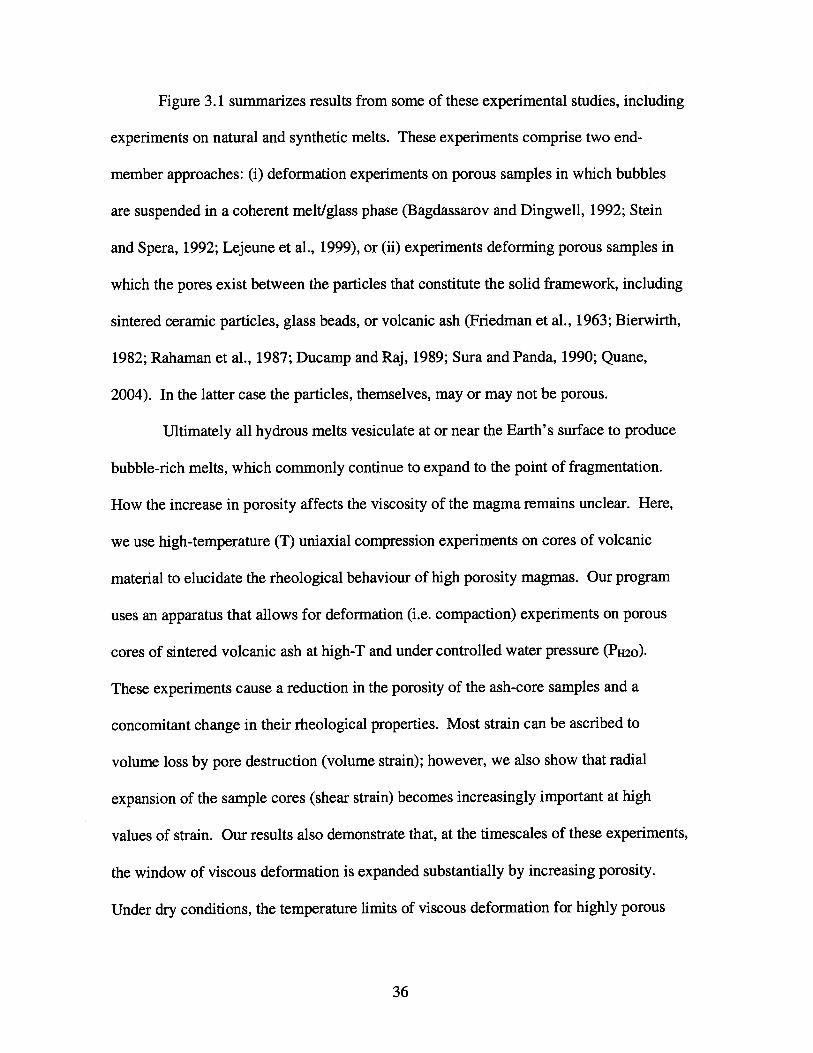
Figure 3.1 summarizes results from some of these experimental studies, including
experiments on natural and synthetic melts. These experiments comprise two end-
member approaches: (i) deformation experiments on porous samples in which bubbles
are suspended in a coherent melt/glass phase (Bagdassarov and Dingwell, 1992; Stein
and Spera, 1992; Lejeune et al., 1999), or (ii) experiments deforming porous samples in
which the pores exist between the particles that constitute the solid framework, including
sintered ceramic particles, glass beads, or volcanic ash (Friedman et al., 1963; Bierwirth,
1982; Rahaman et al., 1987; Ducamp and Raj, 1989; Sura and Panda, 1990; Quane,
2004). In the latter case the particles, themselves, may or may not be porous.
Ultimately all hydrous melts vesiculate at or near the Earth’s surface to produce
bubble-rich melts, which commonly continue to expand to the point of fragmentation.
How the increase in porosity affects the viscosity of the magma remains unclear. Here,
we use high-temperature (T) uniaxial compression experiments on cores of volcanic
material to elucidate the rheological behaviour of high porosity magmas. Our program
uses an apparatus that allows for deformation (i.e. compaction) experiments on porous
cores of sintered volcanic ash at high-T and under controlled water pressure (PH2O).
These experiments cause a reduction in the porosity of the ash-core samples and a
concomitant change in their rheological properties. Most strain can be ascribed to
volume loss by pore destruction (volume strain); however, we also show that radial
expansion of the sample cores (shear strain) becomes increasingly important at high
values of strain. Our results also demonstrate that, at the timescales of these experiments,
the window of viscous deformation is expanded substantially by increasing porosity.
Under dry conditions, the temperature limits of viscous deformation for highly porous
36

cores of ash are reduced by --50 °C. Experiments under PH2O of 2.5 MPa also show that
increasing porosity expands the window of viscous deformation by --140-150 °C,
depending on the water content of the melt. These results have implications for the
processes governing the welding of ignimbrites (Sparks et a!., 1999), fragmentation
cycles in volcanic conduits (Tuffen et al., 2003; Kennedy et al., 2005) and the formation
and flow of clastogenic lavas (Manley, 1996; Wolff and Sumner, 2000).
3.2 Experimental methods
3.2.1 Experimental apparatus
All experiments presented are performed using the Volcanology-Deformation-Rig
(VDR) at the University of British Columbia in conjunction with a water cell specifically
designed for high-temperature experimentation at volcanic conditions in the presence of
water (Quane et al., 2004; Robert et al., 2008). The cell can operate at temperatures up to
1100 °C and fluid pressures of 0-150 IVIPa; sample sizes can be up to 30 mm in diameter
and 100 mm in length. Deformation experiments on sample cores can be performed
under a constant load (<1135 kg) or at constant displacement rate (5 10 to 2.5 102
cmls). The VDR’ s computer system records time, load, displacement; the water cell is
equipped with a transducer that records water pressure continuously.
A detailed description of the experimental apparatus and its calibration for
recovering melt viscosity can be found in Robert et a!. (2008). The original design for
the bottom of the cell has been modified slightly to prevent leaks. Specifically, the
bottom seal remains metal-on-metal, but we have developed a more efficient tightening
mechanism that provides an even pressure distribution around the entire lower seal.
37

Detailed line diagrams and a list of parts for the water cell can be found at
http://www.eos.ubc .calresearchlinfrastructure/cesl.html.
3.2.2 Fabrication of experimental cores
The deformation experiments are performed on cores created by sintering
volcanic ash collected from the Rattlesnake Tuff (Streck and Grunder, 1995). The ash is
sieved to a 0.6-2 mm size fraction and cores are sintered by heating the loose ash in a
mold (2.54 cm by 8 cm) at 900 °C for 20 minutes. Samples are trimmed to -5 cm lengths
creating cores with a 2:1 aspect ratio (Fig. 3.2a). Table 3.1 reports chemical composition
data of the Rattlesnake Tuff ash for: (i) natural (non-sieved) ash; (ii) sintered ash, pre
and post-experiment; and (iii) fused ash (glass). These measurements show that there is
little change in composition after sintering (Table 3.1).
Cores of ash comprise curvilinear and Y-shaped bubble wall shards, complete
vesicles (e.g., bubble shards), smaller proportions of pumiceous shards, and up to 1%
crystals. The sintering process causes point annealing of shards and forms a highly
porous, floating, shard-supported framework (Fig. 3.2b). The cores produced by the
sintering technique have an essentially isotropic texture and show no foliation or
preferred orientation of shards (Fig. 3 .2a, b). The sintered cores feature two types of
bubble shards (Fig. 3.2): (i) a population of thick-walled vesicle shards characteristic of
the original ash, and (ii) a subordinate population of thinner-walled vesicle shards. The
latter population appears to be produced during the sintering process and represent
originally closed vesicles (isolated porosity) that expanded during heating or new bubbles
that nucleated and grew during fabrication. The ash particles are not deformed during
38

Figure 3.2 Starting experimental materials. (A) Photograph of fabricated core (2.5 cmby 5 cm) of Rattlesnake Tuff ash used in high-T deformation experiments. (B) SEMphotomicrograph of pre-experiment core of sintered ash showing proportions of ash (lightgrey) to pore space (black) and the diversity of ash particles, including: bubble walls,glass shards, and pumiceous fragments. Large, round, thin-walled bubble shards arelikely a product of vesiculation of hydrous shards during the sintering process. Smaller,thick-walled bubble shards are a direct product of the original fragmentation.
39

Tab
le3.
1.C
hem
ical
com
posi
tion
ofth
eR
attl
esna
keT
uff
ash.
Oxi
deL
itera
ture
aS
Q0000b
SQ
00
01
cG
RR
S3O
dS
Q0821be
RS
_mel
tSi
eved
Sint
ered
Sint
ered
Post
-exp
’tX
RF
EM
P
Si02
77.1
173
.99
76.7
976
.12
76.1
176
.27
76.2
9
Ti02
0.12
0.15
0.17
0.14
0.16
0.20
0.14
A1
20311
.77
12.1
212
.34
13.1
612
.63
12.8
612
.04
FeO
(T)
1.45
1.11
1.16
1.00
1.14
1.36
1.37
MnO
0.09
0.07
0.07
0.08
0.07
0.08
0.08
MgO
0.00
0.04
0.00
0.07
0.00
0.06
0.04
CaO
0.35
0.29
0.31
0.29
0.30
0.31
0.30
Na
203.
703.
263.
343.
833.
393.
603.
39
K2O5.
234.
424.
574.
594.
594.
744.
89
P2050.
010.
020.
010.
010.
000.
010.
01H
20+
0.00
3.30
0.15
0.14
0.24
0.07
0.00
Tot
al99
.83
98.7
798
.91
98.4
398
.63
99.5
698
.54
aA
naly
sis
from
Str
eck
and
Gru
nder
(199
7).
bN
atur
alR
attl
esna
keT
uff
ash
siev
edto
coar
seas
hfr
omQ
uane
(200
4).
CR
attle
snak
eT
uff
ash
afte
rsi
nter
ing
from
Qua
ne(2
004)
.d
Rat
tles
nake
Tuf
fas
haf
ter
sint
enng
(thi
sst
udy)
.eR
attle
snak
eT
uff
ash
from
post
-exp
erim
enta
lco
re(D
RY
)fr
omQ
uane
(200
4).
XR
Fan
alys
isof
Rat
tles
nake
Tuf
fm
elt
used
inco
ncen
tric
-cyl
inde
rm
easu
rem
ents
(cf.
Rob
ert e
tal
.,20
08).
gE
MP
anal
ysis
ofR
attle
snak
eT
uff
mel
tus
edin
conc
entr
ic-c
ylin
der
mea
sure
men
ts(c
f.R
ober
t et
al.,
2008
).

sintering except around bubbles that formed or expanded during heating; there, shards are
bent around thin-walled bubbles (Fig. 3.2b). One unexpected result of the sintering
process is that the shards become extensively fractured and pitted (Fig. 3.2b); the
microfracturing may result from rapid cooling when the samples are removed from the
sintering oven.
3.2.3 Pre-experimental sample characterization
The physical properties of each sample are measured prior to running the
deformation experiments, including: geometry, density and porosity. The volume of
these highly porous cylindrical sample cores is calculated from averages of replicate
(n=10) measurements of diameter and length (Table 3.2). This volume and the sample
mass are used to compute the bulk density (Pbulk) of the core (Table 3.3: 0.37-0.43 g/cm3).
Skeletal (or framework) density (Psiceietai) is obtained by measuring sample volume via
helium pycnometry and ranges from 0.97-1.40 g/ cm3 (Table 3.3). Connected porosity
QIconnected) is calculated from skeletal and bulk density from the relationship:
connected = 1 — (3.1)Pskeletal
We obtained values of dense rock equivalent (DRE) density for sintered materials by
crushing three sintered cores and performing pycnometry on the resulting powders.
These cores for DRE measurements were also fabricated in the way described above; we
assume all experimental cores to have the same average DRE density (2.36 g/cm3).
Using this average value for powder density we compute total and isolated porosity as:
otal1Pbulk (3.2)
Ppowder
41

Tab
le3.
2.E
xper
imen
tal
cond
ition
s”us
edin
defo
rmat
ion
expe
rim
ents
and
geom
etry
bof
sam
ple
core
spr
e-an
dpo
st-e
xper
imen
t.
2.5.
106
5.26
82.
430
1.26
01.
365
2.5.
106
5.21
01.
100
1.26
71.
417
2.5.
106
5.16
52.
035
1.27
81.
377
2.5
1O
5.06
93.
609
1.27
21.
330
-5.
137
4.95
01.
278
1.27
7
2.5.
106
5.15
23.
703
1.27
11.
284
2.5
10
5.19
62.
381
1.27
21.
314
2.5.
106
5.20
03.
727
1.27
91.
301
2.5.
106
5.04
03.
578
1.28
51.
324
2.5.
106
4.42
01.
942
1.27
71.
368
2.5.
106
5.27
71.
125
1.27
81.
446
2.5
10
4.89
1-
1.29
4-
2.5.
1116
5.20
31.
155
1.28
01.
391
2.5.
106
5.26
9-
1.28
2-
2.5.
106
5.23
2-
1.28
1-
2.51
116
5.20
83.
691
1.28
51.
276
2.51
116
5.29
52.
534
1.24
11.
298
2.51
116
5.31
72.
354
1.30
61.
391
2.5
41
16
5.32
12.
612
1.32
11.
341
2.51
116
5.41
7-
1.28
2-
2.51
0-s
5.40
72.
650
1.29
2-
2.5
111
5.24
30.
817
2.59
23.
142
___V
0
V
11.3
811
.35
26.2
714
.22
9.69
9.65
26.2
86.
94
11.3
111
.24
26.4
912
.13
10.8
810
.84
25.7
620
.05
10.9
310
.71
26.3
625
.36
10.4
510
.45
26.1
519
.18
10.5
610
.58
26.4
312
.91
10.8
310
.86
26.7
019
.82
10.3
110
.09
26.1
319
.71
8.84
8.68
22.6
511
.41
10.4
610
.27
27.0
67.
39
10.1
78.
5025
.74
-
10.5
210
.51
26.7
77.
02
11.0
98.
2527
.22
-
11.1
3-
26.9
6-
11.1
411
.11
27.0
218
.88
11.7
811
.76
25.6
313
.41
11.4
711
.03
28.4
814
.32
11.6
111
.59
29.1
614
.75
12.0
711
.26
27.9
5-
12.0
210
.08
28.3
7-
11.2
811
.22
110.
6725
.34
No
Set
-Up
tT
P(H
20)
zM/A
tl
1r0
rfm0
mf
LJ
RSO
3C
ell
1072
864
0±4
1
RSO
4C
ell
1576
868
1±20
5
RSO
5C
ell
1228
065
9±9
1
RSO
7C
ell
5226
654±
41
RSO
9C
ell
-.54
00[2
5-65
0]—
2.5
RS1
OC
ell
5223
647±
75
RS1
1C
ell
1021
265
9±13
5
RS
12C
ell
5067
662±
83
RS
13C
ell
5121
654±
62.
5
RS
14C
ell
8860
650±
92.
5
RS
15C
ell
1572
366
6±18
2.5
RS
16V
DR
9650
800±
150
RS
17V
DR
1564
290
0±15
0
R51
8C
ell
1059
045
2±12
2.5
RS
19C
ell
1051
238
6±16
2.5
RS2
OV
DR
5208
900±
150
RS2
1V
DR
1060
890
0±15
0
RS
22C
ell
1071
055
0±14
2.5
RS
23V
DR
1066
885
0±15
0
RS
24V
DR
1088
475
0±15
0
RS
25V
DR
1083
850±
150
RS
29V
DR
1745
790
0±15
0a
Tim
e(t
)in
s;te
mpe
ratu
re(T
)in
°C;
wat
erpr
essu
re(P
H,o
)in
MPa
;di
spla
cem
ent
rate
(AIJ
At)
inm
is.
bD
imen
sion
sof
core
s:(1
:le
ngth
(cm
);r:
radi
us(c
m);
V:
volu
me
(cm3))
befo
re(i
.e.,
l)an
daf
ter
(i.e
.l)
expe
rim
enta
lru
ns.

Tab
le3.
3.M
easu
red
valu
esof
dens
ityan
dpo
rosi
tyfo
rpr
e-an
dpo
st-e
xper
imen
tsa
mpl
eco
res.
Den
sity
aP
oros
ityb
1T
bulk
bulk
skel
etal
skel
etal
,to
tal
tota
lco
nnec
ted
,co
nnec
ted
Tis
olat
ed,j
isol
ated
10
PoPf
PoPf
‘‘f
‘‘0
‘t’f
‘‘o
‘‘f
RSO
30.
433
0.79
41.
292
2.11
30.
816
0.66
40.
665
0.64
10.
152
0.02
3R
SO4
0.36
91.
391
1.16
42.
177
0.84
40.
411
0.68
30.
361
0.16
10.
049
RSO
50.
428
0.92
81.
109
2.18
30.
819
0.60
70.
614
0.57
50.
205
0.03
2R
SO7
0.42
20.
542
1.14
31.
753
0.82
10.
770
0.63
00.
691
0.19
10.
079
RSO
90.
415
0.42
21.
119
1.97
60.
824
0.82
00.
629
0.78
50.
195
0.03
5R
S1O
0.40
00.
545
1.10
01.
795
0.83
00.
769
0.63
60.
696
0.19
40.
073
RS1
10.
400
0.82
01.
016
1.87
80.
831
0.65
30.
607
0.56
30.
224
0.08
9R
S12
0.40
60.
548
1.12
21.
890
0.82
80.
768
0.63
90.
710
0.19
00.
058
RS
130.
395
0.51
21.
116
1.77
50.
833
0.78
30.
646
0.71
20.
187
0.07
1R
S14
0.39
00.
759
1.15
81.
991
0.83
50.
678
0.66
30.
619
0.17
20.
060
RS
150.
387
1.39
11.
074
2.20
50.
836
0.41
10.
640
0.36
90.
196
0.04
1R
S16
0.39
6-
1.12
8-
0.83
2-
0.64
9-
0.18
3-
RS
170.
393
1.49
71.
042
2.24
50.
833
0.36
60.
623
0.33
40.
211
0.03
2R
S18
0.40
8-
1.07
4-
0.82
7-
0.62
0-
0.20
7-
RS
190.
414
-1.
105
-0.
825
-0.
626
-0.
199
-
RS2
O0.
412
0.58
81.
120
1.76
90.
825
0.75
10.
632
0.66
70.
193
0.08
3R
S21
0.46
10.
877
1.39
62.
045
0.80
50.
628
0.67
00.
571
0.13
50.
057
RS
220.
403
0.77
01.
103
2.26
50.
829
0.67
40.
635
0.66
00.
195
0.01
4R
S23
0.39
70.
786
1.05
21.
812
0.83
20.
667
0.62
20.
566
0.20
90.
101
RS
240.
432
-1.
105
-0.
817
-0.
609
-0.
208
-
RS
250.
424
-1.
012
1.85
00.
820
-0.
581
-0.
239
-
RS
290.
410
1.77
10.
974
2.26
60.
826
0.24
90.
579
0.21
80.
247
0.03
1a
Bul
kan
dsk
elet
alde
nsity
ofpr
e-(P
o)an
dpo
st-
(o
f)
expe
rim
enta
lco
res
ing/
cm3
Tot
al,
conn
ecte
dan
dis
olat
edpo
rosi
tyof
pre-()
and
post
-()
expe
rim
enta
lco
res.

Pbulk — Pbulkisolated —
Pslcele:at Ppowder
(cf Michol et al., 2008). The total porosity of sintered cores varies from -0.80-0.84 and
comprises both connected (-0.58-0.67) and isolated (-0.14-0.25) fractions (Table 3.3).
3.3 Experimental results
3.3.1 Overview
A total of 21 deformation experiments were performed on sintered cores of
Rattlesnake Tuff ash, including eight at atmospheric pressure (dry) and 13 at controlled
water pressure (wet). The experimental conditions for the 21 experiments are
summarized in Table 3.2. The same constant displacement rate (2.5 i03 mmls) was used
in all deformation experiments except for sample RS25, which was deformed 1 order of
magnitude faster than the others (Table 3.2). The experiments run under dry conditions
are used to illustrate the effects of porosity on melt rheology and establish a baseline
response against which we compare results from wet experiments. The PH2O experiments
provide a closer approximation to nature in that they involve deformation of porous cores
at temperatures and fluid pressures commonly found in volcanic environments.
3.3.2 Dry high-T experiments
Four experiments were performed at atmospheric pressure conditions (dry) and at
a temperature of 900°C (Table 3.2). The four dry experiments RS2O, RS21, RS 17 and
RS29 were deformed to strains () of 0.25, 0.5, 0.75, and 0.82 respectively (Fig. 3.3a;
44

Table 3.4. Analysis of strain.Strain
a bEt St
c d
NoRSO3 0.500 0.539 0.454 0.148RSO4 0.750 0.789 0.735 0.201RSO5 0.585 0.606 0.539 0.139RSO7 0.250 0.288 0.221 0.085RSO9 0.000 0.036 0.024 -0.002RS1O 0.250 0.28 1 0.266 0.020RS11 0.500 0.542 0.513 0.062RS12 0.250 0.283 0.260 0.034RS13 0.250 0.290 0.229 0.059RS14 0.500 0.561 0.486 0.128RS15 0.750 0.787 0.722 0.219RS16 0.500 - - -
RS17 0.750 0.778 0.737 0.153RS18 0.500 - - -
RS19 0.500 - - -
RS2O 0.250 0.291 0.300 -0.014RS2I 0.500 0.521 0.474 0.085RS22 0.500 0.557 0.477 0.119RS23 0.500 0.509 0.494 0.029RS24 0.500 - - -
RS25 0.500 0.5 10 - -
RS29 0.822 0.844 0.769 0.319a Total strain from machine displacement.b Total strain from shortening of the core.C Total strain from porosity reduction.d Total strain from radial increase.
45

Tables 3.2-3.4). All four experiments show a smooth increase in load stress with
increasing strain to 0.5 followed by a much steeper increase in load stress with
additional strain. The resulting stress-strain relationships for each experiment are nearly
identical as shown by the overlapping curves in Figure 3.3a because the starting materials
were virtually identical (i.e., diameter, porosity, etc.; Table 3.3). These results indicate
the high degree of reproducibility of our experimental methods.
3.3.3 Wet high-T experiments
A total of 13 experiments were completed at elevated water pressures of: 1, 2.5
and 5 MPa (Table 3.2). All three different PH2O series were all performed at —650°C.
Experiments performed at elevated water pressure but temperatures < 650 °C are reported
in Tables 3.2-3.4, and are discussed in a later section.
The three experiments RS7, RS3, and RS5 were run at —650 °C and PH2O 1 MPa
(Table 3.2; Fig. 3.3b) and samples were deformed to Et of 0.25, 0.5 and 0.6, respectively
(Table 3.4). Overall the stress-strain relationships are similar to those observed in the
dry, high-temperature experiments. Load stress shows a smooth and continuous rise with
increasing total strain. The stresses achieved during these experiments are about an order
of magnitude lower than observed in the dry high-T experiments. However, significant
rises in stress (—20%) are achieved at lower amounts of strain (25-40%) than was
observed in the dry experiments (>60%). At this strain rate, the 1 MPa PH2O experiments
show an exponential rise in stress at —0.55.
Three experiments were conducted at —650 °C and 2.5 IVIPa (Table 3.2; Fig. 3.3c).
Samples RS13, RS14 and RS15 were deformed to = 0.25, 0.5 and 0.75, respectively
46
Figure 3.3 Summary of experimental data (cf. Table 3.2; Table 3.4) plotted as stress (a)vs. strain (8). (A) Data recorded from high-temperature (—900°C) dry series of experiments. Lower temperature (—650 °C) experiments performed under water pressures of:(B) H2O = 1 MPa, (C) H2O = 2.5 MPa, and (D) P1120 = 5 MPa. Controlled P1120 experiments (i.e. B, C, D) were terminated after —25%, 50% and 75% total strain except forsample RSO5 (B) which recorded —60% strain (Table 3.2).
Atm (Dry) at 900°C
R
A0.5
S29
. 0.25
RS211
j7
RS17
RS2O
0 0.25 0.5Et
RS2O RS21
a
30
C’,a.. 20
10
Co
C’,a
0.25 0.58
0.75
C’,0
0.58
0.58
47

(Table 3.4). The increase in water pressure from 1 MPa to 2.5 MPa allows for
continuous strain at substantially lower load stresses (<2 MPa). Moreover, there is little
to no significant rise in stress over the interval 0 to 0.3. At Et > 0.5 the load stress
required to sustain deformation increases but remains low (— 1.5 IVIPa at r = 0.75) relative
to the dry and PH2O 1 MPa experiments.
Three deformation experiments were run at —645-680 °C and a water pressure of
5 MPa (Table 3.2; Fig. 3.3d). Samples RS1O, RS11, and RS4 were deformed to Et = 0.25,
0.5 and 0.75 respectively. Experiment RS 10 ( = 0.25) shows no increase in stress over
the total deformation path, and the stress required for deformation is near the resolution
level of the apparatus. The intermediate strain experiment (RS1 1; E = 0.5) shows a saw
tooth pattern recorded during experiment that is due to sharp fluctuations in water
pressure around an average value of 5 MPa. Overall, the deformation path shows a
slight, relatively linear increase in stress from -—0.4 to 0.8 IVIPa. To a first approximation,
these experiments show that, at PH2O = 5 MPa, continuous deformation can proceed with
no increase in load stress despite the fact that porosity is being reduced from —80 to 40%.
Only at very high values of total strain (E,> 0.7) where porosity is less than 50% is there
a hint of increasing stress with progressive strain.
3.3.4 Textural analysis of experimental cores
Figure 3.4 illustrates the textural evolution of samples with progressive strain. At
values of 0.25, deformed samples are still highly porous (—0.75-0.78) and cracks that
were evident in fabricated cores are still present. Much of the porosity remains intact and
there is little annealing of shards. Ash shards show mainly point sintering. However,
48

Figure 3.4 Textural evolution of samples during high-T deformation (H2O= 2.5 MPa) of
cores represented by photographs of shortened cores and SEM images showing themicrostructures associated with flattening, folding, and annealing of ash-sized particles(e.g., bubble walls, glass shards, and pumice) and parallel loss of pore space. Images arefor experiments of: —25% (A), 50% (B), and 75 % (C) strain.
E=O.25
49

compared to the post-sintering samples, shards in the experimental run products are
clearly deformed and show more warping and re-orientation perpendicular to loading.
Deformed shards show extension cracks on the outer curvature radius. At higher values
of strain ( 0.5), samples have a porosity between -O.63-O.67. Shards are intricately
folded and alignment of shards and flattening of pumice is apparent (Fig. 3,4b). The
shards also show signs of annealing; cracks in the shards resulting from the fabrication
process are not as common and show signs of healing. Figure 3.4c illustrates the textural
evolution of the ash cores after 75% strain (Et = 0.75). Porosity is reduced to —0.37-O.41.
Most shards are highly deformed, folded and flattened; pumices are also collapsed and
flattened. Shards are collapsed and annealed into coherent masses such that the
boundaries between welded shards are hard to distinguish. Particles have a strong
preferred alignment developed perpendicular to the compression direction. Extension
cracks are absent from deformed shards in high strain samples.
3.4 Post-experimental physical properties
3.4.1 Porosity
Total, connected, and isolated porosity was measured before and after each
experiment, using the methods explained in the experimental methods section (3.2.3;
Table 3.3). As discussed above, post-sintering (pre-experimental) sample cores have a
total porosity varying between 0.81 and 0.84; connected porosity dominates but there can
be up to —0.2 isolated porosity (see Table 3.3). Values of total, connected, and isolated
porosity for the pre- and post-experimental cores are plotted in Figure 3.5.
50

Figure 3.5 Nature and distribution of porosity in pre- and post-experiment sample cores.The presence of water during the deformation experiments does not affect the distributionof the porosity; there is no difference in the trends for dry and wet experiments in termsof porosity. We therefore make no distinction between the two. (A) Measured values oftotal porosity (Fe) are plotted against values of connected (Is: circles) and isolated (Li:squares) porosity for pre-experiment (filled symbols) and post-experiment (opensymbols) cores. The overall reduction in I features an initial decrease in and parallelincrease in Ic followed by a steady loss of alone. A single “dwell-time” experiment(—120 minutes) was performed to track the porosity changes (open vs. filled triangles)prior to starting the deformation experiment (see text). (B) Isolated porosity vs.connected porosity. Pre-experiment values of porosity (grey circles) are near constantplotting between 15O-It lines 0.8 and 0.85, but comprise different proportions of isolatedand connected porosity. Porosity values of post-experiment cores are grouped by totalstrain and highlighted by labelled () grey ellipses. Triangles denote “dwell-time”experiment (as in A).
51

1A 7
0.8
ao-e-0.60
()-e- 0.4
0.2
D CQD
0.8 Z0.6
ø.::.” VN ZzN\ 7
N /‘
fl A NZNU.Lt 7N N
7 N N7 N N
7 NNN N
0.2 VV •05 •.ø.25.
0:82 O.7•5 • NIN
‘0 0.2 0.4 0.6 0.8
Figure 3.5 See previous page for caption.
52

Every experiment begins with a —2 hour equilibration period (“dwell-time”),
designed to allow the cell and sample to reach the experimental temperature and water
pressure. We ran a “dwell-time experiment” to assess the extent and nature of physical
changes occurring during the dwell time and prior to the onset of deformation (see
Appendix 3.A). In this experiment, the sample was taken to experimental conditions
(—650°C and — 2.5 MPa PH2O), given enough time to equilibrate at these conditions, and
was cooled back down to room temperature. The physical properties of the resulting core
were then measured to quantify the extent of change (Tables 3.2 and 3.3).
In addition to a systematic reduction in core length (Appendix 3.A), the major
change in the sample concerns the distribution of porosity. During the dwell time total
porosity is conserved (from 0.824 to 0.820), however, there is a shift in the proportions of
isolated and connected porosity. The data show that, during dwell time, isolated pores
are destroyed while the total abundance of connected porosity increases (triangles in Fig.
3.5). One explanation for this pattern is that, during dwell time, isolated pores become
connected either by coalescence or microfracturing.
Figure 3.5 shows the evolution in porosity during the deformation experiments.
After the dwell time, the sample retains a total porosity of 0.8 comprising both
connected (> 0.65) and a residual isolated (<0.1) porosity. As deformation proceeds,
total porosity is reduced continuously; however, the porosity reduction is mainly at the
expense of connected porosity. After the initial decrease in isolated porosity that occurs
during dwell time, deformation to very high (70-80%) values of strain produces no
further change in isolated porosity.
53

The materials we are experimenting on are extremely porous (1 0.7), and it is
reasonable to assume that most of the strain is accommodated by volume loss. Knowing
the initial and final porosity of a sample, the amount of strain due to volume loss (pore
destruction) can be calculated using the following relationship:
(3.4)l-f
where t is initial total porosity and I is final total porosity (Quane and Russell, 2005).
Figure 3.6 shows that most of the deformation in our experiments can be ascribed strictly
to volume loss (e,), but that at values of strain -0.7, the run-products are more porous
than predicted by Eq. (3.4). This suggests that deformation mechanisms other than
volume strain (strain from porosity loss) are active during the compaction. Further
evidence for more than one mechanism of deformation being active is provided by the
“onset” of significant radial increase of the samples at high amounts of total strain.
3.4.2 Water content
We measure the bulk water content of our experimental run products to verify the
amount of water incorporated into the sample during deformation. Any amount of water
dissolved into the glass will reduce the viscosity of the melt and contribute to the overall
strength reduction of the sample. We found that the timescale of our experiments (- 1.5
to 4.5 hours after initial dwell-time) is sufficient to allow water dissolution into the glass.
The bulk water content results are presented and discussed in Appendix 3.B (Table 3.B).
54

-e
t
Figure 3.6 Measured values of total porosity (J) are plotted against total machine strain
()• The black bar (top left) denotes the range of initial porosities of cores for the entiresuite of experiments (0.804 to 0.844). The grey shaded band represents the field ofmodel curves of decreasing porosity calculated for a known initial porosity as a functionof increasing strain and assuming pure volume strain. The model curves converge to zeroporosity as E approaches a value equal to the initial porosity. Volume strain is sufficientto explain these data until E -60% where the run-products may have higher porosity thanpredicted. This suggests that deformation mechanisms other than volume strain (strainfrom porosity loss) are active during compaction (see text and Fig. 3.8).
0 0.5 1
55
3.5 Analysis of experimental results
3.5.1 Effect of temperature and PH2O.
We ran six additional experiments to document the effects of temperature on the
rheological behaviour of these porous volcanic materials. Three dry experiments,
involving samples RS23, RS16 and RS24, were carried out at 850, 800 and 750 °C,
respectively (Fig. 3.7a). The three experiments deformed samples to = 0.5 and provide
data that map the temperature boundary between ductile and brittle deformation for dry
porous samples at the characteristic deformation timescale of these experiments (texp).
Sample RS23 shows a smooth increase in stress with increasing strain, but compared to
the 900 °C dry experiment (RS21), the stress increase with strain at 850 °C is more
pronounced. The lower temperature experiments (750 and 800 °C) show strikingly
different behaviours than observed in the higher temperature experiments. Instead of a
smooth increase of stress with increasing strain, they display a saw tooth pattern with
sharp (20%) stress build-ups followed by quasi-instantaneous stress drops (Fig. 3.7a).
Run-products for samples deformed at those low temperatures are extensively fractured,
often broken-up in smaller pieces, or exhibiting fractures (see picture insets in Fig. 3.7).
This suggests that, at the timescale of these experiments, the transition from ductile to
brittle deformation of the dry porous cores occurs at between 850 and 800 °C.
The effect of water pressure is summarized in Figure 3.7b by comparing results of
a 900 °C dry experiment to results from parallel experiments involving more than 50%
strain at 3 different water pressures. The dry experiment (900 °C) was performed at a
temperature -250 °C higher than any of the experiments performed at water pressures of
1, 2.5, and 5 MPa. Increasing water pressure during deformation significantly reduces
56

sample strength, and allows for large amounts of deformation to be obtained with
minimal stress imposed. The high temperature experiment plots between the 1 and 2.5
MPa PH2O experiments and illustrates the trade-off between temperature and water
pressure. At low water pressures and --650 °C, the porous cores carry more stress than
the dry core at 900 °C, while at —650 °C and water pressures greater that 2 MPa the
material is substantially weaker (Fig. 3.7b).
We also ran three high-PH2Oexperiments at reduced temperatures to document the
temperature-controlled transition from ductile to brittle deformation in the wet systems.
Samples RS22, RS18 and RS19 were deformed at 550, —450 and —385 °C, respectively,
at the same displacement rate of 2.5 i03 mrnls, to a total strain of 0.5. A PH2O of 2.5 MPa
was chosen as an intermediate response between the two end-member water pressures
used in our experiments. Sample RS22 (550°C) showed a smooth increase in stress with
increasing strain, but stress was --3 times higher than recorded in the —650 °C, 2.5 MPa
PH2O experiment (RS14) at the same values of e. Samples RS18 and RS19 showed a
pattern of brittle deformation characterized by sharp rises and drops in stress with
increasing strain, but without stress ever building up over 1 IVIPa. The pattern is very
similar to that of the dry experiments (Fig. 3.7a) but the stress drops are not as
pronounced. On the basis of these response curves, we suggest that for these
experiments, the transition from ductile to brittle behaviour occurs at between 550 and
450 °C. We expect that the brittle-ductile boundary will shift to lower temperatures with
increasing PH2O or with lower rates of displacement (e.g., longer experimental
timescales).
57

Figure 3.7 Experimental data used to illustrate the effects of temperature and PH2O onsample rheology. (A) Experimental data plotted as stress (0) vs. strain () foratmospheric dry experiments run to —50% strain and performed over a range oftemperatures (750-900 °C). Experiments at 850-900 °C show o vs. E patterns that areconsistent with ductile deformation. Dry experiments run at 750 and 800 °C show muchmore complicated patterns and are characterized by a 3-fold increase in stress andcyclical rises and drops (30-40%) in stress suggesting deformation by brittle fracturing.Run-products for samples deformed at those low temperatures are extensively fractured,often broken-up in smaller pieces, or exhibiting fractures (see picture insets). (B) Resultsof wet deformation experiments (PH2O: 1 to 5 MPa; T: —650 °C) compared to data fromdry, high-T (900 °C) experiment (RS17; Fig. 3.3). The main effects of PH2O are to reducethe strength of cores and to permit ductile deformation at temperatures well below theeffective Tg of the dry cores (see Fig. 3.7a and text).
58

A
0.1 0.2 0.3 0.4
-T
3
c0
1
00
0
Figure 3.7 See previous page for caption.
0.5
0.4
59q“

3.5.2 Analysis of strain
During these deformation experiments, total strain (es) is given by:
= L0—L,(3.5)
where L0 is the initial sample length and Lf = L0 — (total machine displacement). During
deformation samples get shorter and increase in radius (Table 3.2). We calculate volume
strain () using Eq. (3.4), and radial strain (Er) from the initial and final sample radius:
2
8r=1 (3.6)rf
Most samples show uniform radial increase along their entire length, but bulging
(greatest radial increase at the mid-point of sample length) is observed in run-products
taken to high total strain (Et > 0.6).
Figure 3.8 illustrates how the strain is progressively partitioned between volume
(E) and radial strain (Er). At low values of total strain, the two metrics are sub-equal (Eq,
- Et) and plot near the 1:1 line indicating that most of the observed strain is being
accommodated by volume loss (Fig. 3.8a). However, as total strain increases the
departure from the 1:1 line increases, as does the calculated amount of radial strain (Fig.
3. 8b). These patterns clearly show that the total strain, as manifest by shortening of the
core, cannot be fully accommodated by porosity reduction (Em: volume strain) but
requires radial bulging (Er: shear strain). The proportion of shear strain to volume strain
increases with increasing strain (Fig. 3.8a-c).
The combination of volume and shear strain (E + Er) can exceed the total strain as
represented by shortening of the core (Fig. 3.8c-d). At low values of strain the
combination of volume and shear strain are more or less equal to total strain represented
60

by shortening of the core. However at values of total strain above --0.5, the combination
of + Er is greater than the total strain (data plot above 1:1 line; Fig. 3.8d) and the
deviation increases with increasing e. These patterns indicate the nature of coupling
between the two strain mechanisms.
At low values of strain, where pore fraction>> solid fraction, total strain is
mainly accommodated by volume loss and radial strain is minimal. There is also little to
no evidence for coupling between these two strain mechanisms (i.e., volume vs. shear
strain) and they may operate independently. However, at higher amounts of strain (Et>
0.6), where porosity < 0.6, strain is accommodated by volume loss and a significant
component of radial bulging. This behaviour is also expressed in Figure 3.6 where the
measured residual porosity departs from the model vs. E curves at Et > 0.6. Figure
3.8c shows the changes in proportions of E to Er with increasing total strain. At low
values of strain E, is substantially greater than Er, however, the proportion of Er increases
steadily with increasing strain. In fact, at values of Et> 0.5, the summation of and Er
exceeds the total strain computed from shortening of the core (Fig. 3. 8d), suggesting that
there is strong coupling between the volume strain and shear strain. Moreover, at Et > 0.8
the combined values of E,+ 6r fall above the iso-strain contour for 1.0 (Fig. 3.8c) and
incremental increases in strain are dominated by radial expansion rather than by volume
loss.
The implication is that once there has been sufficient strain (Et 0.6) to reduce
porosity to a critical value ( <0.6) subsequent compaction (shortening of core) is
accommodated by porosity reduction (volume strain) and concomitant radial bulging
61

0.6C)
0.4
0.2
CO 0 1
Figure 3.8 Analysis of strain in experimentally deformed cores. (A) Total strain () asrecorded by piston displacement is plotted against the strain computed from porosity lost
(s). Values of (volume strain) increase linearly with but are always less than totalstrain. (B) Total strain () plotted against strain ascribed to increase in cross-sectionalarea (i.e., radius) of the deformed core (Er) Values of Er are always smaller than totalstrain but increase markedly with increasing total strain. (C) Values of plotted against
Er• Dashed lines are iso-EL contours (e.g., = E + (D) Values of plotted against thesum [ - Erj• Data plotting above the solid line suggest coupling of and Er (see Fig.3.8c); the extent of coupling is proportional to the distance each point is above the 1:1line and increases with total strain.
:c08 • •
%. •%%%
%. %. ‘% ‘%%. %. %..
••%
r . \p.. %.
•% %
%. ‘% ‘% ‘7•%. *%__“ •% • %..
‘Ss/% S’S s ‘S ‘S ‘S‘S ‘S ‘S ‘S ‘S ‘S
‘S ‘S ‘S
0.5E
62

(shear strain). At this point, progressive strain comprises volume strain (porosity
reduction) that is dependent on a component of shear strain; the degree of coupling
between volume and shear strain is indicated by the upwards departure from the 1:1 line
in Figure 3.8d.
In summary, the high-T deformation experiments elucidate three potential strain
regimes: (i) at low values of strain ( = < 0.5) where porosity > 0.6, most strain is
accommodated volume strain and a subordinate amount of independent (or weakly
coupled) shear strain; (ii) at intermediate values of strain ( --0.5-0.6), where porosity
50-60%, shear strain becomes increasingly important and volume and shear strain are at
least weakly coupled; and (iii) at high values of strain (> 0.7) where porosity drops to
below 40%, volume strain and shear strain are strongly coupled as evidenced by
[Ec+Er]/Et> 1.0.
3.5.3 Effective viscosity
The digital data recorded in each experiment provide load stress, total and
incremental displacement (strain) at each time step and, thus, incremental and total strain
rate. These data allow us to compute the apparent viscosity of the sample during
deformation as a function of total strain (Fig. 3.9). The apparent viscosity (Tlapp) of the
sample is the viscosity of the porous aggregate of volcanic ash at the experimental
conditions, and is calculated as:
r1app (3.7)
where a is stress and is the total strain rate. In general, these experiments show the
63

12 Atm(Dry)at900°C ‘
o RS2O l
3)o I 0
—
‘0 0.2 0.4 0.6 0.8 1
P0=5 MPa(04
- 0 (1.0)C3 RS111
D. 659°C RSO4
°10 (1.5))
9(2.0)
647°C
—
D0.8 1 0.2 0:4 0.6 0:8
Figure 3.9 Summary of apparent viscosity calculated as load stress over total strain rate,plotted as a function of total strain. (A) Calculated apparent viscosity from high-temperature (—9OO°C) dry series of experiments. Calculated apparent viscosity for lowertemperature (—65O °C) experiments performed under water pressures of: (B)
H9O= 1
MPa, (C) H2O = 2.5 MPa, and (D) H2o = 5 MPa. Open circles at = 1 represent modelmelt viscosity for water content in parentheses (wt.% H20). Grey gradient shading anddashed vertical line represent the onset of significant radial strain observed in run products.
0 0.2 0.4 0.6 0.8 1
12
0 0.2 0.4 0.6
64

porous cores of ash to have a strain-dependent behaviour where, under the constant
displacement rate constraint, stress increases with increasing strain (i.e., strain
hardening). The strain dependent rheology of these samples is a reflection of the porosity
reduction due to compaction. The strain hardening is most pronounced at high values of
strain (e.g., > 0.5; Fig. 3.3) where increases in strain cause high rates of porosity
reduction (see Fig. 3.6). In our ductile experiments, the increase in stress with increasing
strain can track the increase in apparent viscosity of the porous melt samples during
deformation due to porosity reduction.
We have demonstrated that deformation of our samples is expressed in, at least,
two different ways: (i) volume strain due to porosity loss; and (ii) shear strain manifest by
an increase in sample radius. We, therefore, recognize that the apparent viscosity values
we have plotted in Figure 3.9 are a product both of volume strain and a shear strain, and
that the contributions of these components varies as a function of total strain. Moreover,
the total experimental strain rate will also comprise varying proportions of volume strain
rate and shear strain rate. Volume strain rate dominates up to values of total strain of 0.6,
whilst at total strain > 0.6, shear strain rate is expected dominate, and Eq. (3.7) becomes a
cruder approximation of viscosity. The switchover between the two strain regimes is
illustrated schematically in Figure 3.9 by a diffuse boundary (and shading) at -0. 6 total
strain.
Values of apparent viscosity calculated for samples deformed under dry
conditions at high temperature are self-consistent and, again, demonstrate the
reproducibility of the technique used in this study (Fig. 3.9a). Overall, porosity reduces
the viscosity of the sample. The dry deformation experiments clearly show a strain
65

dependent behaviour that translates into a rise in apparent viscosity from 109.1 to 1011.9 Pa
s over the full range of porosity reduction from 0.8 to 0.25. Over the interval 0 to 0.5
viscosity rises from 109.1 to 10100 compared to melted Rattlesnake Tuff which has a
viscosity of 10102 at 900 °C. At values of strain > 0.5, Eq. (3.7) cannot be used to model
viscosity accurately because of the substantial component of shear strain (radial increase).
Post-experiment analysis of samples shows that the cores have water contents that
generally exceed values predicted by standard 1120-melt solubility models (see Appendix
3.B). The measured values may represent a combination of chemically dissolved and
mechanically trapped (e.g., nanopores) water. For the purposes of analysis we have
assumed that during deformation the melt fraction of the samples contains, at a minimum,
the H2O content predicted by the Newman and Lowenstem (2002) model. For a
temperature of 650 °C, the model predicts values of 0.42, 0.67 and 0.95 wt.% H2O for 1,
2.5 and 5 JVJPa PH2O, respectively,
The apparent viscosity of low PH2O (1 MPa) system is also clearly strain-
dependent and shows an increase in apparent viscosity from iO” to 10106 Pa s over the Et
interval 0 — 0.5. At higher values of strain the calculated apparent viscosity rises
markedly due to dominance of shear strain and the breakdown of Eq. (3.7). At 1 MPa,
the melt is expected to have 0.42 wt.% dissolved water and a melt viscosity at 650 °C of
1012 Pa s. It is apparent that the porosity reduces the effective viscosity by up to 2 orders
of magnitude. These experiments probably could not be run effectively on the bubble
free melt because these temperatures are below the glass transition temperature (Tg) of
the melt (e.g., r 1012 Pa s).
66

The same effects are not observed at higher water pressures (2.5-5 MPa). Instead,
these experiments suggest near constant values of apparent viscosity until Et exceeds 0.6.
For example, the corresponding high-strain (e 0.75) experiments for 2.5 and 5 IVIPa
PH2O show only slight rises in viscosity of 109598 and 10b0.0b02 Pa s, respectively over
0-0.5. Given the water contents predicted by Newman and Lowenstern (2002) for the
experiments RS15 (0.67 wt. %) and RSO4 (0.95 wt. %) we expect melt viscosities at 650
°C of 10112 and iO’°5 Pa s. Using these limiting values for H20 solubility, it appears that
for all water pressures the porous melts have substantially lower viscosities than their
hydrated melt (non-porous) equivalents (see white circles in Fig. 3.9). At higher values
of PH2O, the effects of strain hardening are greatly reduced (Fig. 3.3) and the apparent
viscosity of the porous melts remains approximately constant over most of the
deformation (i.e. compaction) history.
3.6 Discussion
Our experiments explore the transient rheology of particulate porous natural melt
from high (-4J.8) to moderate (—0.25) pore fractions under both atmospheric pressure
conditions and at elevated water pressure. During sample deformation strain is
accommodated by: (i) shortening of the sample core; (ii) reduction in sample porosity;
and (iii) increase in the radius of the sample core. The strain is achieved via a
combination of volume strain (reduction of pore space) and shear strain (radial
expansion). The relative contributions of these two mechanisms to vary as a function
of strain; at high strain (Et> 0.6) and relatively low pore fractions (<0.6) shear strain
begins to dominate and both mechanisms are strongly coupled. Our unjacketed
67

deformation experiments are in that way analogous to deformation occurring in an
unconfined ignimbrite sheet able to flow freely horizontally, perpendicular to the loading
direction due to gravity.
The deformation experiments clearly document the strongly strain-dependent
rheology of these cores of volcanic ash. The rate of strain hardening increases rapidly as
strain increases and probably mirrors the increasing role of shear strain as compaction
proceeds. At high values of total strain, samples develop a strong foliation from
alignment of glass and pumice shards, consistent with the major increase in shear strain.
The presence of a fluid phase (i.e. PH20) appears to reduce the extent of strain hardening.
We observe no apparent textural differences between samples deformed at dry,
higher temperature (900 °C) conditions and lower temperature (650 °C) experiments
performed at elevated PH2O. Figure 3.10 comprises thin section (A) and SEM
photomicrographs (B) of sample RS17 resulting from dry compaction at 900 °C and to
75% strain. Corresponding images are shown (Fig. 3. lOc, d) for sample RSO4 which
derives from an experiment run at -650 °C, under 5 MPa PH2O, and to 75% strain. The
run products are indistinguishable from one another. This demonstrates that different
experimental (i.e. environmental) conditions (Table 3.2) can produce distinct compaction
paths (Fig. 3.3), yet yield virtually identical products. The main difference in the run
products is their measured water contents: 0.15 wt.% for RS17 vs. 1.61 wt.% for RSO4
(see Table 3.B); the run-products have porosities of 37% and 41% respectively.
This has implications for natural systems, wherein the features of welded volcanic
deposits are used to deduce the nature of compaction and welding processes. Welding
intensity in pyroclastic deposits is a reflection of emplacement conditions of the deposit
68

Figure 3.10 Textural comparison of samples run under dry and wet conditions. Scan ofpolished thin section (A), and SEM photomicrograph (B) for sample RS 17. Scan ofpolished thin section (C), and SEM photomicrograph (D) for sample RSO4. Bothsamples were deformed to 75% strain. Sample RS17 was deformed under dry conditions,at 900 °C, and sample RSO4 was deformed at = 5 MPa, and -65O °C.
69

(e.g., emplacement temperature and accumulation rate), physical and chemical properties
of the materials (e.g., porosity, composition and water content of the melt), and dynamic
feedbacks during welding (e.g., destruction of porosity, water resorption) (Smith,
1960a,b; Guest and Rogers, 1967; Riehie et a!., 1995; Sparks et al., 1999). These
environmental parameters can combine in a multitude of ways to generate the same
overall intensity of welding. Ideally, we hope that there are features that can be observed
in the field that can be used to gauge the relative roles of these parameters (e.g., T, PH2O,
load) (Grunder and Russell, 2005; Russell and Quane, 2005). The results above cast
some doubt on this anticipation, in that material with virtually identical physical and
textural properties has resulted from two distinct end-member processes: (i) hot dry
compaction, and (ii) cool, wet compaction. Therefore, there is likely to be no unique
solution for the conditions required to develop a specific welding intensity or facies. This
insight serves to highlight the over-simplification of many early and existing models of
the welding process in pyroclastic deposits and welding facies distribution, where
temperature and load are the only conditions considered (e.g., Ross & Smith, 1961;
Ragan & Sheridan, 1972). We suggest that models of welding zonation development,
and critically, welding profiles (Reihle et al., 1995) from which porosity and permeability
information is inferred, be re-examined to account for the effects of porosity and water
pressure before, during and after welding has occurred.
Part of this study demonstrates the pronounced effect of temperature on the
rheological behaviour of these cores of volcanic ash. Under dry conditions, and a
constant displacement rate of 2.5 i0 mm/s (strain rate - i0 s1), experiments conducted
at 850 °C or higher produced stress-strain relationships consistent with viscous
70

deformation (Figs. 3.3, 3.7a). The same experiments performed at 800 °C or lower
produced stress-strain patterns indicative of brittle relaxation (Fig. 3.7a). These data
imply that, at the timescales of our experiments, the rheological glass transition
temperature (Tg) (marking the temperature boundary between ductile and brittle
behaviour) resides at between 800-850 °C (Fig. 3.1 la). The two viscous experiments
(RS 16 and RS23) were used to extract values of effective viscosity at identical values of
= 0.25 where the porosity is still very high (—0.75-0.78; Table 3.3). These values are
plotted at their experimental temperatures (filled circles; Fig. 3.11) and used to define an
Arrhenian curve having the same slope as the melt viscosity (open circles) and
representing the temperature dependence of viscosity for dry porous cores of Rattlesnake
Tuff ash. We have adopted and plotted a mid-range (e.g., 800 to 850 °C) value for the Tg
of 825 °C (Fig. 3.1 la; dashed vertical line). The same viscosity data are plotted in terms
of their characteristic relaxation timescales by scaling the melt viscosity to the bulk shear
modulus (Dingwell, 1995). The intersection of the apparent Tg and the viscosity curve
for the dry porous melt (Fig. 3.1 la) implies an average experimental timescale (texp) of
—4 s (Fig. 3.1 lb). This is illustrated by a grey horizontal dashed line on Figure 3.1 lb.
Where the porous sample has a characteristic relaxation timescale (‘tr) shorter than texp,
the experimental response will be viscous. Conversely, at lower temperatures (i.e., <825
°C) samples will have values of tr that are larger (i.e. longer) than texp; under these
conditions the rate of building stresses in the core (texp) is faster than the capacity of the
sample to relax viscously (tr). This results in brittle failure of the sample (Fig. 3.7a,
3.1 lb). The horizontal arrow marks the intersections of the experimental timescale (texp)
with viscosity curves for the Rattlesnake Tuff melt and the same melt with —75% porosity
71

Figure 3.11 Summary of variations in viscosity and relaxation time scale for theRattlesnake Tuff melt resulting from temperature, dissolved water content and porosity.(A) Viscosity of the dry, porous Rattlesnake Tuff melt (taken at Et=O.25) as a function oftemperature, and compared to the viscosity of melt alone. Solid line is based onexperimental measurement of anhydrous melt (Robert et al. 2008); dashed line is anArrhenian fit to the experimental viscosity data (this study). Low temperature, brittleexperiments are represented by filled squares, and viscous, higher temperatureexperiments by filled circles. The vertical, dashed grey line is the effective glasstransition temperature for the dry, porous system (825 °C). (B) Relaxation timescale (seetext) of the dry, porous melt as a function of temperature. Experimental data andconditions as in (A). The characteristic experimental timescale (4 s; see text) is shownas a dashed grey horizontal line. The expansion of the viscous deformation field due toviscosity is illustrated by a grey arrow (see text). (C) Viscosity of the wet (PH2O=2.5
MPa), porous Rattlesnake Tuff melt (taken at Et=O.2S) as a function of temperature, andcompared to the model viscosity (Giordano et al., In Press) of the hydrous melt (wt.%H20 in parentheses), for solubility of 0.67 wt.% at 650 °C and 0.78 wt.% at 550 °C(Newman and Lowenstern, 2002). The vertical, dashed grey line is the effective glasstransition temperature for the wet, porous system (528 °C; see text). (D) Relaxationtimescale of the wet, porous melt as a function of temperature. Experimental data andconditions as in (B). The characteristic experimental timescale (same as in C) is shownas a dashed grey horizontal line. The expansion of the viscous deformation field due toporosity is illustrated by a grey arrow (see text).
72
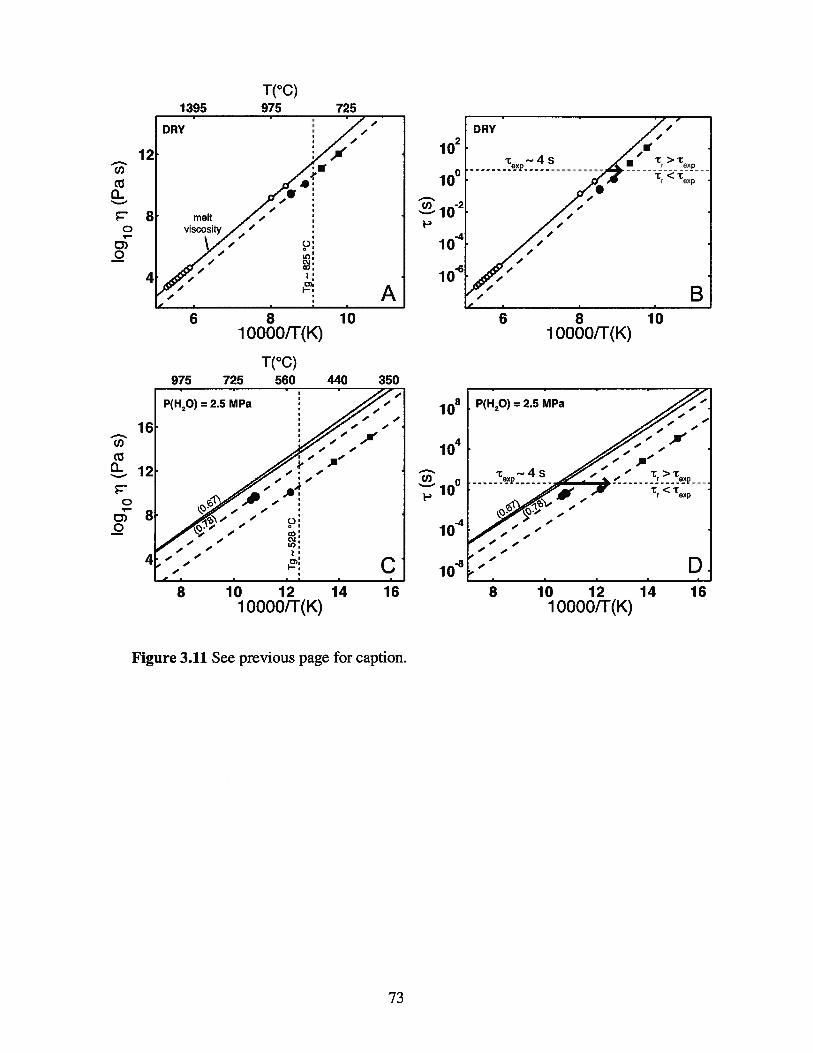
Figure 3.11 See previous page for caption.
T(°C)1395 975 725
12
8
4
16
U)
0
0r
0)C
U)
ct0
01
0)0
102
100
U) -2— 10
1
106
108
1
U)
1
108
1 0000/T(K)6 8 10
1 0000JT(K)
T(°C)975 725 560 440 350
P0120) = 2.5 MPa
—
;;;;;;-
C.- :/ co
— c’J, U,
._ —,-
—
8
4
8 10 12 14 16 8 10 12 14 161 0000/T(K) 1 0000/T(K)
73

(Fig. 3.1 ib); namely their respective glass transition temperatures. Under dry conditions,
the addition of porosity expands the window for viscous deformation by -5O °C.
In a similar manner, we have explored the effect of porosity on the viscosity of
hydrated melts. The viscosity of hydrated melts are calculated (Giordano et al., In Press)
for melts having fixed water contents consistent with their experimental conditions (solid
lines, Fig. 1 ic): 2.5 IVIPa PH20 and 650 (0.67 wt.%) and 550 °C (0.78 wt.%). Parallel
curves have been drawn through the experimental data points taken from the hydrous
deformation experiments that showed a viscous response. These curves represent the
temperature dependence of the effective viscosity of these hydrated porous cores. The
two lower temperature hydrous experiments (--450 and —385 °C) that gave brittle
responses are plotted as squares (Fig. 3.1 ic), and suggest that the rheological glass
transition temperature for these hydrous cores resides between 550°C and 450°C. We
have used the apparent average timescale of the experiment (Texp 4s) to constrain the Tg
of the most hydrous sample to 528 °C (Fig. 3.1 lc). Under a water pressure of 2.5 IVIPa,
the addition of porosity to these hydrated melts increases the field for viscous
deformation by 140-150 °C (grey arrow in Fig 3.1 id). Increasing the displacement rate
by 1 order of magnitude at 900 °C also pushed the material into the field of brittle
behaviour (RS25). Increasing displacement rate causes an order of magnitude decrease
in the experimental timescale (_.101 or 102 s) and the characteristic relaxation timescale
of the sample staying constant. The result is that experiments that originally featured
samples with tr <texp and deformed viscously may now find that texp <t such that
viscous relaxation of the sample cannot keep pace with the faster rate of deformation.
74
3.7 Acknowledgements
This research is funded by the Natural Sciences and Engineering Research
Council (NSERC) via the Research Tools and Instruments program (JKR), the Discovery
Grants program (JKR), and the PGS fellowship program (GR) and by the Italian
Dipartimiento della Protezione Civile (2004-06 Agreement, Instituto Nazionale di
Geofisica e Vulcanologia — INGV). Chemical analyses of cores of Rattlesnake Tuff ash
were generously provided by Steve Quane. We thank Ben Kennedy, Steve Quane and
Perrine Paquereau for countless rheology-related discussions, most of which are ongoing.
Finally, we especially thank UBC’s Earth & Ocean Sciences machinists Ray Rodway and
Jörn Unger for their support throughout this experimental program.
3.8 Appendix 3.A: Correction for dwell-time effects
Our deformation experiments are conducted at constant displacement rate and at
preset and constant values of temperature and PH20. The digital output includes load,
displacement and time, which are converted to stress, strain and strain rate. Our goal is to
invert these datasets for the rheological properties of the volcanic cores as a function of
T, PH2O and porosity. Characterization of sample cores before and after the experiments
provides additional metrics that can be used to verify or help interpret the digital output.
It is implicit that the experiments are performed on sample cores that are fully
equilibrated with the experimental conditions (i.e., T and PH20). Therefore, each core
was maintained at the experimental conditions for 1-2 hours prior to lowering the piston
and starting the deformation experiment. Whilst the pre-experiment dwell-time ensures
that a sample has had adequate opportunity to equilibrate with the experimental
75

conditions (T and PH2O), there is also the possibility that the sample will undergo physical
changes (i.e., geometry, porosity) before the deformation experiment begins.
We have made every effort to calibrate the effects of the pre-experiment
equilibration process on the sample cores by running “dwell-time” experiments. In these
experiments the core was left at experimental conditions for 1-2 hours, cooled to room
temperature in the exact same way every sample is cooled after a deformation
experiment, and then removed. Comparison of the post dwell-time core properties (i.e.,
length, radius, porosity, etc.) with its original properties demonstrated the extent of these
pre-experiment modifications (Figs. 3.5; 3.6; 3.A). The main effect is shortening of the
core as evidenced by the difference between the digitally recorded piston displacement
(i.e., no imposed displacement) and the post-experiment measured change in core length
(Fig. 3.A). A model line of unit slope was fit to the data that supports a systematic pre
experiment shortening of the core of 1.73 mm, consistent with shortening by 1.87 mm of
“dwell-time” experiment sample RSO9.
An ancillary effect of the dwell time involves the reorganization of porosity (Fig.
3.5). The dwell time experiment suggests that total porosity is conserved, but the
conservation is achieved by a parallel loss (destruction) of isolated porosity and gain
(production) of connected porosity. At the end of the dwell time, the sample cores are
left with a reduced, relatively consistent (2 to 10%), amount of isolated porosity. This
post dwell-time value of isolated porosity is maintained throughout the deformation
experiments while connected porosity is reduced continuously (Fig. 3.5).
76

c3)
Cci)
0
Cl)
50
Figure 3.A Values of piston displacement (digital output) are plotted against the mea
sured shortening (L0 — Lf) of the core for experiments listed in Table 3.1. Total shortening
of the cores is always slightly greater than piston displacement. A model line of unit
slope has been fit to the data (filled circles) and returns an intercept of 1.73 mm that
accords well with shortening (1.87 mm) during “dwell time” experiment (DTE: see text).
This suggests a systematic difference between these two metrics of strain that results
from shrinking of the core during the dwell time immediately prior to start of the experi
ment.
10 20 30displacement (mm)
77
3.9 Appendix 3.B: Water contents of samples
We analysed our post-experiment sample cores for bulk water content by
InfraRed detection of volatiles extracted at 1000 °C. All samples were crushed to < 100
tm. Replicate measurements of H20 content on sample rtf5 were made by Karl-Fischer
titration as a test of the accuracy of results from ALS-Chemex Laboratories (Fig. 3.B;
Table 3.B). The two methods agree to within 2s experimental uncertainty. Measured
water contents increase regularly with increasing experimental water pressure (Fig. 3 .B).
This pattern suggests that the cores absorb significant water during the dwell time (e.g.,
sample RSO9; black square) and that the amount taken in rises as a function of PH2O.
Indeed, our measured values of H20 content are 2-3 times higher than those predicted by
solubility models over the same P-T conditions used in the experiments (Newman and
Lowenstern, 2002).
If the measured H20 contents are true estimates of H20 solubility in this melt
under the experimental conditions (Table 3.2), then it implies that the current models for
H20 solubility in silicate melts are inadequate at these low pressures. Although unlikely
(i.e., Liu et al., 2005; Zhang, 1999), this remains at least a possibility because there are
virtually no H20 solubility data for silicate melts at our experimental pressures (i.e., <<
20 MPa; Di Matteo et al., 2006). A single exception is the older work of Friedman et al.
(1963), who also obtained higher than predicted water solubility in rhyolite over the same
pressure range as used in our experiments. We also cannot rule out the possibility that
our higher-than-expected H20 contents result from re-equilibration of the samples at
lower temperatures during the quenching process (i.e., retrograde solubility).
78

4— 0.4
dry experimentsnatural RS0.3 /
3 0.2sinte red cores
..— (pre-exp)
o__-, 0.1
RS melt0 0.1 0.2
+ 2 rtf5 (KFT)—, HO(MPa)
oC’.’
• rtf5(IR)
(MPa)2
Figure 3.B Bulk water contents measured for experimental cores by InfraRed detectionof water released at 1000°C and plotted against experimental water pressure (opencircles; black square for DTE RSO9). Water contents for atmospheric dry experimentalcores are shown in inset. Sample core rtf5 (triangles) was measured by both, InfraReddetection (filled) and Karl-Fischer titration (open) and the two methods return comparable results. Experimental cores have higher water contents than expected for meltsequilibrated at the experimental pressures and temperatures when compared to valuespredicted byH20-soiubility models for silicate melts (solid lines; Newman & Lowenstern, 2002) (Table 3.B). These results strongly suggest that the sample cores are fullysaturated with water and that the experimental time scale is long enough to reach equilibrium. Results of experimental solubility experiments of Friedman et a]. (1963; filledcircles; T: 485 (black) - 785 (light grey) °C) also plot above model solubility curves.Measured water content of natural Rattlesnake Tuff ash is plotted as open squares.
79

Table 3.B. Values of H20 and LOT (wt. %) for post-experiment coresa.
No T(°C) PH2O (MPa) H20+b LOlRSO3 640±4 1 0.76 1.22RSO4 681±20 5 1.68 2.37RSO5 659±9 1 0.67 0.95RSO7 654±4 1 0.87 1.44RSO9 [25-650] —2.5 0.98 1.23RS1O 647±7 5 2.02 2.37RS11 659±13 5 1.76 2.13RS12 662±8 3 1.63 2.13RS13 654±6 2.5 1.43 1.82RS14 650±9 2.5 1.38 1.84RS15 666±18 2.5 1.27 1.47RS16 800±15 0 0.21 1.33RS17 900±15 0 0.15 0.30RS18 452±12 2.5 1.61 2.98RS19 386±16 2.5 1.29 2.57RS2O 900±15 0 0.20 0.12RS2I 900±15 0 0.14 0.27RS22 550±14 2.5 1.50 1.39RS23 850±15 0 0.22 0.02RS24 750±15 0 0.24 1.81RS25 850±15 0 0.26 1.27rtf5 645±5 3 1.58 1.88rtf5 (KFT) 645±5 3 1.93 -
RS meltc -- 0.07 0.27
RS naturaF’ - - 3.47 3.97RS sinterede -
- 0.13 0.36a Experiments (RS#) as listed in Table 3.1.b H20+ by InfraRed detection except for Karl-Fischer titration of rtf5(KFT).C Volatile contents of melted Rattlesnake Tuff after concentric-cylinder experiments (cf.Robert et al., 2008).d Average bulk water content of natural Rattlesnake Tuff ash.e Average bulk water content of sintered cores of Rattlesnake Tuff ash (see text for details).
80

An alternative explanation is that the measured H20 contents represent a
combination of water that was chemically dissolved in the melt and water that was
mechanically trapped in pores at the interfaces of collapsed and annealed ash particles
(Fig. 3.4). For this to occur the trapped pores would have to be finer scale that the
average diameter of the crushed samples used for chemical analysis (i.e., < 100 tm)
making them nano-scale. Both water distributions would be liberated simultaneously
when the induction furnace used for the analyses brought the sample above its glass
transition temperature.
Regardless of which (if any) of the above explanations is correct, it is clear that
our samples retain water contents that are at and above the H20 solubility of silicate
melts at these P-T conditions. This supports our assertion that our pre-experiment dwell
times are sufficiently long to allow the sample to reach thermal and chemical equilibrium.
On this basis, we are able to use the deformation experiments to demonstrate the effect of
water saturation on the viscosity of bubble-rich melts.
81

3.10 References
Bagdassarov, N.Sh., Dingwell, D.B., 1992. A rheological investigation of vesicular
rhyolite. Journal of Volcanology and Geothermal Research 50, 307-322.
Bierwirth, P.N., 1982. Experimental welding of volcanic ash. B.Sc. Honours Thesis,
Monash University, ‘74.p.
Di Matteo, V., Mangiacapra, A., Dingwell, D.B., Orsi, G., 2006. Water solubility and
speciation from Campi Flegrei Caldera (Italy). Chemical Geology 229, 113-124.
Dingwell, 1995. Relaxation in silicate melts: some applications. In: Stebbins, J.F.,
McMillan, P.F., Dingwell, D.B. (eds) Reviews in Mineralogy 32. Mineralogical
Society of America, Washington, D.C. 2 1-66.
Ducamp, V.C., Raj, R., 1989. Shear and densification of glass powder compacts. Journal
of the American Ceramic Society 72, 798-804.
Friedman, I., Long, W., Smith, R.L., 1963. Viscosity and water content of rhyolite glass.
Journal of Geophysical Research 68, 6523-6535.
Giordano, D., Russell, J.K., Dingwell, D.B., In Press. Viscosity of magmatic liquids: A
model. Earth and Planetary Science Letters.
Grunder, A., Russell, J.K., 2005. Welding processes in volcanology: insights from field,
experimental, and modeling studies. Journal of Volcanology and Geothermal
Research 142, 1-9.
Guest, J.E., Rogers, P.S., 1967. The sintering of glass and its relationship to welding in
ignimbrites. Proceedings of the Geological Society. London 1641, 174-177.
Kennedy, B., Spieler, 0., Scheu, B., Kueppers, U., Taddeucci, J., Dingwell, D.B., 2005.
Conduit implosion during Vulcanian eruptions. Geology 33, 58 1-584.
82

Lejeune, A.M., Bottinga, Y., Trull, T.W., Richet, P., 1999. Rheology of bubble-bearing
magmas. Earth and Planetary Science Letters 166, 7 1-84.
Liu, Y., Zhang, Y., Behrens, H., 2005. Solubility of H20 in rhyolitic melts at low
pressures and a new empirical model for mixedH20-C02solubility in rhyolitic
melts. Journal of Volcanology and Geothermal Research 143, 2 19-235.
Manley, C.R., 1996. Physical volcanology of a voluminous rhyolite lava flow: the
Badlands lava, Owyhee plateau, SW Idaho. Journal of Volcanology and
Geothermal Research 71, 129-153.
Michol, K.A., Russell, J.K., Andrews, G.D.M., 2008. Welded block and ash flow
deposits from Mount Meager, British Columbia, Canada. Journal of Volcanology
and Geothermal Research 169, 121-144.
Newman, S., Lowenstern, J.B., 2002. VolatileCalc: a silicate melt-H20-C02solution
model written in Visual Basic for Excel. Computers and Geosciences 28, 597-
604.
Quane, S.L., 2004. Welding in pyroclastic deposits. PhD thesis, University of British
Columbia, 208 pp.
Quane, S.L., Russell, J.K., Kennedy, L.A., 2004. A low-load, high-temperature
deformation apparatus for volcanological studies. American Mineralogist 89, 873-
877.
Quane, S.L., Russell, J.K., 2005. Welding: insights from high-temperature analogue
experiments. Journal of Volcanology and Geothermal Research 142, 67-87.
Ragan, D.H., Sheridan, M.F., 1972. Compaction of the Bishop Tuff, California.
Geological Society of America Bulletin 83, 95-106.
83

Rahaman, M.N., de Jonghe, L.C., Scherer, G.W., Brook, R.J., 1987. Creep and
densification during sintering of glass powder compacts. Journal of the American
Ceramic Society 70, 166-774.
Riehie, J.R., Miller, T.F., Bailey, R.A., 1995. Cooling, degassing and compaction of
rhyolitic ash-flow tuffs: a computational model. Bulletin of Volcanology 57, 319-
336.
Robert, G., Russell, J.K., Giordano, D., Romano, C., 2008. High-temperature
deformation of volcanic materials in the presence of water. American
Mineralogist 93, 74-80.
Ross, C.S., Smith, R.L., 1961. Ash-flow tuffs; their origin, geologic relations, and
identification. U.S. Geological Survey Professional Paper 366, 81 pp.
Russell, J.K., Quane, S.L., 2005. Rheology of welding: inversion of field constraints.
Journal of Volcanology and Geothermal Research 142, 173-19 1.
Smith, R.L., 1960a. Ash-flows. Geological Society of America Bulletin 71, 795-842.
Smith, R.L., 1960b. Zones and zonal variations in welded ash-flows. U.S. Geological
Survey Professional Paper 354-F, 149-159.
Sparks, R.S.J., Tait, S.R., Yanev, Y., 1999. Dense welding caused by volatile resorption.
Journal of the Geological Society, London 156, 2 17-225.
Stein, D.J., Spera, F.J., 1992. Rheology and microstructure of magmatic emulsions;
theory and experiments. Journal of Volcanology and Geothermal Research 49,
157- 174.
84

Streck, M.J., Grunder, A.L., 1995. Crystallization and welding variations in a widespread
ignimbrite sheet; the Rattlesnake Tuff, eastern Oregon, USA. Bulletin of
Volcanology 57, 151-169.
Sura, V.M., Panda, P.C., 1990. Viscosity of porous glasses. Journal of the American
Ceramic Society 73, 2697-2701.
Tuffen, H., Dingwell, D.B., Pinkerton, H., 2003. Repeated fracture and healing of silicic
magma generate flow banding and earthquakes? Geology 31, 1089-1092.
Wolff, J.A, Sumner, J.M., 2000. Lava fountains and their products. In: Sigurdsson H.,
Houghton B.F., McNutt 5, Rymer H., Stix J. (eds) Encyclopedia of volcanoes.
Academic Press, San Diego, 321-329.
Zhang, Y., 1999. H20 in rhyolitic glasses and melts: measurement, speciation, solubility,
and diffusion. Reviews of Geophysics 37, 493-5 16.
85

CHAPTER IV: Discussion
In the experiments, increasing strain is manifest by a reduction in both connected
and isolated porosity. In this section I discuss the extent of water resorption and its
implications for porosity distributions and for deformation textures of the samples. I also
present a discussion of outstanding technical issues and the avenues of future work that
could answer questions that arose during this study. Finally, I present a brief discussion
of the effects of the temperature gradient and pore size distribution and shapes on
deformation.
4.1 Water
The partitioning of porosity between isolated and connected pores and the
mechanisms of pore destruction is the first order result of the experimental study. At the
densification rates used in this study, there is no evidence that welding of porous volcanic
materials produces significant amounts of isolated porosity (Fig. 3.5). Instead, connected
and isolated pores are destroyed in equal proportions; the result is that the ratios of
connected: total and isolated : total porosity remain constant throughout deformation
(Fig. 4.1). Moreover, there is no evidence for isolated porosity being created at the
expense of connected porosity.
Sparks et al. (1999) describe a welding regime in ignimbrites that would be
facilitated by water being trapped during compaction. Their idea is that, during
deformation, water pressure builds up locally to equal lithostatic loading and the increase
in pore fluid pressure forces water to be dissolved into the melt. Water resorption is
expected to reduce melt viscosity, further promoting flow and compaction (welding) of
86

1000
0
0.8
C-)”
-e-”0
0.4
0.2D
00 0.2 0:4 0.6 0.8pt
Figure 4.1 Proportions of connected (circles) and isolated porosity (squares) with deformation (decreasing total porosity).
87

the material. Sparks et al. (1999) also suggest that welding processes driven by fluid
resorption could help explain unusual welding textures such as densely welded, but
unfoliated volcanic rocks, clasts deformed into “U” or “S” shapes, or foliation parallel to
conduit wall, but with no preferred lineation orientation.
There is strong evidence in our experiments supporting the assertion that the
experimental run-products become saturated with water on the timescale of
experimentation (Fig. 3.B). However, none of the experimental run-products show the
increase in isolated porosity (Fig. 3.5) that is expected if a significant amount of water is
being trapped prior to resorption (Sparks et al., 1999). The experiments are nonetheless
examples of a gas resorption regime as described by Sparks et al. (1999) because the fluid
phase is not allowed to escape from the system (sealed cell, closed system). Water in the
system was kept in contact with the volcanic materials throughout deformation and
allowed to diffuse into the undersaturated glass, effectively reducing its viscosity by as
much as 3 orders of magnitude (Giordano et al., In Press). The magnitude of the
viscosity reduction is estimated by comparing the viscosity of the Rattlesnake Tuff melt
at 650 °C and having a post-sintering water content of 0.15 wt.% (Table 3.1) vs. the
viscosity of the melt at 650 °C and having a “model” water content of 0.95 wt.% (PH2O =
5 MPa; Newman and Lowenstern, 2002).
Textural analysis of run products offers no means of discriminating between
samples deformed under wet or dry conditions. At high degrees of total strain, the two
sets of experimental conditions (wet vs. dry): (i) produce strongly foliated samples, (ii)
show similar reduction in total porosity, and (iii) show no differences in ratios of isolated
and connected porosity. This is further evidence for extensive, uniform diffusion of
88

water into the glass phase as opposed to isolated regions of water resorption that would
produce more chaotic textures and strain localization (Sparks et al., 1999).
Measured water contents are 2-3 times higher than predicted by solubility models
(Newman and Lowenstern, 2002) and certainly require further investigation (Fig. 3.B).
Destructive chemical analysis methods were used to measure bulk water contents.
Specifically, InfraRed spectroscopy and Karl-Fischer titration of volatiles released at T
1000 °C were used to measure the bulk water content of each sample, and the two
techniques produced consistent results. These techniques provide a measurement of the
total water remaining in the samples after all moisture is removed at 110 °C; thus they
measure, and do not discriminate, between water dissolved in the glass or water that is
mechanically trapped in pores smaller than the grinding size required for analysis.
A possible explanation for the apparent excess water present in the samples,
relative to the water solubility models (Fig. 3.B; Newman and Lowenstem, 2002), is that
the excess water is trapped in nanopores or as interfacial films between annealed shards
with dimensions smaller than the crushing size fraction required for bulk water content
analysis (-100 gm). In formulating this hypothesis, it is assumed that the existing
solubility models for water accurately predict the solubility at the low temperatures and
pressures used in this study. Spot water analysis techniques such as Fourier Transform
InfraRed spectroscopy (FTIR) would provide a more accurate glass water content and
water distribution across experimental run products than the bulk water analysis methods
used in this study. Typical resolution of the FTIR technique is on the order of 30 by 30
tm, which is smaller than the size of the shards in the samples, allowing probing of
individual shards for water, and is an inexpensive, non-destructive method for water
89

analysis. The nanopore hypothesis could therefore be tested by using the FTIR water
analysis technique on doubly-polished wafers of individual shards or small intensely
welded pieces. Shard interfaces or “rims” in the case of individually polished shards
would be selectively avoided to measure water that is strictly dissolved in the glass, and
not trapped at interfaces between shards. The FTIR technique would also provide a
means of testing for chemical zoning in H20 content, or heterogeneity in water
throughout the samples.
4.2 Experimental design modifications
The design of the experimental apparatus can be improved very simply to provide
for greater water pressure stability. Switching from a one-zone resistance furnace to a
multiple, independently controlled-zone furnace would allow for more freedom in the
design and size of the water cell. The temperature gradients that may be affected by a
change in the configuration of the water cell could be minimized with the additional
control on the temperature provided by a multi-zone furnace. Thus, the design of the
water cell could be modified in the following ways: (i) the bottom of the cell could be
welded shut, and (ii) the top seal could be modified from its current metal-on-metal
configuration to a threaded and water-cooled 0-ring seal of the size of the inner diameter
of the cell. The cell diameter (outside and inside) might have to be increased slightly (-1
cm) to allow for easy sample extraction from the top of the tall (—30 cm) cell. This is the
change that is most likely to modify the temperature gradient in the assembly, and is the
reason why a two-zone furnace should be used if the water cell is to be modified from its
current configuration. A larger cell diameter would also be beneficial in that it would
90

increase the amount of total strain attainable during deformation of low to moderate
porosity samples for which bulging is a concern.
4.3 Temperature gradient
As noted earlier (cf. Chapter II; Fig. 2.2), there is a temperature gradient across
the sample assembly in the deformation experiments. That temperature gradient across a
5 cm long sample is asymmetric; the highest temperature is slightly below the middle of
the core length, and the temperature at the top of the sample is slightly lower than at the
bottom of the sample core. This asymmetry is caused by the positioning of the top of the
water cell outside of the furnace so as to not damage any of the valves and transducers
with heat. The magnitude of the temperature gradient is 8.5 °C over a sample length of 5
cm. This gradient corresponds to a 1% difference in logi between the lowest
temperature point and the highest temperature point in the sample (logi = 11.74 vs.
11.63). This is a small variation in viscosity compared to the experimental resolution of
viscosity of 0.2 log units (cf. Chapter II; Fig. 2.2). Moreover, strain localization due to
the temperature gradient was not observed at the sample scale in the experiments. This
suggests that the temperature gradient across the length of the sample is not sufficient to
localize deformation, despite the wide range of experimental conditions used (e.g., T,
PH2O). The potential impact of the temperature gradients on melt viscosity is also
mitigated by the fact that the effects of porosity on the operating deformation
mechanisms are of greater importance than temperature.
91

4.4 Pore size distribution and pore shape
Beyond the influence of the total amount of porosity present in the samples, and
its distribution as isolated vs. connected pores (cf. Fig. 3.5), pore size distribution and
pore shape are factors that may contribute to the strength of the samples during
deformation. The samples used in the experiments have extremely variable pore shapes
due to the large variations in the ash shard shapes (Figs. 3.2 and 3.4). Moreover, some of
the glass shards and all pumice shards are porous themselves, with variable pore shapes
too (e.g., tube pumice vs. bubble shard).
Most experiments on porous systems pertain to samples with either a coherent
melt fraction (e.g., Stein and Spera, 1992; Bagdassarov and Dingwell, 1992; Lejeune et
al., 1999) or a particulate melt fraction with solid (non-porous) shards (e.g., Rahaman et
al., 1987; Ducamp and Raj, 1989; Sura and Panda, 1990; Quane et al., 2004). The studies
of Friedman et al. (1963), Bierwirth (1982), and Quane (2004) are the only ones on
natural ash, i.e., deformation of samples having a particulate and porous melt fraction,
other than this study. The ability of particles to rotate during deformation may facilitate
porosity reduction. This ability is dependent on the amount of contact surface area in the
sample, itself dictated by the pore size and shape distributions, but primarily by the total
amount of porosity in the sample (Quane, 2004). The progressive compaction of the
samples during experimentation increases contact surface area between the shards and
inhibits rotation. This causes the observed strain-hardening in the viscous experiments
(Fig. 3.3). Changing the ash size fraction used to fabricate the samples would therefore
change the overall total porosity. For example, a smaller size fraction would pack more
and reduce the starting total porosity of the sample, increasing the contact surface area
92
between the shards at the onset of deformation. Strain-hardening in such a sample would
occur at lower amounts of total strain than for a sample of equal dimensions with a larger
ash size fraction.
The results presented in this study are self-consistent and map the relative
behaviour of the sintered ash materials, at the chosen size fraction, for the various
imposed temperature and water pressure conditions. Varying the size fraction in the
samples is not expected to affect this relative behaviour, but may change the temperature
at which rheological transitions are observed for the material. The mechanisms of
deformation observed in the experiments are thought to be representative of deformation
in high porosity volcanic materials, and to be primarily a function of the total porosity
followed by the pore shape and size fraction.
93

4.5 References
Bagdassarov, N.Sh., Dingwell, D.B., 1992. A rheological investigation of vesicular
rhyolite. Journal of Volcanology and Geothermal Research 50, 307-322.
Bierwirth, P.N., 1982. Experimental welding of volcanic ash. B.Sc. Honours Thesis,
Monash University, ‘74.p.
Ducamp, V.C., Raj, R., 1989. Shear and densification of glass powder compacts. Journal
of the American Ceramic Society 72, 798-804.
Friedman, I., Long, W., Smith, R.L., 1963. Viscosity and water content of rhyolite glass.
Journal of Geophysical Research 68, 6523-6535.
Giordano, D., Russell, J.K., Dingwell, D.B., In Press. Viscosity of magmatic liquids: A
model. Earth and Planetary Science Letters.
Lejeune, A.M., Bottinga, Y., Trull, T.W., Richet, P., 1999. Rheology of bubble-bearing
magmas. Earth and Planetary Science Letters 166, 71-84.
Newman, S., Lowenstern, J.B., 2002. VolatileCaic: a silicate melt-H20-C02solution
model written in Visual Basic for Excel. Computers and Geosciences 28, 597-
604.
Quane, S.L., 2004. Welding in pyroclastic deposits. PhD thesis, University of British
Columbia, 208 pp.
Quane, S.L., Russell, J.K., Kennedy, L.A., 2004. A low-load, high-temperature
deformation apparatus for volcanological studies. American Ivlineralogist 89, 873-
877.
94

Rahaman, M.N., de Jonghe, L.C., Scherer, G.W., Brook, R.J., 1987. Creep and
densification during sintering of glass powder compacts. Journal of the American
Ceramic Society 70, 166-774.
Sparks, R.S.J., Tait, S.R., Yanev, Y., 1999. Dense welding caused by volatile resorption.
Journal of the Geological Society, London 156, 217-225.
Stein, D.J., Spera, F.J., 1992. Rheology and microstructure of magmatic emulsions;
theory and experiments. Journal of Volcanology and Geothermal Research 49,
157- 174.
Sura, V.M., Panda, P.C., 1990. Viscosity of porous glasses. Journal of the American
Ceramic Society 73, 2697-2701.
95

CHAPTER V: Summary
I have successfully built and calibrated a sealable cell for high-temperature
deformation experiments. I have used the cell in support of experiments that investigate
the rheology of highly porous rhyolite under controlled water pressure. The main
experimental program was designed to explore the rheological effects of two important
variables in volcanic systems: porosity and water pressure. These effects are best studied
in experiments where other variables such as temperature and displacement rate are kept
constant. All experimental samples were created to have very similar starting porosity,
however, the total strain applied to each sample (at constant PH2O) was varied to obtain
snapshots of the final porosity along the same deformation path (Figs. 3.3-3.5). This
approach also provided a test for experimental reproducibility (Fig. 3.3a). Water pressure
was then varied within a given total strain experimental suite to elucidate the effect of
water pressure on rheological behaviour.
The data generated during the experiments include time, load, displacement, and
water pressure. Pre- and post-experimental characterization of the samples includes
measurements of radius, length, mass, volume, density, porosity, and bulk water content.
The experiments clearly show the strongly strain-dependent rheology of porous rhyolite,
and how the presence of water (and the magnitude of the water pressure) minimizes that
strain dependence. Thus, the main experimental program was ideal to explore the
dynamic rheology of porous rhyolite. A subset of the main experimental program was
designed to determine the glass transition temperature of the experimental materials at the
experimental timescales used in the study. The addition of pore space to the dry
Rattlesnake Tuff melt expanded the field of viscous deformation relative to the dry, non
96

porous melt, and the effect of porosity on the wet melt (assuming a minimum solubility
as predicted by existing solubility models) was even more dramatic.
Ultimately, the experimental data obtained in this study will be used to build a
model for the rheological behaviour of porous, wet materials during deformation, and to
extract their melt viscosity. The first step towards the comprehensive model requires
modeling the partitioning of strain during the experiments. If the relationship between
the volume and radial strain is accurately described, a relationship relating the melt
viscosity and the porosity of the sample during deformation to the recorded apparent
viscosity could be developed.
97

APPENDIX A: Cell design
98

C I.
CL
LA
ND
P/.
Z7?W
RO
0
SC
AL
E,
M7S
.A
PP
RO
VE
DS
yg
DR
AW
ND
V
SA
TC
OC
T2
00
7R
EV
IEE
411
A4
7E
RJA
/3/0
63
£X
CrJ
’rF
OR
,‘S
70N
RO
DA
A’O
P/S
70
4’
RO
DC
,40
sV/C
HA
fl.
‘
50C
/<’q
r/DW
CA
P$C
A’E
wJ
AT
3DIN
TE
RV
AL5
.
CA
P
-5
0,Q
EO
FC
NA
AI/
Oli
F.D
F/4
’/S
/,<
-T
AF
ER
ON
Eli
tO
FC
EIA
ND
ON
EN
DP
JEC
.5A
RE
Fo1/s
Ng
TE
AiO
VE
/,iF
EfF
crJ
oN
s.
-C
OA
TA
ll7
hE
,Wlj
34
’RF
AC
ES
W/T
41
1//
GJj
7EM
PA
WA
77JR
4N
/G//
.PR
ES
SU
RE
IcB
R/c
.4,/
rO
NA
SS
EM
BlY
/‘/s
TcW
RO
DP
/srO
N
DR
AW
ING
NU
MB
ER
/O
,/
APPENDIX B: Data acquisition
For all deformation experiments on natural volcanic material, time (s), load
applied to sample (pounds), and total shortening of the sample (inches) are measured by
the VDR and recorded on the VDR computer system. For wet experiments, water
pressure is also recorded. All experimental data files are compiled in an Excel
spreadsheet on a CD at the back of the thesis.
100

APPENDIX C: Experimental data
Plots of raw, unprocessed data for all deformation experiments on natural material
are provided in a PDF document on a CD at the back of the thesis. Each experiment is
presented as a two (dry) or three (wet) part figure as (i) load vs. time, (ii) load vs.
displacement, and (iii) water pressure vs. time. An example of the figures provided
electronically is given for sample RSO3 (Fig. C. 1).
101

500 500
400 ., 400
C . V V C . V
z,nn .
0 . VV V
00 5000 10000 15000 0 0.5 1 1.5
Time (s) Displacement (in)
20
15
5
C.5000 10000 15000
Time(s)
Figure C.1 Experiment RSO3.
102

APPENDIX D: Data processing
The following pages provide the MATLAB code used to process all the raw
experimental data files. Commented sections of the code (preceded by the percent
symbol %) provide explanations for the different data processing steps.
103

% This code uses modified VDR data files to:% convert all experimental data to SI units% correct data for accidental negatives% correct data for effect of PH2O% calculate stress from load (assumption: constant area)% calculate strain from displacement% calculate strain rate% smooth stress data% calculate viscosity as stress/strain rate
clear all
% data files are setup as such:% first row:% di(mm) li(mm) df(mm) lf(mm)% all following rows:% step t(s) load(lbs-force) displacement(inches)
% disp(’experimental data file & hit RETURN’)% raw=load(input(’experimental data file name? ‘,‘s’));load rs3.datraw=rs3;
[rows columns] = size(raw);
% sample size -- convert to SI units% initial diameter (m)dim = raw(1,1)/1000% initial length (m)lim = raw(1,2)/1000;% final diamter (m)dfm raw(1,3)/1000;% final length (m)lfm = raw(1,4)/1000;
% initial area of core (m2)Ai = pj*((dinJ2)A2);% initial volume of core (m3)Vi = Ai*lim;% final area of core (m2)Af = pj*((dfirJ2)A2);% final volume of core (m3)Vf=Af*lfm;
core_initial=[dim lim Ai Vi]core_final=[dfm lfm Af Vfj
104

% experimental datano_rdng=rows- 1;ts=raw(2:rows,2);dispin=raw(2:rows,4);
% correct load for accidental negatives & for Ph2o% correction for loadforce_lbs=raw(2:rows,3); % raw data NOT in SI units% correction for accidental negativesfor i=1:no_rdng
if force_lbs(i,1)<O;force_lbs(i, 1)=0;
endend
% correction for Ph2oforce_lbs_h2o=force_lbs-force_lbs(1,1);
% load & displacement in SIforce_N_h2o=force_lbs_h2o. *4.4482216;% dispm is the displacement in inches converted to metresdispm=dispin. *0.0254;
% load to stress (N to Pa)stress_Pa=force_N_h2o/Ai;% scale by the initial area of the core ==>
% assumption is there is no change in area
% displacement to strain (m to dimensionless)strain=dispmllim; %total strain
%%% Fit for displacement rate% AX=B% X=A\B === the solution to this is the slope with a 0 intercept% ts=A% slope=X == I will call XT1disprate_fit”% dispm=B
disprate_fit = ts\dispm % disprate_fit units are rn/sdispm_fit = ts.*disprate_fit; %this is the calculated displacement using the fit
strain_fit = dispm_fit/lim;strain_rate_fit = disprate_fit/lim;
105

plot(dispm,dispm_fit, ‘-r’)pauseplot(ts,dispm_fit, ‘-.b’)pauseplot(ts, strain_rate_fit, ‘-g’)pause
%%% Smooth stress (Pa) dataplot(ts, stress_Pa, ‘Ok’)hold on
windowSize=[ 1,2,3,5,7,15,20]
for i=1:7stress_Pa_filter=filter(ones( 1 ,windowSize(i))/windowSize(i), 1 ,stress_Pa);
plot(ts,stress_Pa_filter,color(i));disp(’size of filtering window’)windowSize(i)
xxx=input(’accept filtering window by typing desired window size (reject by hittingreturn)’,’s’)
if xxx == [1continue
elseif xxx > 0break
endendhold off
stress_Pa_final=stress_Pa_filter;
plot(strain, stress_Pa_final/1000000, ‘-k’);xlabel(’\epsilon_{ total }‘)ylabel(’\sigma (MPa)’)xlim([0 1]);disp(’Save figure?’);ANSWER=input(’hit RETURN for YES; any NTJMBER for NO ‘);if isempty(ANSWER) == 0;
‘do not save’else
saveas(gcf, input(’.fig file name? ‘,‘s’), ‘fig’)end
106

format bank
visc_nolog=stress_Pa_final./strain_rate_fit;visc_filter=log 1 O(stress_Pa_final./strain_rate_fit);plot(strain, vise_filter, ‘-k’);xlabel(’\epsilon_{ total }‘)ylabel(’log_{ 1O}\eta_{eff} (Pa s)’)pause
disp(Save figure?’);ANSWER=input(’hit RETURN for YES; any NUMBER for NO ‘);if isempty(ANSWER) == 0;
‘do not save’else
saveas(gcf, input(’.fig file name? ‘,‘s’), ‘fig’)end
% compare viscosities obtained from “raw” data% and smoothed datavisc_filter_max=log 1 0(max(stress_Pa_final)/strain_rate_fit);visc_max=log 1 0(max(stress_Pa)/strain_rate_fit);
viscosity=[visc_max; visc_filter_max]pause
107