Embed Size (px)
Citation preview

Genome 4D
Bio5488
Ting Wang
2.22/2017
Nature Reviews Molecular Cell Biology, Dec 2016
http://www.nature.com/nrm/journal/v17/n12/index.html

Regulation at a distance
Lettice et al., Hum Mol Gen 2003, 12 (14) pp. 1725-35
Preaxial polydactyly
Enhancer
ZRS

Regulation at a distance

Chromatin structure
Adapted with permission from cartoonist John Chase http://www.chasetoons.com

…the solution
Adapted from DNA Molecule: How DNA is Packaged (Advanced) — DNA Learning Center — Cold Spring
Harbor Laboratory

Genome organization in mammals
Contribution of Topological Domains and Loop Formation to 3D Chromatin Organization. Ea et al. Genes
(2015)

Global view of the nucleus
Adapted from Functional implications of genome topology. Cavalli G & Misteli T. Nature Structural and
Molecular Biology. (2013)

Technologies used (and developed) to
study genome folding
Adapted from http://web.uvic.ca/ail/equipment.html
Unraveling the 3D genome: genomics tools for multiscale exploration. Viviana I. Risca and William J.
Greenleaf. Trends in Genetics (2015)
Can be divided into two broad categories:
1. Imaging1. Bright-field2. Fluorescence3. EM4. Fluorescence in-situ
hybridization (FISH), etc.
2. Genome-wide1. DamID2. ChIA-PET3. Chromosome
conformation capture-derived, etc.

Overview of chromatin structure and
assays at three scales
Unraveling the 3D genome: genomics tools for multiscale exploration. Viviana I. Risca and William J.
Greenleaf. Trends in Genetics (2015)

Principles of nuclear organization
revealed using microscopic techniques
From single genes to entire genomes: the search for a function of nuclear organization. Pueschel et al.
Development (2016)

Fluorescence in situ hybridization
• Cytogenetic technique
• Uses fluorescent molecules to “paint” (regions of interest on) chromosomes in cells often in Metaphase or Interphase
• Aids in analysis of chromosome structure, structural aberrations, ploidy determination, etc.

ADVANTAGES
• Rapid and sensitive
• Lots of cells can be analyzed
• No cell culture needed
DISADVANTAGES
• Low-throughput
• Limited number of commercial
probes available
• Needs specialized camera and
image capture system

Chromosome painting
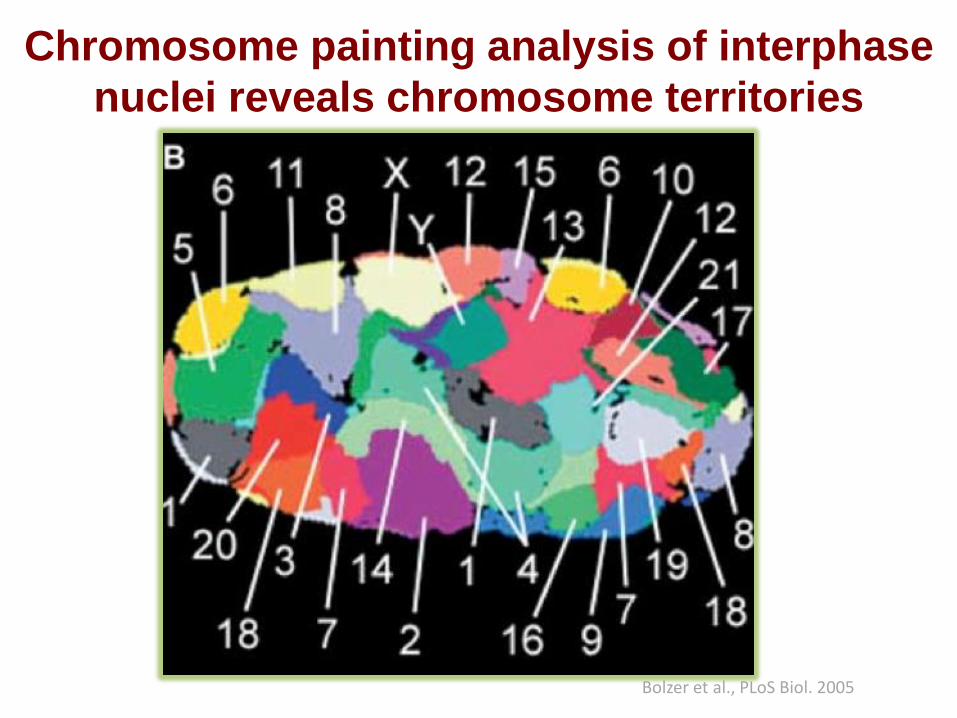
Chromosome painting analysis of interphase
nuclei reveals chromosome territories
Bolzer et al., PLoS Biol. 2005


Methodology of “C”-technologies
Contribution of Topological Domains and Loop Formation to 3D Chromatin Organization. Ea et al. Genes (2015)

Advantages and drawbacks of “C”-
technologies
Contribution of Topological Domains and Loop Formation to 3D Chromatin Organization. Ea et al. Genes (2015)
Genome organization influences partner selection for chromosomal rearrangements. Patrick J. Wijchers & Wouter de Laat.
Trends in Genetics (2011)

Hi-C for genome-wide analysis of higher
order chromatin structure
Hi-C vs. FISH
Mouse ES cells
(from 433 Million Reads) Dixon et al., Nature, 2012

in situ Hi-C
A 3D Map of the Human Genome at Kilobase Resolution Reveals Principles of Chromatin Looping. Rao SS
et al. Cell (2014)
In situ Hi-C maps DNA–DNA
contacts occurring in intact
nuclei, by proximity ligation.
While initial studies achieved
only megabase resolution, the
latest study with 15 billion
contact reads, reaches
kilobase resolution—which is
a function of both the size of
the restriction enzyme
recognition sequence and the
sequencing depth of the
library.
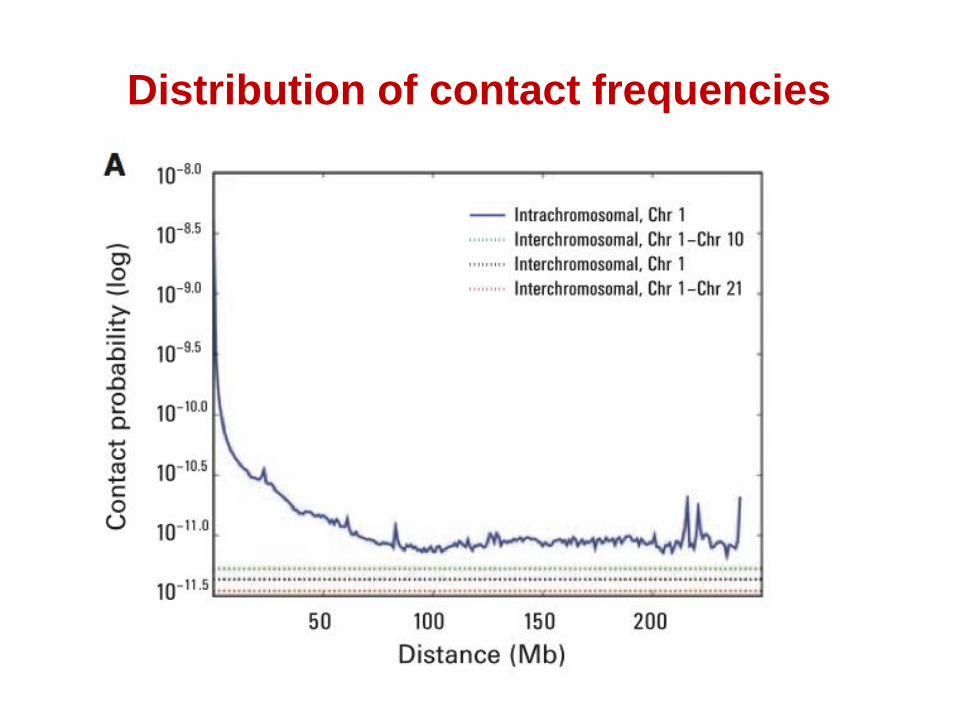
Distribution of contact frequencies

Distribution of contact frequencies –
clustering of smaller chromosomes

A and B Compartments
Lieberman-Aiden et al., 2009
Compartment A
Compartment B

Distribution of contact frequencies – cell
to cell variability
Nagano et al. Nature 2013, October

Hi-C data reveals strong local chromatin
interaction domains
Dixon et al. Nature 2012
DI(x) =(A – E)2 (B – E)2
+E E
(B – A)
abs(B – A)( )

The topological domains or TADs
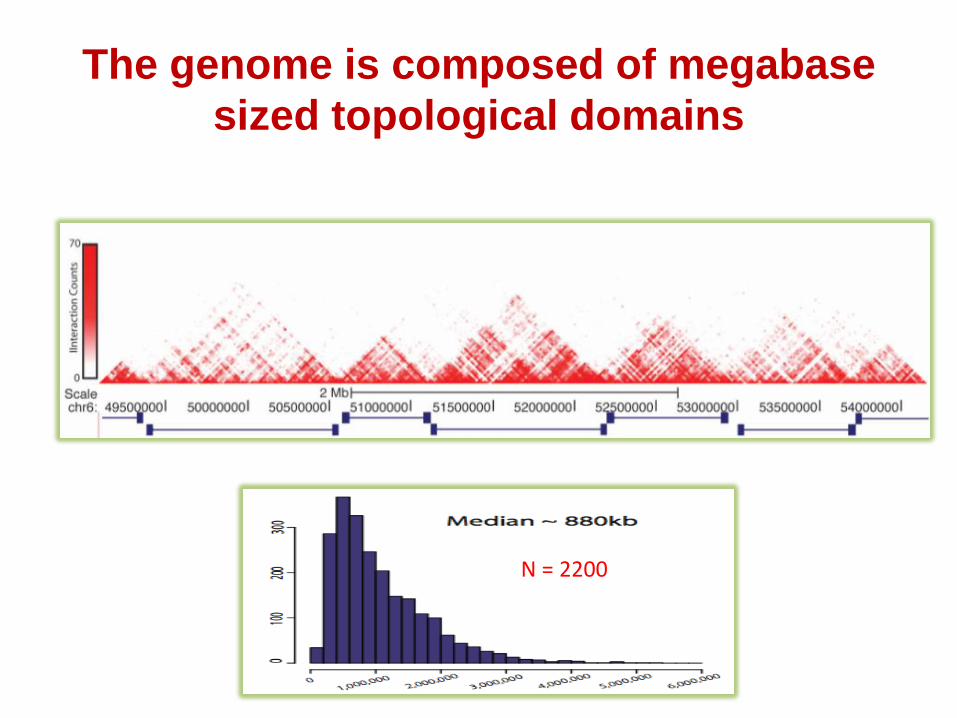
The genome is composed of megabase
sized topological domains
Topological Domains in Mouse ES cells
N = 2200

Dynamic chromatin organization during
cell cycle
Naumova et al., Science 2013

3-D model of a chromosome
• Structure model of the mouse Chr 2
is reconstructed using Bayesian
inference approach
• This chromosome appears to take a
helical configuration
• Topological domains in compartment
A and B are located on different side
of the chromosomal structure
– Red: compartment A domains
– Blue: compartment B domains
Hu et al., PLoS Comp
Bio. 2013

3-D model of a chromosome
• Heterochromatin and
euchromatin are located on
different faces of the
chromosomal structure (Red:
H3K9m3 enriched domains;
Blue: H3K9me3 depleted
domains)
Hu et al., PLoS Comp
Bio. 2013
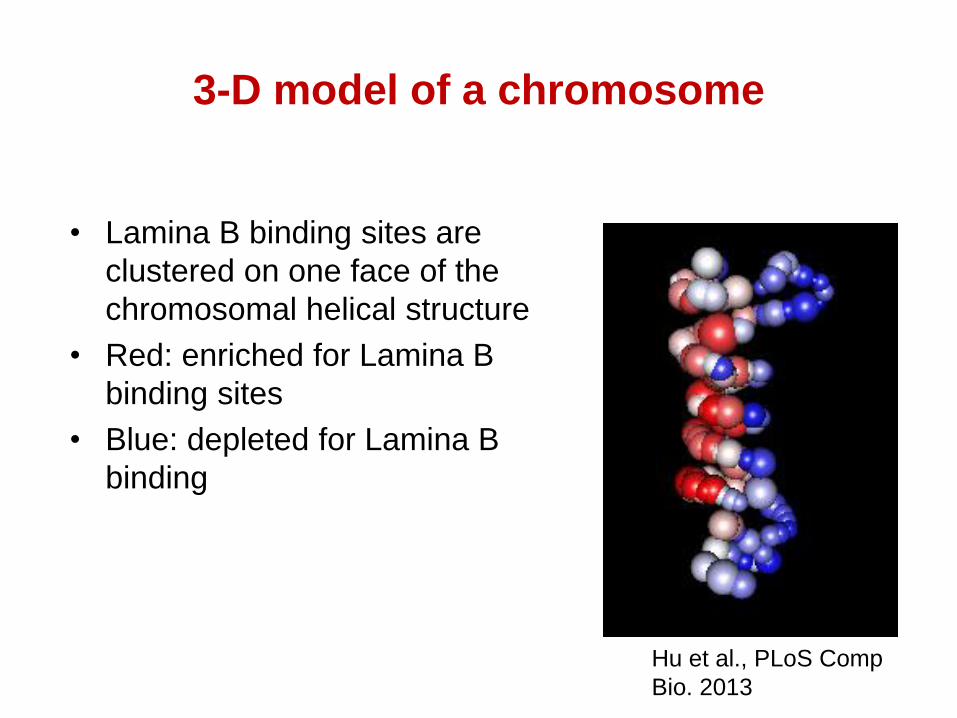
3-D model of a chromosome
• Lamina B binding sites are
clustered on one face of the
chromosomal helical structure
• Red: enriched for Lamina B
binding sites
• Blue: depleted for Lamina B
binding
Hu et al., PLoS Comp
Bio. 2013
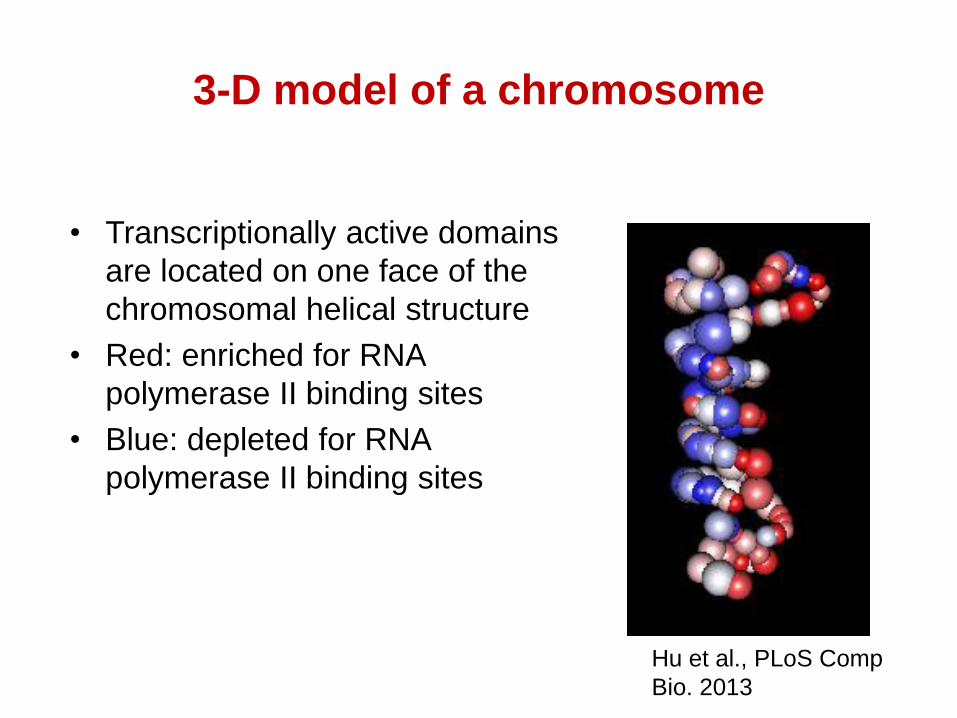
3-D model of a chromosome
• Transcriptionally active domains
are located on one face of the
chromosomal helical structure
• Red: enriched for RNA
polymerase II binding sites
• Blue: depleted for RNA
polymerase II binding sites
Hu et al., PLoS Comp
Bio. 2013

Properties of the topological domains
• Topological domains are stable between different cell
types.
• Topological domains are conserved between species
Dixon et al. Nature 2012

Overview of features revealed by Hi-C maps
A 3D Map of the Human Genome at Kilobase Resolution Reveals Principles of Chromatin Looping. Rao SS
et al. Cell (2014)
Top: the long-range contact pattern of
a locus (left) indicates its nuclear
neighborhood (right).
Middle: squares of enhanced contact
frequency along the diagonal (left)
indicate the presence of small
domains of condensed chromatin.
Bottom: peaks in the contact map
(left) indicate the presence of loops
(right). These loops tend to lie at
domain boundaries and bind CTCF in
a convergent orientation.

Overview of Hi-C analysis pipelines
Analysis methods for studying the 3D architecture of the genome. Ferhat Ay and William S. Noble.
Genome Biology (2015)
These pipelines start from raw reads and
produce raw and normalized contact
maps for further interpretation. Colored
boxes represent alternative ways to
accomplish a given step in the pipeline.
RE, restriction enzyme. At each step,
commonly used file formats (‘.fq’, ‘.bam’,
and ‘.txt’) are indicated.
A. The blue, pink and green boxes
correspond to pre-truncation, iterative
mapping and allowing split alignments,
respectively.
B. Several filters are applied to individual
reads
C. The blue and pink boxes correspond
to strand filters and distance filters,
respectively.
D. Three alternative methods for
normalization

Impact of normalization on Hi-C contact maps
(a, b): Hi-C contact maps of chr8
from the schizont stage of the
parasite Plasmodium falciparum at 10 kb resolution before and after
normalization. Blue dashed lines represent the centromere location.
(c, d): Density scatter plots of
counts before (x-axis) and after (y-
axis) normalization of Hi-C data from the human cell line IMR90 at
two different resolutions. Correlation values are computed
using all intra-chromosomal
contacts within human chr8. Only a subset of points are shown for
visualization purposes
Analysis methods for studying the 3D architecture of the genome. Ferhat Ay and William S. Noble.
Genome Biology (2015)

Visualization of Hi-C data
Analysis methods for studying the 3D architecture of the genome. Ferhat Ay and William S. Noble.
Genome Biology (2015)
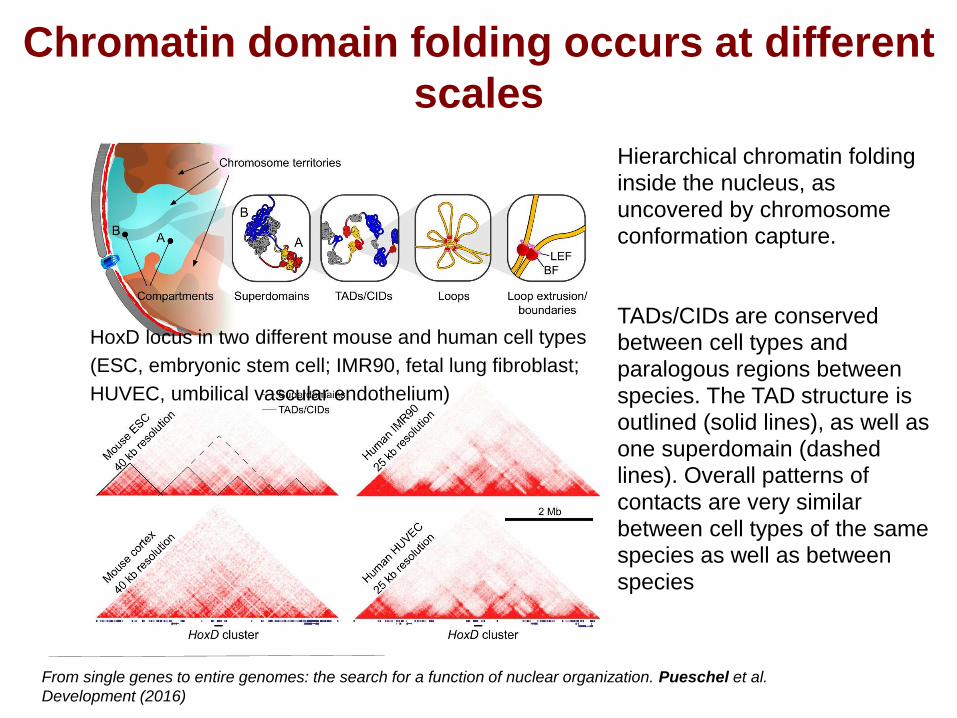
Chromatin domain folding occurs at different
scales
From single genes to entire genomes: the search for a function of nuclear organization. Pueschel et al.
Development (2016)
Hierarchical chromatin folding
inside the nucleus, as
uncovered by chromosome conformation capture.
TADs/CIDs are conserved between cell types and
paralogous regions between
species. The TAD structure is outlined (solid lines), as well as
one superdomain (dashed lines). Overall patterns of
contacts are very similar
between cell types of the same species as well as between
species
HoxD locus in two different mouse and human cell types
(ESC, embryonic stem cell; IMR90, fetal lung fibroblast;
HUVEC, umbilical vascular endothelium)

Four types of transcription regulatory
chromatin loops
Adapted from Functional implications of genome topology. Cavalli G & Misteli T. Nature Structural and
Molecular Biology. (2013)
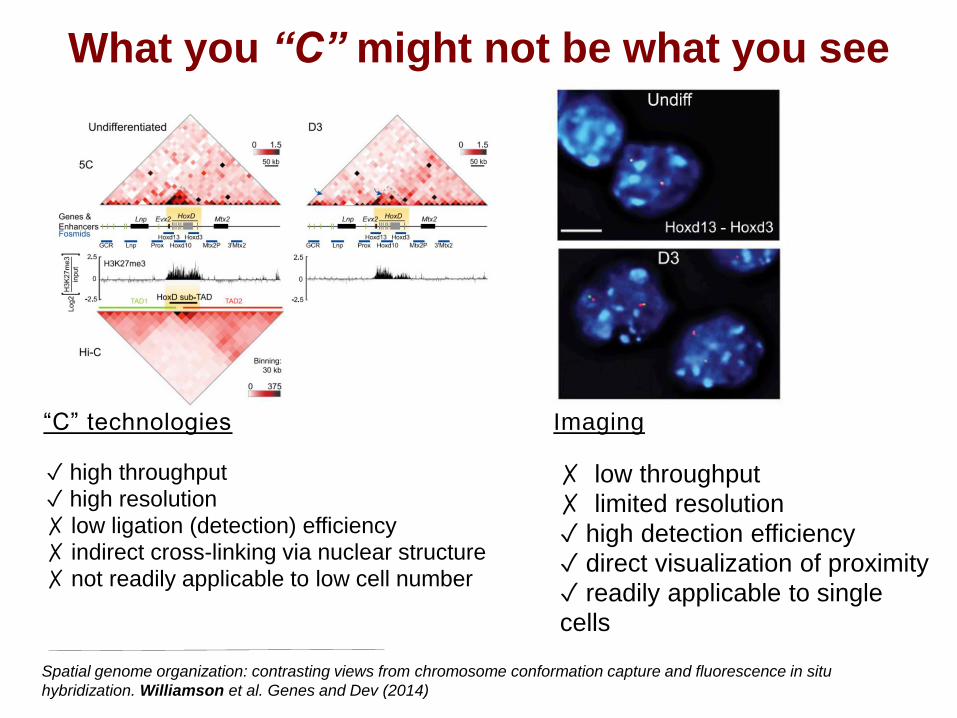
What you “C” might not be what you see
✓ high throughput
✓ high resolution
✗ low ligation (detection) efficiency✗ indirect cross-linking via nuclear structure
✗ not readily applicable to low cell number
✗ low throughput
✗ limited resolution
✓ high detection efficiency
✓ direct visualization of proximity
✓ readily applicable to single
cells
“C” technologies Imaging
Spatial genome organization: contrasting views from chromosome conformation capture and fluorescence in situ
hybridization. Williamson et al. Genes and Dev (2014)

Topologically Associated Domains (TADs): Contiguous stretches of chromosomal
regions that exhibit enhanced physical interactions within them
Chromatin Loops: Intra-TAD interactions that bring distal regulatory elements in
proximity of their target genes by means of chromatin looping that are held together in
part by CTCF
boundary factors
like cohesin
loop factors
like CTCF
schematic:
contact map:
TADs and chromatin loops are two essential
determinants of eukaryotic genome organization

Loops are often preserved across
cell types and from human to mouse
A 3D map of the human genome at kilobase resolution reveals principles of chromatin looping. Rao SS et al. (Cell 2014)
(A) Examples of peak and domain
preservation across cell types.
Annotated peaks are circled in
blue. All annotations are
completely independent.
(B) Of the 3,331 loops we
annotate in mouse CH12-LX,
1,649 (50%) are orthologous to
loops in human GM12878.
(C–E) Conservation of 3D
structure in synteny blocks. The
contact matrices in (C) are shown
at 25 kb resolution. (D) and (E) are
shown at 10 kb resolution

Role of CBS location and orientation in CTCF-
mediated genome-wide DNA looping
CRISPR Inversion of CTCF Sites Alters Genome Topology and
Enhancer/Promoter Function. Guo et al. Cell (2015)
• Most CTCF-mediated long-range
chromatin-looping interactions occur
between CBS pairs in forward-reverse orientation
• The percentage of CBS pairs in the
forward reverse orientation increases as chromatin-looping
strength is enhanced
• Schematic of two TADs in HoxD
locus with CBS orientations
• Cumulative patterns of CBS
orientations of TADs in humans
• Distribution of genome-wide orientation configurations of CBS
pairs (vast majority in RF) located in boundaries between neighboring
TADs in human K562 genome

CRISPR inversion confirms CTCF/Cohesin-
mediated directional looping mechanism
CRISPR Inversion of CTCF Sites Alters Genome Topology and Enhancer/Promoter Function. Guo et al. Cell
(2015)
• Prediction of looping
interactions and TADs based
on CTCF occupancy in
HEK293 cells in the Human
b-globin region
• Predicted interactions (left)
and the altered looping
directions (right) in three
subcloned CRISPR cell lines
with inversion of the CBS13-
15 confirmed by 4C with
CBS13-15 as an anchor.
Average log2 ratios of
interactions between
inversions and controls are
also indicated. **p < 0.01
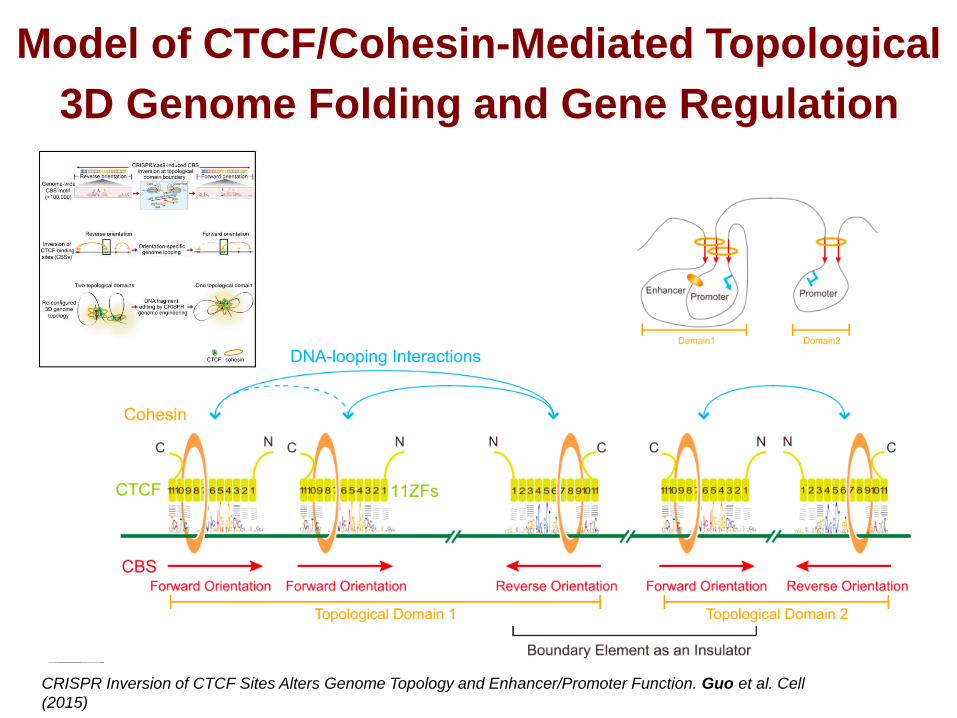
Model of CTCF/Cohesin-Mediated Topological
3D Genome Folding and Gene Regulation
CRISPR Inversion of CTCF Sites Alters Genome Topology and Enhancer/Promoter Function. Guo et al. Cell
(2015)

Breaking TADs: Role of chromatin topology in
developmental disorders
Adapted from A CRISPR Connection between Chromatin Topology and Genetic Disorders. Ren B & Dixon JR. Cell (2015)
Disruptions of Topological Chromatin Domains Cause Pathogenic Rewiring of Gene-Enhancer Interactions. Lupiáñez DG et
al. Cell (2015)
Disruption of chromatin
organization by structural
variation at a genetic locus
containing genes and
enhancers relevant to
mammalian limb formation
leads to pathological
rewiring of genetic
regulatory interactions
resulting in three related
human genetic disorders

Insulator loss allows PDGFRA to interact with
a constitutive enhancer in IDH gliomas
Insulator dysfunction and oncogene activation in IDH mutant gliomas. Flavahan WA et al. Nature (2016)
(A)HiC map for IMR90 cells. Contact domain structure
shown for a 1.7-Mb region containing PDGFRA.
Convergent CTCF sites anchor a loop that separates
PDGFRA and FIP1L1 (black circle). Interaction trace
(below) depicts HiC signals between the PDGFRA
promoter and all other positions in the region. Genes,
FIP1L1 enhancer (per H3K27ac) and insulator (per HiC
and CTCF binding) are indicated
(B)The right CTCF peak in the insulator contains a CpG
methylation sensitive CTCF-motif.
(C, D) ChIP-qPCR data shows that CTCF occupancy over
the boundary is reduced in IDH mutant (red) gliomas and
models, relative to wild type (black).
(E) Methylation levels of the CpG in the CTCF motif plotted
as percentage of alleles protected from conversion
measured in gliomaspheres by bisulfite sequencing.
(F) Methylation levels of the CpG in the CTCF motif plotted
as relative protection from methylation-sensitive restriction
measured in gliomaspheres

Boundary methylation and CTCF occupancy
affect PDGFRA expression and proliferation
Insulator dysfunction and oncogene activation in IDH mutant gliomas. Flavahan WA et al. Nature (2016)
(A) Schematic depicts chromatin loops and boundaries
in the PDGFRA locus. In IDH wild-type cells (left),
intact boundary insulates oncogene. Disruption of
the boundary by removing the CTCF motif should
activate the oncogene. In IDH mutant cells (right),
hypermethylation blocks CTCF, compromising the
boundary and allowing enhancer to activate the
oncogene. Demethylation should restore
CTCFmediated insulation. meCpG, methylated
CpG
(B)Plot compares CpG methylation in the CTCF motif in
IDH wild-type gliomaspheres (black), IDH1 mutant
gliomaspheres (red), and IDH1 mutant gliomaspheres
treated with 5μM 5-aza for 8 days (purple).
(C)Plot compares CTCF occupancy over the boundary.
DMSO, dimethylsulfoxide; WCE, whole-cell extract.
(D)Plot compares PDGFRA expression. Demethylation
restores PDGFRA insulation in IDH1 mutant
gliomaspheres.

Insulator dysfunction and oncogene activation in IDH mutant gliomas. Flavahan WA et al. Nature (2016)
Adapted from image by Lauren Solomon, Broad Communications
(E)CTCF binding shown for the FIP1L1/PDGFRA region. Expanded view
shows CTCF motif in the insulator targeted for CRISPR-based deletion. sgRNA and
PAM direct Cas9 nuclease to the motif
(G)Sequencing of target site reveals the
indicated deletions. CTCF motif disrupted on ~25% of alleles (compare to <0.01% in
control)
(I) qPCR reveals increased PDGFRA
expression in insulator CRISPR cells.
(J) PDGFRA and FIP1L1, which are normally confined to separate loop domains rarely
interact
(K)But can become closely associated in IDH-mutant tumors
Boundary methylation and CTCF occupancy
affect PDGFRA expression and proliferation
j k

Summary• Hi-C analysis reveals that the mammalian genome is spatially
compartmentalized, and consists of mega-base sized topological domains (also known as TADs).
• Topological domains have been independently observed in flies (Sexton et al. Cell 2012; Hou et al, Mol Cell 2012) and with different approaches (5C, Nora et al., Nature 2012)
• Topological domains are stable across cell types and largely preserved during evolution, suggesting that they are a basic property of the chromosome architecture.
• Partitioning of the genome into topological domains would naturally restrict the enhancers to selective promoters
• Long-range looping interactions between enhancers and promoters correlate with higher transcriptional responsiveness of promoters.
• Cell specific enhancer/promoter interactions are formed in each cell type, some time prior to activation of the genes, and are not significantly altered by transient signaling induction
• Pre-existing, lineage specific chromatin looping interactions between enhancers and promoters predict transcriptional responses to extracellular signaling, suggesting that chromatin conformation is another layer of transcriptional control