Embed Size (px)
Citation preview

Scotland's Rural College
Genome-wide association study of conformation and milk yield in mixed-breed dairygoatsMucha, S; Mrode, R; Coffey, MP; Kizilaslan, M; Desire, S; Conington, JE
Published in:Journal of Dairy Science
DOI:10.3168/jds.2017-12919
Print publication: 01/03/2018
Document VersionPublisher's PDF, also known as Version of record
Link to publication
Citation for pulished version (APA):Mucha, S., Mrode, R., Coffey, MP., Kizilaslan, M., Desire, S., & Conington, JE. (2018). Genome-wideassociation study of conformation and milk yield in mixed-breed dairy goats. Journal of Dairy Science, 101(3),2213 - 2225. https://doi.org/10.3168/jds.2017-12919
General rightsCopyright and moral rights for the publications made accessible in the public portal are retained by the authors and/or other copyright ownersand it is a condition of accessing publications that users recognise and abide by the legal requirements associated with these rights.
• Users may download and print one copy of any publication from the public portal for the purpose of private study or research. • You may not further distribute the material or use it for any profit-making activity or commercial gain • You may freely distribute the URL identifying the publication in the public portal ?
Take down policyIf you believe that this document breaches copyright please contact us providing details, and we will remove access to the work immediatelyand investigate your claim.
Download date: 09. Nov. 2021

1
J. Dairy Sci. 101:1–13https://doi.org/10.3168/jds.2017-12919© 2018, THE AUTHORS. Published by FASS Inc. and Elsevier Inc. on behalf of the American Dairy Science Association®. This is an open access article under the CC BY-NC-ND license (http://creativecommons.org/licenses/by-nc-nd/3.0/).
ABSTRACT
Identification of genetic markers that affect economi-cally important traits is of high value from a biologi-cal point of view, enabling the targeting of candidate genes and providing practical benefits for the industry such as wide-scale genomic selection. This study is one of the first to investigate the genetic background of economically important traits in dairy goats using the caprine 50K single nucleotide polymorphism (SNP) chip. The aim of the project was to perform a genome-wide association study for milk yield and conformation of udder, teat, and feet and legs. A total of 137,235 milk yield records on 4,563 goats each scored for 10 conformation traits were available. Out of these, 2,381 goats were genotyped with the Illumina Caprine 50K BeadChip (Illumina Inc., San Diego, CA). A range of pseudo-phenotypes were used including deregressed breeding values and pseudo-estimated breeding values. Genome-wide association studies were performed us-ing the multi-locus mixed model (MLMM) algorithm implemented in SNP & Variation Suite v7.7.8 (Golden Helix Inc., Bozeman, MT). A genome-wise significant [−log10(P-value) > 5.95] SNP for milk yield was identi-fied on chromosome 19, with additional chromosome-wise significant (−log10(P-value) > 4.46] SNP on chro-mosomes 4, 8, 14, and 29. Three genome-wise signifi-cant SNP for conformation of udder attachment, udder depth, and front legs were identified on chromosome 19, and chromosome-wise SNP were found on chromosomes 4, 5, 6, 10, 11, 12, 13, 14, 15, 16, 17, 18, 21, 23, and 27. The proportion of variance explained by the signifi-cant SNP was between 0.4 and 7.0% for milk yield and between 0.1 and 13.8% for conformation traits. This study is the first attempt to identify SNP associated
with milk yield and conformation in dairy goats. Two genome-wise significant SNP for milk yield and 3 SNP for conformation of udder attachment, udder depth, and front legs were found. Our results suggest that con-formation traits have a polygenic background because, for most of them, we did not identify any quantitative trait loci with major effect.Key words: genome-wide association study (GWAS), dairy goat, conformation, quantitative trait loci (QTL)
INTRODUCTION
Conventional goat breeding schemes are often ham-pered by the cost of measuring phenotypes and main-taining accurate pedigree and data recording. Many goat breeders do not perform routine data recording or do so on a very basic level. Identification of genetic markers and candidate genes that affect economi-cally important traits is therefore of high value from a biological point of view, as well as providing practical benefits to industry. Compared with that in cattle and sheep, the number of QTL studies in goats is limited; however, at present, goat QTL are not included in Animal QTLdb database (http:// www .animalgenome .org/ cgi -bin/ QTLdb/ index), which makes it difficult to judge the exact number of studies in this species (for review, see Amills, 2014).
Quantitative trait loci for traits such as birth and weaning weight (Mohammad Abadi et al., 2009; Visser et al., 2013), hair fiber characteristics (Cano et al., 2007; Visser et al., 2011), growth (Mohammad Abadi et al., 2009), body conformation (Marrube et al., 2007), parasite resistance (Bolormaa et al., 2010; De La Chev-rotière et al., 2012), milk traits (Roldán et al., 2008), and αS1-casein (Sacchi et al., 2005; Hayes et al., 2006; Dagnachew et al., 2011) have been identified in goats using microsatellite markers. With the availability of the Illumina Caprine 50K BeadChip (Illumina Inc., San Diego, CA; Tosser-Klopp et al., 2012, 2014), it is now possible to perform genome-wide scans in goats
Genome-wide association study of conformation and milk yield in mixed-breed dairy goatsSebastian Mucha,*† Raphael Mrode,† Mike Coffey,† Mehmet Kizilaslan,†‡ Suzanne Desire,†1 and Joanne Conington†*Poznan University of Life Sciences, 33 Wolynska, 60-637 Poznan, Poland†Animal and Veterinary Sciences, Scotland’s Rural College, Easter Bush, Midlothian EH25 9RG, United Kingdom‡International Center for Livestock Research and Training, Breeding and Genetics Department, 06852, Ankara, Turkey
Received March 23, 2017.Accepted November 8, 2017.1 Corresponding author: [email protected]

2 MUCHA ET AL.
Journal of Dairy Science Vol. 101 No. 3, 2018
with much greater resolution. To date, the chip has been utilized to find QTL associated with milk and type traits (Maroteau et al., 2013; Martin et al., 2017), polledness (Kijas et al., 2013), milking speed (Palhière et al., 2014), coat color (Becker et al., 2015; Martin et al., 2016a), wattles (Reber et al., 2015), and supernu-merary teats (Martin et al., 2016b). In addition, due to the application of sequencing and whole-genome optical mapping, information on gene annotation for goats has become available (Dong et al., 2013). The goat genome assembly has been refined and updated using dense radiation hybrid mapping (Du et al., 2014).
In cattle, feet and leg conformation has been ge-netically linked to claw disorders (van der Waaij et al., 2005), although there is evidence that animals with good udder conformation are less sensitive to high yields than those with poor udder conformation (Philipsson and Lindhé, 2003). In dairy goats, there is evidence of genetic correlations with production traits such as milk yield (McLaren et al., 2016) and productive life, as well as functional productive life (Castañeda-Bustos et al., 2017). Udder and teat conformation have also been linked with elevated SCC and clinical mastitis (Rupp and Boichard, 1999; Rupp et al., 2011; Huntley et al., 2012) as well as milking speed (Sewalem et al., 2011). Conformation traits are therefore important from both a health and welfare perspective and a production per-spective; however, these traits are costly to phenotype. Identifying SNP associated with QTL that significantly affect a trait would allow for marker-assisted selection, saving time and money on phenotyping adult ani-mals. The main objective of this study was to perform genome-wide association studies (GWAS) to identify SNP associated with conformation of udder, teat, legs and feet, as well as milk yield. This study is one of the first to investigate genetic background of economically important traits in dairy goats using the caprine 50K SNP chip.
MATERIALS AND METHODS
Data
A total of 5,026 first-lactation goats were scored for 10 conformation traits. Goats were a composite breed of Saanen, Toggenburg, and Alpine. A more detailed description of breed composition investigated with a principal component analysis is given in Mucha et al. (2015). Scoring was performed on 2 farms owned by the same farming business, over 2 yr (2013 and 2014) by the same scorer. All goats in their first lactation were scored once on both participating farms. Animals were ranked on a linear scale (1–9), similar to the scoring
system developed by the French dairy goat breeders’ association (CAPGENES) and used by Manfredi et al. (2001) and Rupp et al. (2011). A detailed description of the scoring system can be found in McLaren et al. (2016). The data contained information for udder traits (udder furrow, udder depth, udder attachment), teat traits (teat shape, teat angle, teat placement), and traits relating to legs and feet (front legs, back legs, front feet, back feet). A total of 137,235 milk yield records were available for 4,563 of the scored animals. The pedigree contained 34,391 individuals over 15 generations, with a total of 296 and 12,468 registered sires and dams, respectively.
Genotyping
Initially, 1,960 animals were selected for genotyping to build a reference population for implementation of genomic selection. All of the available sires (150 indi-viduals) were sampled, and this set was subsequently supplemented by females. Details on the structure of the genotyped population and selection method are given in Mucha et al. (2015). Subsequently, all female animals selected as replacements and all males used in the population were genotyped. In total, 2,381 goats with milk yield data and 402 of the conformation-scored goats were genotyped. Selection of animals for genotyp-ing was done purely based on milk production, because this was the main breeding objective on the partici-pating farms. That is why only 402 of the genotyped goats had conformation data. Animals were genotyped commercially with the Illumina Caprine 50K BeadChip (Illumina Inc.; Tosser-Klopp et al., 2012) at Edinburgh Genomics (Edinburgh, UK). Single nucleotide polymor-phisms were removed from further analyses if they were not in Hardy-Weinberg equilibrium, had minor allele frequency <0.05, were monomorphic, had a call rate of <0.95, or if the Illumina GenCall (GC score) was below 0.6. Missing genotypes (0.2% of all genotyped SNP) were imputed as homozygous for the major allele. Three animals were removed because they had call rate <0.90. This resulted in a data set with 2,378 goats with milk yield data and 402 conformation-scored goats genotyped for 44,798 SNP from 29 chromosomes (the X chromosome was excluded from the analysis).
Calculation of Deregressed Breeding Values
Basic statistics describing the data were estimated using R (R Development Core Team, 2011). Appropri-ate statistical models for conformation traits and milk yield were developed in previous studies on the same population (Mucha et al., 2014; McLaren et al., 2016).

Journal of Dairy Science Vol. 101 No. 3, 2018
GWAS OF CONFORMATION TRAITS IN GOATS 3
Conformation Traits. Breeding values for confor-mation traits were predicted using records from 5,026 animals using the software package MIX99 (Lidauer et al., 2011) with the following model:
y = Xb + Za + e, [model 1]
where y is the vector of observations for one of the conformation traits; b is the vector of fixed effects con-sisting of lactation stage (100-d periods from 1 to 700 DIM), farm (2 levels), birth year (2006 to 2013), and scoring year (2013 and 2014); a is the vector of random animal effects; e is the vector of random residuals; and X and Z are incidence matrices relating records to their respective effects.
Breeding values were predicted in a multi-trait analy-sis with the 10 conformation traits. Random effects were assumed normally distributed with zero means and the following covariance structure:
Var n
n
aaa
aee
e
A1
2
1
2
1
�
�
=
σ2212 1
22
2
2
12
12
0 0 0 0
0 0 0 0
0 0 0 0
A A
A A
A
I I
σ σ
σ σ
σ
σ σ
a a n
a a n
an
e e
…
…
… � � � � �
… II
I I
I
σ
σ σ
σ
e n
e e n
ensymm
1
22
2
2
…
… �
,
where A is the pedigree-based relationship matrix, I are identity matrices, σa
2 and σe2 are the genetic and re-
sidual variances, and indices 1 to n indicate the 10 conformation traits.
Milk Yield. Breeding values for milk yield were predicted with the following random regression model (Mucha et al., 2014):
y = Xb + Za + Wp + e, [model 2]
where y is the vector of test-day milk yield observa-tions; b the vector of fixed effects consisting of herd test-day, age at kidding, year-season, and fixed lacta-tion curves modeled by fitting Legendre polynomials (Kirkpatrick et al., 1990) of fourth order; a is a 1 × 3 vector of random regression coefficients (Legendre polynomials of second order) for the animal effect; p is the 1 × 3 vector of random regression coefficients (Legendre polynomials of second order) for the perma-nent environment effect; and e is the vector of random residual effect. The matrix X is the incidence matrix
for fixed effects, and Z and W are matrices of Legendre polynomials of DIM of second order for random animal and permanent environment effect, respectively.
Random effects were assumed normally distributed with zero means and the following covariance structure:
Var
symm e
ape
A GI P
I
=⊗
⊗
0 00
2σ
,
where G and P are 3 × 3 (co)variance matrices of the random regression coefficients for the animal and permanent environment effects, respectively.
The software package MIX99 was also used for de-regression, using a full animal pedigree with effective offspring contributions (EOC) as weighting factors for each of the conformation traits and milk yield. The EOC were calculated for each trait as
EOCrel kdau
relkdau
h
hijij i
i ji
i
i
=⋅
−=−
1
4 2
2, and ,
where relij is the reliability of EBV for trait i of animal j, and hi
2 is the heritability of trait i.Deregressed EBV were used as pseudo-phenotypes in
the subsequent GWAS analysis.
Calculation of Pseudo-EBV
As an alternative to deregressed EBV, a second alter-native phenotype for the conformation scores and milk yield was considered. The same models (model 1 and 2) were fitted for conformation scores and milk yield, but with an identity matrix I fitted instead of the pedigree-based relationship matrix A. This was done to remove any influence of pedigree relationships (contributions of parents and relatives) on an animal’s own breeding value. These models were fitted to test whether der-egressed EBV lead to false-positive results in GWAS.
Genome-Wide Association Analysis
The GWAS was performed using the multi-locus mixed model (MLMM) algorithm (Segura et al., 2012) implemented in SNP & Variation Suite v7.7.8 (Golden Helix Inc., Bozeman, MT). An additive genetic model was used, where the major homozygous genotype was coded as 0, heterozygous as 1, and minor homozygous as 2. The position of the markers was determined using the map CHIR_1.0 (Dong et al., 2013). The following
4 MUCHA ET AL.
Journal of Dairy Science Vol. 101 No. 3, 2018
model with random polygenic effect, and the genotypes at single SNP markers as fixed effects was used:
y = Xβ + Za + e, [model 3]
where y is the vector of phenotypes for the analyzed trait; β is a vector of coefficients for the SNP effects and fixed effects (as defined for model 1, only applica-ble for raw conformation scores – phenotype (2) defined below); a is the vector of random animal effects; e is the vector of random residual effects; and X and Z are incidence matrices relating observations to fixed and random animal effects, respectively. Random effects were assumed normally distributed with zero means and the following covariance structure:
Var a
e
ae
G
I
=
σ
σ
2
2
0
0,
where G is the genomic relationship matrix (VanRaden, 2008) calculated as
GSS
=′
−( )=∑2 1
1
p pi ii
N,
where S is a centered incidence matrix of SNP geno-types, N is the number of SNP markers, and pi is allele frequency of marker i.
Genome-wide association analyses were performed using the following phenotypes: (1) deregressed EBV for conformation scores and milk yield; (2) raw con-formation scores; (3) pseudo-EBV (psEBV) for con-formation scores (only animals that were scored) and milk yield (only animals with own milk records); and (4) filtered deregressed EBV for conformation scores, which was a subset of data used in phenotype 1, where only animals with their own conformation scores or reliability of their EBV >0.6 were included in GWAS. Deregressed EBV were chosen as a phenotype because they can maximize the use of information available on each animal (repeated records per animal), as well as progeny information in the case of sires. However, for conformation traits that have lower heritabilities and fewer phenotyped animals, the reliability of the der-egressed EBV was relatively low. Therefore, to avoid spurious results, additional phenotypes (2–4) were in-cluded in the analysis.
Quantile-quantile (Q-Q) plots were used to analyze the extent to which the observed distribution of the test statistic followed the expected (null) distribution.
This was done to assess potential systematic bias due to population structure or analytical approach. Bonferroni correction was applied to obtain significance thresholds. A SNP was significant at the genome-wise level when the −log10(P-value) was greater than −log10(0.05/N), where N is the total number of markers, which was equal to 44,798 and gave us a genome-wise threshold of 5.95. Chromosome-wise significant SNP had an as-sociated −log10(P-value) above −log10(0.05/n), where n is the number of markers on a given chromosome. The proportion of variance explained by SNP (pve) was calculated as
pvemrss mrssmrssh k
h
=−0
0
,
where mrssh0 is the Mahalanobis root sum of squares (mrss) for the null hypothesis and mrssk is the same for marker k.
RESULTS
Phenotype Statistics
Descriptive statistics for milk yield and the raw conformation scores of the animals used in this study are presented in Table 1. Mean test-day milk yield in the genotyped group of 2,165 goats was 3.89 with a standard deviation (SD) of 1.73. For a review of more detailed statistics on milk yield in the analyzed popula-tion, see Mucha et al. (2014). In total, 402 of the geno-typed animals had conformation data available. Front legs and back legs had the smallest SD of 0.38 and 0.57, respectively. This reflects the fact that majority of the animals had a score of 5 for the 2 traits. The remaining traits displayed larger variation but their distributions were often skewed toward higher scores. Deregressed EBV for conformation traits were estimat-ed for all 2,378 genotyped goats. However, due to low mean reliability of the EBV, which were between 0.15 and 0.25, these traits were considered not informative (Table 2). Higher reliability was obtained with a subset of that data for animals with conformation records or high reliability EBV (phenotype 4, as described above). In this case, the data set contained records of 417 to 477 animals (depending on the trait) with a mean reli-ability of between 0.24 and 0.52 (Supplemental Table S1; https:// doi .org/ 10 .3168/ jds .2017 -12919). The data set was reduced further in case of psEBV, which were estimated only for the 402 conformation-scored goats. The mean of psEBV for all of the analyzed confor-mation traits was close to 0, with the minimum and maximum values between −1.29 and 1.37, respectively

Journal of Dairy Science Vol. 101 No. 3, 2018
GWAS OF CONFORMATION TRAITS IN GOATS 5
(Supplemental Table S2; https:// doi .org/ 10 .3168/ jds .2017 -12919). Similar to the raw conformation scores, psEBV had the smallest SD for front legs and back legs (0.03 and 0.09).
Q-Q Plots
The Q-Q plots of expected and observed P-values [−log10(P-values)] obtained from GWAS did not reveal any major population stratification that might have affected the current analysis. The Q-Q plots for the models with deregressed EBV for conformation indi-cate that there might be false-positive results, as many SNP departed from the expected probability (Supple-mental Figure S1; https:// doi .org/ 10 .3168/ jds .2017 -12919). This issue did not seem to be present with models based on the remaining phenotypes for confor-mation (Supplemental Figures S2 and S3; https:// doi .org/ 10 .3168/ jds .2017 -12919). The highest departures from the expected probability (in all of the analyzed models) were observed for udder depth, which indicates that there were SNP with highly significant effect on this trait. The Q-Q plots for milk yield also indicated that there were highly significant SNP associated with this trait (Supplemental Figure S1). Values of the infla-tion factor lambda for the analyzed conformation traits
were highest when deregressed EBV were used as the phenotype, with values between 1.10 and 1.16. Lower lambda coefficients were observed with raw conforma-tion scores, psEBV, and filtered EBV, with lambda between 0.96 and 1.02. Lambda for milk yield was be-tween 0.95 and 0.96 for psEBV and deregressed EBV, respectively. Homogeneity of the analyzed population was also confirmed with a principal component analysis performed in a previous study (Mucha et al., 2015).
Genome-Wide Association Analysis
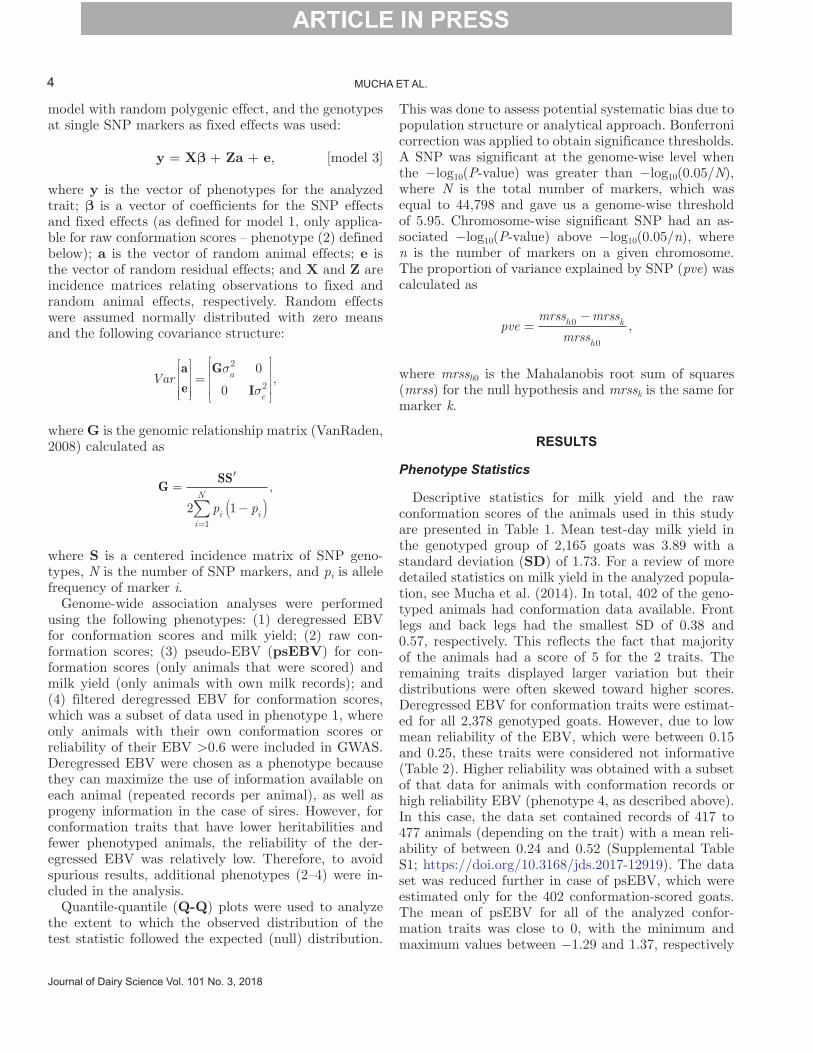
Profiles of the P-values [presented as −log10(P-values)] for milk yield for all SNP from chromosomes 1 to 29 are presented in Figure 1. Both analyses (with deregressed EBV and psEBV) identified a genome-wise significant SNP on chromosome 19 (Table 3). The SNP snp23995-scaffold244-354162 was located between exons 1 and 2 of the ALOX12 gene (GOAT_ENSP00000251535). A second genome-wise significant SNP for milk yield was identified only with the psEBV model. The SNP snp28093-scaffold300-4036770 was located on chromosome 8, 64,859 bp away from the SLC1A1 gene (GOAT_ENSBTAP00000025456). Ad-ditionally, 5 SNP were significant on the chromosome-wise level (Supplemental Table S3; https:// doi .org/
Table 1. Number of records (N) and descriptive statistics for raw conformation scores and milk yield (genotyped animals only)
Trait N Mean SD Minimum Maximum SEM
Milk yield 137,235 3.89 1.73 0.2 12.1 <0.01Udder furrow 397 5.95 1.17 2 8 0.06Udder depth 402 5.86 1.25 3 9 0.06Udder attachment 402 7.75 0.77 5 9 0.04Teat shape 401 4.27 1.14 1 7 0.06Teat angle 402 4.22 0.83 1 5 0.04Teat placement 402 3.33 0.85 1 6 0.04Front legs 402 4.84 0.38 3 5 0.02Back legs 402 4.69 0.57 2 7 0.03Front feet 402 8.00 0.89 5 9 0.04Back feet 402 7.44 0.87 5 9 0.04
Table 2. Number of animals (n), descriptive statistics, and reliabilities (Rel) of deregressed EBV for milk yield and conformation scores
Trait n Mean SD Minimum Maximum SEM Rel
Milk yield 2,378 331.55 188.27 −151.00 1,022.00 3.86 0.94Udder furrow 2,378 2.05 63.25 −40.55 3,076.80 1.30 0.19Udder depth 2,378 −0.02 2.26 −11.32 76.77 0.05 0.25Udder attachment 2,378 −0.23 9.14 −442.92 32.29 0.19 0.20Teat shape 2,378 −0.67 26.47 −1,285.90 90.85 0.54 0.20Teat angle 2,378 −4.11 149.2 −7,269.50 69.43 3.06 0.24Teat placement 2,378 3.38 123.37 −39.90 6,011.80 2.53 0.25Front legs 2,378 −0.67 20.89 −1,014.00 52.48 0.43 0.14Back legs 2,378 0.13 5.76 −23.10 279.17 0.12 0.15Front feet 2,378 2.15 93.10 −3.23 4,538.90 1.91 0.15Back feet 2,378 4.67 185.49 −67.27 9,041.90 3.80 0.15

6 MUCHA ET AL.
Journal of Dairy Science Vol. 101 No. 3, 2018
Figure 1. Manhattan plot of genome-wide association study (GWAS) for milk yield using the Illumina Caprine 50K BeadChip (Illumina Inc., San Diego, CA) in dairy goats. P-values [−log10(P-values)] for each SNP are shown on the y-axis, and each chromosome number is indicated on the x-axis. The solid (red) line indicates the threshold value for genome-wise significance. Deregressed EBV and pseudo-EBV (calculated by adjusting for fixed effects using BLUP, before GWAS, but with an identity matrix I fitted instead of the pedigree-based relationship matrix A) were used as phenotypes. Color version available online.
Table 3. Genome-wise significant SNP for milk yield and conformation scores
Trait1 SNP2 Model3−Log10
(P-value)Variance
explained (%)
Nearest gene
Name4 Distance5 (bp)
MY 8:38821852 3 4.66 0.8 GOAT_ENSBTAP00000025456 (SLC1A1)
64,8592 6.1 0.4
MY 19:26066457 3 38.45 6.0 GOAT_ENSP00000251535 (ALOX12)
Between exons 1 and 22 46.1 7.0
UA 19:26150581 1 3.8 3.5 GOAT_ENSP00000347140 (ASGR2)
Between exons 6 and 72 10.95 10.4
UD 19:26972244 1 13.02 12.5 GOAT_ENSBTAP00000034797 (ALOXE3)
Between exons 14 and 152 14.73 13.8
FL 19:27172738 1 0.45 0.2 GOAT_ENSP00000331086 (ODF4)
−5,712
2 7.31 7.1 GOAT_ENSBTAP00000042124 (ARHGEF15)
9,224
1MY = milk yield; UA = udder attachment; UD = udder depth; FL = front legs.2Number left of colon represents the chromosome number; number to right specifies the position on the chromosome.31 = raw scores; 2 = pseudo EBV; 3 = deregressed EBV.4Gene names with bovine homologs in parentheses.5Positive value denotes the gene located downstream of SNP; negative value denotes the gene located upstream of SNP.

Journal of Dairy Science Vol. 101 No. 3, 2018
GWAS OF CONFORMATION TRAITS IN GOATS 7
10 .3168/ jds .2017 -12919). The proportion of the total variance explained by the significant SNP was between 0.4 to 7.0% (Supplemental Table S3).
Three genome-wise significant SNP were found for the analyzed conformation traits (Figure 2 and Supplemen-tal Figure S4; https:// doi .org/ 10 .3168/ jds .2017 -12919). They were all located on chromosome 19, with the SNP snp23997-scaffold244-438286 being between exon 6 and 7 of ASGR2 gene (GOAT_ENSP00000347140). The SNP snp24012-scaffold244-1259949 was lo-cated between exon 14 and 15 of the ALOXE3 gene (GOAT_ENSBTAP00000034797). The snp24017-scaf-fold244-1460443 was 5,712 bp away from the nearest gene (Table 3). Additionally, 25 SNP were significant on a chromosome-wise level (Supplemental Table S3;
https:// doi .org/ 10 .3168/ jds .2017 -12919): 5 SNP for udder conformation, 9 for teat conformation (Supple-mental Figure S5; https:// doi .org/ 10 .3168/ jds .2017 -12919), and 11 for feet and legs conformation. The SNP significant for the conformation traits explained between 0.1 and 13.8% of the total variance. It is worth noting that the lowest percentage of variance was at-tributed to the SNP significant for feet and legs con-formation, particularly those that were significant for the psEBV model but had very low −log10(P-values) for the raw scores (i.e., snp12882-scaffold1498-142431). The highest percentage of variance explained was at-tributed to snp24012-scaffold244-1259949, which was genome-wise significant for udder depth with all of the analyzed models except of the deregressed EBV.
Figure 2. Manhattan plot of genome-wide association study (GWAS) for udder conformation traits (udder furrow, udder depth, udder at-tachment) using the Illumina Caprine 50K BeadChip (Illumina Inc., San Diego, CA) in dairy goats. P-values [−log10(P-values)] for each SNP are shown on the y-axis, and each chromosome number is indicated on the x-axis. The solid (red) line indicates the threshold value for genome-wise significance. The legend indicates the phenotypes represented in the graph. Filtered deregressed EBV (EBV for animals that had their own conformation scores, or the reliability of their EBV was >0.6), raw scores, and pseudo-EBV (calculated by adjusting for fixed effects using BLUP, before GWAS, but with an identity matrix I fitted instead of the pedigree-based relationship matrix A) were used as phenotypes. Color version available online.

8 MUCHA ET AL.
Journal of Dairy Science Vol. 101 No. 3, 2018
DISCUSSION
Milk Yield
The aim of the present study was to identify SNP significantly associated with milk yield and conforma-tion traits in a commercial dairy goat herd. In total, 2 SNP associated with milk yield were found at the genome level, and a further 5 were significant at the chromosome level. Review of the available literature provides evidence for associations in dairy goats be-tween milk yield and polymorphisms within POU1F1 [Capra hircus autosome (CHI)7], a gene that is a posi-tive regulator for growth hormone and prolactin (Lan et al., 2007); β-lactoglobulin gene (CHI11; Dettori et al., 2015; El Hanafy et al., 2015); LALBA (CHI5; Dettori et al., 2015); MTHFR (CHI6), a gene with known links to milk protein synthesis (An et al., 2015); STAT5A (CHI19; An et al., 2013); and PRLR (CHI20; Hou et al., 2013). However, these were not confirmed in the current study. Very few studies have used GWAS methodology to identify QTL in relation to milk yield in goats. Wasike et al. (2016) performed GWAS on a small sample (n = 48) of goats; however, the top 100 SNP found to be associated with milk yield accounted for only 3.1% of the genetic variance. Studies also sug-gest that the growth hormone gene, located on CHI19, could be associated with milk production in goats (Malveiro et al., 2001; Marques et al., 2003; Dettori et al., 2013). Current analysis identified a major QTL on CHI19 (at 26,066,457 bp) that was associated with milk yield; however, the significant SNP was not within the growth hormone gene (located on CHI19 between 47,266,042 and 47,267,410 bp) that has been reported to influence milk yield and composition. Martin et al. (2017) identified significant SNP for milk production traits on chromosome 19. The QTL for protein yield located at 28.5 Mb had a confidence interval (24.8–29.0 Mb) that overlaps with the SNP found in the current study at 26.1 Mb. The remaining QTL found by Martin et al. (2017) did not overlap with result of the current study.
None of the SNP significantly associated with milk yield in the present study were located within any of the gene regions previously associated with milk yield in dairy goats. As annotation of the goat genome is still in an early stage, it might be useful to utilize the ho-mology between the bovine and caprine genomes, which has been well established in earlier studies (Ponce de Leon et al., 1996; Vaiman et al., 1996; Piumi et al., 1998; Dong et al., 2013).
The genome-wise significant SNP on chromosome 19 identified in the present study, which accounted for
between 6 and 7% of variance, is located approximately 15 kb downstream of the arachidonate 12-lipoxygen-ase (ALOX12) gene. The homologous bovine gene, positioned on chromosome 19, has been associated with several biological processes such as unsaturated fatty acid metabolic and biosynthetic processes, and has shown differential expression in dairy cows with extremely high and low milk yields (Bai et al., 2016; Yang et al., 2016). The genome-wise significant SNP located on chromosome 8 was located within a solute carrier family 1 (SLC1A1) gene, a trans-membrane transport channel. No studies in any livestock spe-cies have previously linked this gene to milk yield. Finally, the chromosome-wise significant SNP located on chromosome 14 is located within an uncharacterized transcript variant (LOC102186225), which is located between the genes FAM49B (approximately 1.5 Mb downstream) and MYC (approximately 100 kb up-stream). The region encompassing these genes has been previously associated with major effect on milk yield, in a QTL study by Coppieters et al. (1998). Diacylg-lycerol acyltransferase 1 (DGAT1) has been shown to be strongly linked to milk yield in dairy cattle (Grisart et al., 2002; Winter et al., 2002) and milk fat in dairy goats (An et al., 2013). In goats, DGAT1 is located on chromosome 14 (between 11,256,487 and 11,265,239 bp); however, the significant SNP located on chromo-some 14 (at 23,135,282 bp) in the present study was not within the DGAT1 gene. A recent study on French dairy goats conducted by Martin et al. (2017) identified SNP that were pointing toward DGAT1 as the gene affecting fat content.
Conformation Traits
Conformation traits are of interest because of their associations with health and production. They are also very important for adaptation to machine milking. To our knowledge, there has been only one report on SNP associated with udder type traits (Maroteau et al., 2013). In case of feet and legs conformation, no significant SNP have been reported in goats. In the current study, genome-wise significant SNP were only found for udder attachment, udder depth, and front legs. It is worth noting that they were all in the same genomic region of chromosome 19. A SNP significantly associated with udder attachment was located between exons 6 and 7 of ASGR2 gene. The homologous bovine gene is also located on chromosome 19 and is involved in regulation of protein stability and lipid homeostasis. Udder tissue is mainly composed of fat deposition and connective tissue (i.e., fibroblasts, adipocytes). Because both play an important role in udder formation, we

Journal of Dairy Science Vol. 101 No. 3, 2018
GWAS OF CONFORMATION TRAITS IN GOATS 9
could hypothesize that processes affecting protein sta-bility and especially lipid homeostasis may affect udder attachment. Moreover, a study conducted with micro-satellite markers in cattle found a 1.6-Mb region cover-ing the ASGR2 gene that was significantly associated with udder attachment (Schrooten et al., 2000). An-other genome-wise significant SNP was found for udder depth and was located between exons 14 and 15 of the ALOXE3 gene, another member of the arachidonate lipoxygenase family. As well as the above-mentioned biological processes for ALOX12, both enzymes are involved in establishment of skin barrier; and ALOXE3 is involved in the processes of differentiation to fat cells, sphingolipid metabolism, and ceramide biosynthesis. Therefore, its possible involvement in udder conforma-tion can be supported by its activity in fat metabolism, cell differentiation, and proliferation. The last genome-wise significant SNP was found for front legs with only the psEBV model. This SNP was located in a gene-rich area of chromosome 19. The nearest genes were ARHGEF15 (rho guanine nucleotide exchange factor 15) and ODF4 (outer dense fiber 4). The ARHGEF15 gene encodes a protein annotated to be regulating stress fiber assembly, whereas ODF4 encodes a protein localized in the outer dense fibers of tails of mature sperm cells. To date, this region has not been associ-ated with any functions that could be directly linked to feet and legs conformation. Maroteau et al. (2013) also found SNP associated with udder type traits on chromosome 19. Unfortunately, due to the lack of SNP positions, it was impossible to compare genomic regions found in that study with the current results. In case of the remaining traits (udder furrow, teat shape, teat angle, teat placement, back legs, front feet, back feet), multiple chromosome-wise significant SNP were found. This seems to point toward a polygenic determinism of these traits.
Several studies in cattle and sheep have identified QTL for conformation traits (Schrooten et al., 2000; Ashwell et al., 2005; Cole et al., 2011; Gutiérrez-Gil et al., 2011; Wu et al., 2013). Initially, the studies were based on microsatellite markers and identified QTL for foot angle (BTA5, BTA6, BTA17, BTA21, BTA23), teat placement (BTA5, BTA6, BTA10, BTA19, BTA20, BTA21), udder depth (BTA5, BTA6, BTA13, BTA19, BTA27), teat length (BTA7, BTA13, BTA23), and rear leg set (BTA6, BTA13, BTA21, BTA24) (Gutiérrez-Gill et al., 2011; Lan et al., 2013; Wu et al., 2013). More recent studies involved SNP chips that cover the genome at much higher density. Significant SNP for feet and legs, foot angle, and rear leg side view in cattle have been reported on BTA2, BTA11, BTA13, BTA20, BTA26 (Cole et al., 2011; Wu et al., 2013).
Teat placement was significantly associated with SNP located on BTA6, BTA7, BTA11, and BTA19 (Wu et al., 2013), whereas significant SNP for teat length were reported on BTA11, BTA21, and BTA26 (Cole et al., 2011). Moreover, SNP associated with udder conforma-tion were found on BTA2, BTA3, BTA5, BTA6, BTA7, BTA11, BTA12, BTA13, BTA14, BTA16, BTA17, BTA20, BTA22, BTA23, BTA25, and BTA26 (Cole et al., 2011; Sodeland et al., 2011; Flury et al., 2014). The current analysis provided no evidence as to the involvement of the above-mentioned genes in formation of conformation traits in the current goat population.
Further Discussion
Our aim was to perform an association analysis for conformation traits and milk yield using the caprine 50K SNP chip. Given the small sample size, the power to detect associations was low, which might have led to a situation where the detected effects were overestimated (Ball, 2013). This problem might be important in case of the conformation traits where the analyzed group included only 402 animals. It should be less apparent in the case of milk yield where the sample contained over 2,000 animals. Because of that, associations with SNP significant for conformation should be treated as an indication and certainly require further research to be validated. It should be also mentioned that annotation of the goat genome is still in a very early stage and, al-though bovine homologs can help identify gene regions to some extent, many regions remain unknown. With new and updated annotation, based on resequencing of the goat genome using single-molecule sequencing (Koren et al., 2016) from Pacific Biosciences (Menlo Park, CA) and BioNano Genomics (San Diego, CA), our ability to find candidate genes should improve.
Some concern might be raised as to the effect of breed composition on the results of the current GWAS analysis. This issue was addressed in our previous analyses on the implementation of genomic selection in the investigated population. Based on the principal component analysis as well as extent of linkage disequi-librium, we concluded that the investigated population is mostly homogeneous (Mucha et al., 2015); therefore, we have treated it as a new synthetic breed. Population structure should not have a strong negative effect on the power to detect QTL in the current study. On the other hand, the significant SNP identified in this study might not be segregating in other populations. This is mainly because linkage disequilibrium patterns are generally not consistent across breeds (de Roos et al., 2008), and may differ between divergently selected lines of the same breed (Banos and Coffey, 2010).

10 MUCHA ET AL.
Journal of Dairy Science Vol. 101 No. 3, 2018
Deregressed EBV were used as pseudo-phenotypes to maximize the use of available information on animals. This method appears to be very effective provided that the reliability of the EBV is high (Garrick et al., 2009). Additionally, deregression was done with full pedigree, which removes parent average effect and makes der-egressed EBV more suitable for GWAS (Ekine et al., 2014). In the case of milk yield, reliability of EBV was between 0.98 and 0.99 (1st and 3rd quantile), which should provide sufficiently accurate pseudo-phenotypes for GWAS. Conformation traits had a much lower reli-ability (1st and 3rd quantile between 0.07 and 0.32), which might lead to many false-positive results. Be-cause of the nature of conformation traits, there was only a single measurement for each phenotyped animal. This, in combination with low heritabilities for these traits (0.02 to 0.38; McLaren et al., 2016), resulted in the low reliabilities observed. In contrast, moderate heritabilities (up to 0.45 in lactation 1; Mucha et al., 2014) and the repeated-records nature of milk yields resulted in high reliabilities.
Because deregressed EBV for conformation were not deemed accurate enough for GWAS, the use of raw conformation scores and psEBV were considered as alternative phenotypes. Of the 28 SNP found to be as-sociated with the conformation traits, 2 were confirmed with all of the analyzed phenotypes (filtered deregressed EBV, psEBV, and raw scores). It is worth noting that the most significant SNP for conformation traits (udder depth) identified on chromosome 19 was confirmed with all 3 phenotypes. In case of raw scores and psEBV, only 4 of the 28 SNP were found to be in agreement. Addi-tionally, several other SNP were found to be significant using deregressed EBV but these results were not con-firmed with any of the other phenotypes. This might indicate that results obtained with deregressed EBV are likely to be false positives. Overall, results for udder and teat confirmation traits were very similar across both phenotypes tested; however, there was a wider discrepancy between the psEBV and raw scores for feet and leg conformation traits. These traits may be better suited to genomic selection, to take full advantage of the small but significant genetic variance. In contrast, the largest single effect was found for udder depth, with a single SNP accounting for between 12.5 and 13.8% of variance. This trait also had the highest heritabil-ity (0.38). Pseudo-EBV were calculated using BLUP, which adjusted for fixed effects, without including any pedigree information. The weakness of adjusting for fixed effects before GWAS is that any error associated with fixed effects cannot be taken into account by the final model (Garrick and Fernando, 2013); therefore, where deregressed EBV show insufficient reliabilities, it
is preferable to simultaneously adjust for fixed effects within the GWAS analysis.
CONCLUSIONS
This study aimed to identify SNP associated with milk yield and conformation in dairy goats. The GWAS analyses resulted in 2 genome-wise significant SNP for milk yield located on chromosome 19, and 6 chromo-some-wise significant SNP on chromosomes 4, 8, 14, 28, and 29. Moreover, 3 genome-wise significant SNP for conformation of udder attachment, udder depth, and front legs were identified on chromosome 19. These were accompanied by chromosome-wise significant SNP on chromosomes 4, 5, 6, 10, 11, 12, 13, 14, 15, 16, 17, 18, 19, 21, 23, 27, and 28. Our results suggest that both milk yield and conformation traits have a polygenic background because, for most of them, we did not identify any QTL with major effects. We were unable to identify any candidate genes for milk yield or conformation.
ACKNOWLEDGMENTS
This work was supported by the Biotechnology and Biological Sciences Research Council (grant number BB/M02833X/1). The authors gratefully acknowledge cooperation with Angus Wielkopolski, Mark De Hamel, and David Alvis from Yorkshire Dairy Goats (Seaton Ross, York, UK).
REFERENCES
Amills, M. 2014. The application of genomic technologies to inves-tigate the inheritance of economically important traits in goats. Adv. Biol. https:// doi .org/ 10 .1155/ 2014/ 904281.
An, X., Y. Song, J. Hou, P. Han, J. Peng, L. Zhang, J. Wang, and B. Cao. 2015. Mutations in the MTHFR gene and their associations with milk production traits in dairy goats. Small Rumin. Res. 130:76–80. https:// doi .org/ 10 .1016/ j .smallrumres .2015 .06 .008.
An, X. P., J. X. Hou, H. B. Zhao, L. Bai, J. Y. Peng, C. M. Zhu, Q. M. Yan, Y. X. Song, J. G. Wang, and B. Y. Cao. 2013. Polymorphism identification in goat DGAT1 and STAT5A genes and association with milk production traits. Czech J. Anim. Sci. 58:321–327.
Ashwell, M. S., D. W. Heyen, J. I. Weller, M. Ron, T. S. Sonstegard, C. P. Van Tassell, and H. A. Lewin. 2005. Detection of quantita-tive trait loci influencing conformation traits and calving ease in Holstein-Friesian cattle. J. Dairy Sci. 88:4111–4119. https:// doi .org/ 10 .3168/ jds .S0022 -0302(05)73095 -2.
Bai, X., Z. Zheng, B. Liu, X. Ji, Y. Bai, and W. Zhang. 2016. Whole blood transcriptional profiling comparison between different milk yield of Chinese Holstein cows using RNA-seq data. BMC Genom-ics 17:512 https:// doi .org/ 10 .1186/ s12864 -016 -2901 -1.
Ball, R. D. 2013. Designing a GWAS: Power, sample size, and data structure. Pages XX–XX in Genome-Wide Association Studies and Genomic Prediction. C. Gondro, J. van der Werf, and B. Hayes, ed. Humana Press, New York, NY.
Banos, G., and M. P. Coffey. 2010. Characterization of the genome-wide linkage disequilibrium in 2 divergent selection lines of dairy

Journal of Dairy Science Vol. 101 No. 3, 2018
GWAS OF CONFORMATION TRAITS IN GOATS 11
cows. J. Dairy Sci. 93:2775–2778. https:// doi .org/ 10 .3168/ jds .2009 -2613.
Becker, D., M. Otto, P. Ammann, I. Keller, C. Drogemuller, and T. Leeb. 2015. The brown coat colour of Coppernecked goats is as-sociated with a non-synonymous variant at the TYRP1 locus on chromosome 8. Anim. Genet. 46:50–54. https:// doi .org/ 10 .1111/ age .12240.
Bolormaa, S., J. H. J. van der Werf, S. W. Walkden-Brown, K. Mar-shall, and A. Ruvinsky. 2010. A quantitative trait locus for fae-cal worm egg and blood eosinophil counts on chromosome 23 in Australian goats. J. Anim. Breed. Genet. 127:207–214. https:// doi .org/ 10 .1111/ j .1439 -0388 .2009 .00824 .x.
Cano, E. M., G. Marrube, D. L. Roldan, F. Bidinost, M. Abad, D. Allain, D. Vaiman, H. Taddeo, and M. a. Poli. 2007. QTL affect-ing fleece traits in Angora goats. Small Rumin. Res. 71:158–164. https:// doi .org/ 10 .1016/ j .smallrumres .2006 .06 .002.
Castañeda-Bustos, V. J., H. H. Montaldo, M. Valencia-Posadas, L. Shepard, S. Pérez-Elizalde, O. Hernández-Mendo, and G. Torres-Hernández. 2017. Linear and nonlinear genetic relationships be-tween type traits and productive life in US dairy goats. J. Dairy Sci. 100:1232–1245. https:// doi .org/ 10 .3168/ jds .2016 -11313.
Cole, J. B., G. R. Wiggans, L. Ma, T. S. Sonstegard, T. J. Lawlor, B. A. Crooker, C. P. Van Tassell, J. Yang, S. Wang, L. K. Matukum-alli, and Y. Da. 2011. Genome-wide association analysis of thirty one production, health, reproduction and body conformation traits in contemporary U.S. Holstein cows. BMC Genomics 12: https:// doi .org/ 10 .1186/ 1471 -2164 -12 -408.
Coppieters, W., J. Riquet, J. J. Arranz, P. Berzi, N. Cambisano, B. Grisart, L. Karim, F. Marcq, L. Moreau, C. Nezer, P. Simon, P. Vanmanshoven, D. Wagenaar, and M. Georges. 1998. A QTL with major effect on milk yield and composition maps to bovine chro-mosome 14. Mamm. Genome 9:540–544. https:// doi .org/ 10 .1007/ s003359900815.
Dagnachew, B. S., G. Thaller, S. Lien, and T. Adnøy. 2011. Casein SNP in Norwegian goats: additive and dominance effects on milk composition and quality. Genet. Sel. Evol. 43:31 https:// doi .org/ 10 .1186/ 1297 -9686 -43 -31.
de La Chevrotière, C., S. C. Bishop, R. Arquet, J. C. Bambou, L. Schibler, Y. Amigues, C. Moreno, and N. Mandonnet. 2012. De-tection of quantitative trait loci for resistance to gastrointestinal nematode infections in Creole goats. Anim. Genet. 43:768–775. https:// doi .org/ 10 .1111/ j .1365 -2052 .2012 .02341 .x.
de Roos, A. P. W., B. J. Hayes, R. J. Spelman, and M. E. Goddard. 2008. Linkage disequilibrium and persistence of phase in Hol-stein-Friesian, Jersey and Angus cattle. Genetics 179:1503–1512. https:// doi .org/ 10 .1534/ genetics .107 .084301.
Dettori, M. L., M. Pazzola, E. Pira, O. Puggioni, and G. M. Vacca. 2015. Variability of the caprine whey protein genes and their as-sociation with milk yield, composition and renneting properties in the Sarda breed: 2. The BLG gene. J. Dairy Res. 82:442–448. https:// doi .org/ 10 .1017/ S0022029915000473.
Dettori, M. L., A. M. Rocchigiani, S. Luridiana, M. C. Mura, V. Carcangiu, M. Pazzola, and G. M. Vacca. 2013. Growth hor-mone gene variability and its effects on milk traits in primiparous Sarda goats. J. Dairy Res. 80:255–262. https:// doi .org/ 10 .1017/ S0022029913000174.
Dong, Y., M. Xie, Y. Jiang, N. Xiao, X. Du, W. Zhang, G. Tosser-Klopp, J. Wang, S. Yang, J. Liang, W. Chen, J. Chen, P. Zeng, Y. Hou, C. Bian, S. Pan, Y. Li, X. Liu, W. Wang, B. Servin, B. Sayre, B. Zhu, D. Sweeney, R. Moore, W. Nie, Y. Shen, R. Zhao, G. Zhang, J. Li, T. Faraut, J. Womack, Y. Zhang, J. Kijas, N. Cockett, X. Xu, S. Zhao, J. Wang, and W. Wang. 2013. Sequenc-ing and automated whole-genome optical mapping of the genome of a domestic goat (Capra hircus). Nat. Biotechnol. 31:135–141. https:// doi .org/ 10 .1038/ nbt .2478.
Du, X., B. Servin, J. E. Womack, J. Cao, M. Yu, Y. Dong, W. Wang, and S. Zhao. 2014. An update of the goat genome assembly using dense radiation hybrid maps allows detailed analysis of evolution-ary rearrangements in Bovidae. BMC Genomics 15:625 https:// doi .org/ 10 .1186/ 1471 -2164 -15 -625.
Ekine, C. C., S. J. Rowe, S. C. Bishop, and D.-J. de Koning. 2014. Why breeding values estimated using familial data should not be used for genome-wide association studies. G3 (Bethesda) 4:341–347. https:// doi .org/ 10 .1534/ g3 .113 .008706.
El Hanafy, A. A. M., M. I. Qureshi, J. Sabir, M. Mutawakil, M. M. M. Ahmed, H. El Ashmaoui, H. A. M. I. Ramadan, M. Abou-Alsoud, and M. A. Sadek. 2015. Nucleotide sequencing and DNA poly-morphism studies of beta-lactoglobulin gene in native Saudi goat breeds in relation to milk yield. Czech J. Anim. Sci. 60:132–138.
Flury, C., C. Boschun, M. Denzle, B. Baps, U. Schnyde, B. Gredle, and H. Signer-Hasle. 2014. Genome-wide association study for 13 udder traits from linear type classification in cattle. Pages 17–22 in Proc. 10th World Congr. Genet. Appl. to Livest. Prod. Vancouver, Canada. American Society of Animal Science, Champaign, IL.
Garrick, D. J., and R. L. Fernando. 2013. Implementing a QTL detec-tion study (GWAS) using genomic prediction mythology. Pages 275–298 in Genome-Wide Association Studies and Genomic Pre-diction. C. Gondro, J. van der Werf, and B. Hayes, ed. Humana Press, London, UK. https:// doi .org/ 10 .1007/ 978 -1 -62703 -447 -0.
Garrick, D. J., J. F. Taylor, and R. L. Fernando. 2009. Deregressing estimated breeding values and weighting information for genomic regression analyses. Genet. Sel. Evol. 41:55 https:// doi .org/ 10 .1186/ 1297 -9686 -41 -55.
Grisart, B., W. Coppieters, F. Farnir, L. Karim, and C. Ford. 2002. Positional candidate cloning of a QTL in dairy cattle: Identifica-tion of a missense mutation in the bovine DGAT gene with major effect on milk yield and composition. Genome Res. 12:222–231. https:// doi .org/ 10 .1101/ gr .224202.
Gutiérrez-Gil, B., L. Alvarez, L. F. de la Fuente, J. P. Sanchez, F. San Primitivo, and J. J. Arranz. 2011. A genome scan for quantitative trait loci affecting body conformation traits in Spanish Churra dairy sheep. J. Dairy Sci. 94:4119–4128. https:// doi .org/ 10 .3168/ jds .2010 -4027.
Hayes, B., N. Hagesæther, T. Ådnøy, G. Pellerud, P. R. Berg, and S. Lien. 2006. Effects on production traits of haplotypes among casein genes in Norwegian goats and evidence for a site of pref-erential recombination. Genetics 174:455–464. https:// doi .org/ 10 .1534/ genetics .106 .058966.
Hou, J. X., X. P. An, Y. X. Song, J. G. Wang, T. Ma, P. Han, F. Fang, and B. Y. Cao. 2013. Combined effects of four SNP within goat PRLR gene on milk production traits. Gene 529:276–281. https:// doi .org/ 10 .1016/ j .gene .2013 .07 .057.
Huntley, S. J., S. Cooper, A. J. Bradley, and L. E. Green. 2012. A cohort study of the associations between udder conformation, milk somatic cell count, and lamb weight in suckler ewes. J. Dairy Sci. 95:5001–5010. https:// doi .org/ 10 .3168/ jds .2012 -5369.
Kijas, J. W., J. S. Ortiz, R. McCulloch, A. James, B. Brice, B. Swain, G. Tosser-Klopp, and International Goat Genome Consortium. 2013. Genetic diversity and investigation of polledness in diver-gent goat populations using 52 088 SNP. Anim. Genet. 44:325–335. https:// doi .org/ 10 .1111/ age .12011.
Kirkpatrick, M., D. Lofsvold, and M. Bulmer. 1990. Analysis of the inheritance, selection and evolution of growth trajectories. Genet-ics 124:979–993.
Koren, S., D. M. Bickhart, A. M. Phillippy, T. P. L. Smith, S. T. Sul-livan, I. Liachko, J. N. Burton, M. J. Dunham, J. Shendure, A. R. Hastie, B. L. Sayre, H. J. Huson, G. E. Liu, B. D. Rosen, S. G. Schroeder, C. P. VanTassell, and T. S. Sonstegard. 2016. From sequencing to chromosomes: New de novo assembly and scaffold-ing methods improve the goat reference genome. Abstract W522 in Proc. Plant Anim. Genome Conf., San Diego, CA. International Plant & Animal Genome, San Diego, CA.
Lan, X. Y., C. Y. Pan, H. Chen, C. Z. Lei, L. S. Hua, X. B. Yang, G. Y. Qiu, R. F. Zhang, and Y. Z. Lun. 2007. Ddel polymorphism in coding region of goat POU1F1 gene and its association with production traits. Asian-australas. J. Anim. Sci. 20:1342–1348. https:// doi .org/ 10 .5713/ ajas .2007 .1342.
Lan, X. Y., F. Peñagaricano, L. DeJung, K. Weigel, and H. Khatib. 2013. A missense mutation in the PROP1 (prophet of Pit 1) gene affects male fertility and milk production traits in the US Holstein population. J. Dairy Sci. 96:1255–1257.

12 MUCHA ET AL.
Journal of Dairy Science Vol. 101 No. 3, 2018
Lidauer, M., K. Matilainen, E. Mantysaari, and I. Straden. 2011. MiX99 Manual. MTT, Jokioinen, Finland.
Malveiro, E., M. Pereira, P. X. Marques, I. C. Santos, C. Belo, R. Re-naville, and A. Cravador. 2001. Polymorphisms at the five exons of the growth hormone gene in the Algarvia goat: Possible associa-tion with milk traits. Small Rumin. Res. 41:163–170. https:// doi .org/ 10 .1016/ S0921 -4488(01)00198 -5.
Manfredi, E., A. Piacere, P. Lahaye, and V. Ducrocq. 2001. Ge-netic parameters of type appraisal in Saanen and Alpine goats. Livest. Prod. Sci. 70:183–189. https:// doi .org/ 10 .1016/ S0301 -6226(01)00180 -4.
Maroteau, C., I. Palhière, H. Larroque, V. Clément, G. Tosser-Klopp, and R. Rupp. 2013. QTL detection for traits of interest for the dairy goat industry. Page 598 in Book of Abstracts of the 64th Annual Meeting of the European Federation of Animal Science. Wageningen Academic Publishers, Nantes, France.
Marques, P. X., M. Pereira, M. R. Marques, I. C. Santos, C. C. Belo, R. Renaville, and A. Cravador. 2003. Association of milk traits with SSCP polymorphisms at the growth hormone gene in the Serrana goat. Small Rumin. Res. 50:177–185. https:// doi .org/ 10 .1016/ S0921 -4488(03)00104 -4.
Marrube, G., E. M. Canob, D. L. Roldan, F. Bidinost, M. Abadc, D. Allain, D. Vaiman, H. Taddeo, and M. A. Poli. 2007. QTL af-fecting conformation traits in Angora goats. Small Rumin. Res. 71:255–263. https:// doi .org/ 10 .1016/ j .smallrumres .2006 .07 .008.
Martin, P., I. Palhière, C. Maroteau, P. Bardou, K. Canale-Tabet, J. Sarry, F. Woloszyn, J. Bertrand-Michel, I. Racke, H. Besir, R. Rupp, and G. Tosser-Klopp. 2017. A genome scan for milk produc-tion traits in dairy goats reveals two new mutations in Dgat1 re-ducing milk fat content. Sci. Rep. 7:1872 https:// doi .org/ 10 .1038/ s41598 -017 -02052 -0.
Martin, P., I. Palhière, G. Tosser-Klopp, and R. Rupp. 2016b. Heri-tability and genome-wide association mapping for supernumer-ary teats in French Alpine and Saanen dairy goats. J. Dairy Sci. 99:8891–8900. https:// doi .org/ 10 .3168/ jds .2016 -11210.
Martin, P. M., I. Palhière, A. Ricard, G. Tosser-Klopp, and R. Rupp. 2016a. Genome wide association study identifies new loci associ-ated with undesired coat color phenotypes in Saanen goats. PLoS One 11:e0152426. https:// doi .org/ 10 .1371/ journal .pone .0152426.
McLaren, A., S. Mucha, R. Mrode, M. Coffey, and J. Conington. 2016. Genetic parameters of linear conformation type traits and their relationship with milk yield throughout lactation in mixed-breed dairy goats. J. Dairy Sci. 99:5516–5525. https:// doi .org/ 10 .3168/ jds .2015 -10269.
Mohammad Abadi, M. R., N. Askari, A. Baghizadeh, and A. K. Es-mailizadeh. 2009. A directed search around caprine candidate loci provided evidence for microsatellites linkage to growth and cashmere yield in Rayini goats. Small Rumin. Res. 81:146–151. https:// doi .org/ 10 .1016/ j .smallrumres .2008 .12 .012.
Mucha, S., R. Mrode, M. Coffey, and J. Conington. 2014. Estimation of genetic parameters for milk yield across lactations in mixed-breed dairy goats. J. Dairy Sci. 97:2455–2461. https:// doi .org/ 10 .3168/ jds .2013 -7319.
Mucha, S., R. Mrode, I. MacLaren-Lee, M. Coffey, and J. Conington. 2015. Estimation of genomic breeding values for milk yield in UK dairy goats. J. Dairy Sci. 98:8201–8208. https:// doi .org/ 10 .3168/ jds .2015 -9682.
Palhière, I., H. Larroque, V. Clément, G. Tosser-Klopp, and R. Rupp. 2014. Genetic parameters and QTL detection for milking speed in dairy Alpine and Saanen goats. Page 892 in Proc. 10th World Congr. Genetics Appl. Livest. Prod., Vancouver, Canada. Ameri-can Society of Animal Science, Champaign, IL.
Philipsson, J., and B. Lindhé. 2003. Experiences of including reproduc-tion and health traits in Scandinavian dairy cattle breeding pro-grammes. Livest. Prod. Sci. 83:99–112. https:// doi .org/ 10 .1016/ S0301 -6226(03)00047 -2.
Piumi, F., L. Schibler, D. Vaiman, A. Oustry, and E. P. Cribiu. 1998. Comparative cytogenetic mapping reveals chromosome rearrange-ments between the X chromosomes of two closely related mamma-lian species (cattle and goats). Cytogenet. Cell Genet. 81:36–41. https:// doi .org/ 10 .1159/ 000015004.
Ponce de Leon, F. A., S. Ambady, G. A. Hawkins, S. M. Kappes, M. D. Bishop, J. M. Robl, and C. W. Beattie. 1996. Development of a bovine X chromosome linkage group and painting probes to assess cattle, sheep, and goat X chromosome segment homologies. Proc. Natl. Acad. Sci. USA 93:3450–3454.
R Development Core Team. 2011. R: A Language and Environment for Statistical Computing. R Found. Stat. Comput., Vienna, Austria.
Reber, I., I. Keller, D. Becker, C. Flury, M. Welle, and C. Drögemül-ler. 2015. Wattles in goats are associated with the FMN1/GREM1 region on chromosome 10. Anim. Genet. 46:316–320. https:// doi .org/ 10 .1111/ age .12279.
Roldán, D. L., E. Rabasa, S. Saldaño, F. Holgado, M. a. Poli, and R. J. C. Cantet. 2008. QTL detection for milk production traits in goats using a longitudinal model. J. Anim. Breed. Genet. 125:187–193. https:// doi .org/ 10 .1111/ j .1439 -0388 .2007 .00714 .x.
Rupp, R., and D. Boichard. 1999. Genetic parameters for clinical mas-titis, somatic cell score, production, udder type traits, and milk-ing ease in first lactation Holsteins. J. Dairy Sci. 82:2198–2204. https:// doi .org/ 10 .3168/ jds .S0022 -0302(99)75465 -2.
Rupp, R., V. Clément, A. Piacere, C. Robert-Granié, and E. Manfredi. 2011. Genetic parameters for milk somatic cell score and relation-ship with production and udder type traits in dairy Alpine and Saanen primiparous goats. J. Dairy Sci. 94:3629–3634. https:// doi .org/ 10 .3168/ jds .2010 -3694.
Sacchi, P., S. Chessa, E. Budelli, P. Bolla, G. Ceriotti, D. Soglia, R. Rasero, E. Cauvin, and A. Caroli. 2005. Casein haplotype structure in five Italian goat breeds. J. Dairy Sci. 88:1561–1568. https:// doi .org/ 10 .3168/ jds .S0022 -0302(05)72825 -3.
Schrooten, C., H. Bovenhuis, W. Coppieters, and J. A. Van Aren-donk. 2000. Whole genome scan to detect quantitative trait loci for conformation and functional traits in dairy cattle. J. Dairy Sci. 83:795–806. https:// doi .org/ 10 .3168/ jds .S0022 -0302(00)74942 -3.
Segura, V., B. J. Vilhjálmsson, A. Platt, A. Korte, Ü. Seren, Q. Long, and M. Nordborg. 2012. An efficient multi-locus mixed-model ap-proach for genome-wide association studies in structured popula-tions. Nat. Genet. 44:825–830. https:// doi .org/ 10 .1038/ ng .2314.
Sewalem, A., F. Miglior, and G. J. Kistemaker. 2011. Genetic pa-rameters of milking temperament and milking speed in Canadian Holsteins. J. Dairy Sci. 94:512–516. https:// doi .org/ 10 .3168/ jds .2010 -3479.
Sodeland, M., M. P. Kent, H. G. Olsen, M. A. Opsal, M. Svendsen, E. Sehested, B. J. Hayes, and S. Lien. 2011. Quantitative trait loci for clinical mastitis on chromosomes 2, 6, 14 and 20 in Norwegian Red cattle. Anim. Genet. 42:457–465. https:// doi .org/ 10 .1111/ j .1365 -2052 .2010 .02165 .x.
Tosser-Klopp, G., P. Bardou, O. Bouchez, C. Cabau, R. Crooijmans, Y. Dong, C. Donnadieu-Tonon, A. Eggen, H. C. M. Heuven, S. Jamli, A. J. Jiken, C. Klopp, C. T. Lawley, J. McEwan, P. Martin, C. R. Moreno, P. Mulsant, I. Nabihoudine, E. Pailhoux, I. Pal-hière, R. Rupp, J. Sarry, B. L. Sayre, A. Tircazes, J. Wang, W. Wang, W. Zhang, P. Ajmone, M. Amills, S. Boitard, T. Faraut, M. San Cristobal, B. Servin, W. Chen, S. Cheng, X. Liu, S. Pan, C. Song, X. Xu, C. Ye, B. Zhang, J. Lv, X. Li, L. Ren, P. Shi, J. Yu, O. Faruque, H. Lenstra, M. a. Poli, J. Zhao, S. Rui, Y. Zhang, A. Stella, X. Li, A. Valentini, and S. Zhao. 2014. Design and charac-terization of a 52K SNP chip for goats. PLoS One 9: https:// doi .org/ 10 .1371/ journal .pone .0086227.
Tosser-Klopp, G., P. Bardou, C. Cabau, A. Eggen, T. Faraut, H. Heu-ven, S. Jamli, C. Klopp, C. T. Lawley, J. McEwan, P. Martin, C. Moreno, P. Mulsant, I. Nabihoudine, E. Pailhoux, I. Palhière, R. Rupp, J. Sarry, B. Sayre, A. Tircazes, J. Wang, W. Wang, T.-P. Yu, and W. Zhang. 2012. Goat genome assembly, Availability of an international 50K SNP chip and RH panel: An update of the International Goat Genome Consortium projects. Pages 1–14 in Plant Anim. Genome Conf., San Diego, CA. International Plant & Animal Genome, San Diego, CA.
Vaiman, D., L. Schibler, F. Bourgeois, A. Oustry, Y. Amigues, and E. P. Cribiu. 1996. A genetic linkage map of the male goat genome. Genetics 144:279–305.
van der Waaij, E. H., M. Holzhauer, E. Ellen, C. Kamphuis, and G. de Jong. 2005. Genetic parameters for claw disorders in Dutch dairy

Journal of Dairy Science Vol. 101 No. 3, 2018
GWAS OF CONFORMATION TRAITS IN GOATS 13
cattle and correlations with conformation traits. J. Dairy Sci. 88:3672–3678. https:// doi .org/ 10 .3168/ jds .S0022 -0302(05)73053 -8.
VanRaden, P. M. 2008. Efficient methods to compute genomic pre-dictions. J. Dairy Sci. 91:4414–4423. https:// doi .org/ 10 .3168/ jds .2007 -0980.
Visser, C., E. Van Marle-Köster, H. Bovenhuis, and R. P. M. A. Crooijmans. 2011. QTL for mohair traits in South African An-gora goats. Small Rumin. Res. 100:8–14. https:// doi .org/ 10 .1016/ j .smallrumres .2011 .05 .007.
Visser, C., E. Van Marle-Köster, M. a. Snyman, H. Bovenhuis, and R. P. M. A. Crooijmans. 2013. Quantitative trait loci associated with pre-weaning growth in South African Angora goats. Small Ru-min. Res. 112:15–20. https:// doi .org/ 10 .1016/ j .smallrumres .2012 .11 .035.
Wasike, C. B., M. Rolf, N. C. D. Silva, R. Puchala, T. Sahlu, A. L. Goetsch, and T. A. Gipson. 2016. Genome-wide association analy-sis of residual feed intake and milk yield in dairy goats. J. Dairy Sci. 99(E-Suppl. 1):807. (Abstr.)
Winter, A., W. Krämer, F. A. O. Werner, S. Kollers, S. Kata, G. Durst-ewitz, J. Buitkamp, J. E. Womack, G. Thaller, and R. Fries. 2002. Association of a lysine-232/alanine polymorphism in a bovine gene encoding acyl -CoA: diacylglycerol acyltransferase (DGAT1) with variation at a quantitative trait locus for milk fat content. Proc. Natl. Acad. Sci. USA 99:9300–9305. https:// doi .org/ 10 .1073/ pnas .142293799.
Wu, X., M. Fang, L. Liu, S. Wang, J. Liu, X. Ding, S. Zhang, Q. Zhang, Y. Zhang, L. Qiao, M. S. Lund, G. Su, and D. Sun. 2013. Genome wide association studies for body conformation traits in the Chinese Holstein cattle population. BMC Genomics 14:897 https:// doi .org/ 10 .1186/ 1471 -2164 -14 -897.
Yang, J., J. Jiang, X. Liu, H. Wang, G. Guo, Q. Zhang, and L. Jiang. 2016. Differential expression of genes in milk of dairy cattle dur-ing lactation. Anim. Genet. 47:174–180. https:// doi .org/ 10 .1111/ age .12394.
![Adsorption of Milk Proteins (-Casein and -Lactoglobulin ... · protein with a random coil conformation in solution, but recent studies have challenged this view [16]. On the contrary,](https://img.pdfslide.net/doc/110x75/5fa3935da2da091e9e210d6e/adsorption-of-milk-proteins-casein-and-lactoglobulin-protein-with-a-random.jpg)