Embed Size (px)
Citation preview
Geographic and Economic Patterns in Health Risks and Behaviors
Highlights from the 2002 Massachusetts Behavioral Risk Factor Surveillance System
Health Survey Program Division of Research and Epidemiology
Center for Health Information, Statistics, Research, and Evaluation
Massachusetts Department of Public Health
April 2004
Source: 2002 Massachusetts BRFSS, Health Survey Program Center for Health Information, Statistics, Research, and Evaluation
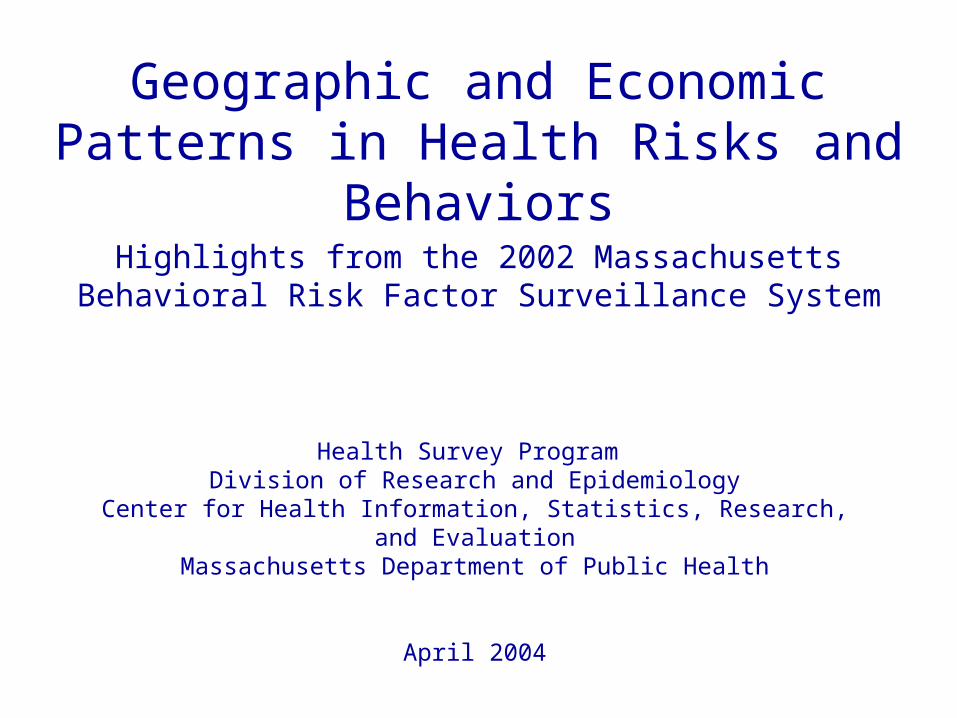
Overview
o What is the BRFSS?
o Selected topics
- by income
- by geographic region
o Summary
Source: 2002 Massachusetts BRFSS, Health Survey Program Center for Health Information, Statistics, Research, and Evaluation
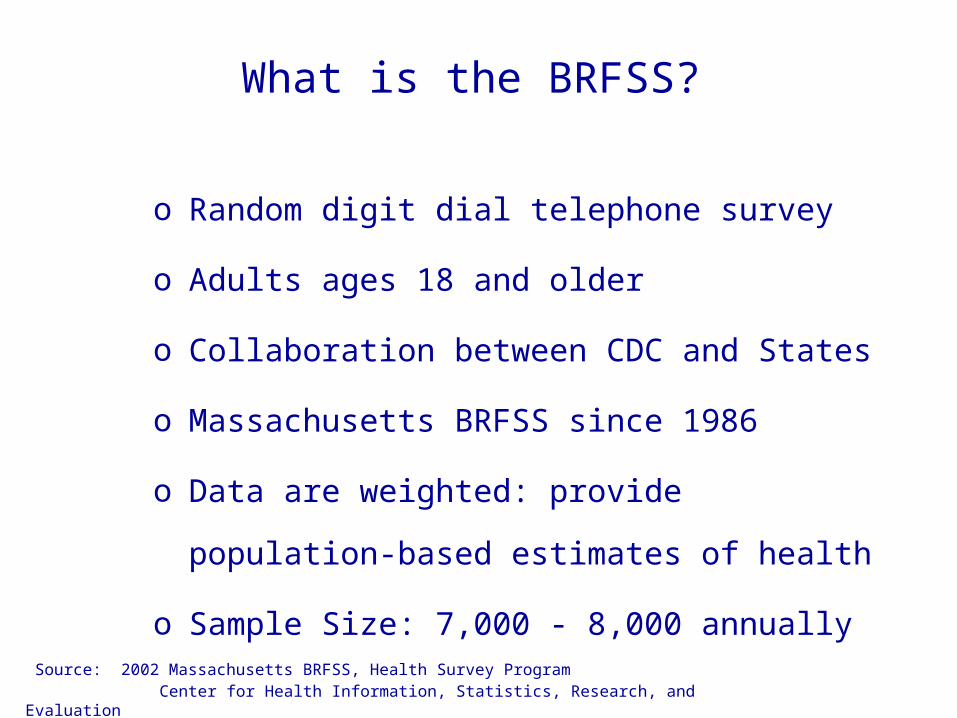
What is the BRFSS?
o Random digit dial telephone survey
o Adults ages 18 and older
o Collaboration between CDC and States
o Massachusetts BRFSS since 1986
o Data are weighted: provide population-
based estimates of health
o Sample Size: 7,000 - 8,000 annually
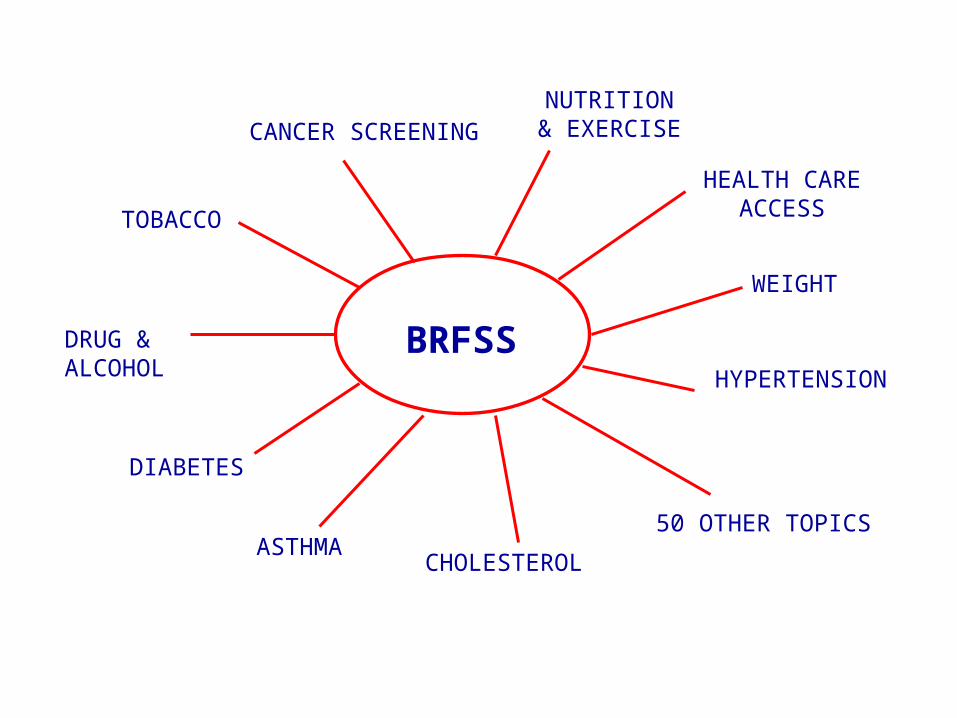
BRFSS
TOBACCO
CANCER SCREENING
DRUG &ALCOHOL
ASTHMACHOLESTEROL
NUTRITION& EXERCISE
HEALTH CARE ACCESS
HYPERTENSION
DIABETES
50 OTHER TOPICS
WEIGHT
Source: 2002 Massachusetts BRFSS, Health Survey Program Center for Health Information, Statistics, Research, and Evaluation
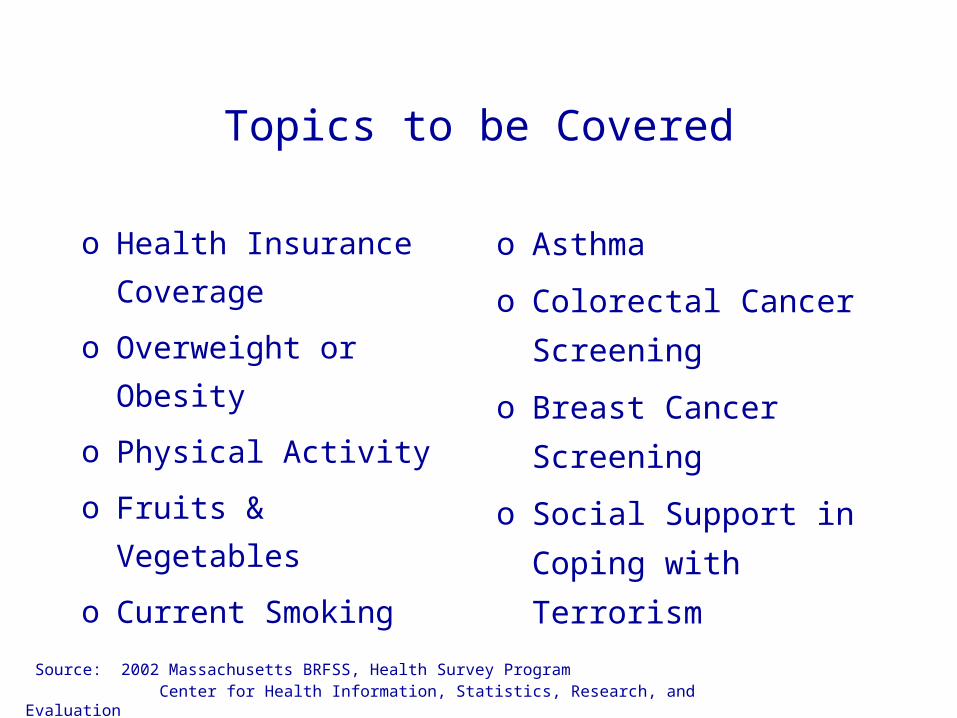
Topics to be Covered
o Health Insurance
Coverage
o Overweight or
Obesity
o Physical Activity
o Fruits & Vegetables
o Current Smoking
o Asthma
o Colorectal Cancer
Screening
o Breast Cancer
Screening
o Social Support in
Coping with
Terrorism
Source: 2002 Massachusetts BRFSS, Health Survey Program Center for Health Information, Statistics, Research, and Evaluation
No Health Insurance
8%
4%4%
6%
12%
19%
0
5
10
15
20
25
Overall <$25,000 $25-
34,999
$35-
49,999
$50-
75,000
$75,000+
Uni
nsur
ed (
%)
Source: 2002 Massachusetts BRFSS, Health Survey Program Center for Health Information, Statistics, Research, and Evaluation
No Health Insurance
Source: 2002 Massachusetts BRFSS, Health Survey Program Center for Health Information, Statistics, Research, and Evaluation
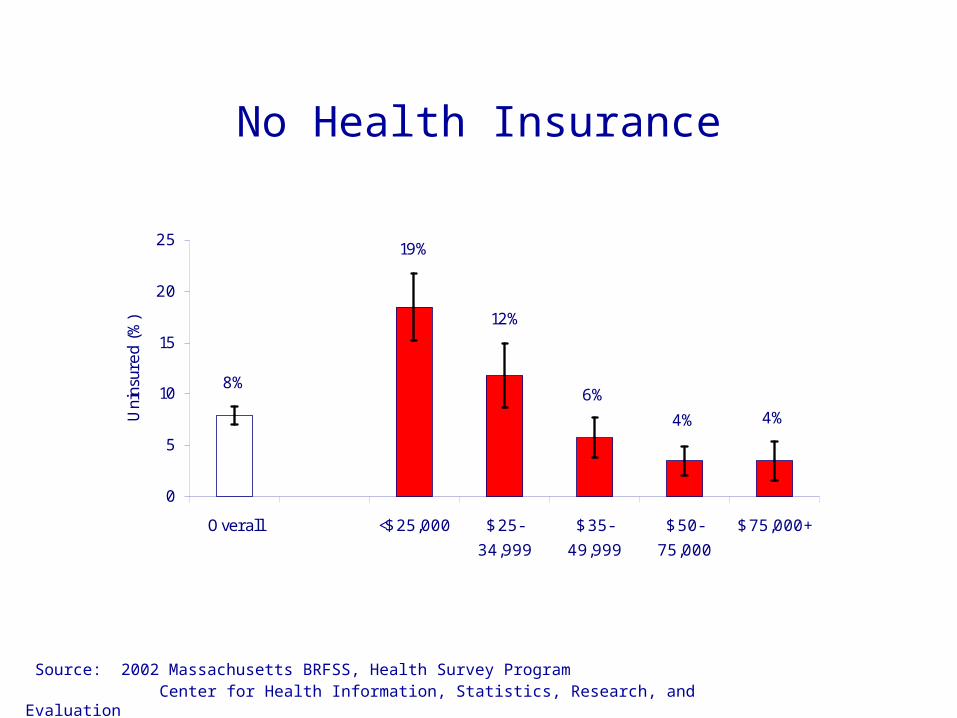
No Health Insurance
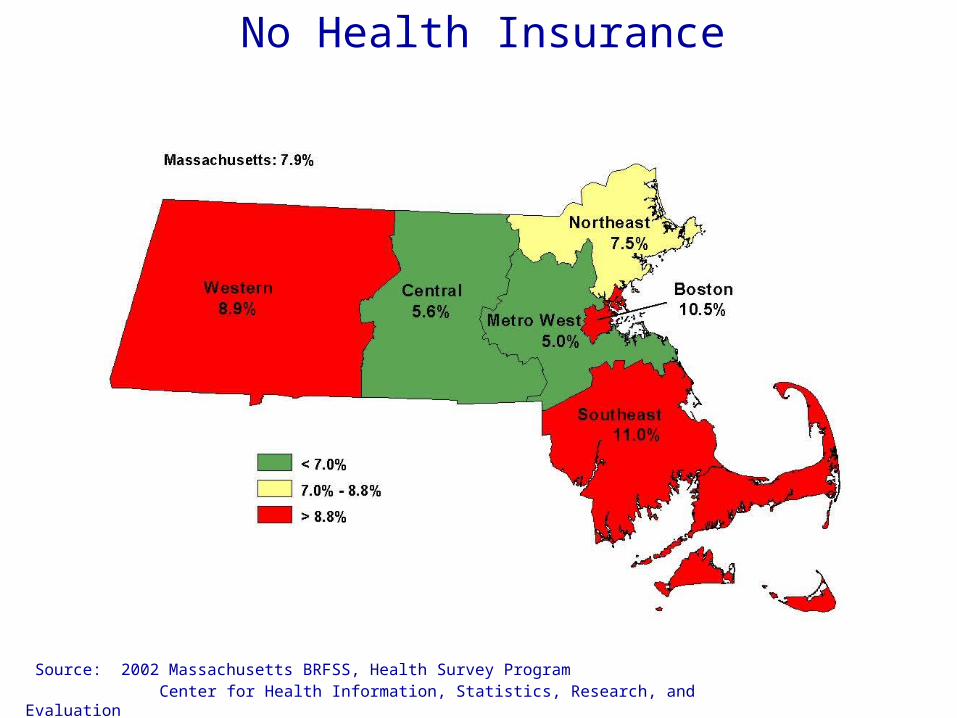
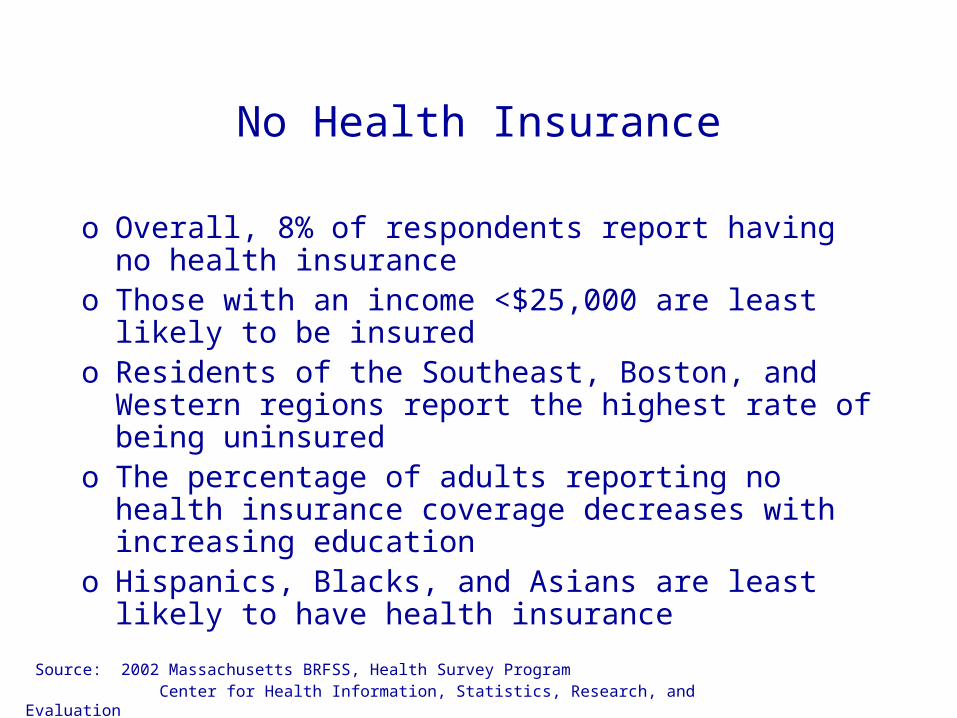
o Overall, 8% of respondents report having no health insurance
o Those with an income <$25,000 are least likely to be insured
o Residents of the Southeast, Boston, and Western regions report the highest rate of being uninsured
o The percentage of adults reporting no health insurance coverage decreases with increasing education
o Hispanics, Blacks, and Asians are least likely to have health insurance
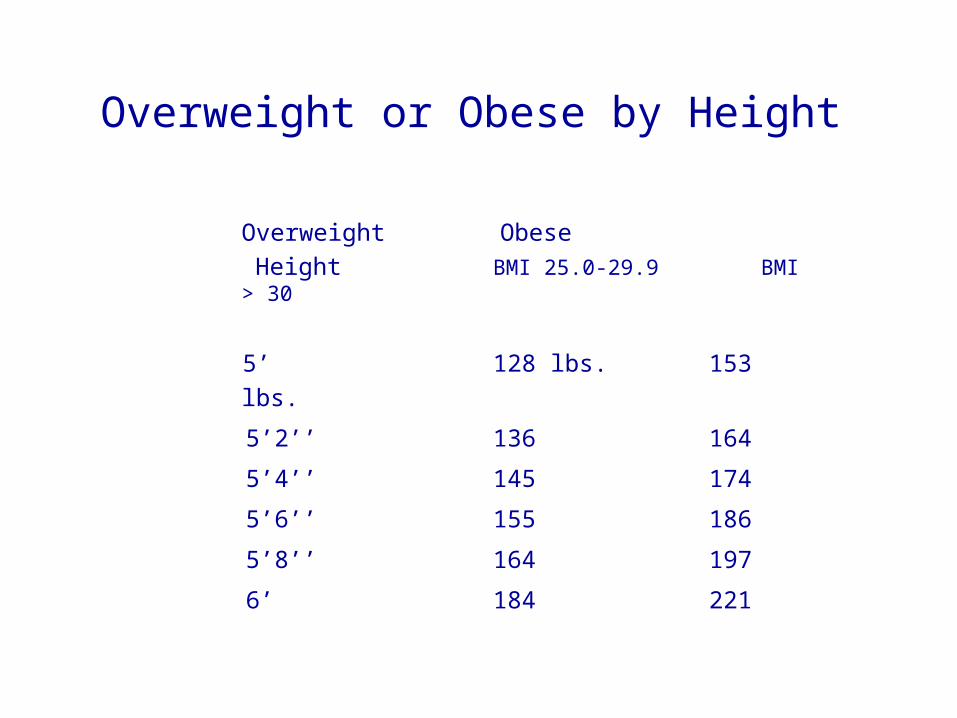
Overweight Obese Height BMI 25.0-29.9 BMI > 30
5’ 128 lbs. 153 lbs.
5’2’’ 136 164
5’4’’ 145 174
5’6’’ 155 186
5’8’’ 164 197
6’ 184 221
Overweight or Obese by Height
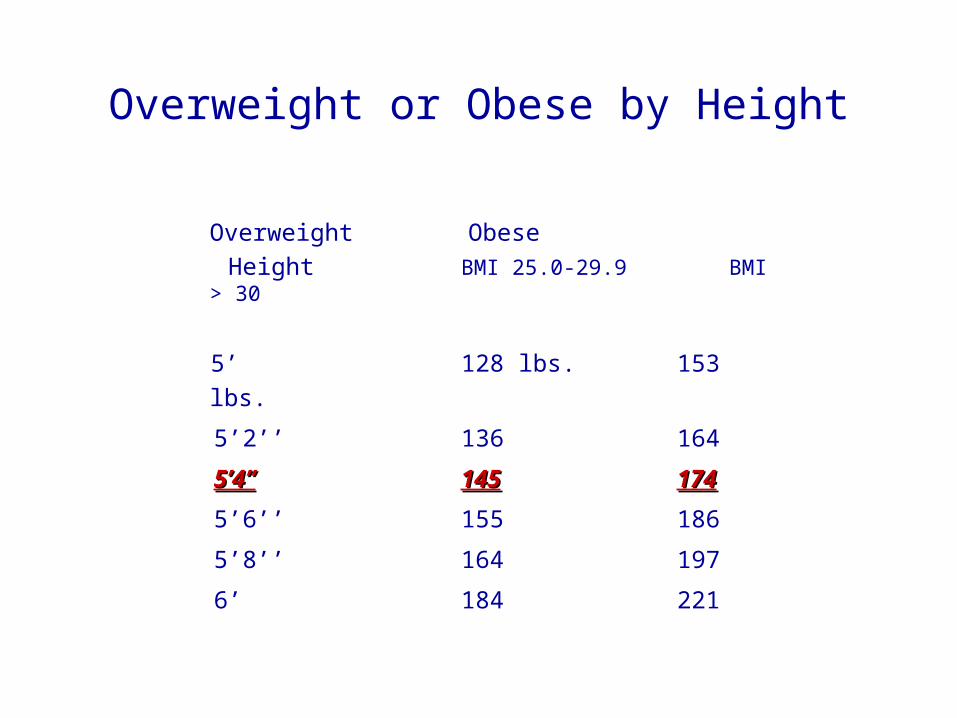
Overweight Obese Height BMI 25.0-29.9 BMI > 30
5’ 128 lbs. 153 lbs.
5’2’’ 136 164
5’4’’5’4’’ 145145 174174
5’6’’ 155 186
5’8’’ 164 197
6’ 184 221
Overweight or Obese by Height
Source: 2002 Massachusetts BRFSS, Health Survey Program Center for Health Information, Statistics, Research, and Evaluation
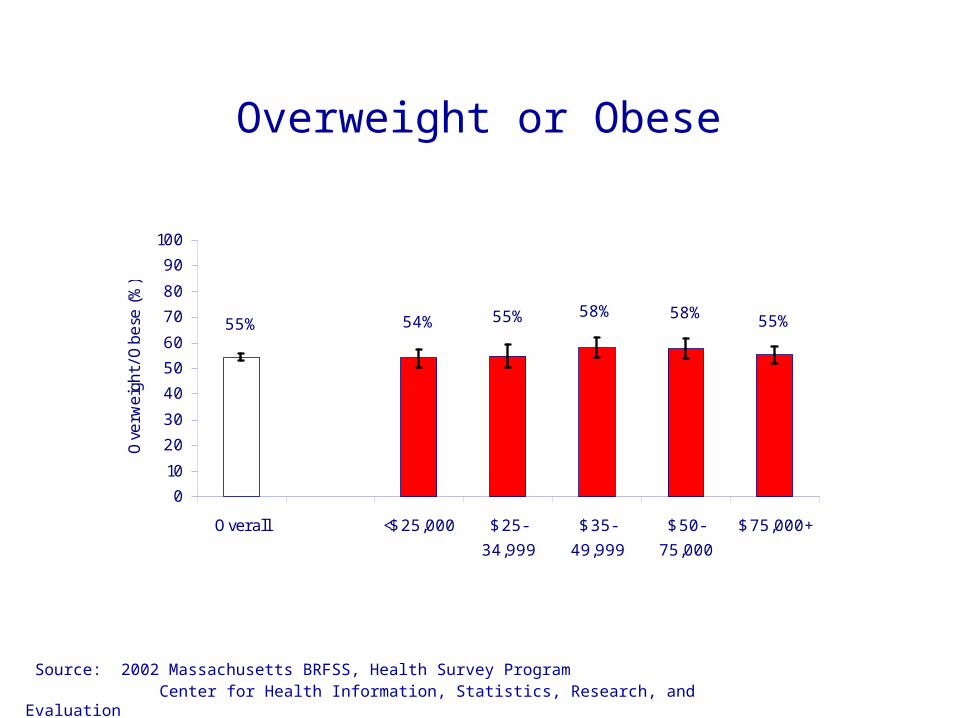
Overweight or Obese
54% 55% 58% 58% 55%55%
0
10
20
30
40
50
60
70
80
90
100
Overall <$25,000 $25-
34,999
$35-
49,999
$50-
75,000
$75,000+
Ove
rwei
ght/
Obe
se (
%)
Source: 2002 Massachusetts BRFSS, Health Survey Program Center for Health Information, Statistics, Research, and Evaluation
Overweight or Obese
Source: 2002 Massachusetts BRFSS, Health Survey Program Center for Health Information, Statistics, Research, and Evaluation
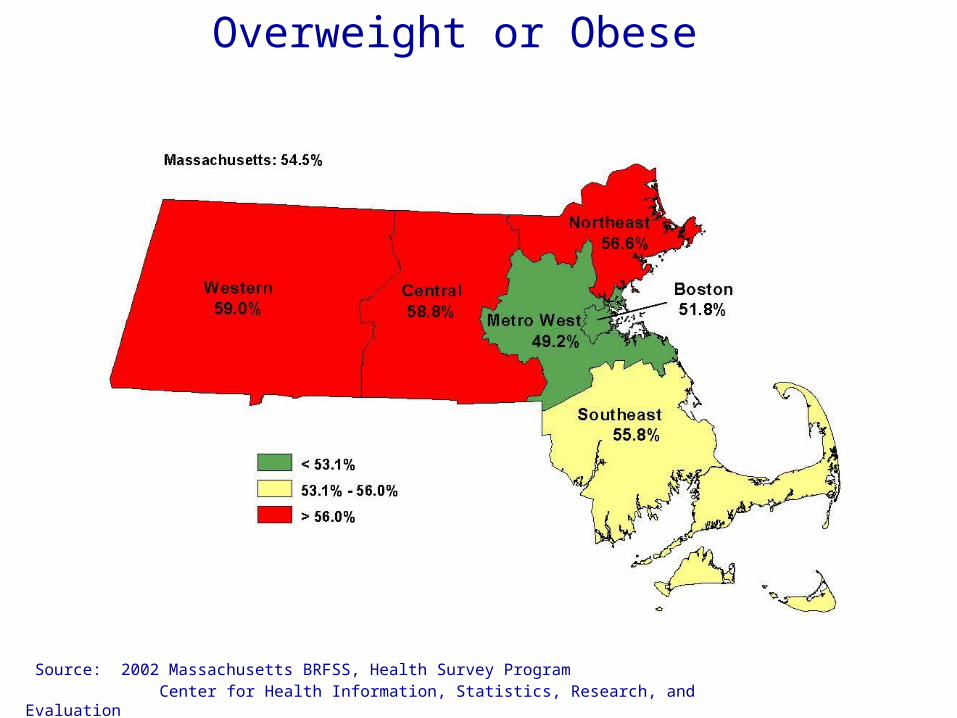
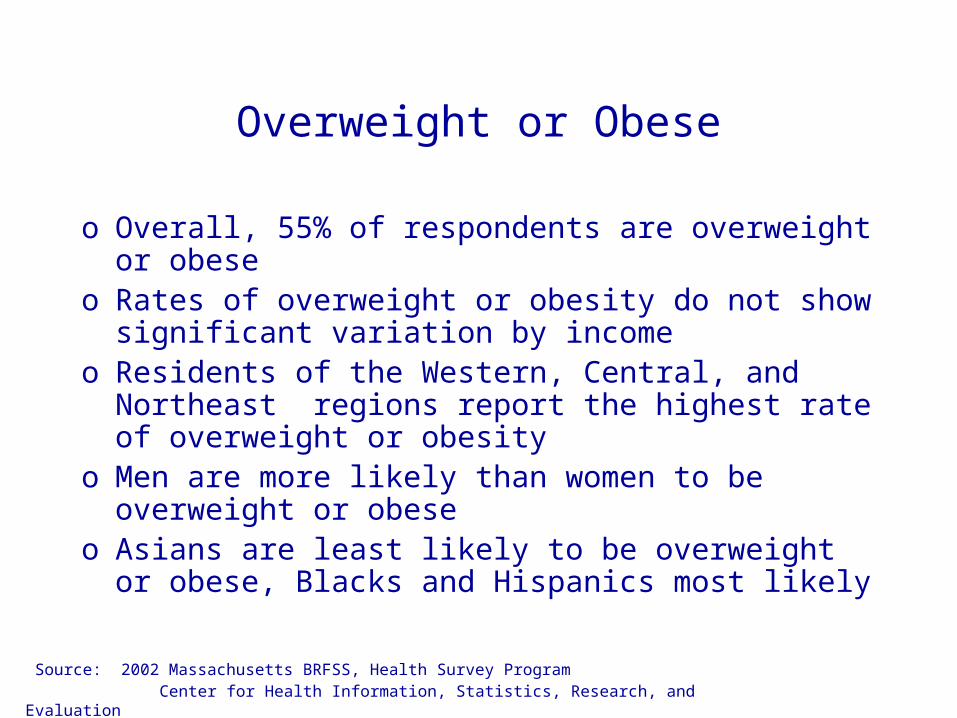
Overweight or Obese
o Overall, 55% of respondents are overweight or obese
o Rates of overweight or obesity do not show significant variation by income
o Residents of the Western, Central, and Northeast regions report the highest rate of overweight or obesity
o Men are more likely than women to be overweight or obese
o Asians are least likely to be overweight or obese, Blacks and Hispanics most likely
Source: 2002 Massachusetts BRFSS, Health Survey Program Center for Health Information, Statistics, Research, and Evaluation
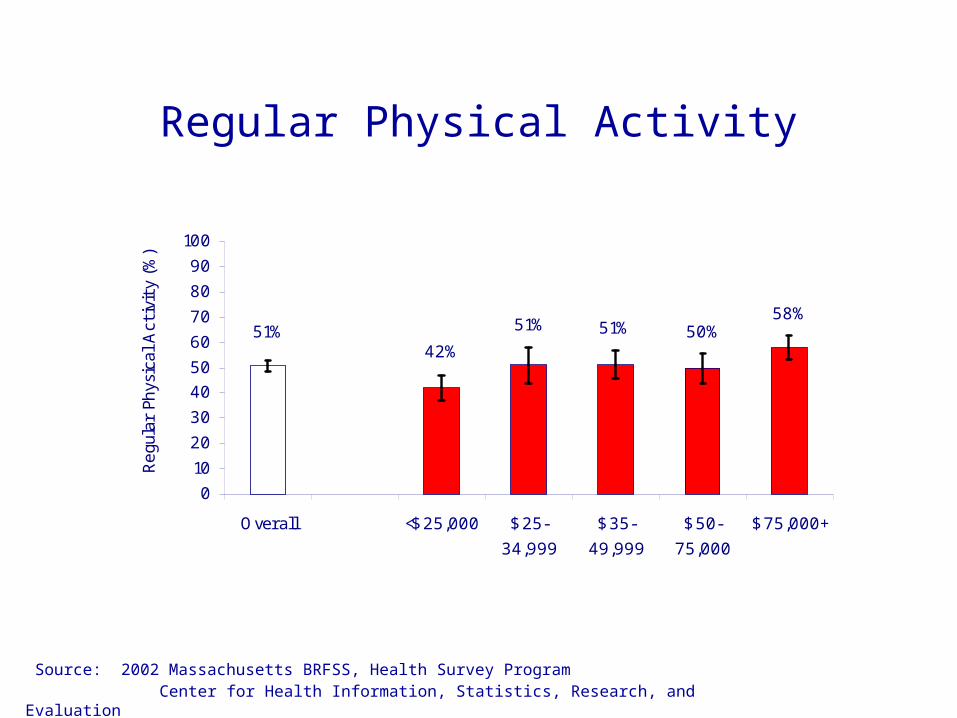
Regular Physical Activity
42%
51% 51% 50%58%
51%
0
10
20
30
40
50
60
70
80
90
100
Overall <$25,000 $25-
34,999
$35-
49,999
$50-
75,000
$75,000+
Reg
ular
Phy
sica
l Act
ivit
y (%
)
Source: 2002 Massachusetts BRFSS, Health Survey Program Center for Health Information, Statistics, Research, and Evaluation
Regular Physical Activity
Source: 2002 Massachusetts BRFSS, Health Survey Program Center for Health Information, Statistics, Research, and Evaluation
Regular Physical Activity
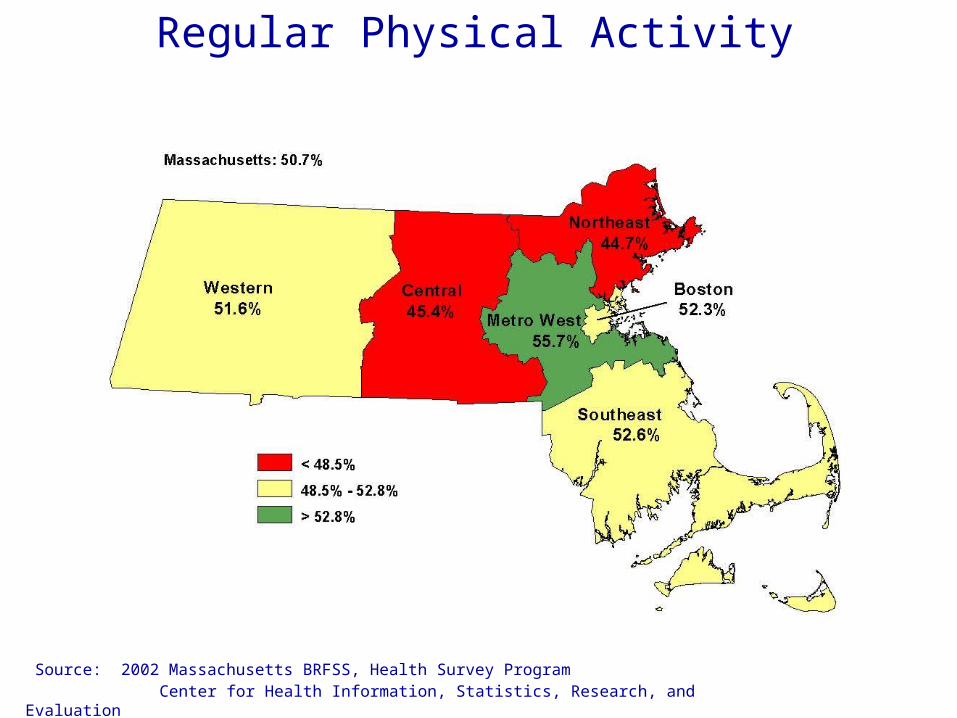
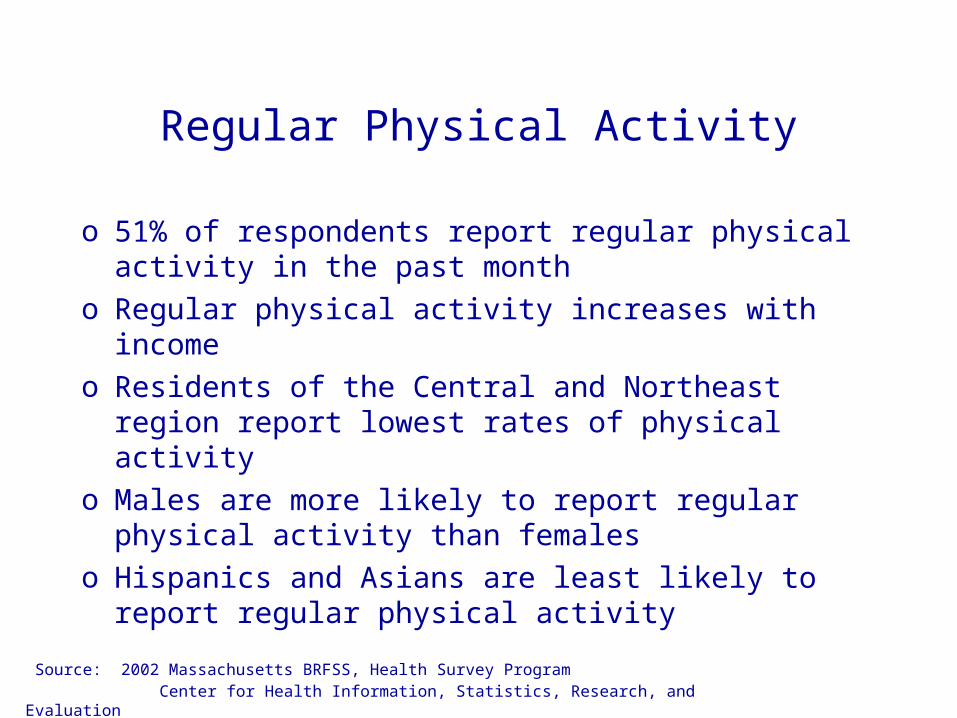
o 51% of respondents report regular physical activity in the past month
o Regular physical activity increases with income
o Residents of the Central and Northeast region report lowest rates of physical activity
o Males are more likely to report regular physical activity than females
o Hispanics and Asians are least likely to report regular physical activity
Source: 2002 Massachusetts BRFSS, Health Survey Program Center for Health Information, Statistics, Research, and Evaluation
5+ Fruits and Vegetables per Day
26%28%
30%28%
34%30%
0
10
20
30
40
50
Overall <$25,000 $25-
34,999
$35-
49,999
$50-
75,000
$75,000+
5+
Fru
its
& V
eget
able
s (%
)
Source: 2002 Massachusetts BRFSS, Health Survey Program Center for Health Information, Statistics, Research, and Evaluation
5+ Fruits and Vegetables per Day
Source: 2002 Massachusetts BRFSS, Health Survey Program Center for Health Information, Statistics, Research, and Evaluation
5+ Fruits and Vegetables per Day
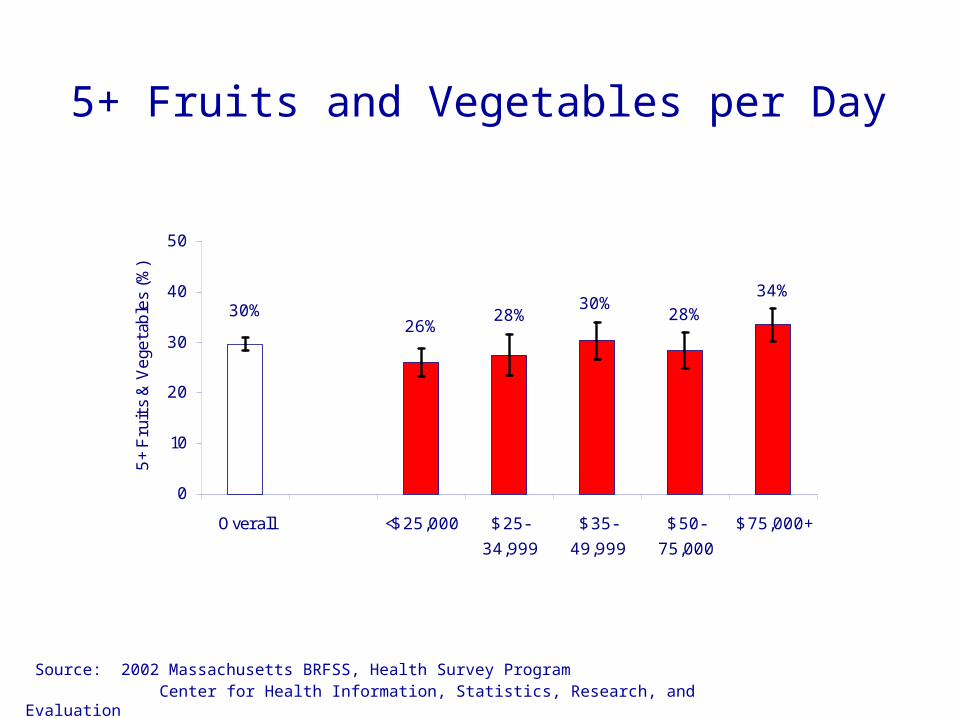
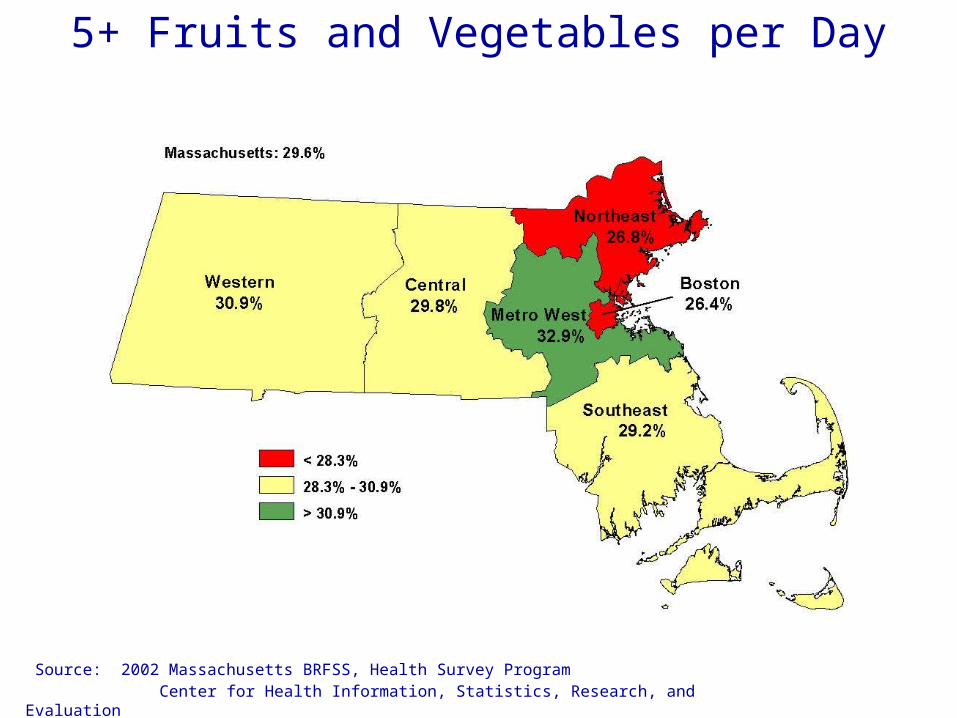
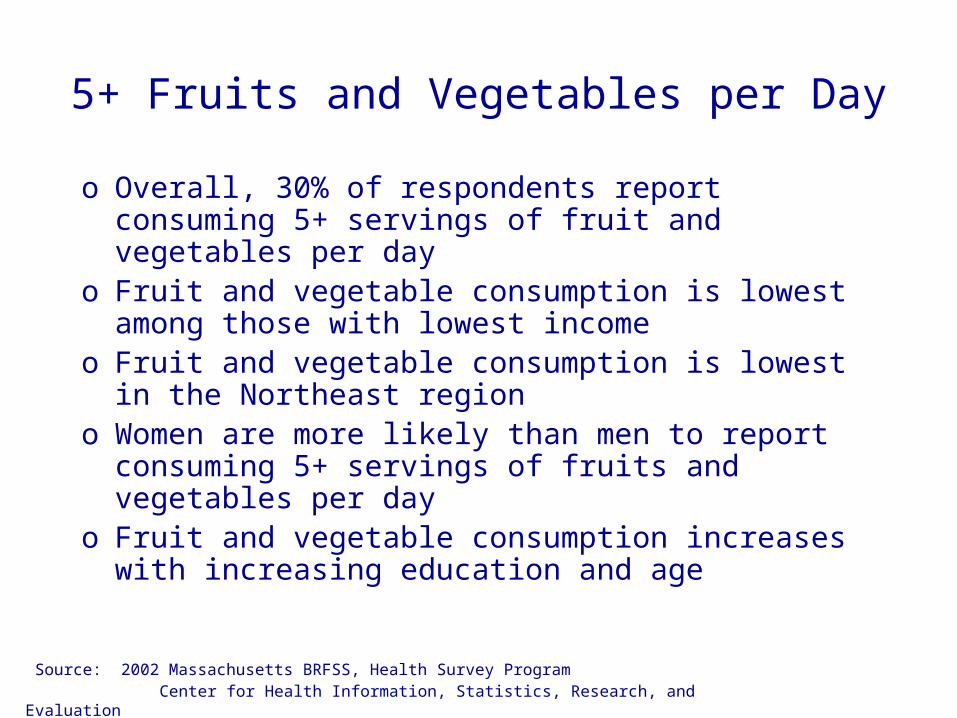
o Overall, 30% of respondents report consuming 5+ servings of fruit and vegetables per day
o Fruit and vegetable consumption is lowest among those with lowest income
o Fruit and vegetable consumption is lowest in the Northeast region
o Women are more likely than men to report consuming 5+ servings of fruits and vegetables per day
o Fruit and vegetable consumption increases with increasing education and age
Source: 2002 Massachusetts BRFSS, Health Survey Program Center for Health Information, Statistics, Research, and Evaluation
Current Smoking
19%
12%
19%22%
24%29%
0
10
20
30
40
50
Overall <$25,000 $25-
34,999
$35-
49,999
$50-
75,000
$75,000+
Cur
rent
Sm
oker
(%
)
Source: 2002 Massachusetts BRFSS, Health Survey Program Center for Health Information, Statistics, Research, and Evaluation
Current Smoking
Source: 2002 Massachusetts BRFSS, Health Survey Program Center for Health Information, Statistics, Research, and Evaluation
Current Smoking
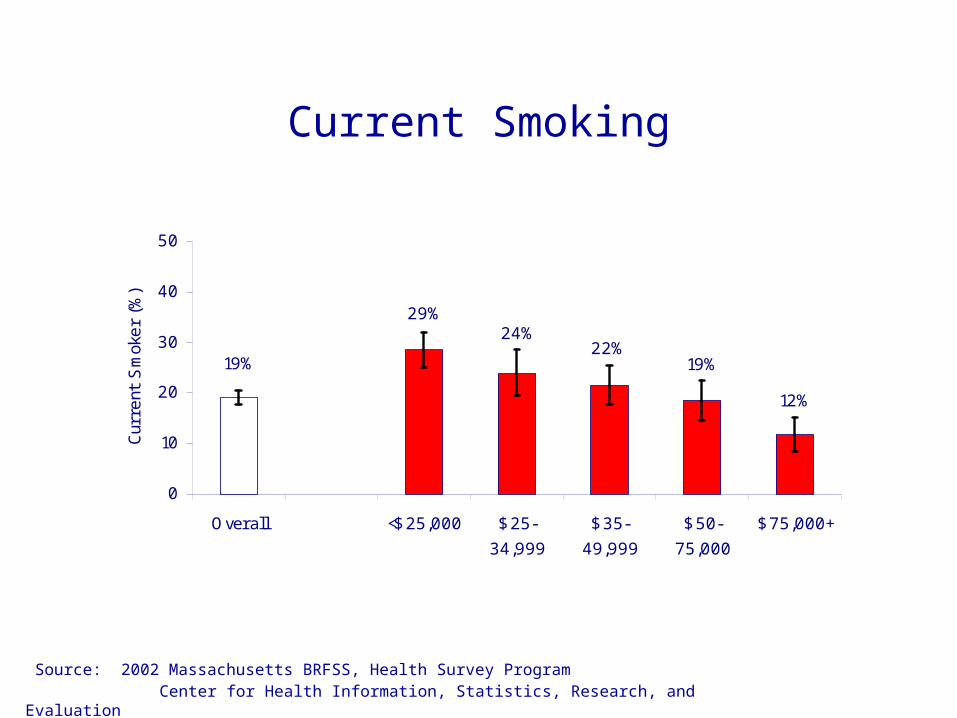
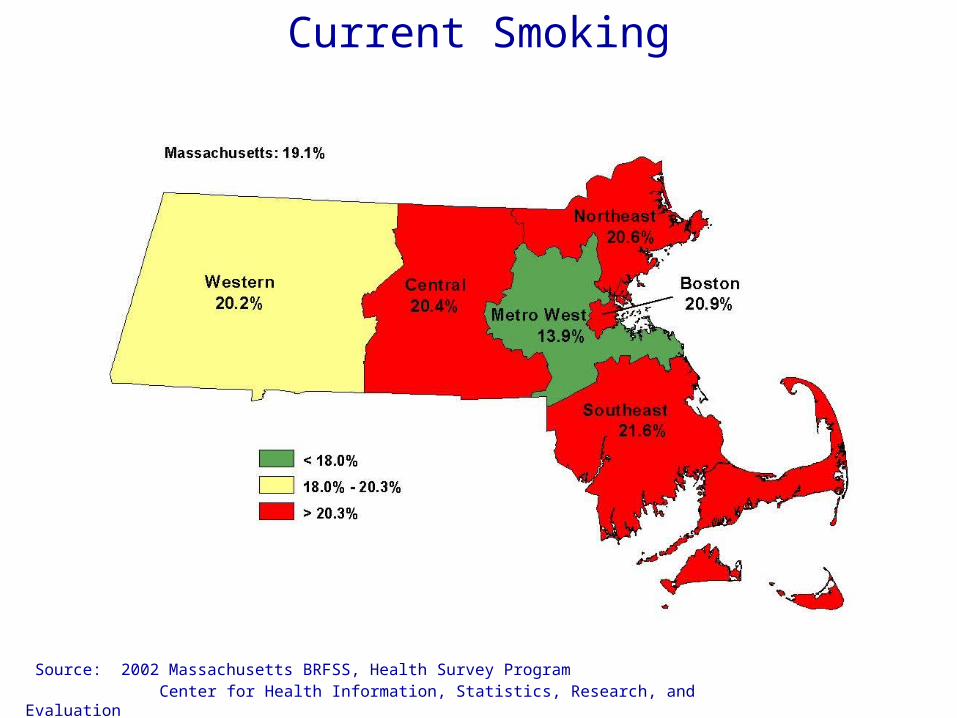
o Overall, 19% of respondents are current smokers
o Current smoking rates are highest in the Northeast, Southeast, Central, and Boston regions
o Current smoking rates are highest among the lowest levels of income
o Current smoking decreases with increasing age and education
o The percentage of adults who are current smokers has decreased over time
Source: 2002 Massachusetts BRFSS, Health Survey Program Center for Health Information, Statistics, Research, and Evaluation
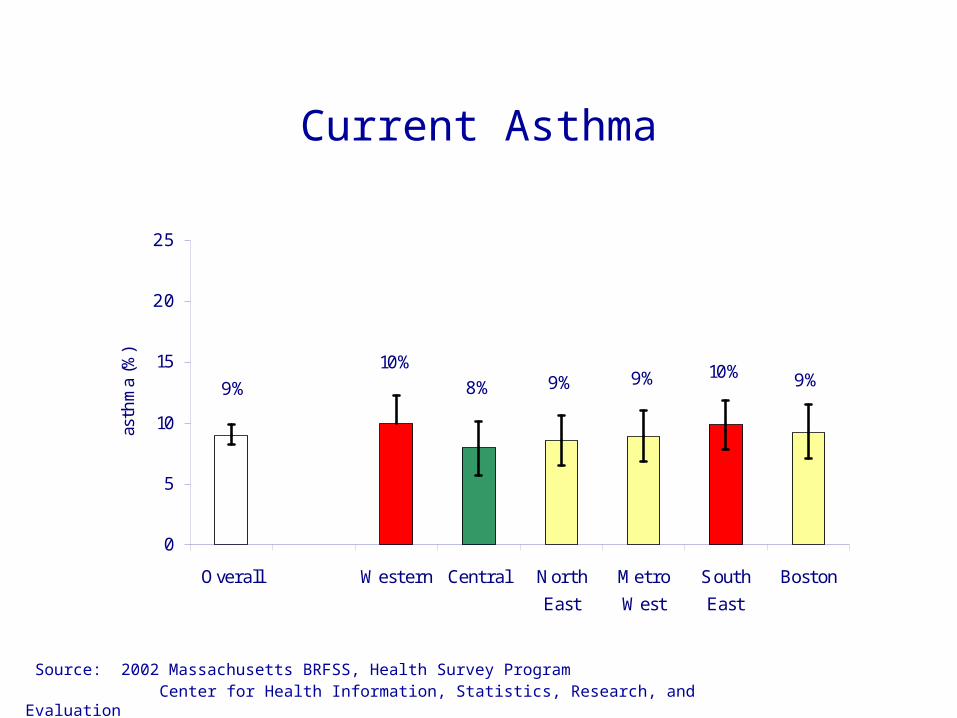
Current Asthma
10%9%9%8%10%
9% 9%
0
5
10
15
20
25
Overall Western Central North
East
Metro
West
South
East
Boston
asth
ma
(%)
Source: 2002 Massachusetts BRFSS, Health Survey Program Center for Health Information, Statistics, Research, and Evaluation
Current Asthma
o Overall, 9% of Massachusetts adults report current asthma
o Asthma rates tend to be higher in the Western and Southeast regions
o Hispanics have the highest rates of current asthma
Source: 2002 Massachusetts BRFSS, Health Survey Program Center for Health Information, Statistics, Research, and Evaluation
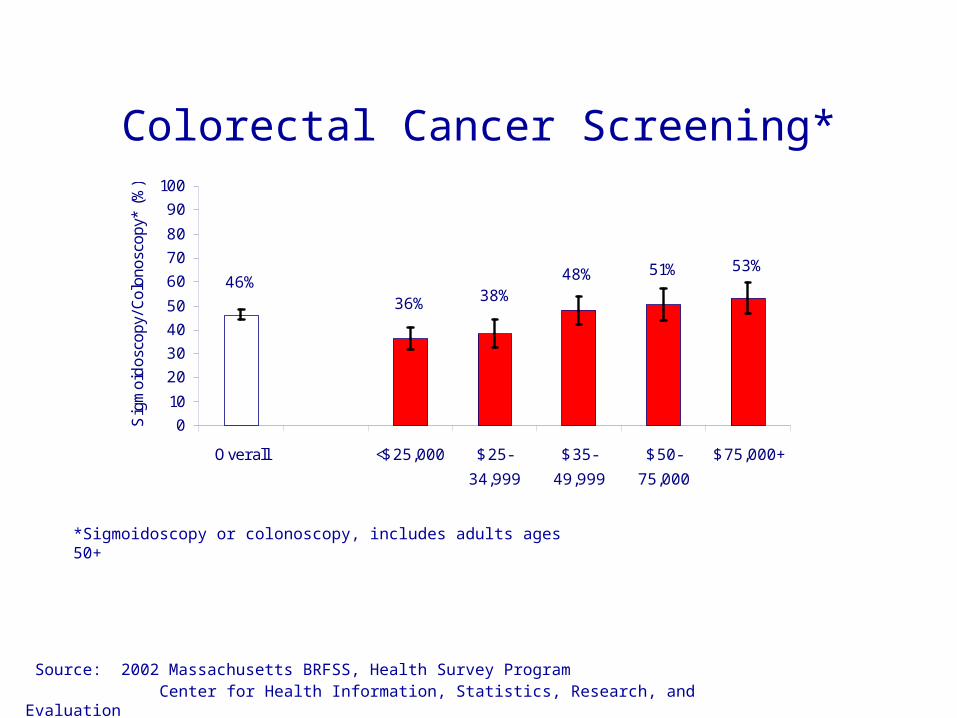
Colorectal Cancer Screening*
*Sigmoidoscopy or colonoscopy, includes adults ages 50+
46%53%51%48%
38%36%
0
10
20
30
40
50
60
70
80
90
100
Overall <$25,000 $25-
34,999
$35-
49,999
$50-
75,000
$75,000+
Sig
moi
dos
copy
/Col
onos
copy
* (%
)
Source: 2002 Massachusetts BRFSS, Health Survey Program Center for Health Information, Statistics, Research, and Evaluation
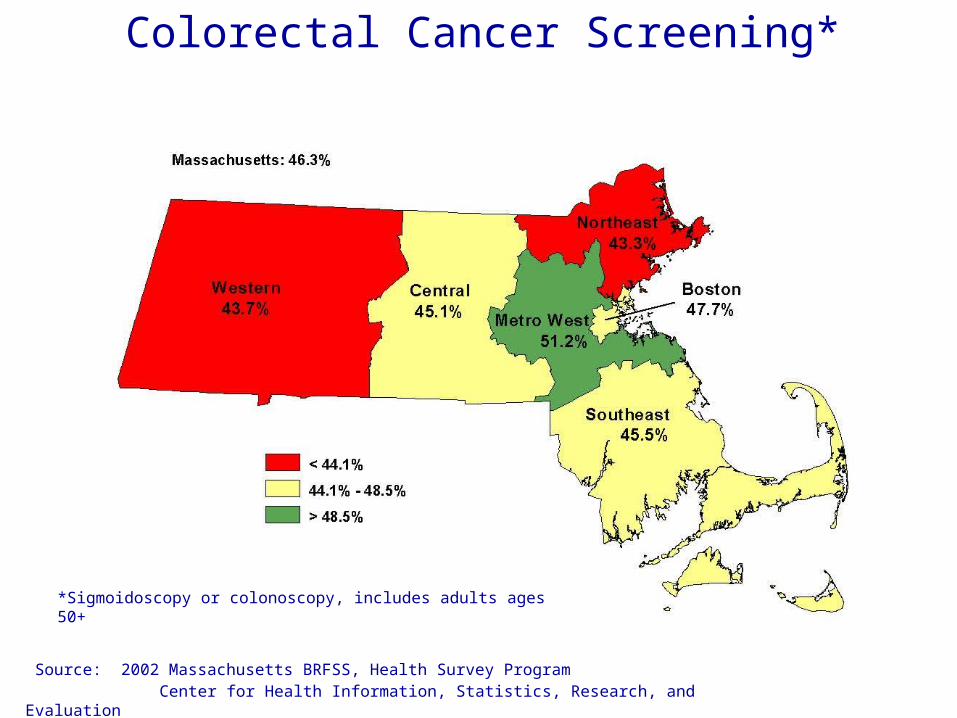
Colorectal Cancer Screening*
*Sigmoidoscopy or colonoscopy, includes adults ages 50+
Source: 2002 Massachusetts BRFSS, Health Survey Program Center for Health Information, Statistics, Research, and Evaluation
Colorectal Cancer Screening
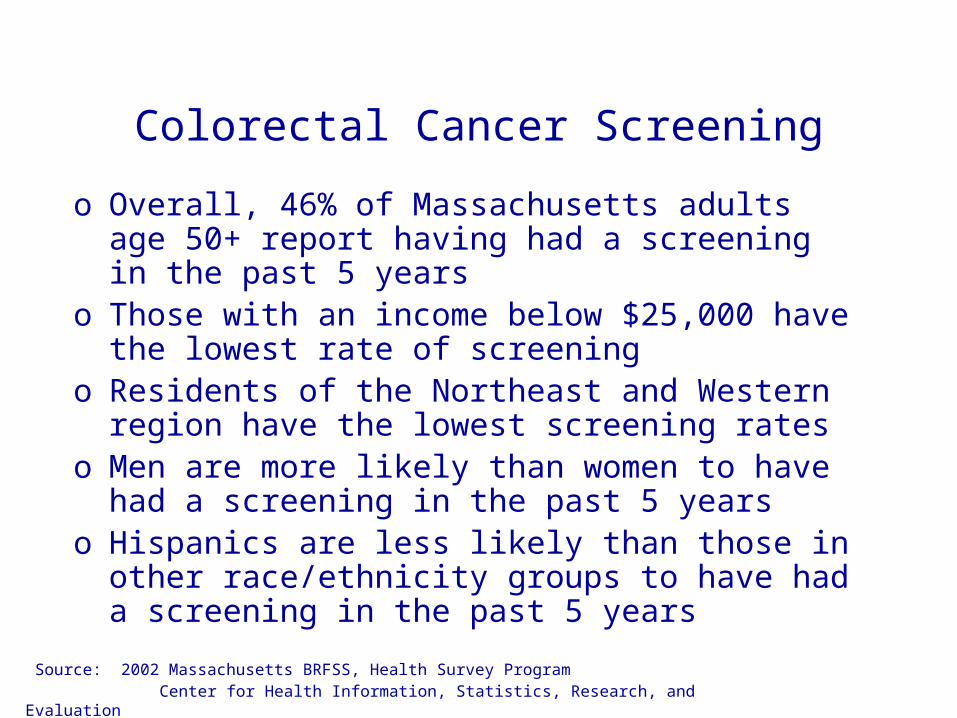
o Overall, 46% of Massachusetts adults age 50+ report having had a screening in the past 5 years
o Those with an income below $25,000 have the lowest rate of screening
o Residents of the Northeast and Western region have the lowest screening rates
o Men are more likely than women to have had a screening in the past 5 years
o Hispanics are less likely than those in other race/ethnicity groups to have had a screening in the past 5 years
Source: 2002 Massachusetts BRFSS, Health Survey Program Center for Health Information, Statistics, Research, and Evaluation
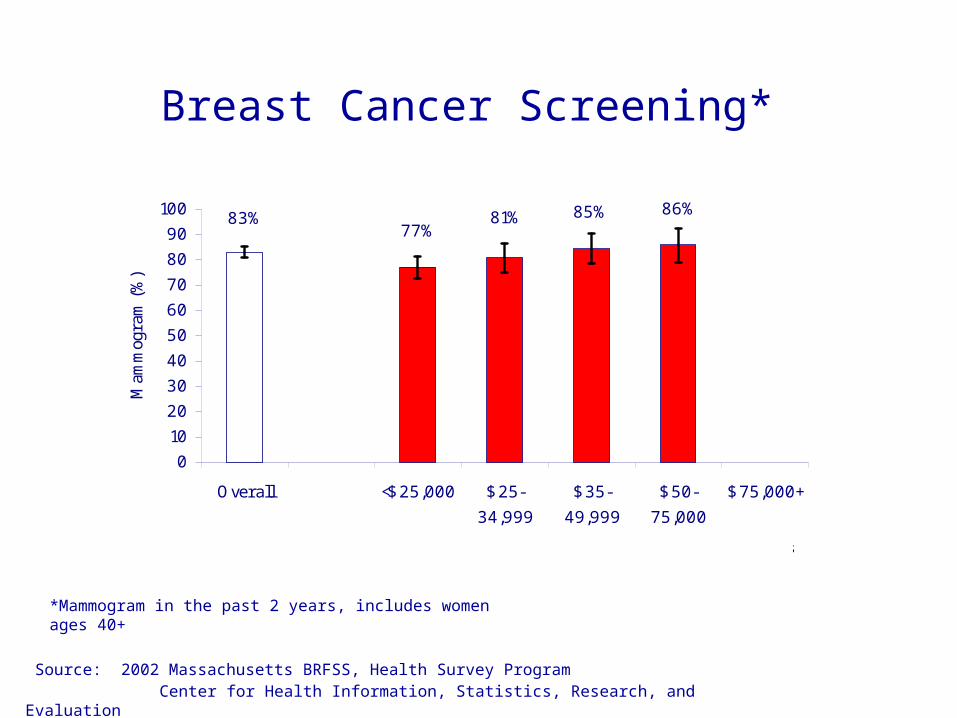
Breast Cancer Screening*
83% 86%85%81%77%
0
10
20
30
40
50
60
70
80
90
100
Overall <$25,000 $25-
34,999
$35-
49,999
$50-
75,000
$75,000+
Mam
mog
ram
(%
)
**
** insuffi cient numbers
*Mammogram in the past 2 years, includes women ages 40+
Source: 2002 Massachusetts BRFSS, Health Survey Program Center for Health Information, Statistics, Research, and Evaluation
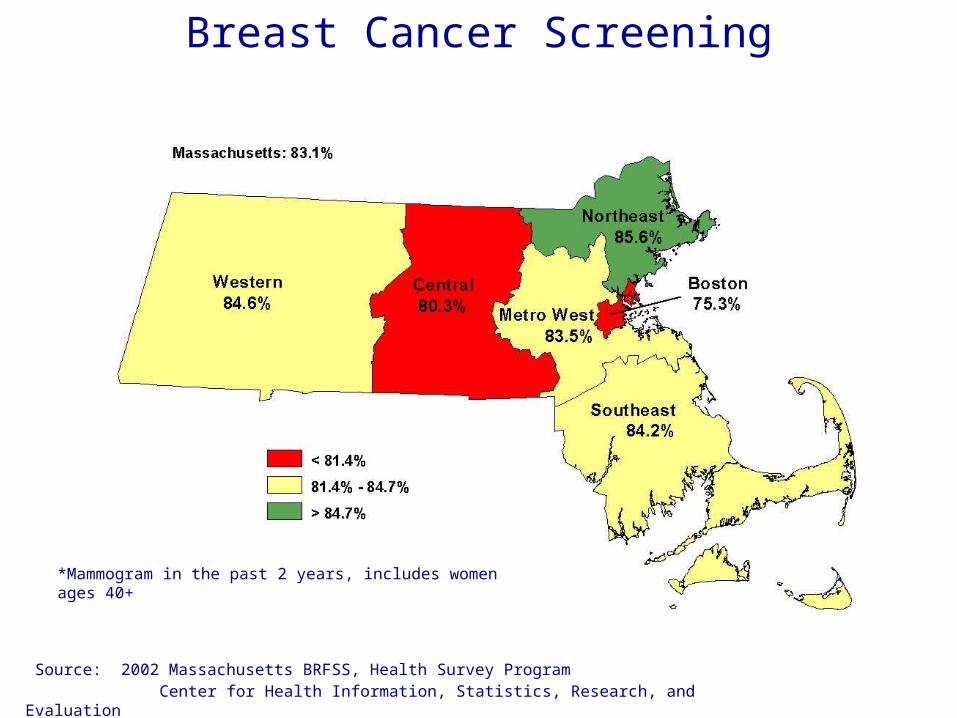
Breast Cancer Screening
*Mammogram in the past 2 years, includes women ages 40+
Source: 2002 Massachusetts BRFSS, Health Survey Program Center for Health Information, Statistics, Research, and Evaluation
Breast Cancer Screening
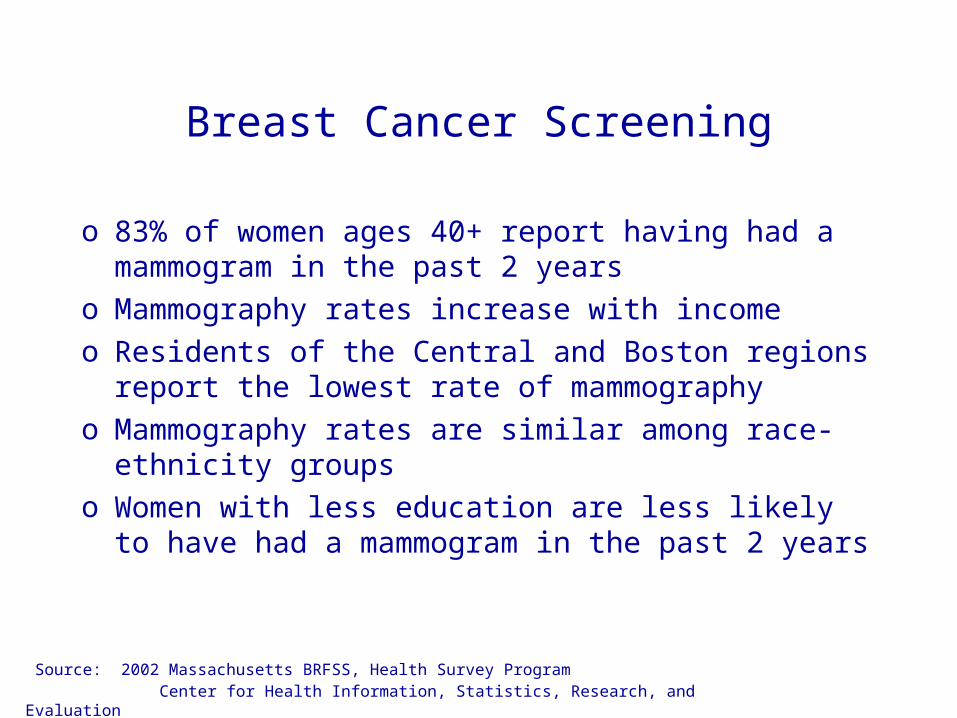
o 83% of women ages 40+ report having had a mammogram in the past 2 years
o Mammography rates increase with incomeo Residents of the Central and Boston regions
report the lowest rate of mammographyo Mammography rates are similar among race-
ethnicity groupso Women with less education are less likely to
have had a mammogram in the past 2 years
Source: 2002 Massachusetts BRFSS, Health Survey Program Center for Health Information, Statistics, Research, and Evaluation
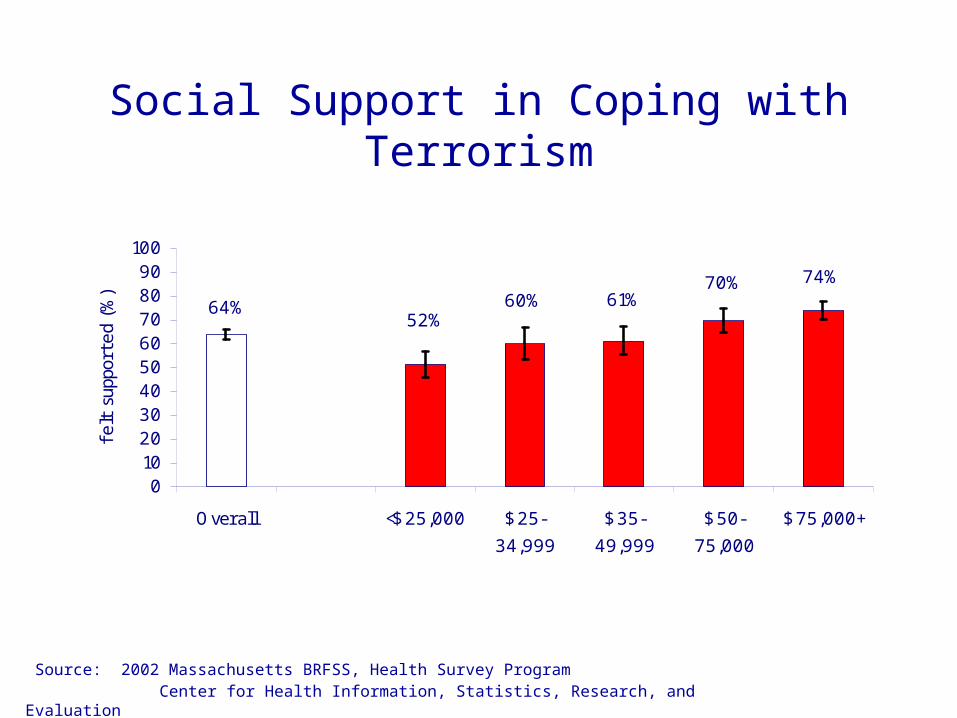
Social Support in Coping with Terrorism
64%
74%70%61%60%
52%
0102030405060708090
100
Overall <$25,000 $25-
34,999
$35-
49,999
$50-
75,000
$75,000+
felt
sup
port
ed (
%)
Source: 2002 Massachusetts BRFSS, Health Survey Program Center for Health Information, Statistics, Research, and Evaluation
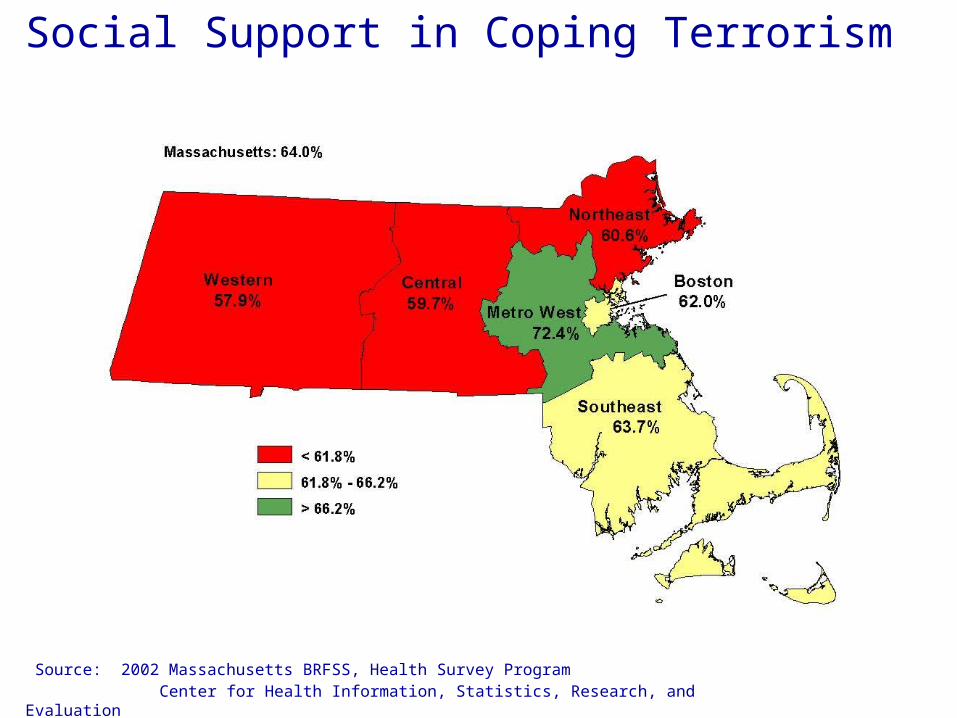
Social Support in Coping Terrorism
Source: 2002 Massachusetts BRFSS, Health Survey Program Center for Health Information, Statistics, Research, and Evaluation
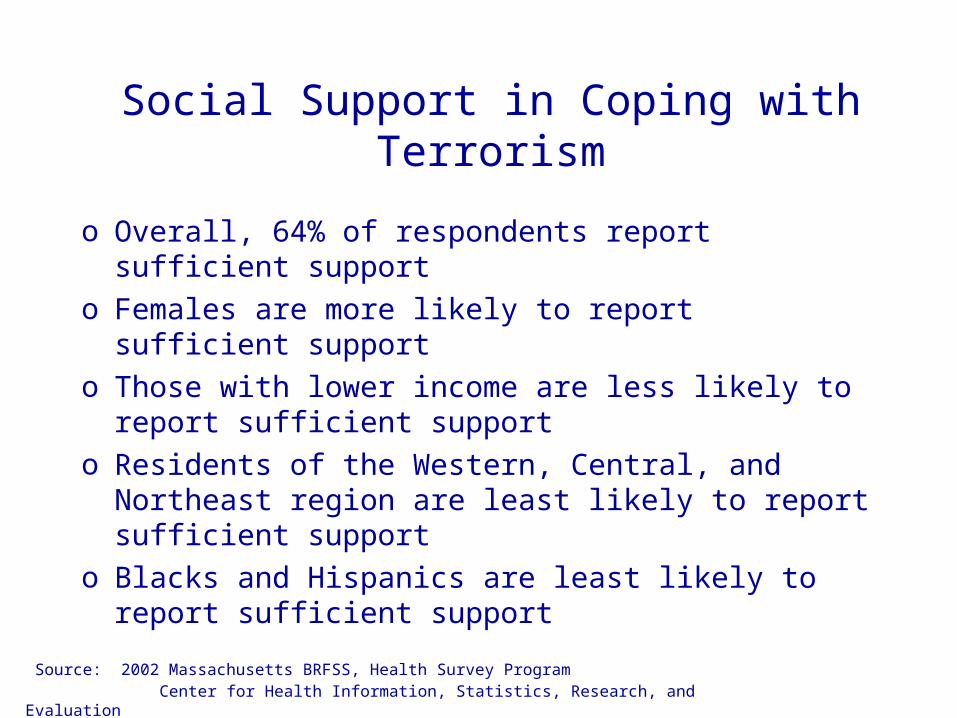
Social Support in Coping with Terrorism
o Overall, 64% of respondents report sufficient support
o Females are more likely to report sufficient support
o Those with lower income are less likely to report sufficient support
o Residents of the Western, Central, and Northeast region are least likely to report sufficient support
o Blacks and Hispanics are least likely to report sufficient support
Source: 2002 Massachusetts BRFSS, Health Survey Program Center for Health Information, Statistics, Research, and Evaluation
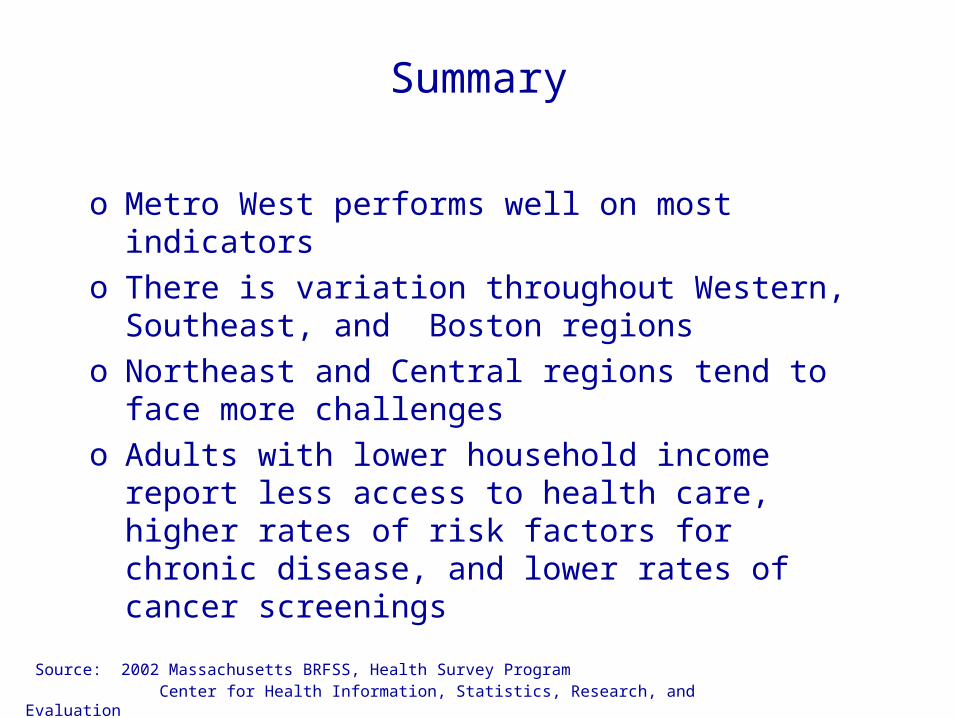
Summary
o Metro West performs well on most indicatorso There is variation throughout Western,
Southeast, and Boston regionso Northeast and Central regions tend to face
more challengeso Adults with lower household income report less
access to health care, higher rates of risk factors for chronic disease, and lower rates of cancer screenings
Source: 2002 Massachusetts BRFSS, Health Survey Program Center for Health Information, Statistics, Research, and Evaluation
DPH uses these data to:
o Help inform state and local health departments and the general public about health risks and behaviors
o Target available resources to geographic areas at greater risk
o Assist and inform policy makers, programs, and health care providers about health related disparities
Source: 2002 Massachusetts BRFSS, Health Survey Program Center for Health Information, Statistics, Research, and Evaluation
How to obtain these data?
For access to reports and data:
Visit the BRFSS website: http://www.state.ma.us/dph/bhsre/cdsp/brfss/brfss.htm MassCHIP: 2002 BRFSS data will be available late in 2004
For more information about BRFSS, please contact: Zi Zhang, Director of Health Survey Program Tel: (617) 988-3395 E-mail: [email protected]