Embed Size (px)
Citation preview

Geographic Information System for Railway Management
Hazem M. El-Bakry
Faculty of Computer Science & Information Systems,
Mansoura University, EGYPT
E-mail: [email protected]
Wael A. Awad
Faculty of Science, Port Said, Suez
Canal University, EGYPT
Abstract Safety and security and considered a critical issue in railways. Applying geographic information system
(GIS) and Global Positioning System (GPS) in the railway becomes very important. Web-based GIS makes
it easy to exchange information and create better public communication through the Web site. It helps to
plan for a trip by checking train times, stations and different lines between stations. This is done through
the Web site of the railway organization, which contains maps and databases. Therefore, in this paper, the
presented research work concentrates on using GIS to retrieve any data related to railway. This is done in
real-time at anywhere. Furthermore, it is easy to access information and check its validity through the
Internet. In addition to maintaining infrastructure network information, railway organizations are trying to
use GIS for decision support operations. Because advanced technology provides interoperability support, it
can be used to create a comprehensive railway information system that supports all critical business
processes. Railway organizations make use of GIS and advanced technology to perfectly monitor safety and security.
Because they are responsible for ensuring the safety and security of railway passengers, railway managers
need for rapid response information systems to avoid incidents. The main objective of this research work is
to create an efficient railway GIS that makes trains go automatic without human intervention to avoid
human mistakes that may cause a lot of accidents.
Keywords— GIS, Railway Information System, Information Visualization, Disaster Management.
I. Introduction Railway has long been considered as the safest
transportation media. Recognizing the need to
improve the efficiency of the transportation
systems. The statistics show a huge number of
accidents are due to human errors. Therefore,
having a systematic way for railway operation
management and reduction of human intervention
or controlling activities and performances could
play a significant role in reducing the number and
impact of accidents .
Geographic information systems have emerged in
the last decade as an essential tool for urban and
resource planning and management. Their capacity
to store, retrieve, analyze, model and map large
areas with huge volumes of spatial data has led to
an extraordinary proliferation of applications [1-
25].
GIS allows the creation of maps through
automated mapping, data capture and surveying
analysis tool. It can be used to find out what's
occurring within a set distance of a feature.
Finally, creating maps include precise details
about train crossing and train transfers After
creating maps by GIS, then link these maps to
railways Database.
GIS benefits organizations of all sizes and in
almost every industry. There is a growing interest
in and awareness of the economic and strategic
value of GIS, in part because of more standards-
based technology and greater awareness of the
benefits demonstrated by GIS users. The number
of GIS enterprise solutions and IT strategies that
include GIS are growing rapidly. The benefits of
GIS generally fall into five basic categories
[11,31,36,37,38,40,41,42,43]:
1. Cost savings resulting from greater efficiency.
2. Better decision making.
3. Improved communication.
4. Better geographic information record keeping.
5. Managing geographically.
General purpose GIS performs seven tasks [1-25]:
1. Input of data
2. Map making
3. Manipulation of data
4. File management
5. Query and analysis
6. Visualization of results
ADVANCES in VISUALIZATION, IMAGING and SIMULATION
ISSN: 1792-6130 149 ISBN: 978-960-474-246-2
These are the steps of GIS Project [59,79]:
1. Identification of Project Objectives
2. Creation of Project Database
3. Data Analysis
4. Presentation of the Results
II. Data Collection In this Section, data collection is split into data
capture (map scanning) and data store (input of
attribute data).
This paper describes the data sources, techniques,
and workflow involved in GIS data collection.
Data collection is a time consuming. Data capture
includes establishing user requirements, garnering
resources. Preparation involves obtaining data,
redrafting poor-quality map sources, editing
scanned map images, removing noise. Documents
are scanned to reduce wear and tear, improve
access, provide integrated database storage, and to
index them geographically.
Data capture:
The process by which data are received from the
real-world (primary source), or from a secondary
source such as a paper map, and fed to GIS
software. Capturing data from primary source is
usually done by using GPS or remote sensing.
While performing this from secondary source is
usually done by scanning and digitizing. The
processes of data collection are also variously
referred to as data capture, data automation, data
conversion, data transfer, data translation, and
digitizing [1-82].
In this research work, data are collected from
paper map. We get this paper map from the base
station located in Tanta, EGYPT. Paper map
consists of stations and base lines between stations
as shown in Fig. 1. There is also a book contains
data for time table of trains, their types and lines
between stations.
Data store
A geodatabase is a database designed to store,
query, and manipulate geographic information and
spatial data. It is a specialized type of spatial
database. There are two types of data:
1. Spatial data
� Scanning paper map to convert it to raster
image.
� Digitizing the map using Arc GIS.
Converting spatial feature on the map into a digital
formats (points, lines)
We have two (layers) shape files as shown in Fig.
2.
Stations: the shape file is represented in point
feature type and show stations on the map.
Base lines: The shape file is created in line feature
type and shows railway lines between two stations
are clarified in Fig. 3. Final digitized map is
shown in Fig. 4.
2. Attribute data Here, database is created by using Arc catalog.
Database creation basically depends on the quality
and quantity of data available from data capture
step. Database tables are:
1. Base lines
2. Stations
3. Train _date
4. Trains
The relationship between database tables is
described in Fig. 5. The base line table is shown in
Fig. 6. The data view is listed in Fig. 7. The
primary key of this table is "OBJECTID". The
attribute "SHAPE" contains data captured from
digitizing process (line feature). "SHAPE_Length"
is the length of line. "ID" is the line ID. "Name" is
the line name. The design view of trains table is
shown in Fig. 8. The data view of trains table is
listed in Fig. 9. The primary key is "Train_NO".
This table contain train types that are stored in the
database. It contains 684 records corresponding to
the total number of trains. The design view of
train_dates table is implemented in Fig. 10. Here,
a composed primary key ("Train_No" and
"Station_Name") is used. The data view of
train_dates tables is shown in Fig. 11. This table
consists of four columns (train_No, Station_Name,
Arrival/Going, Notes). It contains train dates with
more than 6000 records that are stored in the
database.
III. Analysis and Development
Here, AspMap for .net is used to show the
designed map of the railway. AspMap is a set of
server-side mapping controls and components that
let maps be added to the Web applications.
AspMap can be accessed directly by ASP.NET,
VB.NET, C# and other .NET supported
environments.
Advantages of AspMap:
AspMap allows to calculate point-to-point, multi-
point routes and incorporate turn-by-turn driving
directions to the Web applications. AspMap's
routing features include [75,76]:
1. Generation of a route between two or more
points based on their coordinates.
2. Determination of the shortest routes.
3. Evaluation of the quickest routes based on
distance and speed.
ADVANCES in VISUALIZATION, IMAGING and SIMULATION
ISSN: 1792-6130 150 ISBN: 978-960-474-246-2
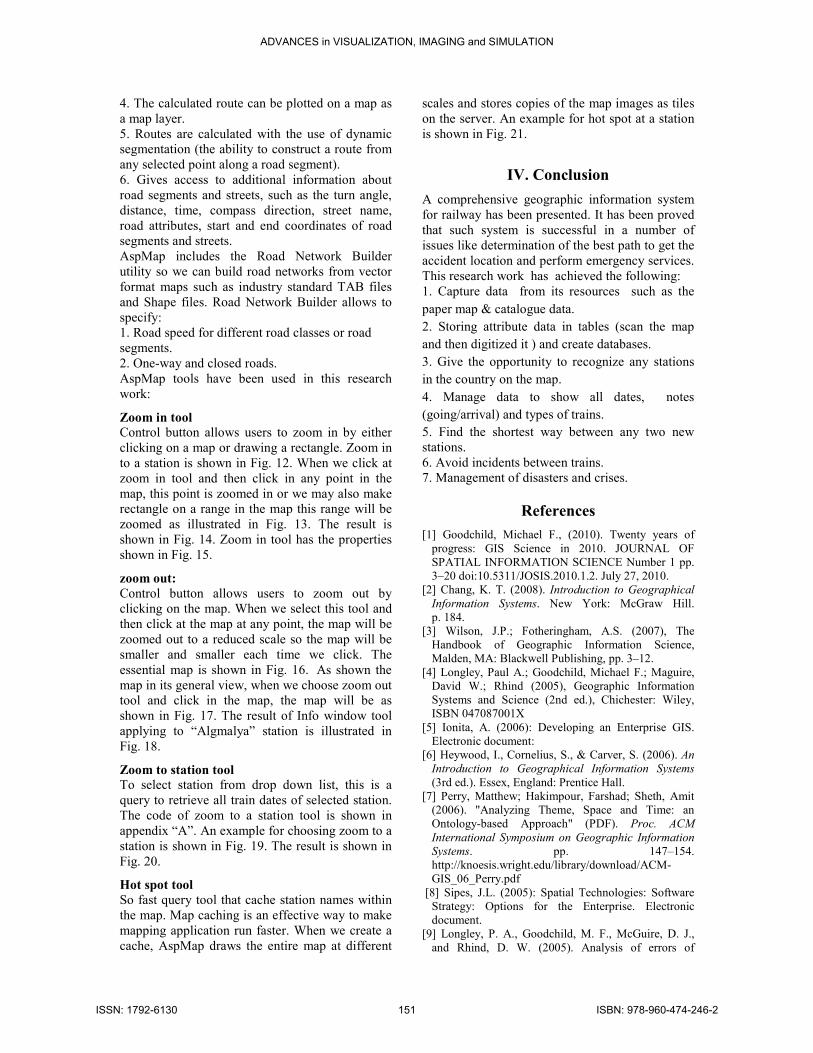
4. The calculated route can be plotted on a map as
a map layer.
5. Routes are calculated with the use of dynamic
segmentation (the ability to construct a route from
any selected point along a road segment).
6. Gives access to additional information about
road segments and streets, such as the turn angle,
distance, time, compass direction, street name,
road attributes, start and end coordinates of road
segments and streets.
AspMap includes the Road Network Builder
utility so we can build road networks from vector
format maps such as industry standard TAB files
and Shape files. Road Network Builder allows to
specify:
1. Road speed for different road classes or road
segments.
2. One-way and closed roads.
AspMap tools have been used in this research
work:
Zoom in tool
Control button allows users to zoom in by either
clicking on a map or drawing a rectangle. Zoom in
to a station is shown in Fig. 12. When we click at
zoom in tool and then click in any point in the
map, this point is zoomed in or we may also make
rectangle on a range in the map this range will be
zoomed as illustrated in Fig. 13. The result is
shown in Fig. 14. Zoom in tool has the properties
shown in Fig. 15.
zoom out:
Control button allows users to zoom out by
clicking on the map. When we select this tool and
then click at the map at any point, the map will be
zoomed out to a reduced scale so the map will be
smaller and smaller each time we click. The
essential map is shown in Fig. 16. As shown the map in its general view, when we choose zoom out
tool and click in the map, the map will be as
shown in Fig. 17. The result of Info window tool
applying to “Algmalya” station is illustrated in
Fig. 18.
Zoom to station tool
To select station from drop down list, this is a
query to retrieve all train dates of selected station.
The code of zoom to a station tool is shown in
appendix “A”. An example for choosing zoom to a
station is shown in Fig. 19. The result is shown in
Fig. 20.
Hot spot tool
So fast query tool that cache station names within
the map. Map caching is an effective way to make
mapping application run faster. When we create a
cache, AspMap draws the entire map at different
scales and stores copies of the map images as tiles
on the server. An example for hot spot at a station
is shown in Fig. 21.
IV. Conclusion
A comprehensive geographic information system
for railway has been presented. It has been proved
that such system is successful in a number of
issues like determination of the best path to get the
accident location and perform emergency services.
This research work has achieved the following:
1. Capture data from its resources such as the
paper map & catalogue data.
2. Storing attribute data in tables (scan the map
and then digitized it ) and create databases.
3. Give the opportunity to recognize any stations
in the country on the map.
4. Manage data to show all dates, notes
(going/arrival) and types of trains.
5. Find the shortest way between any two new
stations.
6. Avoid incidents between trains.
7. Management of disasters and crises.
References
[1] Goodchild, Michael F., (2010). Twenty years of
progress: GIS Science in 2010. JOURNAL OF
SPATIAL INFORMATION SCIENCE Number 1 pp.
3–20 doi:10.5311/JOSIS.2010.1.2. July 27, 2010.
[2] Chang, K. T. (2008). Introduction to Geographical
Information Systems. New York: McGraw Hill.
p. 184.
[3] Wilson, J.P.; Fotheringham, A.S. (2007), The
Handbook of Geographic Information Science,
Malden, MA: Blackwell Publishing, pp. 3–12.
[4] Longley, Paul A.; Goodchild, Michael F.; Maguire,
David W.; Rhind (2005), Geographic Information
Systems and Science (2nd ed.), Chichester: Wiley,
ISBN 047087001X
[5] Ionita, A. (2006): Developing an Enterprise GIS.
Electronic document:
[6] Heywood, I., Cornelius, S., & Carver, S. (2006). An
Introduction to Geographical Information Systems
(3rd ed.). Essex, England: Prentice Hall.
[7] Perry, Matthew; Hakimpour, Farshad; Sheth, Amit
(2006). "Analyzing Theme, Space and Time: an
Ontology-based Approach" (PDF). Proc. ACM
International Symposium on Geographic Information
Systems. pp. 147–154.
http://knoesis.wright.edu/library/download/ACM-
GIS_06_Perry.pdf
[8] Sipes, J.L. (2005): Spatial Technologies: Software
Strategy: Options for the Enterprise. Electronic
document.
[9] Longley, P. A., Goodchild, M. F., McGuire, D. J.,
and Rhind, D. W. (2005). Analysis of errors of
ADVANCES in VISUALIZATION, IMAGING and SIMULATION
ISSN: 1792-6130 151 ISBN: 978-960-474-246-2

derived slope and aspect related to DEM data
properties. West Sussex, England: John Wiley and
Sons. 328.
[19] Zhou, Q. and Liu, X. (2003). "Analysis of errors of
derived slope and aspect related to DEM data
properties". Computers and Geosciences 30: 269–378.
[11] ESRI (2003): Enterprise GIS for Municipal
Government. ESRI White Paper. Electronic document.
[12] Fonseca, Frederico; Sheth, Amit (2002). "The
Geospatial Semantic Web" (PDF). UCGIS White
Paper.
http://www.personal.psu.edu/faculty/f/u/fuf1/Fonseca-
Sheth.pdf
[13] Fonseca, Frederico; Egenhofer, Max (1999).
"Ontology-Driven Geographic Information Systems".
Proc. ACM International Symposium on Geographic
Information Systems. pp. 14–19
[14] Goodchild, Michael F. (1990), "Spatial information
sciencePDF", Proceedings, Fourth International
Symposium on Spatial Data Handling (Zurich,
Switzerland): 3–12
[15] Goodchild, Michael F. (1992), "Geographical
information science", International Journal of
Geographical Information Systems 6 (1): 31–45
[16] Tim Foresman 1997 The History of GIS
(Geographic Information Systems): Perspectives from
the Pioneers. (Prentice Hall Series in Geographic
Information Science) Prentice Hall PTR; 1st edition
(November 10, 1997), 416 p.
[17] Clarke, K. C., 1986. Advances in Geographic
Information Systems, Computers, Environment and
Urban Systems, Vol. 10, pp. 175-184.
[18] Coppock, J. T., and D. W. Rhind, (1991). The
history of GIS. Geographical Information Systems:
principles and applications. Ed. David J. Maguire,
Michael F. Goodchild and David W. Rhind. Essex:
Longman Scientific & Technical, 1991. 1: 21-43."The
history of GIS.".
http://scholar.google.com/scholar?cluster=138208276
34229141183&hl=en&as_sdt=10000000000000.
Retrieved 2010-09-17.
[19] Cowen 1988 "GIS VERSUS CAD VERSUS
DBMS: WHAT ARE THE DIFFERENCES ?"
PHOTOGRAMMETRIC ENGINEERING &
REMOTE SENSING Vol. 54, No.11, November
1988, pp. 1551-1555.
http://funk.on.br/esantos/doutorado/GEO/igce/DBMS.
pdf last retrieved 9/17/2010.
[20] Gao, Shan. Paynter, John. & David Sundaram,
(2004) "Flexible Support for Spatial Decision-
Making" Proc. of the 37th Hawaii International
Conference on System Sciences 5-8 pp. 10
[21] Geospatial Analysis - a comprehensive guide. 2nd
edition © 2006-2008 de Smith, Goodchild, Longley
[22] Chang, K. T. (1989). "A comparison of techniques
for calculating gradient and aspect from a gridded
digital elevation model". Bulleted list item
International Journal of Geographical Information
Science 3 (4): 323–334.
[23] Jones, K.H. (1998). "A comparison of algorithms
used to compute hill slope as a property of the DEM".
Computers and Geosciences 24 (4): 315–323.
doi:10.1016/S0098-3004(98)00032-6.
[24] Hunter G. J. and Goodchild M. F. (1997).
"Modeling the uncertainty of slope and aspect
estimates derived from spatial databases".
Geographical Analysis 29 (1): 35–49.
doi:10.1111/j.1538-4632.1997.tb00944.x.
http://www.geog.ucsb.edu/~good/papers/261.pdf
[25] Kent, A.J. 2005. "Aesthetics: A Lost Cause in
Cartographic Theory?" The Cartographic Journal
42(2) pp. 182–188
[26] Slocum, T. (2003). Thematic Cartography and
Geographic Visualization. Upper Saddle River, New
Jersey: Prentice Hall. ISBN 0-130-35123-7.
[27] Kraak, Menno-Jan and Ormeling, Ferjan (2002).
Cartography: Visualization of Spatial Data. Prentice
Hall. ISBN 0-130-88890-7.
[28] MacEachren, A.M. (1994). Some Truth with Maps:
A Primer on Symbolization & Design. University
Park: The Pennsylvania State University.
[29] Bender, B. (1999). Subverting the Western Gaze:
mapping alternative worlds. The Archaeology and
Anthropology of Landscape: Shaping your
landscape (eds) P.J. Ucko & R. Layton. London:
Routledge.
[30] Monmonier, Mark (1993). Mapping It Out.
Chicago: University of Chicago Press. ISBN.
[31] ESRI. 2004. ESRI Cartography: Capabilities and
Trends. Redlands, CA. White Paper
[32] Jeer, S. 1997. Traditional Color Coding for Land
Uses. American Planning Association. pp. 4–5
[33] Imus, D. and Dunlavey, P. 2002. Back to the
Drawing Board: Cartography vs the Digital
Workflow. MT. Hood, Oregon.
[34] Olson, Judy M. 1975. Experience and the
improvement of cartographic communication.
Cartographic Journal 12, no. 2:94-108
[35] Peterson, Michael P. (1995). Interactive and
Animated Cartography. Upper Saddle River, New
Jersey: Prentice Hall. ISBN 978-0130791047.
[36] Esri - Company's history
[37] "GIS software training from Esri in India". NIIT
Technology News.
http://www.prdomain.com/companies/N/NIIT/newsrel
eases/20055521656.htm. Retrieved 2008-04-03.
[38] "COTS GIS: The Value of a Commercial
Geographic Information System". www.esri.com.
http://www.esri.com/library/whitepapers/pdfs/cots-
gis.pdf. Retrieved 2010-01-30.
[39] "GIS Software Applications". gislounge.com.
http://gislounge.com/gis-software-applications/.
Retrieved 2010-01-30.
[40] "GIS in Our World". Esri Website: Company Facts.
http://www.esri.com/company/about/facts.html.
Retrieved 2008-04-03.
[41] Matteo Luccio (2007-06-22). "Esri International
User Conference". GIS Monitor Newsletter. GIS
Monitor.
http://www.gismonitor.com/news/newsletter/archive/a
rchives.php?issue=20070622. Retrieved 2008-01-09.
[42] http://apb.directionsmag.com/archives/7575-Esri-
Transitioning-Pronunciation-of-its-Name.html
ADVANCES in VISUALIZATION, IMAGING and SIMULATION
ISSN: 1792-6130 152 ISBN: 978-960-474-246-2

[43] Guy McCarthy; George Watson (2006-06-30).
"Esri verifies company targeted by subpoena". The
San Bernardino Sun.
http://www.sbsun.com/onlineextras/ci_3996395.
Retrieved May 25, 2009.
[44]
http://en.wikipedia.org/wiki/Geographic_information_sy
stem
[45] http://www.webopedia.com/TERM/G/GIS.html
[46]
http://www.gisdevelopment.net/tutorials/tuman006pf.ht
m
[47] http://searchsqlserver.techtarget.com/definition/GIS
[48]
http://www.agt.bme.hu/public_e/funcint/funcint.html
[49]
http://www.ika.ethz.ch/schneider/Publications/Schneide
rOttawa99.pdf
[50] http://gisandscience.com/2009/09/14/top-five-
benefits-of-gis/
[51] http://maic.jmu.edu/sic/gis/components.htm
[52] http://www.sfu.ca/rdl/GIS/tour/comp_gis.html
[53] http://www.mapsofworld.com/gis/components.html
[54] http://gis.nic.in/gisprimer/functions.html
[55]
http://maps.unomaha.edu/Peterson/gis/notes/GISAnal2.
html
[56] http://healthcybermap.org/HGeo/pg2_3.htm
[57]
http://mapzone.ordnancesurvey.co.uk/mapzone/giszone/
english/gisfocus/page3.htm
[58]
http://ittraining.iu.edu/workshops/schedule_by_group.as
px?group=15
[59] http://www-
sul.stanford.edu/depts/gis/project_design.html
http://www.gis.com/content/data-types-and-models
[60] http://www.gis.com/content/gis-data
[61] http://bgis.sanbi.org/gis-primer/page_14.htm
[62] http://en.mimi.hu/gis/data_model.html
[63] http://en.wikipedia.org/wiki/Data_model_(GIS)
[64] http://bgis.sanbi.org/gis-primer/page_13.htm
[65] http://www.gis.com/content/data-types-and-models
[66] http://bgis.sanbi.org/GIS-primer/page_15.htm
[67]
http://www.spatialanalysisonline.com/output/html/Spati
alDataModelsandMethods.html
[68]
http://www.ncgia.ucsb.edu/giscc/units/u045/u045.html
[69] http://www-groups.dcs.st-
and.ac.uk/~history/HistTopics/Topology_in_mathematic
s.html
[70]
https://engineering.purdue.edu/~engelb/ncgia96/engel.ht
ml
[71] http://www.dcsme.ae/
[72] http://www.dcsa.com.au/09apr/index.php
[73] http://www.datacapture.co.uk/
[74] http://en.wikipedia.org/wiki/Operational_data_store
[75] http://www.vdstech.com/aspmap.htm
[76]
http://www.freedownloadscenter.com/Programming/Act
iveX/AspMap.html
[77] http://www.opengeospatial.org/ogc/members
[78]
http://www.cdrgroup.co.uk/index.htm?sales_mi_prod
_planaccess.htm
[79] http://www.fgdc.gov/standards/projects/FGDC-
standards-projects/accuracy/part3/chapter3.
[80] https://njgin.state.nj.us/NJ_NJGINExplorer/IW.jsp.
[81] http://nationalmap.gov/gio/standards.
[82] http://gis.ednet.ns.ca/gis_uses_in_US.htm
Appendix “A”
The Code of Zoom to a Station
protected void
statesList_SelectedIndexChanged(object sender,
System.EventArgs e)
{
AspMap.Recordset state;
int selectedValue = Convert.ToInt32(
statesList.SelectedValue);
state =
Map1["Stations"].SearchExpression("ID = " +
selectedValue );
if (!state.EOF)
{
Map1.Extent = state.RecordExtent;
sqlselect = "SELECT Train_Dates.*
FROM Station INNER JOIN Train_Dates ON
Station.Name = Train_Dates.Station_Name
WHERE (((Station.ID)=" +
statesList.SelectedValue + "));";
oledbConnectString =
"PROVIDER=Microsoft.Jet.OLEDB.4.0;DATA
Source=" + MapPath("Layers/GIS2.mdb");
da = new OleDbDataAdapter(sqlselect,
oledbConnectString);
DataTable TrainDates = new DataTable();
da.Fill(TrainDates);
GridView1.DataSource = TrainDates;
GridView1.DataBind();
da.Dispose();
// highlight the state using yellow color
Map1["Stations"].Renderer.Field = "ID";
AspMap.Feature selectedState =
Map1["Stations"].Renderer.Add();
selectedState.Value = selectedValue;
selectedState.Symbol.FillColor =
Color.Green;
selectedState.Symbol.Size = 15;
selectedState.Symbol.LineColor =
Color.Black;
ADVANCES in VISUALIZATION, IMAGING and SIMULATION
ISSN: 1792-6130 153 ISBN: 978-960-474-246-2

} }
Fig.1: Paper map shows stations and base lines between them.
Fig. 2: Localization of Stations on the map.
ADVANCES in VISUALIZATION, IMAGING and SIMULATION
ISSN: 1792-6130 154 ISBN: 978-960-474-246-2

Fig. 3: Railway lines between stations.
Fig. 4: Final digitized map.
ADVANCES in VISUALIZATION, IMAGING and SIMULATION
ISSN: 1792-6130 155 ISBN: 978-960-474-246-2
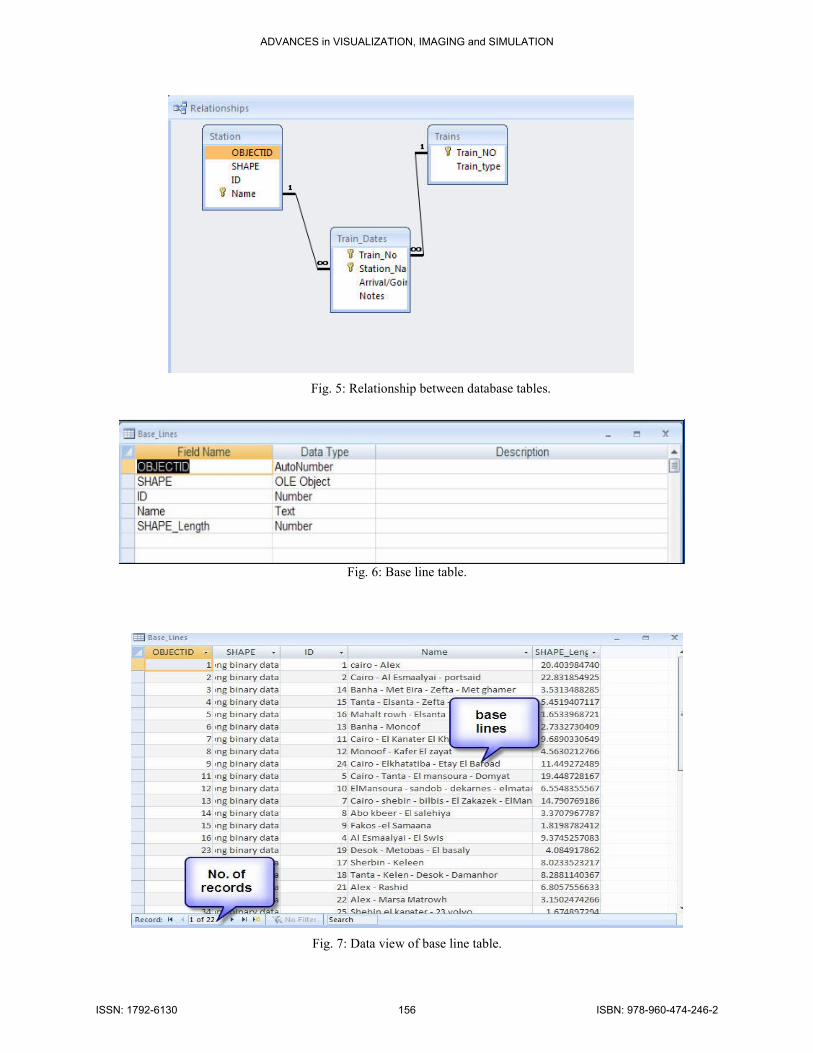
Fig. 5: Relationship between database tables.
Fig. 6: Base line table.
Fig. 7: Data view of base line table.
ADVANCES in VISUALIZATION, IMAGING and SIMULATION
ISSN: 1792-6130 156 ISBN: 978-960-474-246-2

Fig. 8: Design view of trains table.
Fig.9: Data view of trains table.
Fig. 10: Design view of train_dates table.
ADVANCES in VISUALIZATION, IMAGING and SIMULATION
ISSN: 1792-6130 157 ISBN: 978-960-474-246-2

Fig. 11: Data view of train_dates table.
Fig. 12: Zoom in to a station.
ADVANCES in VISUALIZATION, IMAGING and SIMULATION
ISSN: 1792-6130 158 ISBN: 978-960-474-246-2

Fig. 13: Illustartion of zoom in property.
Fig. 14: The result of zoom in.
ADVANCES in VISUALIZATION, IMAGING and SIMULATION
ISSN: 1792-6130 159 ISBN: 978-960-474-246-2

Fig. 15: Zoom in Tool.
Fig. 16: The essential map.
ADVANCES in VISUALIZATION, IMAGING and SIMULATION
ISSN: 1792-6130 160 ISBN: 978-960-474-246-2

Fig. 17: The result of zoom out.
Fig. 18: The result of Info window tool at “Algmalya” station.
ADVANCES in VISUALIZATION, IMAGING and SIMULATION
ISSN: 1792-6130 161 ISBN: 978-960-474-246-2
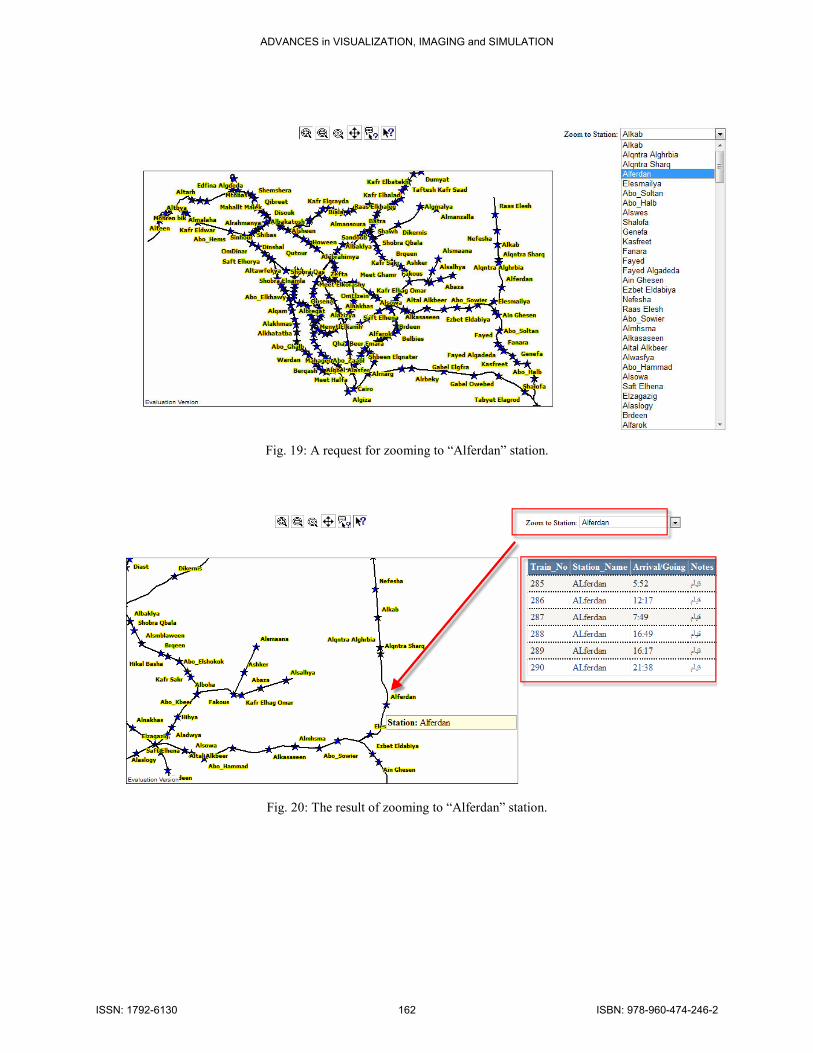
Fig. 19: A request for zooming to “Alferdan” station.
Fig. 20: The result of zooming to “Alferdan” station.
ADVANCES in VISUALIZATION, IMAGING and SIMULATION
ISSN: 1792-6130 162 ISBN: 978-960-474-246-2

Fig. 21: Hot Spot at “Alsabria” station.
ADVANCES in VISUALIZATION, IMAGING and SIMULATION
ISSN: 1792-6130 163 ISBN: 978-960-474-246-2