Embed Size (px)
Citation preview
International Journal of Trend in Scientific Research and Development (IJTSRD)
Volume 5 Issue 3, March-April 2021 Available Online: www.ijtsrd.com e-ISSN: 2456 – 6470
@ IJTSRD | Unique Paper ID – IJTSRD39871 | Volume – 5 | Issue – 3 | March-April 2021 Page 493
Geographical Analysis of Covid 19:
Its Relationship with Socio-Economic Conditions in India
Gyanendra Singh Chauhan
Department of Geography, Aligarh Muslim University, Aligarh, Uttar Pradesh, India
ABSTRACT
The present paper aims to analyse the spatial variations in spread of corona
cases and corona deaths and level of socio-economic conditions in India. The
causal relationship between corona cases and corona deaths and twenty
selected socio-economic variables has been taken into account. The
state/union territory has been taken as the smallest unit of study. The entire
research work is based on secondary sources of data. The study reveals states
with better socio-economic conditions recorded higher corona cases and
states with poor socio-economic conditions recorded lesser corona cases.
States such as Maharashtra, Kerala, Andhra Pradesh, Tamil Nadu and
Karnataka with better socio-economic conditions recorded a greater number
of corona deaths.
KEYWORDS: Corona Cases, Corona Deaths, Socio-Economic Conditions
How to cite this paper: Gyanendra Singh
Chauhan "Geographical Analysis of Covid
19: Its Relationship with Socio-Economic
Conditions in India"
Published in
International Journal
of Trend in Scientific
Research and
Development (ijtsrd),
ISSN: 2456-6470,
Volume-5 | Issue-3,
April 2021, pp.493-505, URL:
www.ijtsrd.com/papers/ijtsrd39871.pdf
Copyright © 2021 by author(s) and
International Journal of Trend in Scientific
Research and Development Journal. This
is an Open Access article distributed
under the terms of
the Creative
Commons Attribution
License (CC BY 4.0) (http://creativecommons.org/licenses/by/4.0)
INTRODUCTION
An outbreak of a novel coronavirus, severe acute respiratory
syndrome coronavirus 2 (SARS- CoV-2), emerged in late
December 2019 in Wuhan City, Hubei Province in China and
caused a typical pneumonia called coronavirus disease 2019
(COVID-19). The disease is characterized by fever, cough,
fatigue, and ground-glass opacity on chest tomography etc.
SARS-CoV-2 had swept the entire of China, including Hong
Kong, Macao, and Taiwan, in only 1 month. It has spread
across the entire world and affected people of all ages. WHO
issued a public health emergency of international concern on
30 January 2020 and declared COVID-19 as a pandemic on
11 March 2020.
CoVs are enveloped, positive-stranded RNA viruses
possessing a comparatively large genome approaching 30 kb
and comprising four structural proteins, namely, spike (S),
nucleocapsid (N) envelope (E), and membrane (M).
There are four known genera for coronaviruses, namely:
alpha-, beta-, gamma-, and delta- coronavirus. All of the four
genera are believed to have a zoonotic origin and infect both
animals and humans. Whereas the alpha and beta genera
originate from bats, the gamma and delta genera are derived
from avian and pig gene pools.
Coronaviruses belong to the family of Coronaviridae. Bats
have been recognized as natural reservoir and vectors of a
variety of coronaviruses and the viruses have crossed
species barriers to infect humans and many other different
kinds of animals, including avians, rodents, and chiropters.
Coronavirus may cause respiratory and neurological
diseases.
Coronaviruses are important pathogens for human and
vertebrates. They can infect respiratory, gastrointestinal,
hepatic, and central nervous system of human, livestock,
birds, bat, mouse, and many other wild animals. The
outbreaks of the severe acute respiratory syndrome (SARS)
in 2002-2003 and the Middle East respiratory syndrome
(MERS) in 2012 have demonstrated the possibility of
animal-to-human and human-to-human transmission of
newly emerging coronaviruses. The sporadic emergence and
outbreaks of new types of coronaviruses remind us that
coronaviruses are a severe global health threat. It is highly
likely that new coronaviruses outbreaks are unavoidable in
the future due to changes of the climate and ecology, and the
increased interactions of human with animals. Most people
who develop COVID-19 start noticing symptoms within 2 to
14 days after being exposed to the novel coronavirus known
as SARS-CoV-2.
The outbreak of COVID-19 originated from the four admitted
patients with pneumonia who had been working in Wuhan
Huanan seafood wholesale market, doing business in live
poultry, aquatic products, and some wild animals. Wuhan
city is a major transportation hub with a population of more
than 11 million people. Most of the patients visited the fish
and wild animal market in Wuhan. This fish and wild animal
market also sold live animals such as poultry, bats, marmots,
and snakes. The WHO report claimed that the SARS-CoV-2
could be detected in the environmental samples collected
from the seafood market. The current evidence strongly
supports that the SARS-CoV-2 was derived from bats. All
three epidemics (SARS, MERS, COVID-19) caused by these
IJTSRD39871
International Journal of Trend in Scientific Research and Development (IJTSRD) @ www.ijtsrd.com eISSN: 2456-6470
@ IJTSRD | Unique Paper ID – IJTSRD39871 | Volume – 5 | Issue – 3 | March-April 2021 Page 494
three coronaviruses are linked to wild animal markets. SARS
and MERS are defined as zoonotic disease, and transmitted
by intermediated hosts (palm civets and dromedary camels
respectively). Studies have shown that pangolins and snakes
at wild animal markets were likely to be intermediate hosts
of SARS-CoV-2. Human-to-human transmission was
considered as a major transmission mode.
SARS-CoV-2, the virus that causes COVID-19, has had a major
impact on human health globally; infecting a large number of
people; causing severe disease and associated long-term
health sequelae; resulting in death and excess mortality,
especially among older and vulnerable populations;
interrupting routine healthcare services; disruptions to
travel, trade, education and many other societal functions;
and more broadly having a negative impact on peoples
physical and mental health. Since the start of the COVID-19
pandemic, WHO has received several reports of unusual
public health events possibly due to variants of SARS-CoV-2.
WHO routinely assesses if variants of SARS-CoV-2 result in
changes in transmissibility, clinical presentation and
severity, or if they impact on countermeasures, including
diagnostics, therapeutics and vaccines. Previous reports of
the D614G mutation and the recent reports of virus variants
from the Kingdom of Denmark, the United Kingdom of Great
Britain and Northern Ireland, and the Republic of South
Africa have raised interest and concern in the impact of viral
changes.
OBJECTIVES OF THE STUDY
The present study has been undertaken with the following
objectives:
1. To find out the spatial variations of the spread of corona
cases, corona deaths and level of socio-economic
conditions.
2. To examine the relationship between corona cases,
corona deaths (dependent variables) and selected socio-
economic variables (independent variables).
STUDY AREA
India as a whole has been chosen as study area for the
present research work and the boundary of a State/UT has
been considered as the smallest unit of study. With reference
to the Census year 2011, India comprises of 28 States and 7
Union Territories. It lies entirely in the Northern
Hemisphere. The mainland extends between 8°4'N and
37°6'N latitudes, and 68°7'E and 97°25'E longitudes. The
land mass of India has an area of 3.28 million square km.
India’s total area accounts for about 2.4 per cent of the total
geographical area of the world. It is bounded by the
Himalayas in the north and Indian ocean in the south,
surrounded by Pakistan and Afghanistan in the north-west,
China, Bhutan, and Nepal in the north, Bangladesh and
Myanmar in the east. The north-south extension of the
country is 3,214 kilometres and east-west extension is 2,933
kilometres, the total land frontier is 15,200 kilometres and
the total length of the coastline of the mainland, including
Andaman and Nicobar and Lakshadweep, is 7,516.6 km.
India is the second most populous country in the world.
According to Census of India, 2011, the total population of
India is 1,210.2 million (17.5 percent of world’s population)
of which 68.84 percent is rural and remaining 31.16 percent
is classified as urban. The general density of population is
382 persons per square kilometre. The overall sex ratio is
940. The literacy rate is 74.04 percent. The percentage of
literacy in rural and urban population is 68.91 percent and
84.98 percent respectively.
The first case in India was detected in Thrissur district of
Kerala on 30th January 2020. The patient was a student from
Wuhan University, China. As per the medical guidelines, the
patient was kept in isolation until his complete recovery as
per the Ministry of Health and Family Welfare. The cases
have been rising and have crossed the one crore mark (as on
15th January, 2021).
International Journal of Trend in Scientific Research and Development (IJTSRD) @ www.ijtsrd.com eISSN: 2456-6470
@ IJTSRD | Unique Paper ID – IJTSRD39871 | Volume – 5 | Issue – 3 | March-April 2021 Page 495
Source: Census of India, 2011
International Journal of Trend in Scientific Research and Development (IJTSRD) @ www.ijtsrd.com eISSN: 2456-6470
@ IJTSRD | Unique Paper ID – IJTSRD39871 | Volume – 5 | Issue – 3 | March-April 2021 Page 496
DATABASE AND METHODOLOGY
The present research work is entirely based on secondary sources of data collected from Census of India, 2011, Ministry of
Health and Family Welfare, Center for Disease Dynamics, Economics & Policy, Journal of Medical Virology and World Health
Organization. The data of number of corona cases, and corona deaths is taken only up to 15th January, 2021. In the present
analysis, a set of twenty socio-economic indicators have been taken into account to analyse the geographical variations in the
level of socio-economic conditions in India. The relation of socio-economic indicators with total corona cases and total corona
deaths has been established with the calculation of z-scores and composite z-scores. Maps have been prepared using ArcGIS
10.7.
Table 1: India: List of variables of Socio-Economic Development
List Definition of variables
X1 Number of Covid testing labs/total population of state
X2 Total testing conducted/total population of state
X3 Number of hospital beds/total population of state
X4 Number of hospitals/total population of state
X5 Number of ICU beds/total population of state
X6 Number of ventilators/total population of state
X7 Per Capita Income
X8 Total literacyrate
X9 Male literacyrate
X10 Female literacyrate
X11 Rural literacyrate
X12 Urban literacyrate
X13 Population density
X14 Percentage of total populationof state to total population of India
X15 Percentage of total male population to total populationof state
X16 Percentage of total female populationto total populationof state
X17 Percentage of urban populationtototal populationof state
X18 Percentage of rural populationto total populationof state
X19 Percentage of elderly populationto total populationof state
X20 Length of roads/sq. km of state
In the first step, the raw data for each variable which determines the areal variations of levels of socio-economic development
have been computed into standard score. It is generally known as Z-value or Z-score. The score quantifies the departure of
individual observations, expressed in a comparable form. This means it becomes a linear transformation of the original data
(Smith, 1973: 85). It may be expressed as:
Zij = (Xij − X� i)/σ
Where,
Zij = Standardized value of the variable i in state j. Xij = Actual value of variable i in state j. X� i = Mean value of variable i in all states.
σi= Standard deviation of variable i all states.
In the second step, the z-scores of all variables have been added statewise and the average has been taken out for these
variables which may be called as Composite Score (CS) for each state and may be algebraically expressed as:
CS = Σ Zij/N
Where,
CS = Composite Score
N = Number of variables
ΣZij = Z-scores of all variables i in state j.
The positive values relating to the states’s z-score explain high level of socio-economic development and negative values
indicate the low level of socio-economic development in the study area.
International Journal of Trend in Scientific Research and Development (IJTSRD) @ www.ijtsrd.com eISSN: 2456-6470
@ IJTSRD | Unique Paper ID – IJTSRD39871 | Volume – 5 | Issue – 3 | March-April 2021 Page 497
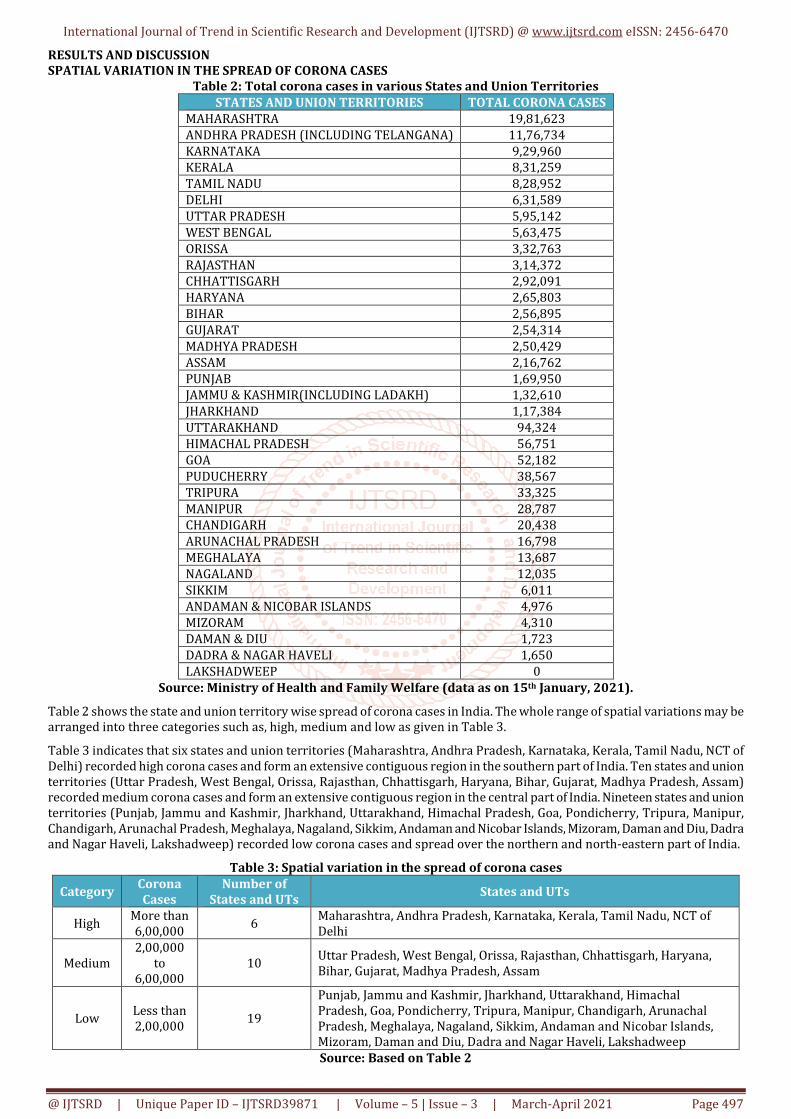
RESULTS AND DISCUSSION
SPATIAL VARIATION IN THE SPREAD OF CORONA CASES
Table 2: Total corona cases in various States and Union Territories
STATES AND UNION TERRITORIES TOTAL CORONA CASES
MAHARASHTRA 19,81,623
ANDHRA PRADESH (INCLUDING TELANGANA) 11,76,734
KARNATAKA 9,29,960
KERALA 8,31,259
TAMIL NADU 8,28,952
DELHI 6,31,589
UTTAR PRADESH 5,95,142
WEST BENGAL 5,63,475
ORISSA 3,32,763
RAJASTHAN 3,14,372
CHHATTISGARH 2,92,091
HARYANA 2,65,803
BIHAR 2,56,895
GUJARAT 2,54,314
MADHYA PRADESH 2,50,429
ASSAM 2,16,762
PUNJAB 1,69,950
JAMMU & KASHMIR(INCLUDING LADAKH) 1,32,610
JHARKHAND 1,17,384
UTTARAKHAND 94,324
HIMACHAL PRADESH 56,751
GOA 52,182
PUDUCHERRY 38,567
TRIPURA 33,325
MANIPUR 28,787
CHANDIGARH 20,438
ARUNACHAL PRADESH 16,798
MEGHALAYA 13,687
NAGALAND 12,035
SIKKIM 6,011
ANDAMAN & NICOBAR ISLANDS 4,976
MIZORAM 4,310
DAMAN & DIU 1,723
DADRA & NAGAR HAVELI 1,650
LAKSHADWEEP 0
Source: Ministry of Health and Family Welfare (data as on 15th January, 2021).
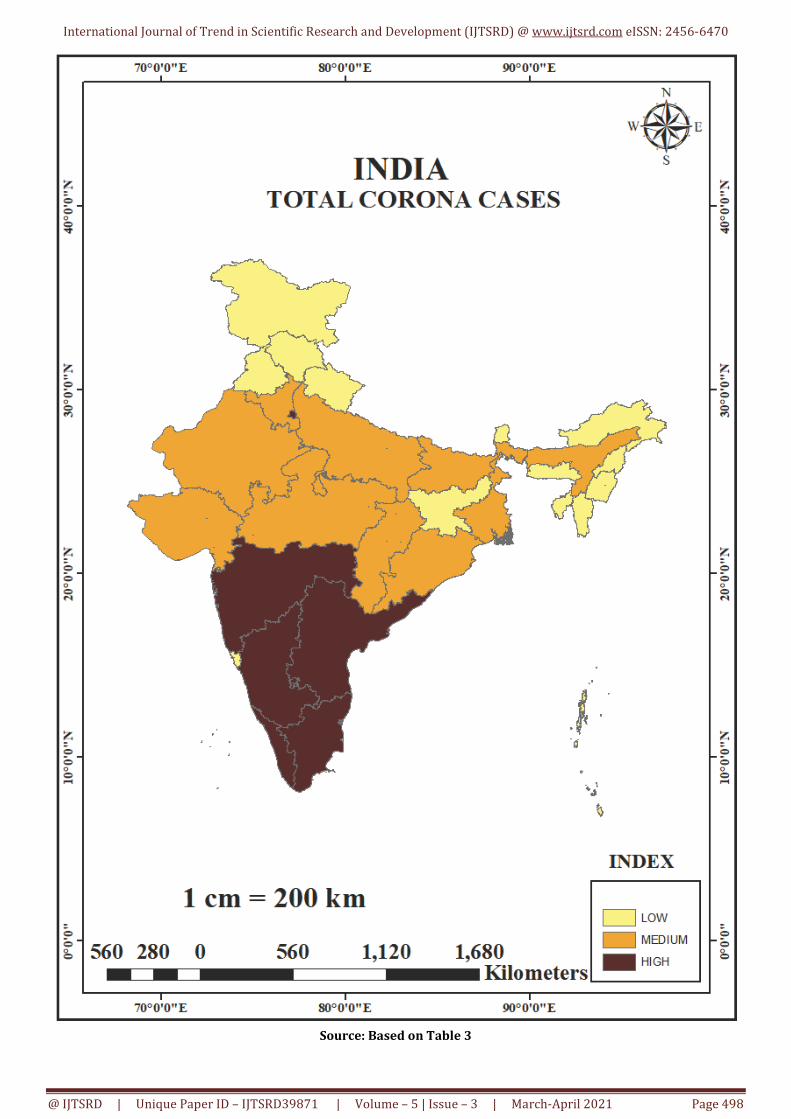
Table 2 shows the state and union territory wise spread of corona cases in India. The whole range of spatial variations may be
arranged into three categories such as, high, medium and low as given in Table 3.
Table 3 indicates that six states and union territories (Maharashtra, Andhra Pradesh, Karnataka, Kerala, Tamil Nadu, NCT of
Delhi) recorded high corona cases and form an extensive contiguous region in the southern part of India. Ten states and union
territories (Uttar Pradesh, West Bengal, Orissa, Rajasthan, Chhattisgarh, Haryana, Bihar, Gujarat, Madhya Pradesh, Assam)
recorded medium corona cases and form an extensive contiguous region in the central part of India. Nineteen states and union
territories (Punjab, Jammu and Kashmir, Jharkhand, Uttarakhand, Himachal Pradesh, Goa, Pondicherry, Tripura, Manipur,
Chandigarh, Arunachal Pradesh, Meghalaya, Nagaland, Sikkim, Andaman and Nicobar Islands, Mizoram, Daman and Diu, Dadra
and Nagar Haveli, Lakshadweep) recorded low corona cases and spread over the northern and north-eastern part of India.
Table 3: Spatial variation in the spread of corona cases
Category Corona
Cases
Number of
States and UTs States and UTs
High More than
6,00,000 6
Maharashtra, Andhra Pradesh, Karnataka, Kerala, Tamil Nadu, NCT of
Delhi
Medium
2,00,000
to
6,00,000
10 Uttar Pradesh, West Bengal, Orissa, Rajasthan, Chhattisgarh, Haryana,
Bihar, Gujarat, Madhya Pradesh, Assam
Low Less than
2,00,000 19
Punjab, Jammu and Kashmir, Jharkhand, Uttarakhand, Himachal
Pradesh, Goa, Pondicherry, Tripura, Manipur, Chandigarh, Arunachal
Pradesh, Meghalaya, Nagaland, Sikkim, Andaman and Nicobar Islands,
Mizoram, Daman and Diu, Dadra and Nagar Haveli, Lakshadweep
Source: Based on Table 2
International Journal of Trend in Scientific Research and Development (IJTSRD) @ www.ijtsrd.com eISSN: 2456-6470
@ IJTSRD | Unique Paper ID – IJTSRD39871 | Volume – 5 | Issue – 3 | March-April 2021 Page 498
Source: Based on Table 3
International Journal of Trend in Scientific Research and Development (IJTSRD) @ www.ijtsrd.com eISSN: 2456-6470
@ IJTSRD | Unique Paper ID – IJTSRD39871 | Volume – 5 | Issue – 3 | March-April 2021 Page 499
SPATIAL VARIATION IN THE SPREAD OF CORONA DEATHS
Table 4: Total corona deaths in various States and Union Territories
STATES AND UNION TERRITORIES TOTAL CORONA DEATHS
MAHARASHTRA 50,291
TAMIL NADU 12,246
KARNATAKA 12,155
DELHI 10,722
WEST BENGAL 10,010
ANDHRA PRADESH (INCLUDING TELANGANA) 8,712
UTTAR PRADESH 8,543
PUNJAB 5,473
GUJARAT 4,357
MADHYA PRADESH 3,740
CHHATTISGARH 3,537
KERALA 3,392
HARYANA 2,972
RAJASTHAN 2,744
JAMMU & KASHMIR(INCLUDING LADAKH) 2,043
ORISSA 1,896
UTTARAKHAND 1,596
BIHAR 1,447
ASSAM 1,065
JHARKHAND 1,048
HIMACHAL PRADESH 963
GOA 752
PUDUCHERRY 640
TRIPURA 390
MANIPUR 365
CHANDIGARH 330
MEGHALAYA 144
SIKKIM 130
NAGALAND 86
ANDAMAN & NICOBAR ISLANDS 62
ARUNACHAL PRADESH 56
MIZORAM 9
DAMAN & DIU 1
DADRA & NAGAR HAVELI 1
LAKSHADWEEP 0
Source: Ministry of Health and Family Welfare (data as on 15th January, 2021).
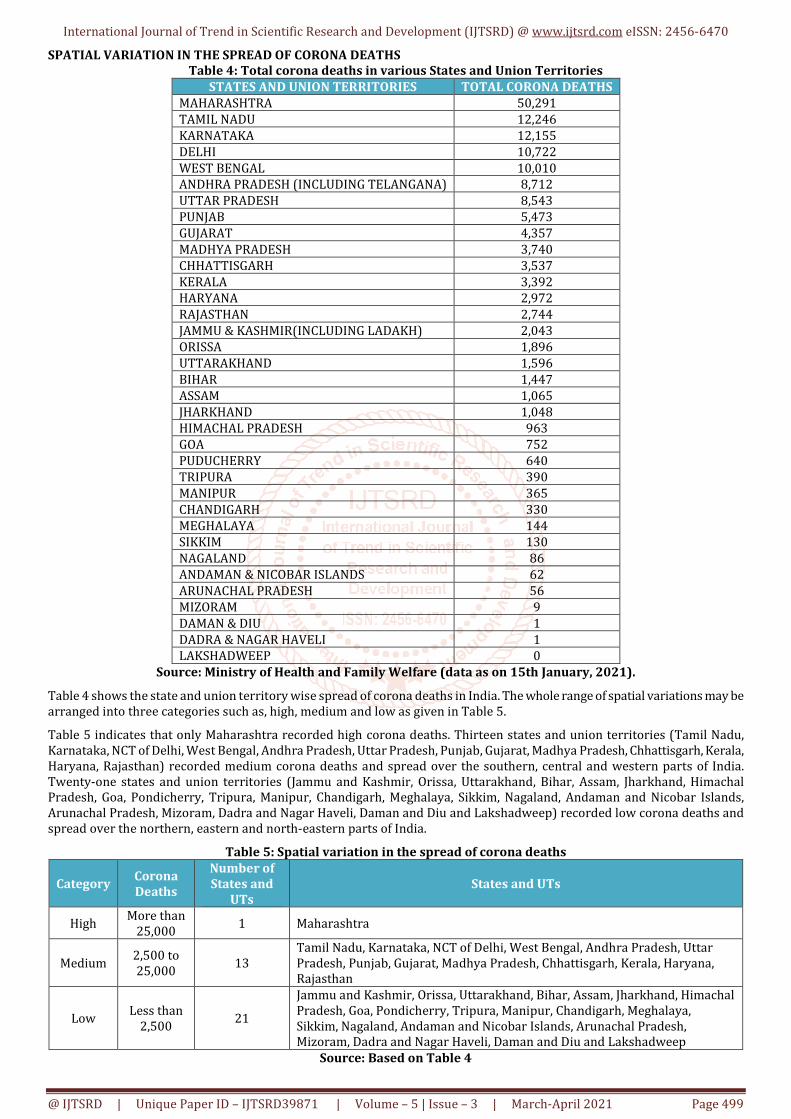
Table 4 shows the state and union territory wise spread of corona deaths in India. The whole range of spatial variations may be
arranged into three categories such as, high, medium and low as given in Table 5.
Table 5 indicates that only Maharashtra recorded high corona deaths. Thirteen states and union territories (Tamil Nadu,
Karnataka, NCT of Delhi, West Bengal, Andhra Pradesh, Uttar Pradesh, Punjab, Gujarat, Madhya Pradesh, Chhattisgarh, Kerala,
Haryana, Rajasthan) recorded medium corona deaths and spread over the southern, central and western parts of India.
Twenty-one states and union territories (Jammu and Kashmir, Orissa, Uttarakhand, Bihar, Assam, Jharkhand, Himachal
Pradesh, Goa, Pondicherry, Tripura, Manipur, Chandigarh, Meghalaya, Sikkim, Nagaland, Andaman and Nicobar Islands,
Arunachal Pradesh, Mizoram, Dadra and Nagar Haveli, Daman and Diu and Lakshadweep) recorded low corona deaths and
spread over the northern, eastern and north-eastern parts of India.
Table 5: Spatial variation in the spread of corona deaths
Category Corona
Deaths
Number of
States and
UTs
States and UTs
High More than
25,000 1 Maharashtra
Medium 2,500 to
25,000 13
Tamil Nadu, Karnataka, NCT of Delhi, West Bengal, Andhra Pradesh, Uttar
Pradesh, Punjab, Gujarat, Madhya Pradesh, Chhattisgarh, Kerala, Haryana,
Rajasthan
Low Less than
2,500 21
Jammu and Kashmir, Orissa, Uttarakhand, Bihar, Assam, Jharkhand, Himachal
Pradesh, Goa, Pondicherry, Tripura, Manipur, Chandigarh, Meghalaya,
Sikkim, Nagaland, Andaman and Nicobar Islands, Arunachal Pradesh,
Mizoram, Dadra and Nagar Haveli, Daman and Diu and Lakshadweep
Source: Based on Table 4
International Journal of Trend in Scientific Research and Development (IJTSRD) @ www.ijtsrd.com eISSN: 2456-6470
@ IJTSRD | Unique Paper ID – IJTSRD39871 | Volume – 5 | Issue – 3 | March-April 2021 Page 500
Source: Based on Table 5
International Journal of Trend in Scientific Research and Development (IJTSRD) @ www.ijtsrd.com eISSN: 2456-6470
@ IJTSRD | Unique Paper ID – IJTSRD39871 | Volume – 5 | Issue – 3 | March-April 2021 Page 501
GEOGRAPHICAL VARIATIONS IN THE LEVEL OF SOCIO-ECONOMIC CONDITIONS
Table 6: Composite Z-Score of various socio-economic indicators in various States and Union Territories
STATES AND UTS COMPOSITE Z-SCORE
ANDAMAN AND NICOBAR ISLANDS -0.18
ANDHRA PRADESH (INCLUDING TELANGANA) 0.40
ARUNACHAL PRADESH -0.79
ASSAM -0.21
BIHAR -0.20
CHANDIGARH 0.01
CHHATTISGARH -0.43
DADRA AND NAGAR HAVELI -0.53
DAMAN AND DIU -0.17
GOA 0.12
GUJARAT 0.17
HARYANA -0.14
HIMACHAL PRADESH -0.03
JAMMU AND KASHMIR (INCLUDING LADAKH) -0.65
JHARKHAND -0.49
KARNATAKA 0.72
KERALA 0.80
LAKSHADWEEP 0.11
MADHYA PRADESH -0.07
MAHARASHTRA 1.12
MANIPUR -0.41
MEGHALAYA -0.53
MIZORAM -0.03
NAGALAND -0.41
NCT OF DELHI 0.34
ORISSA -0.09
PONDICHERRY -0.02
PUNJAB -0.07
RAJASTHAN -0.11
SIKKIM -0.23
TAMIL NADU 0.67
TRIPURA -0.08
UTTAR PRADESH 1.19
UTTARAKHAND -0.16
WEST BENGAL 0.34
Source: Computed from data obtained from Census of India, Center for Disease Dynamics, Economics & Policy and
Ministry of Health and Family Welfare
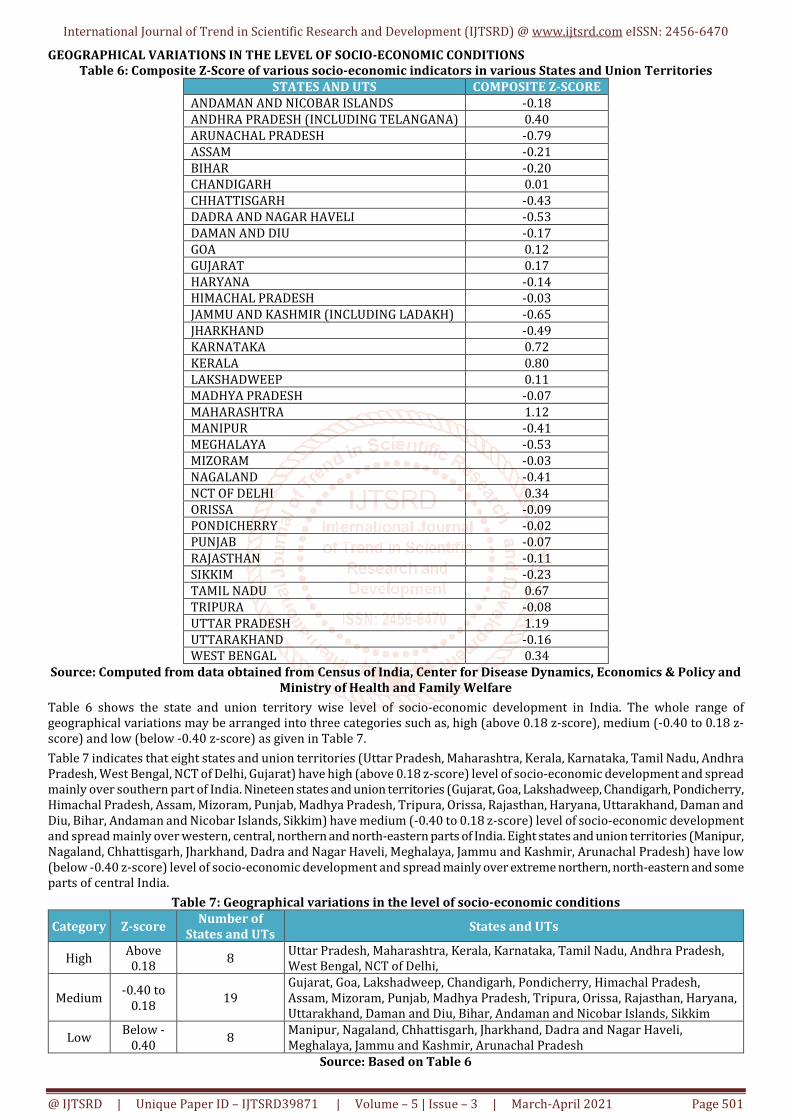
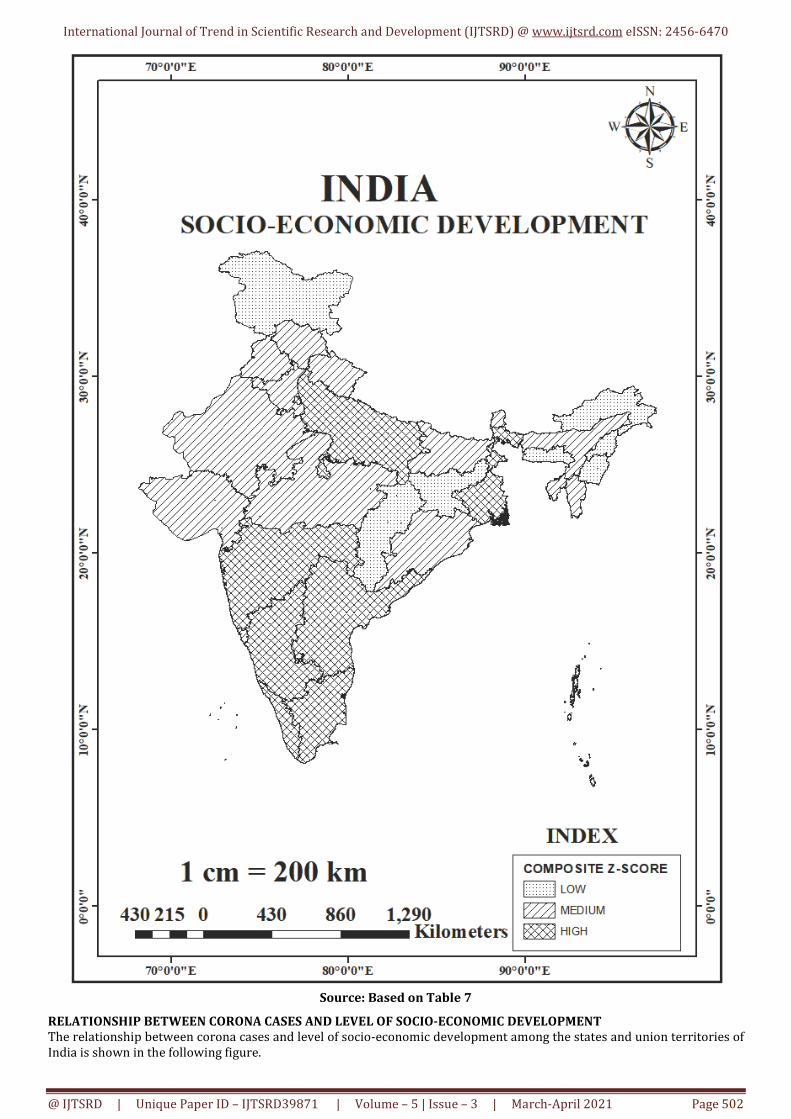
Table 6 shows the state and union territory wise level of socio-economic development in India. The whole range of
geographical variations may be arranged into three categories such as, high (above 0.18 z-score), medium (-0.40 to 0.18 z-
score) and low (below -0.40 z-score) as given in Table 7.
Table 7 indicates that eight states and union territories (Uttar Pradesh, Maharashtra, Kerala, Karnataka, Tamil Nadu, Andhra
Pradesh, West Bengal, NCT of Delhi, Gujarat) have high (above 0.18 z-score) level of socio-economic development and spread
mainly over southern part of India. Nineteen states and union territories (Gujarat, Goa, Lakshadweep, Chandigarh, Pondicherry,
Himachal Pradesh, Assam, Mizoram, Punjab, Madhya Pradesh, Tripura, Orissa, Rajasthan, Haryana, Uttarakhand, Daman and
Diu, Bihar, Andaman and Nicobar Islands, Sikkim) have medium (-0.40 to 0.18 z-score) level of socio-economic development
and spread mainly over western, central, northern and north-eastern parts of India. Eight states and union territories (Manipur,
Nagaland, Chhattisgarh, Jharkhand, Dadra and Nagar Haveli, Meghalaya, Jammu and Kashmir, Arunachal Pradesh) have low
(below -0.40 z-score) level of socio-economic development and spread mainly over extreme northern, north-eastern and some
parts of central India.
Table 7: Geographical variations in the level of socio-economic conditions
Category Z-score Number of
States and UTs States and UTs
High Above
0.18 8
Uttar Pradesh, Maharashtra, Kerala, Karnataka, Tamil Nadu, Andhra Pradesh,
West Bengal, NCT of Delhi,
Medium -0.40 to
0.18 19
Gujarat, Goa, Lakshadweep, Chandigarh, Pondicherry, Himachal Pradesh,
Assam, Mizoram, Punjab, Madhya Pradesh, Tripura, Orissa, Rajasthan, Haryana,
Uttarakhand, Daman and Diu, Bihar, Andaman and Nicobar Islands, Sikkim
Low Below -
0.40 8
Manipur, Nagaland, Chhattisgarh, Jharkhand, Dadra and Nagar Haveli,
Meghalaya, Jammu and Kashmir, Arunachal Pradesh
Source: Based on Table 6
International Journal of Trend in Scientific Research and Development (IJTSRD) @ www.ijtsrd.com eISSN: 2456-6470
@ IJTSRD | Unique Paper ID – IJTSRD39871 | Volume – 5 | Issue – 3 | March-April 2021 Page 502
Source: Based on Table 7
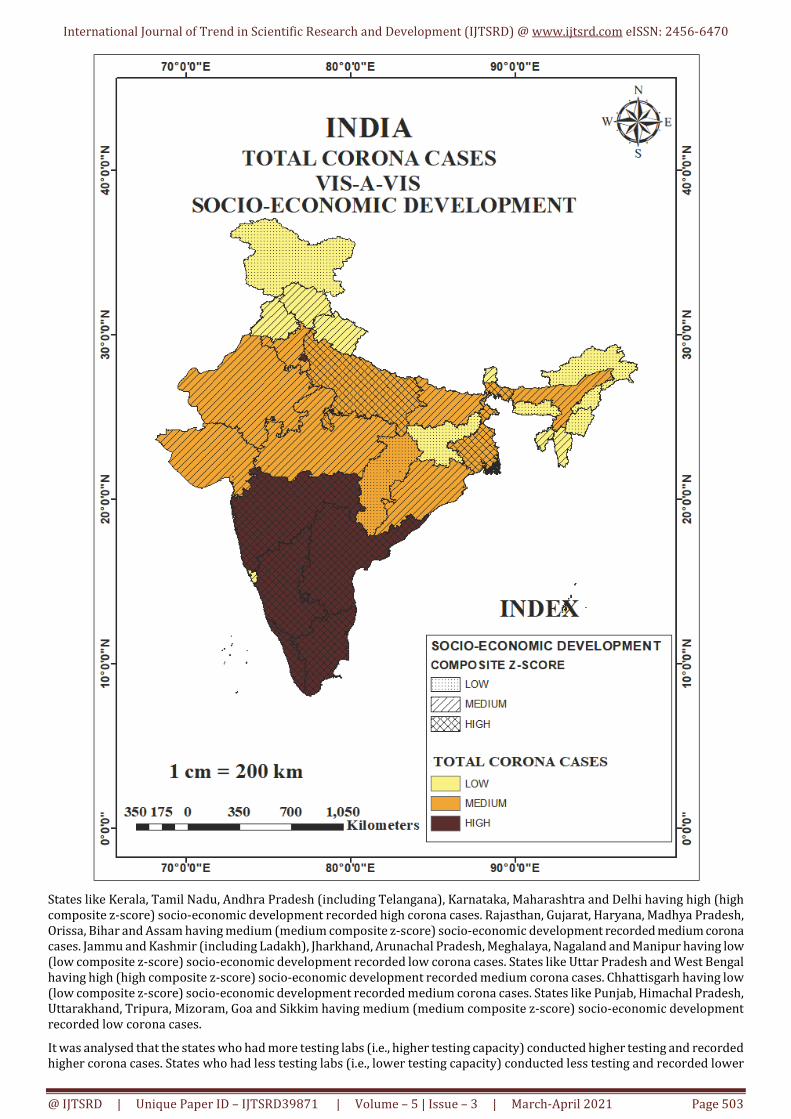
RELATIONSHIP BETWEEN CORONA CASES AND LEVEL OF SOCIO-ECONOMIC DEVELOPMENT
The relationship between corona cases and level of socio-economic development among the states and union territories of
India is shown in the following figure.
International Journal of Trend in Scientific Research and Development (IJTSRD) @ www.ijtsrd.com eISSN: 2456-6470
@ IJTSRD | Unique Paper ID – IJTSRD39871 | Volume – 5 | Issue – 3 | March-April 2021 Page 503
States like Kerala, Tamil Nadu, Andhra Pradesh (including Telangana), Karnataka, Maharashtra and Delhi having high (high
composite z-score) socio-economic development recorded high corona cases. Rajasthan, Gujarat, Haryana, Madhya Pradesh,
Orissa, Bihar and Assam having medium (medium composite z-score) socio-economic development recorded medium corona
cases. Jammu and Kashmir (including Ladakh), Jharkhand, Arunachal Pradesh, Meghalaya, Nagaland and Manipur having low
(low composite z-score) socio-economic development recorded low corona cases. States like Uttar Pradesh and West Bengal
having high (high composite z-score) socio-economic development recorded medium corona cases. Chhattisgarh having low
(low composite z-score) socio-economic development recorded medium corona cases. States like Punjab, Himachal Pradesh,
Uttarakhand, Tripura, Mizoram, Goa and Sikkim having medium (medium composite z-score) socio-economic development
recorded low corona cases.
It was analysed that the states who had more testing labs (i.e., higher testing capacity) conducted higher testing and recorded
higher corona cases. States who had less testing labs (i.e., lower testing capacity) conducted less testing and recorded lower
International Journal of Trend in Scientific Research and Development (IJTSRD) @ www.ijtsrd.com eISSN: 2456-6470
@ IJTSRD | Unique Paper ID – IJTSRD39871 | Volume – 5 | Issue – 3 | March-April 2021 Page 504
corona cases. States who are more urbanized, recorded more number of corona cases owing to higher population density in the
urban areas and vice-versa. States having higher number of elderly people (aged 60+) recorded more number of corona cases
and vice-versa. More than 50% of cases have occurred in the people of above 60 years of age. States where people have higher
per capita income recorded more corona cases, because people having higher income can easily afford the costs of tests. Poor
people cannot afford the costs of tests. States having higher literacy recorded more number of corona cases. People in such
states are more aware, they went to the hospitals and got tested. States having lower literacy recorded lesser number of corona
cases as illiterate people keep ignoring the symptoms of any disease in their body.
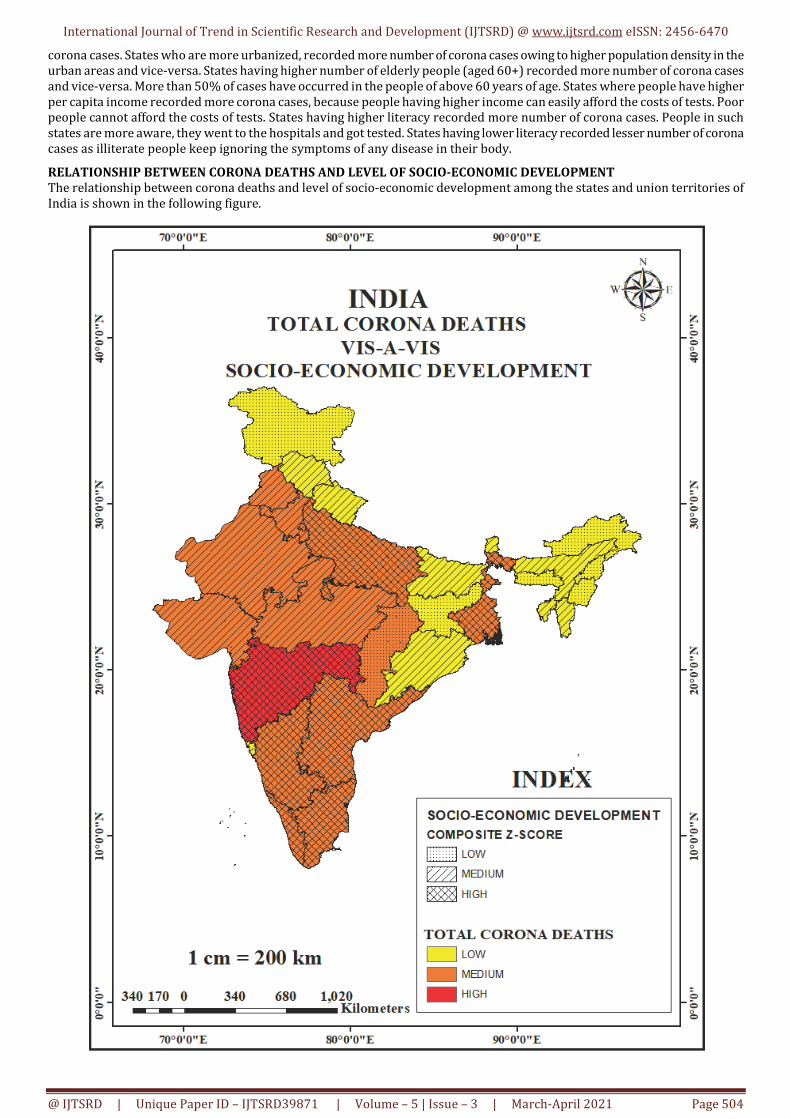
RELATIONSHIP BETWEEN CORONA DEATHS AND LEVEL OF SOCIO-ECONOMIC DEVELOPMENT
The relationship between corona deaths and level of socio-economic development among the states and union territories of
India is shown in the following figure.
International Journal of Trend in Scientific Research and Development (IJTSRD) @ www.ijtsrd.com eISSN: 2456-6470
@ IJTSRD | Unique Paper ID – IJTSRD39871 | Volume – 5 | Issue – 3 | March-April 2021 Page 505
Maharashtra having high (high composite z-score) socio-economic development recorded high corona deaths. States like
Kerala, Tamil Nadu, Karnataka, Andhra Pradesh (including Telangana), Uttar Pradesh, Delhi and West Bengal having high (high
composite z-score) socio-economic development recorded medium corona deaths. Gujarat, Rajasthan, Madhya Pradesh, Punjab
and Haryana having medium (medium composite z-score) socio-economic development recorded medium corona deaths.
States like Himachal Pradesh, Uttarakhand, Bihar, Orissa, Goa, Sikkim, Assam, Tripura and Mizoram having medium (medium
composite z-score) socio-economic development recorded low corona deaths. State like Chhattisgarh having low (low
composite z-score) socio-economic development recorded medium corona deaths. Jammu and Kashmir (including Ladakh),
Jharkhand, Meghalaya, Arunachal Pradesh, Manipur and Nagaland having low (low composite z-score) socio-economic
development recorded low corona deaths.
CONCLUSION
The overall analysis of the study reveals that the southern
states recorded higher corona cases. Central and western
parts of India recorded medium corona cases. Extreme
northern and north-eastern parts recorded lower corona
cases. Southern, central and western parts of India recorded
medium corona deaths. Extreme northern, eastern and
north-eastern parts recorded lower corona deaths. Southern
states have high socio-economic development. Central,
western and northern parts of India have medium socio-
economic development. Jammu and Kashmir, parts of
Central India, parts of north-eastern India have low socio-
economic development. Nineteen states have positive
relation between socio-economic development and corona
cases. Twelve states have positive relation between socio-
economic development and corona deaths. States having
more testing labs, higher percentage of urban population,
higher percentage of elderly people, higher literacy, higher
per capita income recorded more number of corona cases
and vice-versa.
REFERENCES
[1] Chen Y, Liu Q, Guo D. Emerging coronaviruses:
Genome structure, replication, and pathogenesis. J Med Virol. 2020; 92:418–423.
https://doi.org/10.1002/jmv.25681
[2] Dey SK, Rahman MM, Siddiqi UR, Howlader A.
Analyzing the epidemiological outbreak of COVID-19:
A visual exploratory data analysis approach. J Med Virol. 2020; 92:632–638.
https://doi.org/10.1002/jmv.25743
[3] He F, Deng Y, Li W. Coronavirus disease 2019: What
we know? J Med Virol. 2020; 92:719–725.
https://doi.org/10.1002/jmv.25766
[4] https://cddep.org/wp-
content/uploads/2020/04/State-wise-estimates-of-
current-beds-and-ventilators_24Apr2020.pdf
[5] https://censusindia.gov.in/2011-
common/censusdata2011.html
[6] https://www.mohfw.gov.in/
[7] Dr. Jabir Hasan Khan & Tarique Hassan & Shamshad,
2014. "Incidence of Poverty and Level of Socio-
Economic Deprivation in India," Journal of Developing
Areas, Tennessee State University, College of Business,
vol. 48(2), pages 21-38, April-Jun.
[8] Kandeel M, Ibrahim A, Fayez M, Al-Nazawi M. From
SARS and MERS CoVs to SARS-CoV-2: Moving toward
more biased codon usage in viral structural and
nonstructural genes. J Med Virol. 2020; 92:660–666.
https://doi.org/10.1002/jmv.25754
[9] Kofi Ayittey F, Dzuvor C, Kormla Ayittey M, Bennita
Chiwero N, Habib A. Updates on Wuhan 2019 novel
coronavirus epidemic. J Med Virol. 2020; 92:403– 407.
https://doi.org/10.1002/jmv.25695
[10] Li G, Fan Y, Lai Y, et al. Coronavirus infections and
immune responses. J Med Virol. 2020; 92: 424-432.
https://doi.org/10.1002/jmv.25685
[11] Lu H, Stratton CW, Tang Y-W. Outbreak of pneumonia
of unknown etiology in Wuhan, China: The mystery
and the miracle. J Med Virol. 2020;92:401– 402.
https://doi.org/10.1002/jmv.25678
[12] Lu H, Stratton CW, Tang Y-W. The Wuhan
SARS-CoV-2—What's next for China. J Med Virol. 2020; 92:546–547. https://doi.org/10.1002/jmv.25738
[13] Smith, D. M. (1973), the Geography of Social Well-Being in the United States: An Introduction to Territorial Social Indicators, New York: McGraw-Hill,
85.
[14] Sun P, Lu X, Xu C, Sun W, Pan B. Understanding of
COVID-19 based on current evidence. J Med Virol. 2020; 92:548-549.
https://doi.org/10.1002/jmv.25722
[15] Wang Y, Wang Y, Chen Y, Qin Q. Unique
epidemiological and clinical features of the emerging
2019 novel coronavirus pneumonia (COVID-19)
implicate special control measures. J Med Virol. 2020;
92:568–576. https://doi.org/10.1002/jmv.25748
[16] Yang Y, Shang W, Rao X. Facing the COVID-19
outbreak: What should we know and what could we
do? J Med Virol. 2020; 92:536 537.
https://doi.org/10.1002/jmv.25720
[17] Zhang L, Liu Y. Potential interventions for novel
coronavirus in China: A systematic review. J Med Virol. 2020; 92:479–490.
https://doi.org/10.1002/jmv.25707
[18] Zhang N, Wang L, Deng X, et al. Recent advances in the
detection of respiratory virus infection in humans. J Med Virol. 2020;92:408–417.
https://doi.org/10.1002/jmv.25674