Embed Size (px)
Citation preview

1 Department of Translational Medicine. University of Eastern Piedmont “Amedeo Avogadro”, Novara, Italy2 Department of Clinical and Biological Sciences. University of Turin, Italy3 Department of Pharmacological and Biomolecular Science, University of Milan, Italy4 Department of Urology, Clinic Santa Rita - Policlinico of Monza, Vercelli, Italy5 Local Health Agency (ASL) of Vercelli
Ann Ig 2016; 28: 1
Geographical and epidemiological analysis of oncological incidence in paediatric and adolescent ages in a municipality of North-Western Italy: Vercelli, years 2002-2009
C. Salerno1, P. Berchialla2, L.A. Palin1, E.Barasolo4, P.G. Fossale5,P. Marciani3
Key words: Spatial analysis, juvenile cancer mortality, Province of Vercelli, Bayesian modelParole chiave: Analisi spaziale, mortalità oncologica giovanile, Provincia di Vercelli, modello
bayesiano
Abstract
Introduction. This study of the geographical incidence on the oncological mortality in young age (0-44 years) in the City of Vercelli, was aimed to address the concerns of the population and the request of municipal administrators. A detailed and sophisticated study for a City of medium-small size is due for the presence of various sources of pressure, such as a MSW incinerator just a few kilometres from the city and an intensive agricultural activity that characterizes the entire area.Materials and methods. The study is based on the census analysis of the population, and of the hospital admission cards, and it considers epidemiological standardized estimators and spatial analysis through Bayesian models, as well. Results. Both approaches highlight Major risks for the area south of the city for major tumours such as total cancer in women (SIR / SMR significant excess of about 50%), colorectal (mean increments SMR / SIR between 3 and 4 times), ovary (mean increments SMR / SIR between 3:04 and times), and nervous system (increases 3 times for both indicators). Conclusions. These results deserve further studies through inferential case-control and cohort analysis, given the marginal role of the possible occupational hazards in the aetiology of juvenile cancer disorders.
Introduction
The present study has been planned to answer the concerns of the population and local administrators of Vercelli (Piedmont, Italy) about the reported increase in mortality for specific neoplasia among the residents.
Previous descriptive epidemiological studies confirmed the excess of oncological risk for specific cancers in the province of Vercelli. (1-3)
The interest for such a detailed and sophisticated study covering an area of moderate dimensions and population rises
2 C. Salerno et al.
for the presence of various sources of environmental and industrial pressure, such as an old-generation incinerator for solid urban waste, active since 1977, located a few kilometres away from the city, not far from a medium size chemical plant and, therefore, considered at high environmental risk. Besides, both the Province and Vercelli city itself have been historically interested and characterised by the intensive rice production, where the massive use of pesticides can be suspected as a further factor of risk and excess of cancer pathologies in the population (4-17).
The municipality of Vercelli includes about 46,000 inhabitants, with a surface of 79.85 Km2 for a population density of 588.19 inhabitants per Km2.
For this study, we decided to use spatial representation and analysis techniques that were as informative, valid and appropriate as possible, and well known to be able to highlight differences in the health status of the reference population and to identify any critical situation for which further studies and/or adequate interventions of public health should be performed (18-20).
On the city map, divided into census sections, we show the distribution of the most important causes of death by cancer that are reported in the literature (1-3) possibly associated with the presence of incinerators and other environmental determinants, using the appropriate tools of statistical analysis, in order to evaluate the presence of any excesses and/or spatial aggregations (clusters) of the mortality data.
Materials and methods
Data were collected from the Italian Institute of statistic (ISTAT) reports, from the Registry of Hospital Chart forms (RHC), and histological reports. The structures that participated in the survey, granting access to their archives, are S. Andrea Hospital
and S. Rita Clinic of Vercelli, Hospital of Casale Monferrato, Hospital of Alessandria, San Matteo Hospital of Pavia, Maugeri Foundation of Pavia, San Giovanni Battista and Regina Margherita Hospitals of Turin, Maggiore della Carità Hospital of Novara, Istituto Europeo di Oncologia (European Oncological Institute) and Istituto Nazionale dei Tumori (National Institute of Cancers) of Milan.
We took into account the causes of hospital admission related to pathologies that, in many studies published in the international literature, are associated with the presence of sites for the storage of dangerous waste products and/or for which previous studies have observed a statistically significant persistence of excess.
The analysis was performed on data related to the years from 2002 to 2009, in the following order:
1. traditional descriptive analysis, consisting in the examination of standardised rates with indirect technique (weight = regional population in the i-age class), in the municipality of Vercelli, using the specific rates, for the years 2005-2007, of the Cancer Register provided by the Centre for Oncological Prevention of the city of Turin (21);
2. examination of the statistical heterogeneity of the distribution of BMR (Bayesian Mortality Ratio - reference rates = age-specific rates of the population living in the area), in the same area and performance of the heterogeneity test of Martuzzi & Hills (22);
3. elaboration of a map of incidence distribution (for BMR value classes) in the examined area (20, 23);
4. analysis of the registry from 2000 to 2009, in order to link illness to living area in the city properly.
Indirect standard mortality rates (SMR) and standard Incidence rates (SIR) have been calculated estimating the expected values using the specific five years (2005-
3Oncological incidence in paediatric and adolescent ages in Vercelli, Italy
2007) rates of oncological mortality from the Airtum Register of Torino City and the numbers of hospital admissions from Register of Hospital Charts (RHC) for the same period.
The urban area of Vercelli is divided in about 500 census sections (units used for the geographical spatial analysis) fig.1, and five polling circumscriptions formed by forty-nine polling sections (units used for the descriptive epidemiological analysis).
Data were collected from the RHC of the ASL (Local Health Agency) of Vercelli, for the years 2000-2009 (the first two years were used as “historical data” to eliminate prevalent cases).
We used Excel 2007, to manage the database of admissions and the personal data, Winbugs Package, to smooth the data and define BMR values (24), and R Statistics, to perform the statistical analysis.
The Martuzzi Hills (22) statistical test has been used to estimate the heterogeneity of the events among the sections, following the assumption that risks per section are regularly distributed (according to the Poisson distribution), against the alternative hypothesis of “over-dispersion”, according to the negative binomial distribution.
The data mapping is aimed at visually highlighting the areas where an excess of morbidity can be recognised. A measure of the relative risk usually used for this purpose is the Standardized Mortality Ratio (SMR) related to each area of the city under examination.
Nevertheless, a simple mapping of SMR (ratio between observed and expected cases, the second calculated using the population of each area as weight) as “raw” value for each area is not very informative and can be misleading, because of the instability of the values, due to the low number of events in some areas (18-20, 23). As a matter of fact, in case of rare events in small areas, the expected value is often a decimal fraction and the SIR becomes “inappropriately”
high, even where a single case is observed. Therefore, the presence of small areas irretrievably “stains” the representation of “raw” SMRs, creating a “patch” pattern in the map, making it unreadable (25).
For this reason we have elaborated maps using hierarchical Bayesian estimators (BMR = Bayesian Mortality Ratio), separately calculated for the two sexes. As authoritatively stated in a recent publication (25), the use of Bayesian analysis (18-20, 23) allows taking into account the spatial trend of the rates around the studied area; this procedure is particularly advisable when the relative risk measurements are unstable owing to the low number of events. The «WinBUGS Package» (24) software provides the values of such measures via CAR (Conditional AutoRegressive) model; such model creates a “smoothing” function for SMR values, also taking into account the values of the areas near each municipality under study. The values produced with this procedure allowed to depict maps whose shades of colour represent the intensity of the phenomenon under scrutiny. In this study, the BMR values for each specific cause of death have been divided into six frequency classes, with a corresponding colour hue.
Results
In the period 2000-2009, about 2,996 new cases of cancer (1,448 women and 1,548 men) were reported in the city of Vercelli, with a raw incidence rate of 651.3 cases/10,000 inhabitants.
Spatial analysisBecause of case exiguity, the following
tables and maps only refer to oncological incidence, no analysis by different gender and mortalities on these age ranges was performed.
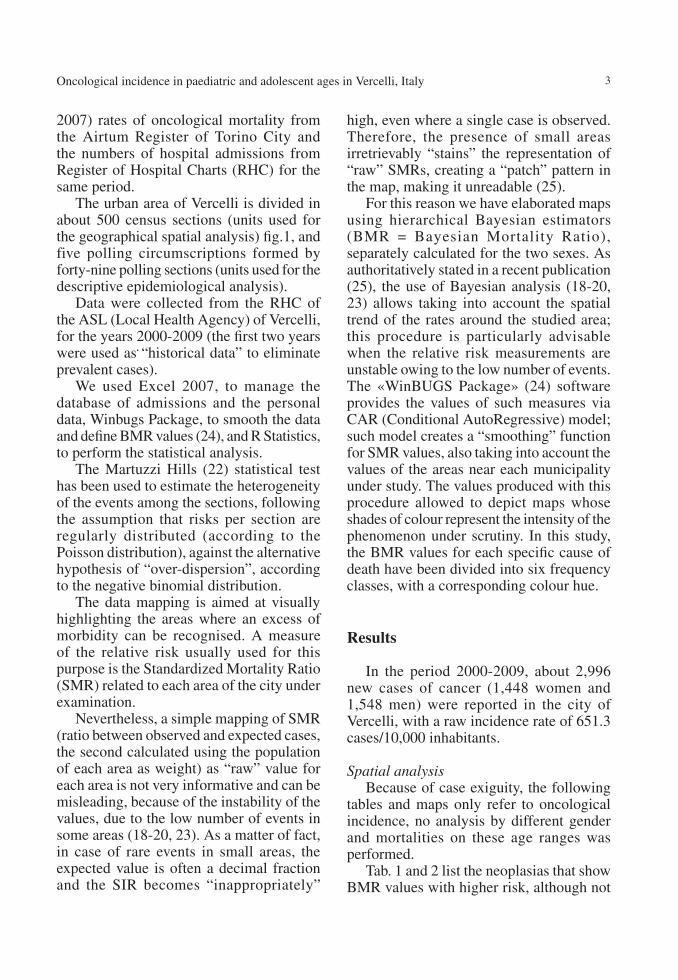
Tab. 1 and 2 list the neoplasias that show BMR values with higher risk, although not

4 C. Salerno et al.
Figure 1 - Distribution of census sections and main districts of the city of Vercelli
Table 1 - Neoplasia with higher BMR values and related territorial cluster, paediatric age
Paediatric neoplasies (age 00-14)Corresponding cluster areas
Neoplasies Census sections at risk
All cancers 415, 374; 369 (6-8% higher risk) Prestinari Blvd and neighbourhood, Baracca St/N.Palli St, Martiri del Kiwu St area
Leukaemia 83; 368; 199; 374 (2-3% higher risk) Baracca St, Martiri del Kiwu st area, De Rege Blvd/Lazio Sq, area, Garibaldi Blvd area
Nervous system 470; 415; 351 (23.5% higher risk) Prestinari Blvd /Torino Blvd and neighbouring areas
statistically significant, except all cancers, age 00-44 with 3.25 (IC95% 1.01-8.52); the persistence of specific areas south of the city centre in both observed groups is interesting.
Among the neoplasias, higher BMR clusters (not statistically significant at 95% IC), have been found in paediatric age for Total cancers, nervous system and leukaemia, in the young age for leukaemia, thyroid and Total cancers (Fig. 2.1-2.6).
The observation globally indicates a persistence of an east-west gradient (from Porta Milano to Porta Torino areas); particularly relevant the south cluster for paediatric age leukaemia that is even more
evident taking into account the neighbouring rural areas. The same geographical distribution is particularly noticeable in the cartography related to thyroid, total cancers and nervous system in paediatric age.
Descriptive epidemiological analysisThe descript ive research on the
oncological pathologies in the various urban zones is based on the territorial division of the city in 5 polling circumscriptions (fig. 3) and 50 polling sections. Polling sections are not spatially well defined since some streets may be included in a section although being isolated and even quite distant from the others streets. For a spatial analysis, better

5Oncological incidence in paediatric and adolescent ages in Vercelli, Italy
aggregation would be the census section that is an enclosed area although quite small in terms of number of inhabitants; Vercelli numbers 500 census sections and about 46,000 inhabitants
Taking into account every type of cancer (Tab 3), some excesses can be seen in both mortality and incidence for leukaemia and bones cancer mortality, mortality shows excess also for colon-rectum, ovary and nervous system, and incidence has excesses for liver, lymphomas and uterus. The outcome for uterus cancer is affected by the higher early diagnosis due to the massive screening program that fortunately decreases the mortality rate.
The analysis of mortality and total incidence (Tab. 4) for young age cancers
shows an excess, for women, with a 45% and 60% higher risk, confirmed by both sources of data (ISTAT and RHC).
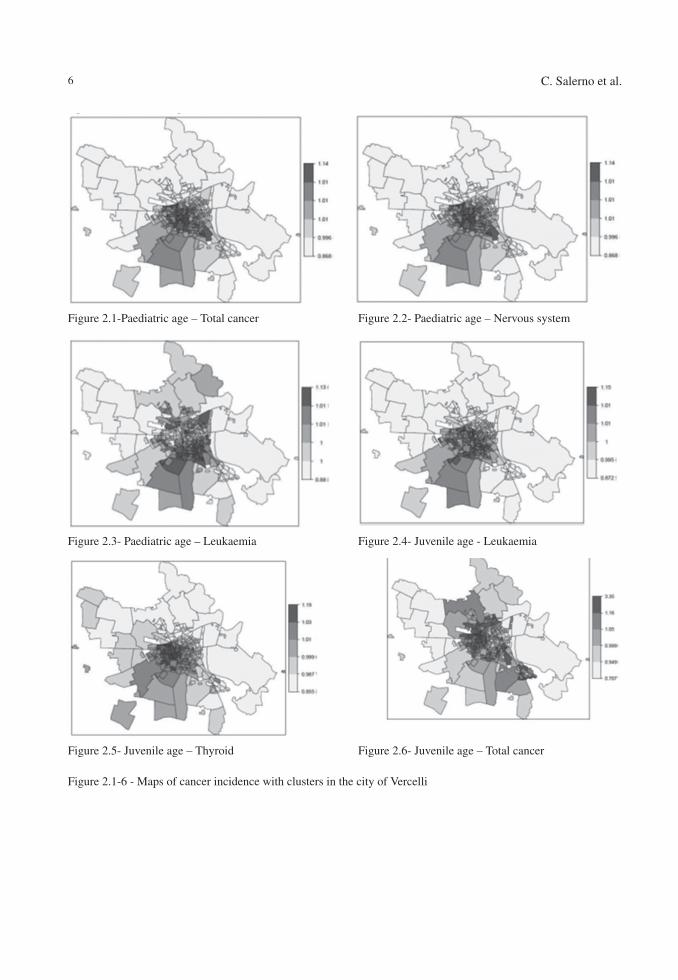
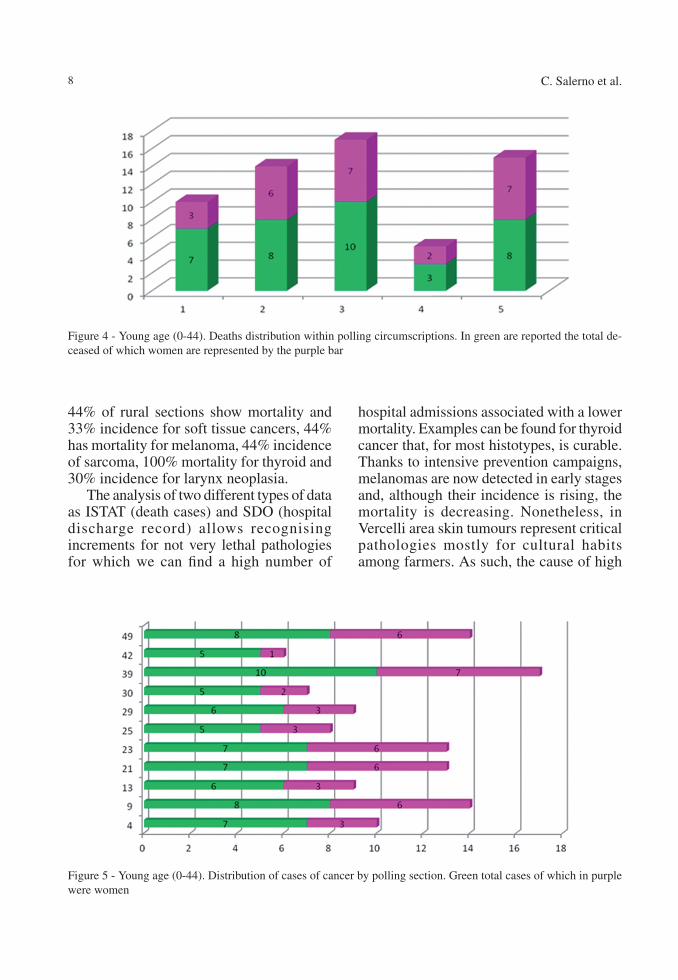
As regards the urban distribution of young age neoplasias, figure 4 shows that the higher number of deaths took place in circumscription 3 followed by the 5 and 2, no gender differences can be statistically determined. Figure 5 analyses illness cases, and shows that circumscription 5 (sections 21, 23, 29, 30) registers 42 cases, circumscription 1 (sections 4, 9, 13) 33 cases, circumscription 5 (section 25, 42) 14 cases, circumscription 4 (section 39) 17 cases, and circumscription 3 (section 49) 14 cases. The distribution is in agreement with the Bayesian charts (fig. 2).
Young age neoplasies (age 00-44)Corresponding cluster areas
Neoplasies Census sections at risk
All cancers 369*; 258; 415 *(3.25 IC95% 1.01-8.52)
Martiri del Kiwu St, Prestinari Blvd and neighbourhood, Casale Blvd /Tanaro Blvd and
neighbouring areas
Soft tissues 52; 200; 309 (2.5-3.5% higher risk) Libertà Blvd and streets, De Rege Blvd /Lazio Sq area, Paggi St and neighbouring areas.
Stomach 463; 308; 75 (3-4,5% higher risk) Gran Paradiso St and neighbouring areas, Paggi St and neighbouring areas, Garibaldi Blvd area
Nervous system 415; 351; 470 (3-4% higher risk) Prestinari Blvd/Torino Blvd and neighbouring areas (persistence as 00-14)
Kidney 428; 93; 468 (3% higher risk) Randaccio Blvd and neighbouring areas, Sant’Eusebio Sq, Prestinari Blvd and neighbouring areas
Bones 12; 415; 443 (4-5% higher risk) Libertà Blvd and neighbouring areas, Prestinari Blvd and neighbouring areas, Fiume Blvd
Melanoma 457; 411; 348 (4.5% higher risk)Prestinari Blvd and neighbouring areas, Fiume Blvd
and neighbouring areas, XXVI aprile Blvd and neighbouring areas.
Lymphomas 223; 319; 317 (4-8.5% higher risk) De Rege Blvd/Lazio Sq area, Hospital and neighbouring areas.
Leukaemia 369; 368; 83 (3.5-5% higher risk)Baracca St /Palli St, Garibaldi Blvd area
(persistence as 00-14)
Colon-rectum 321; 350; 25 (3.5% higher risk)Massaua St and neighbouring areas, Prestinari Blvd /Torino Blvd and neighbouring areas, Duomo Sq and
neighbouring areas.
Thyroid 454; 351; 307 (5.5-8.5% higher risk) Prestinari Blvd/Torino Blvd and neighbouring areas, Paggi St and neighbouring areas.
Table 2 - Neoplasia with higher BMR values and related territorial cluster, young adult age*(3.25 IC95% 1.01-8.52)
6 C. Salerno et al.
Figure 2.1-6 - Maps of cancer incidence with clusters in the city of Vercelli
Figure 2.1-Paediatric age – Total cancer Figure 2.2- Paediatric age – Nervous system
Figure 2.3- Paediatric age – Leukaemia Figure 2.4- Juvenile age - Leukaemia
Figure 2.5- Juvenile age – Thyroid Figure 2.6- Juvenile age – Total cancer

7Oncological incidence in paediatric and adolescent ages in Vercelli, Italy
Figure 3 - Polling circumscriptions of Vercelli
Table 3 - SMR and SIR in young age
Neoplasia ICDIXMortality Incidence
Cases SMR IC-I95% IC-S95% OSS SIR IC-I95% IC-S95%
Colon-rectum 153-154 4 4.44 2.38 6.82 4 2.91 1.23 4.58
Liver+bil. Tract 155-156 1 3.33 0.00 6.91 1 8.33 2.67 13.9
Breast 174.0-174.9 6 1.17 0.31 2.04 28 0.94 0.58 1.29
Bone 170 2 7.14 3.43 10.8 2 3.33 0.80 5.85
Ovary 183-183.9 5 4.00 2.24 5.75 8 2.70 1.56 3.83
Lung 162-162.9 2 1.05 0.00 2.47 1 0.56 0.00 2.02
Nervous system 191-192 3 3.33 1.26 5.39 4 2.59 1.02 4.16
Leukaemia 204-208 3 6.38 3.52 9.24 3 1.36 0.05 2.67
H-NH lymphomas200.201-202
--- --- --- --- 11 1.91 1.10 2.72
Melanoma 172-172.9 --- --- --- --- 6 0.90 0.15 1.65
Uterus179-180-182
--- --- --- --- 17* 4.55 3.54 5.56
Thyroid 193 --- --- --- --- 15 1.60 0.96 2.24
Table 4 – SMR and SIR indirect rates of incidence in young age male (M) and female (F)
00-44Young age mortality Young age incidence
Cases SMR IC-INF95% IC-SUP95% Cases SIR IC-INF95% IC-SUP95%
M 11 0.98 0.39 1.56 75 1.13 0.88 1.37
F 25 1.64 1.14 2.14 108 1.45 1.23 1.67
Other epidemiological considerations In the global spatial analysis (all ages),
taking into account census sections with BMR showing excesses although not statistically significant, we separated the urban sections from the rural ones, in which there are one or more farmhouses.
The interesting epidemiological data are that, on one hand, for the commonest neoplasias such as colon-rectum, lung, leukaemia, etc., the percentage in the rural sections on the global value is almost irrelevant; on the other hand, the situation for rare illnesses is very different. In particular, in rural sections we can observe that the
8 C. Salerno et al.
44% of rural sections show mortality and 33% incidence for soft tissue cancers, 44% has mortality for melanoma, 44% incidence of sarcoma, 100% mortality for thyroid and 30% incidence for larynx neoplasia.
The analysis of two different types of data as ISTAT (death cases) and SDO (hospital discharge record) allows recognising increments for not very lethal pathologies for which we can find a high number of
Figure 4 - Young age (0-44). Deaths distribution within polling circumscriptions. In green are reported the total de-ceased of which women are represented by the purple bar
Figure 5 - Young age (0-44). Distribution of cases of cancer by polling section. Green total cases of which in purple were women
hospital admissions associated with a lower mortality. Examples can be found for thyroid cancer that, for most histotypes, is curable. Thanks to intensive prevention campaigns, melanomas are now detected in early stages and, although their incidence is rising, the mortality is decreasing. Nonetheless, in Vercelli area skin tumours represent critical pathologies mostly for cultural habits among farmers. As such, the cause of high
9Oncological incidence in paediatric and adolescent ages in Vercelli, Italy
incidence of melanocytes in farmers has to be considered as para-occupational and not due to exposure to pesticides
Environmental pressure sites at the urban level
A research performed by ISS (the Italian Institute of Health) in 2005 on the lowland area of the Vercelli Province reports the presence of polluted sites and factories to be considered at environmental risk in the urban area (26).
Table 5 - Distribution of “at risk” sites/factories, by polling section and circumscription. *presence of two different sites
Polluted sites Factories at riskSection Circumcription Section Circumcription
43 5* 21 29 1 45 330 2* 29 245 3 30 2
45 3
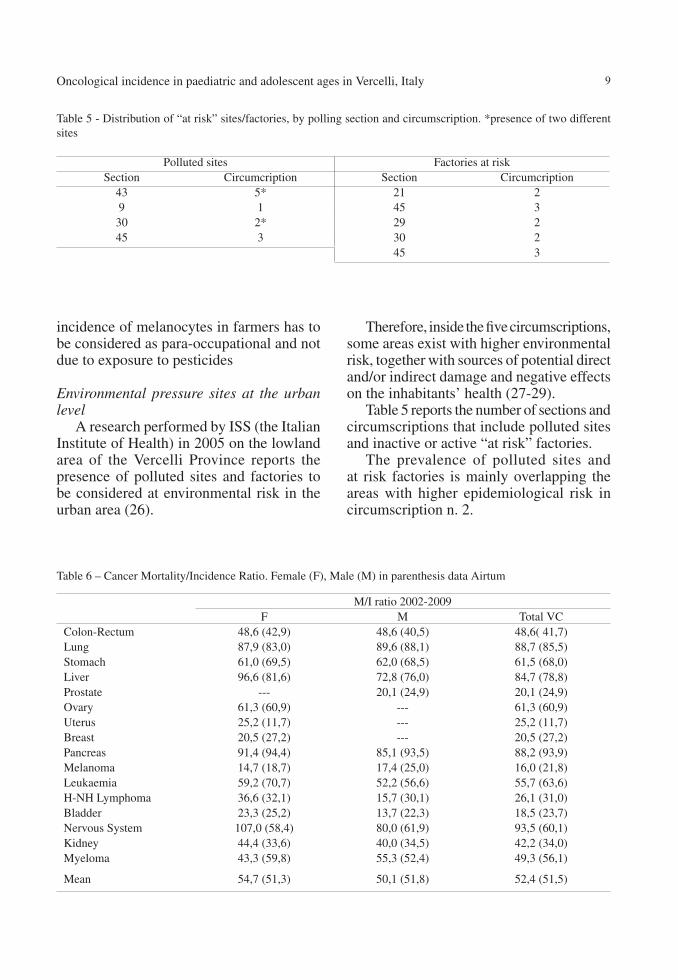
Table 6 – Cancer Mortality/Incidence Ratio. Female (F), Male (M) in parenthesis data Airtum
M/I ratio 2002-2009F M Total VC
Colon-Rectum 48,6 (42,9) 48,6 (40,5) 48,6( 41,7)Lung 87,9 (83,0) 89,6 (88,1) 88,7 (85,5)Stomach 61,0 (69,5) 62,0 (68,5) 61,5 (68,0)Liver 96,6 (81,6) 72,8 (76,0) 84,7 (78,8)Prostate --- 20,1 (24,9) 20,1 (24,9)Ovary 61,3 (60,9) --- 61,3 (60,9)Uterus 25,2 (11,7) --- 25,2 (11,7)Breast 20,5 (27,2) --- 20,5 (27,2)Pancreas 91,4 (94,4) 85,1 (93,5) 88,2 (93,9)Melanoma 14,7 (18,7) 17,4 (25,0) 16,0 (21,8)Leukaemia 59,2 (70,7) 52,2 (56,6) 55,7 (63,6)H-NH Lymphoma 36,6 (32,1) 15,7 (30,1) 26,1 (31,0)Bladder 23,3 (25,2) 13,7 (22,3) 18,5 (23,7)Nervous System 107,0 (58,4) 80,0 (61,9) 93,5 (60,1)Kidney 44,4 (33,6) 40,0 (34,5) 42,2 (34,0)Myeloma 43,3 (59,8) 55,3 (52,4) 49,3 (56,1)
Mean 54,7 (51,3) 50,1 (51,8) 52,4 (51,5)
Therefore, inside the five circumscriptions, some areas exist with higher environmental risk, together with sources of potential direct and/or indirect damage and negative effects on the inhabitants’ health (27-29).
Table 5 reports the number of sections and circumscriptions that include polluted sites and inactive or active “at risk” factories.
The prevalence of polluted sites and at risk factories is mainly overlapping the areas with higher epidemiological risk in circumscription n. 2.

10 C. Salerno et al.
Indicators of data flow qualityThe quality controls of oncological
incidence data flows were performed by crossing RHC diagnoses with histological reports, when available, to sample the diagnostic correctness as best as possible.
Table 6 reports the number of deaths and of admissions for each neoplasia, and the M/I (M=deaths, I=incidence) ratio is defined; this parameter varies according to the lethality of each pathology; for example, very lethal pathologies are pancreas and lung cancers. The ratio is close to 100, unlike other less lethal pathologies such as prostate cancer, that shows a value equal to 20-30; a value higher than 100 indicates a likely “wrong classification” error, as more dead than ill people are observed. Furthermore, we compared these average values of Vercelli with the AIRTUM (30) values of Turin and, although some analogies can be observed, some differences between the two cities remain.
Conclusions
The epidemiological analysis of the City of Vercelli, in the period 2002-2009, devoted to the oncological morbidity and mortality in paediatric and young age groups, confirms the presence of an urban reality which is not immune from the exposure to a undefined number of risk factors, that negatively impact on the health of its citizens, creating clear oncological risk conditions, as observed during previous investigations.
The present epidemiological study is based on urban micro-areas, such as polling and census circumscription/sections, and it allowed us to evaluate and compare small urban zones in terms of oncological mortality and illness, to highlight the various risks in the community and to hypothesize differentiated environments in the city itself.
The Porta Torino/Corso Prestinari and neighbouring areas are characterized by
Table 7 - Diagnostic confirmation for causes; the difference at 100 is the % of cases whose diagnosis comes from ISTAT or RHC records only. A- RHC+ISTAT confirmation; B- RHC + histopathological confirmation; C- histology only.
Neoplasia A B C TotalLung 39.2% 48.6% 0.3% 88.2%Colon-rectum 14.3% 65.9% 6.9% 87.1%Liver/biliary tract 43.1% 31.8 ---- 74.9%Prostate 11% 47.2% 20.8% 79.0%Uterus 5% 55.7% 11.5% 72.2%Stomach 13.6% 70.4% 4.5% 88.5%Melanoma 4.2% 65.9% 14.8% 84.9%Breast 4.9% 65.3% 10.6% 80.8%Leukaemia 26.5% 37.2% 1.9% 65.6%Oral cavity 13.8 63.8% 8.3% 85.9%Ovary 25.9% 59.3% 5.2% 90.4%Pancreas 52% 32% 1.3% 85.3%Kidney 14.6% 49.3% 1.3% 65.2%Nervous system 54.5% 23.6% --- 78.1%Testicle ---- 71.4% 7.1% 78.5%Bladder 5.6% 66.4% 3.7% 75.7%H-NH lymphoma 10.1% 64.4% 6.7% 81.2%Esophagus 13.0% 65.2% 8.7% 86.9%

11Oncological incidence in paediatric and adolescent ages in Vercelli, Italy
high motor-vehicle traffic, with the possible presence of risk factors caused by atmospheric pollutants (4, 28, 31); additionally, the presence of decommissioned factories in the neighbouring zones create a potential historical source of risks for the resident population (7, 15, 16, 32, 33).
As regards the areas of via M. Kiwu, N. Palli and neighbouring zones, the most accredited hypothesis of healthcare risk may be connected to the nearby industrial area. The massive presence of houses for indigent families suggests some risk considerations due to social, cultural and economic factors that can influence the cluster, and that has not been taken into account, yet.
Finally, only feeble hypotheses can be made, at the moment, about via W. Manzone area, where the excess, including various cases of leukaemia, can be related to the presence of some gas stations, although this hypothesis needs to be confirmed through specific studies.
The present study could not evaluate all the hypotheses and further specific analyses might take advantage of specific questionnaires and of the access to all clinical records available.
The maps drawn by means of the BMR index (22, 33) create an “updated and objective picture”, with no emotional and subjective elements, of the trends of the oncological pathologies of Vercelli citizens; such tools are important to define any future public health intervention. We want to stress how this study has limits created both by the small numbers of cases in the census sections, where no statistically significant confidence intervals are available for BMRs with more or less high risk. A revision of the cartography is already planned, to include some important covariates, such as indexes of socio-economic deprivation, the nearby presence of heavy traffic roadways or cell-phone relays whose power has been recently reduced but may still have late effects, and the length of stay. We will also
try to calculate the distance of the sections from the sources of environmental industrial risk, also taking into account occupational exposures (5, 6, 11, 35, 36).
The research on RHC, as regards the BMR measure, has confirmed the excesses of high frequency and high lethality cancers like colon-rectum and breast cancers and for all the neoplasias, and showed some clusters for breast and prostate cancers. We suggest further analyses as regards the clusters limited to specific city areas, where former environmental and/or industrial determinants should be taken into account (8, 9, 37).
Finally, considering that most confidence intervals of the BMR presented in this study are close to significance, we hope that, in the future, both the admission and death databases should be widened with two more years of observation, in order to have more stable results, to better address risk, protection, and prevention.
Riassunto
Analisi geografica ed epidemiologica dell’inci-denza oncologica in eta pediatrica e giovanile in un comune italiano del Nord Ovest: Vercelli anni 2002-2009
Introduzione. Lo studio di analisi geografica dell’in-cidenza oncologica giovanile (0-44 anni) sul comune di Vercelli, nasce dall’esigenza di rispondere alle preoccu-pazioni della popolazione e su richiesta di alcuni ammi-nistratori locali. Uno studio cosi dettagliato e sofisticato per una città di medie-piccole dimensioni scaturisce dalla presenza di diverse fonti di pressione quali un inceneri-tore di RSU a pochi km dalla città e una intensa attività agricola che ne caratterizza l’intera area.
Materiali e metodi. Lo studio è costituito sull’analisi censuaria, delle schede di ricovero e dati demografici di decesso, sia dal punto di vista epidemiologico con estimatori standardizzati SIR che analisi spaziale tramite modelli bayesiani.
Risultati. Complessivamente entrambe gli approcci evidenziamo rischi maggiori per l’area sud del capo-luogo per i principali tumori quali Totale tumori nelle donne (SIR/SMR eccessi significativi di circa il 50%), Colon-retto (incrementi significati di SMR/SIR tra le 3 e 4 volte), Ovaio (incrementi significati di SMR/SIR tra
12 C. Salerno et al.
le 3 e 4 volte e sistema nervoso (aumenti per entrambe indicatori di 3 volte).
Conclusioni. Risultati questi meritevoli di approfon-dimento tramite studi inferenziali quali caso-controllo e coorte visto il ruolo marginale del possibile rischio di origine occupazionale nell’eziologia delle patologie tumorali giovanili.
References
1. Salerno C, Bagnasco G, Panella M, Comelli M. Stime d’incidenza oncologica nell’ASL VC di Vercelli dal 2002 al 2005. Ig Sanita Pubbl 2009; 65(3): 253-61.
2. Salerno C, Bagnasco G,Comelli M. Andamen-to della mortalità oncologica nell’ASL VC di Vercelli: Estensione database al 2006-2009 e analisi decennio 2000-2009. Ig Sanita Pubbl 2011; 67(3): 277-87.
3. Salerno C, Palin L, Berchialla P, Panella M, Comelli M. Incidenza oncologica nell’ASL VC di Vercelli dal 2002 al 2009. Ann Ig 2012; 24(3): 241-8.
4. Pearson R, Watchel H, Ebi KLDistance-weight-ed traffic density in proximity to a home is a risk factor for leukemia and other childhood cancers. J Air Waste Man Assoc 2000; 50(2): 175-80.
5. Franchini M, Rial M, Buiatti E, Bianchi F. Health effects of exposure to waste incinerator emissions: a review of epidemiological studies. Ann Ist Super Sanita 2004; 40(1): 101-15.
6. Goldberg MS, Al Homsi N, Goulet L, Riberdy H. Incidence of cancer among persons living near a municipal solid waste landifill site in Montreal,Quebec. Arch Environ Health 1995; 50(6): 416-24.
7. Jarup L, Briggs D, de Hoogh C et al. Cancer risks in populations living near landfill sites in Great Britain. Br J Cancer 2002; 86(11): 1732-36.
8. Linzalone N, Bianchi F. Incinerators: not only dioxins and heavy metals, also fine and ultrafine particles. Epidemiol Prev 2007; 31(1): 62-6.
9. Porta D, Milani S, Lazzarino AI, Perucci CA, Forastiere F. Systematic review of epidemio-logical studies on health effects associated with managment of solid waste. Environ Health 2009; 8: 60.
10. Valerio F. Review on environmental impact of solid waste produced by municipal urban waste incinerators. Epidemiol Prev 2008; 32(4-5): 244-53.
11. Vrijheid M. Health effects of residence near hazardous waste landfill sites: a review of epi-demiologic literature. Environ Health Perspect 2000; 108(Suppl 1): 101-12.
12. Cormier SA, Lomnicki S, Backes W, Dellinger B. Origin and health impacts of emissions of toxic by-products and fine particles from com-bustion and thermal treatment of hazardous wastes and material. Environ Health Perspec 2006; 114(6): 810-7.
13. Biggeri A, Barbone F, Lagazio C, Bovenzi M, Stanta G. Pollution and lung cancer in Trieste; Italy spatial analysis of risk as a function of distance from sources. Environ Health Perspect 1996; 104(7): 750-54.
14. Dockery DW. Health effects of particulate air pollution Ann Epidemiol 2009; 19(4): 257-63.
15. Gardner MJ, Winter PD. Mapping small area cancer mortality: a residential coding story. J Epidemiol Community Health 1984; 38(1): 81-4.
16. Laden F, Schwartz J, Speizer FE, Dockery DW. Reduction in fine particulate air pollution and mortality. Extended follow-up of the Harvard Six Cities Study. Am J Respir Crit Care Med 2006; 173(6): 667-672
17. Wild CP, Kleinjans J. Children and increased susceptibility to environmental carcinogens: evidence or empathy? Cancer Epidemiol Bio-markers Prev 2003; 12(12): 1389-94.
18. Blengio G, Coviello E, Michieletto F, Falcone S, Fedrizzi F, Saugo M. Valutazione dell’etero-geneità nei rischi relativi di mortalità per causa: un’applicazione ai Comuni dell’ULSS Alto Vicentino (decessi 1991-2000). Epidemiol Prev 2004; 28(2): 114-20.
19. Clayton D, Kaldor J. Empirical Bayes estimates of age-standardized relative risks for use in disease mapping. Biometrics 1987; 43(3): 671-81.
20. Kulldorff M. A spatial scan statistics. Communi-cations in Statistics. Theory and Methods 1997; 26(6): 1481-96.
21. Centro di Riferimento per l’Epidemiologia e la Prevenzione Oncologica in Piemonte (CPO Piemonte). Available from: http://www.cpo.it/it/ [Last accessed 2016 July 7].
22. Martuzzi M, Hills M. Estimating the degree of heterogeneity between event rates using likeli-hood. Am J Epidemiol 1995; 141(4): 369-74.
23. Biggeri A. Negative binomial distribution. In: Armitage P, Colton T, eds. Encyclopedia of

13Oncological incidence in paediatric and adolescent ages in Vercelli, Italy
Biostatistics. New York: Wiley & Sons, 1998: 101-17.
24. Spiegelhalter DJ, Thomas A, Best N, Lunn D. WinBUGS Version 1.4 Users Manual. Cam-bridge: MRC Biostatistics Unit, January 2003.
25. Lawson AB, Biggeri A, Boehning D, et al. Dis-ease mapping models: an empirical evaluation. Stat Med 2000; 19(17-18): 2217-41.
26. Trinca S, Musmeci L, Cadum E, et al. La situazio-ne ambientale e sanitaria della Pianura Vercellese: studio preliminare. Roma: Istituto Superiore di Sanità, 2006 (ISTISAN Congressi 4)
27. Feychting M, Svensson D, Ahlbom A. Exposure to motor vehicle exhaust and childhood cancer. Scand J Work Environ Health 1998; 24(1): 8-11.
28. Robinson AA. Leukaemia, a close association with vehicle travel. Med Hypotheses 1991; 36(2): 172-7.
29. Yang W, Peters JI, Williams RO 3rd. Inhaled nanoparticles- a current review. Int J Pharm 2008; 356(1-2): 239-47
30. Associazione Italiana Registri Tumori (AI-RTUM). Available from: http://www.registri-tumori.it/cms/ [Last accessed 2016 July 7].
31. Widory D. Nitrogen isotopes: tracers of origin
and processing affecting PM10 in the atmo-sphere of Paris. Atmos Environ 2007; 42(11): 2382-90.
32. Langholtz B, Ebi KE, Thomas DC, Peters JM, London SJ. Traffic density and the risk of child-hood leukaemia in a Los Angeles case-control study. Ann Epidemiol 2002; 12(7): 482-7.
33. Beelen R, Hoek G, van der Brandt P, et al. Long-term effects of traffic-related air pollution on mortality in a Dutch cohort (NLCS-Air Study). Environ Health Perspect 2008; 116(2): 196-202.
34. Besag J, York J, Mollie A. Bayesian image resto-ration, with two applications in spatial statistics. Ann Inst Statist Math 1991; 43(1): 1-59.
35. Roberts D, Redfearn A, Dockerty J. Health effects of landfill sites.Whether results are assertions or evidence is unclear. BMJ 2000; 320(7248): 1541-2.
36. Vineis P, Hoek G, Kryzanowski M, et al. Air pollu-tion and risk of lung cancer in a prospective study in Europe. Int J Cancer 2006; 119(1): 169-74.
37. Goldberg MS, DeWar R, Desy M, Riberdy H. Risk of developing cancer relative to living near a municipal solid waste landfill site in Montreal, Quebec, Canada. Arch Environ Health 1999; 54(4): 291-6.
Corresponding author: Dr. Christian Salerno, Department of Translational Medicine. University of Eastern Piedmont “Amedeo Avogadro”, Via Solaroli 17, 28100 Novara, Italye-mail: [email protected]