Embed Size (px)
Citation preview
NSW DEPARTMENT OF EDUCATION ILLAWARRA EEC
IEEC Geographical Toolkit A focus on fieldwork plus:
Maps
Spatial technologies
Visual representations
Surveys
Prepared for Geography Curriculum Networks Illawarra
!1
GEOGRAPHY CONTINUUMS K-10
PAGE 3
SPATIAL TECHNOLOGY & VISUAL DEPICTIONS
PAGE 7
Sometimes taking photos and leaving only footprints isn’t enough. Geography informs our
sense of place, perceptions of identity and connection with
culture and the environment.
Geography enables our predisposition and
capacity to act.
GEOGRAPHY
FIELDWORK TECHNIQUES & TOOLS
PAGE 14
NSW DEPARTMENT OF EDUCATION ILLAWARRA EEC
Geographical Tools Contents
!2
Illawarra Environmental
Education Centre
This resource sets out the range of geographical tools used by the Illawarra Environmental Education Centre. The IEEC provides experienced educators to work alongside Geography teachers and students in the use of these tools as they work through the inquiry process.
Geography K-10 Syllabus: interconnected continuums 3
Fieldwork - a fundamental geographical tool 4
Planning for Fieldwork 5
Illawarra Environmental Education Centre Fieldwork Snapshots 6
Geographical tools: spatial technologies - ST • vertical aerial photographs • Google Tour Builder
7
Geographical tools: visual representations - VR • sketch maps • oblique aerial • historic photographs • field sketching and photography • ground level photographs
10
Fieldwork techniques • beach profiles • transects
14
Physical factors and tests • temperature • humidity • sunlight intensity • wind speed • direction • slope • soil description • soil moisture • water salinity • soil pH • turbidity of water • organic matter in soil • soil salinity
16
Surveys - Fieldwork 29
Resources 30
Illawarra EEC contacts and booking inquiries 31
EZEC NSW Environmental and Zoo Education Centres 32
NSW DEPARTMENT OF EDUCATION ILLAWARRA EEC
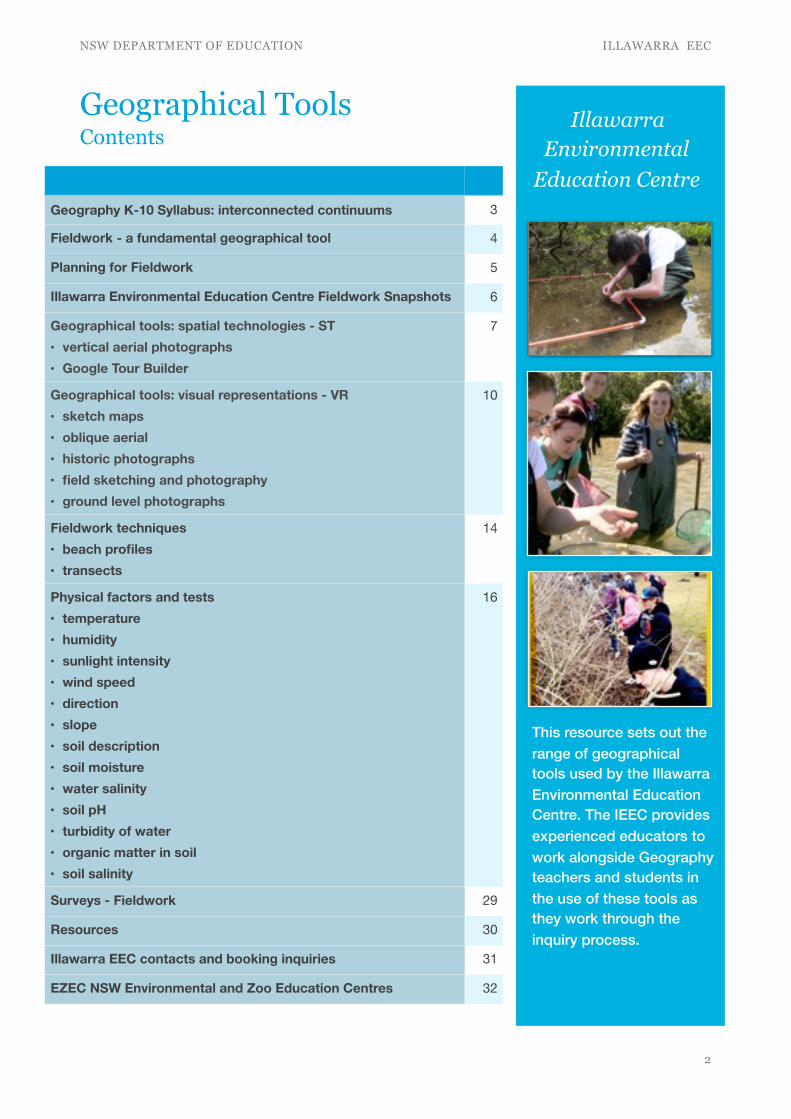
Geography K-10 Syllabus - interconnected continuums Syllabus overview
!3
Geographical concepts
Place
Space
Environment
Interconnection
Scale
Sustainability
Change
Geographical inquiry skills
Acquiring
geographical
information
Processing
geographical
information
Communicating
geographical
information
Geographical tools
Visual representations
Spatial technologies
Maps
Fieldwork
Graphs & statistics
Thinking
geographically
Working
geographically
Geographical literacy & geographical skill sets
Informed, responsible & active citizens
“I’m increasingly mindful of the degree to which geography, distance and weather have moulded my sensory palate, my imagination and expectations”.
Tim Winton, 2015, Island Home : a landscape memoirThis model is an adaptation based on Dr Grant Kleeman, Macquarie University presentation Canberra Geography Roadshow Nov. 2015.
NSW DEPARTMENT OF EDUCATION ILLAWARRA EEC
Fieldwork - a fundamental geographical tool (a syllabus extract)
Fieldwork is an integral and mandatory part of the study of Geography as it facilitates an understanding of geographical processes and geographical inquiry. Fieldwork can enhance learning opportunities for all students because it caters for a variety of teaching and learning approaches. The enjoyable experience of active engagement in fieldwork helps to create and nurture a lifelong interest in and enthusiasm for the world students live in.
Fieldwork involves observing, measuring, collecting and recording information outside the classroom. Fieldwork can be undertaken within the school grounds, around local neighbouring areas or at more distant locations. In some instances it may be necessary to use information and communication technology to undertake virtual fieldwork. Where fieldwork is proposed for Aboriginal and/or Torres Strait Islander sites, participants should be familiar with protocols for working with Aboriginal communities and ensure appropriate consultation with local communities and education consultants occurs.
Fieldwork enables students to:
• acquire knowledge about environments by observing, mapping, measuring and recording phenomena in the real world in a variety of places, including the school
• explore geographical processes that form and transform environments
• use a range of geographical tools to assist in the interpretation of, and decision-making about, geographical phenomena
• locate, select, organise and communicate geographical information
• explore different perspectives on geographical issues.
Fieldwork activities should be carefully planned to achieve syllabus outcomes. Fieldwork activities should be integrated with the teaching and learning program to take full advantage of the enhanced understanding that can be achieved through direct observation, field measurements and inquiry learning. Fieldwork activities may be specific to a topic or may be integrated across the Geography curriculum.
Students must undertake and participate in fieldwork in each Stage of learning. In the early years of learning students should be guided to observe their local area such as weather and vegetation or interviewing family and community members about connections to other places.
There will be an increasing emphasis on independent observation and analysis of data in Stages 4–5. There are many opportunities for fieldwork in Stages 4–5 such as investigating geomorphic processes that create local landscapes, investigating the characteristics of a local place or observing aspects of human-induced environmental changes that challenge sustainability in local or regional landscapes.
BOSTES, 2015 Geography K-10 Syllabus, page 32
!4
NSW DEPARTMENT OF EDUCATION ILLAWARRA EEC
!5
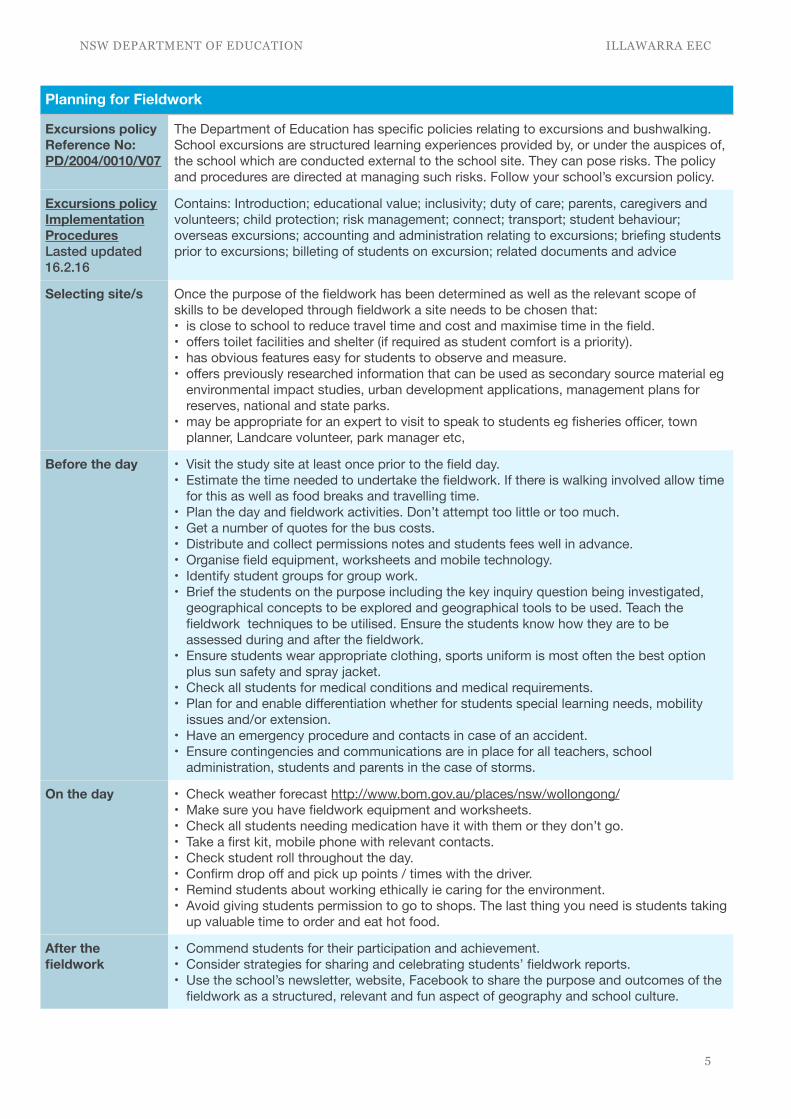
Planning for Fieldwork
Excursions policy Reference No: PD/2004/0010/V07
The Department of Education has specific policies relating to excursions and bushwalking. School excursions are structured learning experiences provided by, or under the auspices of, the school which are conducted external to the school site. They can pose risks. The policy and procedures are directed at managing such risks. Follow your school’s excursion policy.
Excursions policy Implementation Procedures Lasted updated 16.2.16
Contains: Introduction; educational value; inclusivity; duty of care; parents, caregivers and volunteers; child protection; risk management; connect; transport; student behaviour; overseas excursions; accounting and administration relating to excursions; briefing students prior to excursions; billeting of students on excursion; related documents and advice
Selecting site/s Once the purpose of the fieldwork has been determined as well as the relevant scope of skills to be developed through fieldwork a site needs to be chosen that:• is close to school to reduce travel time and cost and maximise time in the field.• offers toilet facilities and shelter (if required as student comfort is a priority).• has obvious features easy for students to observe and measure.• offers previously researched information that can be used as secondary source material eg
environmental impact studies, urban development applications, management plans for reserves, national and state parks.
• may be appropriate for an expert to visit to speak to students eg fisheries officer, town planner, Landcare volunteer, park manager etc,
Before the day • Visit the study site at least once prior to the field day.• Estimate the time needed to undertake the fieldwork. If there is walking involved allow time
for this as well as food breaks and travelling time.• Plan the day and fieldwork activities. Don’t attempt too little or too much.• Get a number of quotes for the bus costs.• Distribute and collect permissions notes and students fees well in advance.• Organise field equipment, worksheets and mobile technology.• Identify student groups for group work.• Brief the students on the purpose including the key inquiry question being investigated,
geographical concepts to be explored and geographical tools to be used. Teach the fieldwork techniques to be utilised. Ensure the students know how they are to be assessed during and after the fieldwork.
• Ensure students wear appropriate clothing, sports uniform is most often the best option plus sun safety and spray jacket.
• Check all students for medical conditions and medical requirements.• Plan for and enable differentiation whether for students special learning needs, mobility
issues and/or extension. • Have an emergency procedure and contacts in case of an accident.• Ensure contingencies and communications are in place for all teachers, school
administration, students and parents in the case of storms.
On the day • Check weather forecast http://www.bom.gov.au/places/nsw/wollongong/• Make sure you have fieldwork equipment and worksheets.• Check all students needing medication have it with them or they don’t go.• Take a first kit, mobile phone with relevant contacts.• Check student roll throughout the day.• Confirm drop off and pick up points / times with the driver.• Remind students about working ethically ie caring for the environment.• Avoid giving students permission to go to shops. The last thing you need is students taking
up valuable time to order and eat hot food.
After the fieldwork
• Commend students for their participation and achievement.• Consider strategies for sharing and celebrating students’ fieldwork reports.• Use the school’s newsletter, website, Facebook to share the purpose and outcomes of the
fieldwork as a structured, relevant and fun aspect of geography and school culture.
NSW DEPARTMENT OF EDUCATION ILLAWARRA EEC
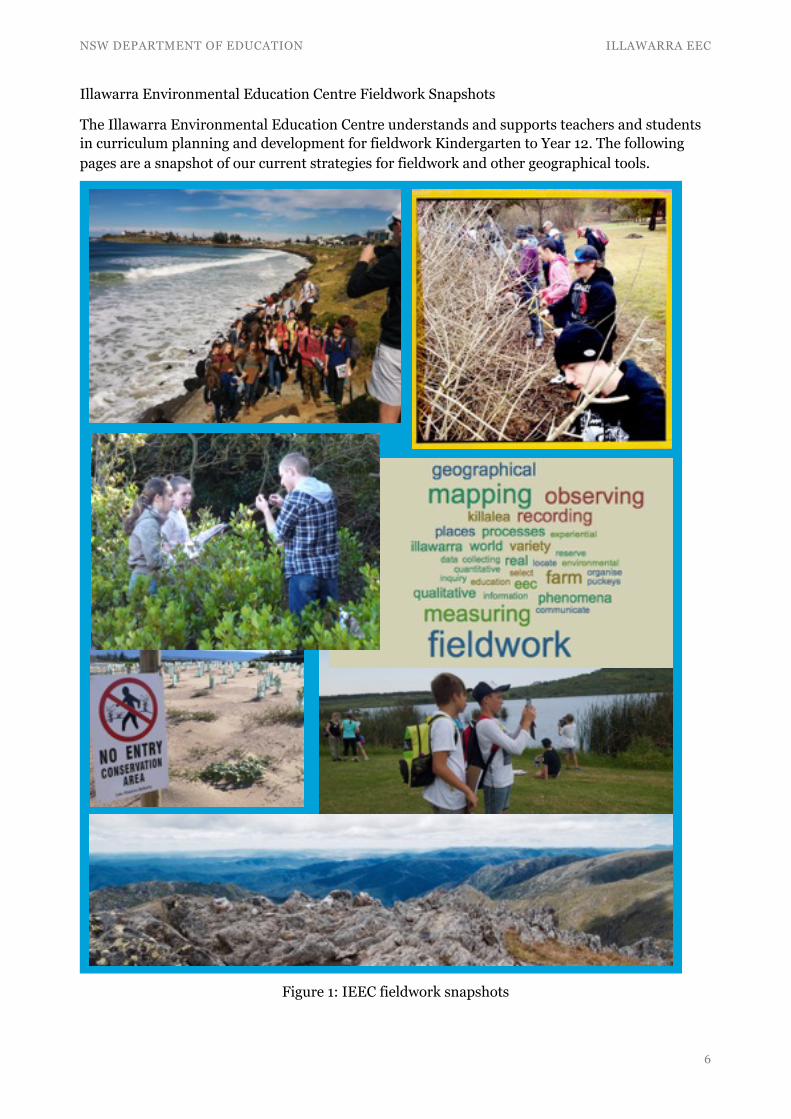
Illawarra Environmental Education Centre Fieldwork Snapshots
The Illawarra Environmental Education Centre understands and supports teachers and students in curriculum planning and development for fieldwork Kindergarten to Year 12. The following pages are a snapshot of our current strategies for fieldwork and other geographical tools.
Figure 1: IEEC fieldwork snapshots
!6
NSW DEPARTMENT OF EDUCATION ILLAWARRA EEC
Geographical Tools
Spatial Technologies - ST
Spatial technologies include any software or hardware that interacts with real world locations. Examples include, but are not limited to, virtual maps, satellite images, global positioning systems (GPS), geographic information systems (GIS), remote sensing and augmented reality. (Reference: BOSTES, 2015 Geography K-10 Syllabus, page 33)
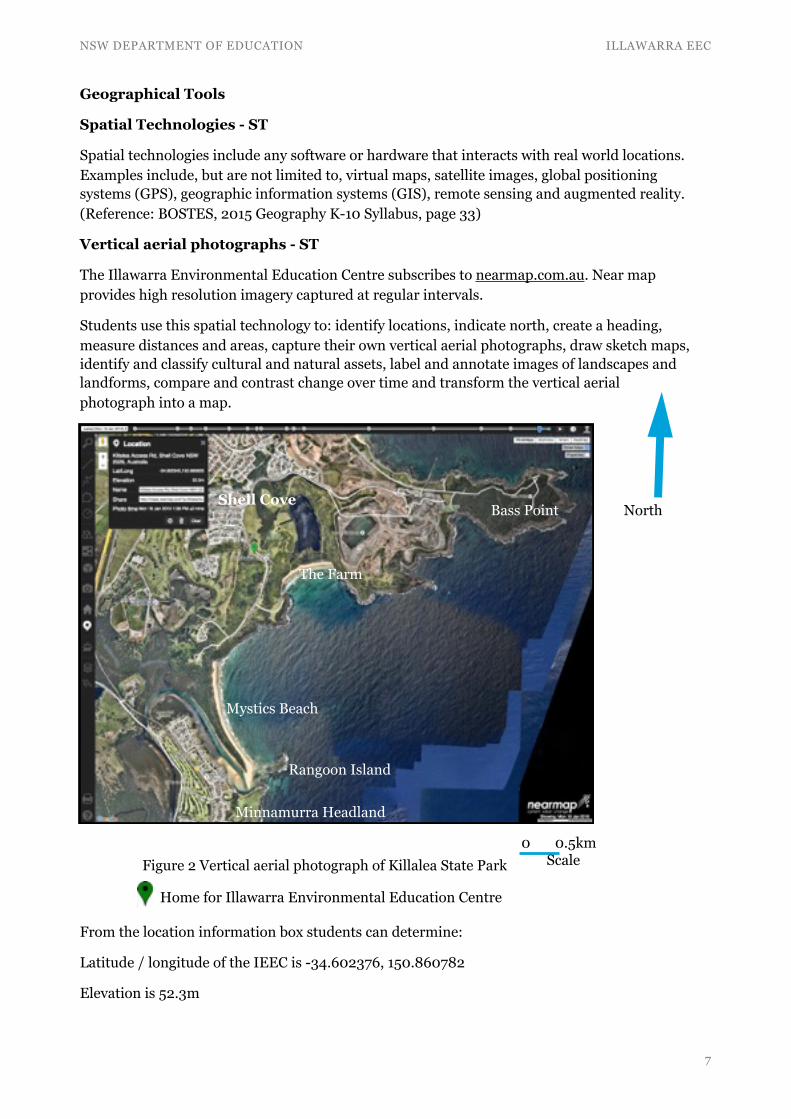
Vertical aerial photographs - ST
The Illawarra Environmental Education Centre subscribes to nearmap.com.au. Near map provides high resolution imagery captured at regular intervals.
Students use this spatial technology to: identify locations, indicate north, create a heading, measure distances and areas, capture their own vertical aerial photographs, draw sketch maps, identify and classify cultural and natural assets, label and annotate images of landscapes and landforms, compare and contrast change over time and transform the vertical aerial photograph into a map.
From the location information box students can determine:
Latitude / longitude of the IEEC is -34.602376, 150.860782
Elevation is 52.3m
!7
Figure 2 Vertical aerial photograph of Killalea State Park
Home for Illawarra Environmental Education Centre
Shell Cove
The Farm
Rangoon Island
Mystics Beach
Minnamurra Headland
Bass Point North
0 0.5km Scale
NSW DEPARTMENT OF EDUCATION ILLAWARRA EEC
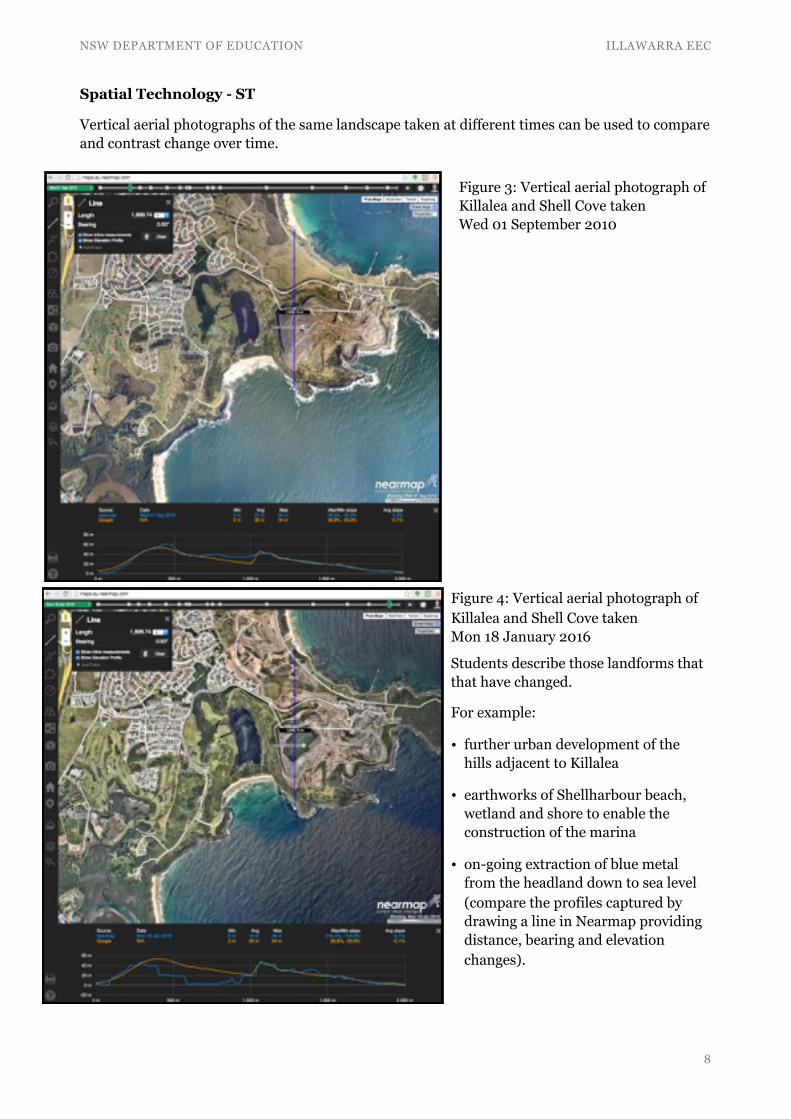
Spatial Technology - ST
Vertical aerial photographs of the same landscape taken at different times can be used to compare and contrast change over time.
!8
Figure 3: Vertical aerial photograph of Killalea and Shell Cove taken Wed 01 September 2010
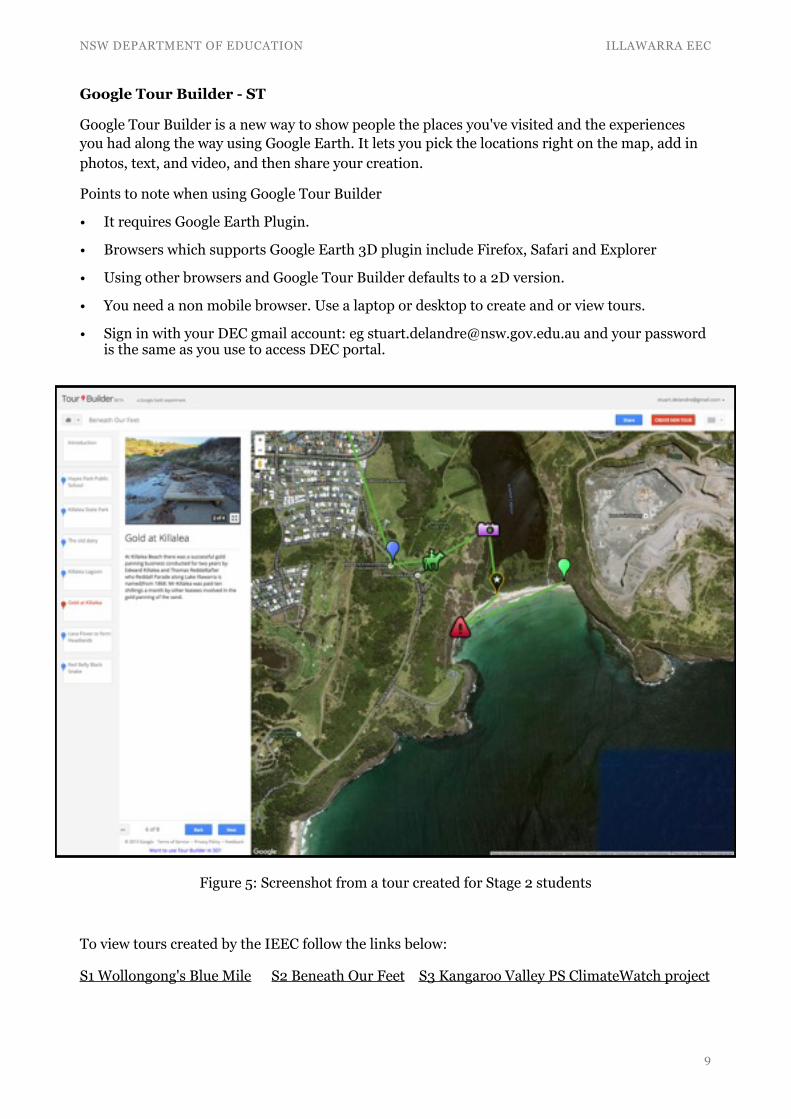
Figure 4: Vertical aerial photograph of Killalea and Shell Cove taken Mon 18 January 2016
Students describe those landforms that that have changed.
For example:
• further urban development of the hills adjacent to Killalea
• earthworks of Shellharbour beach, wetland and shore to enable the construction of the marina
• on-going extraction of blue metal from the headland down to sea level (compare the profiles captured by drawing a line in Nearmap providing distance, bearing and elevation changes).
NSW DEPARTMENT OF EDUCATION ILLAWARRA EEC
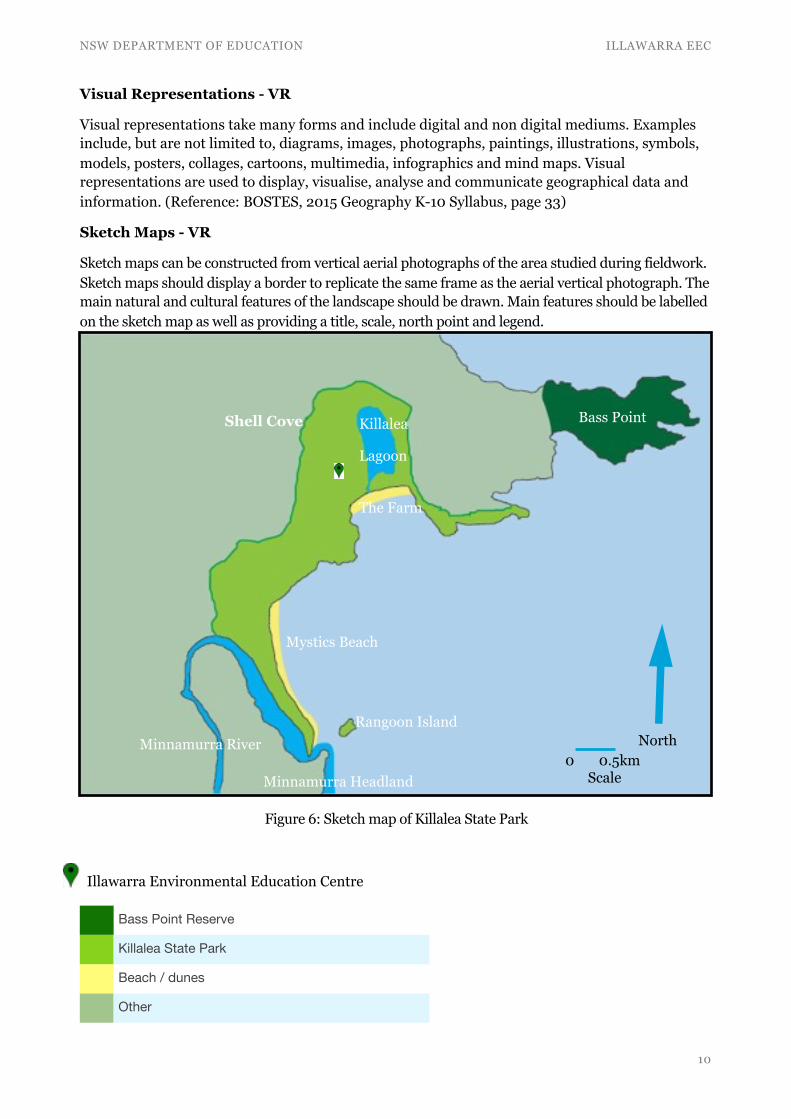
Google Tour Builder - ST
Google Tour Builder is a new way to show people the places you've visited and the experiences you had along the way using Google Earth. It lets you pick the locations right on the map, add in photos, text, and video, and then share your creation.
Points to note when using Google Tour Builder
• It requires Google Earth Plugin.
• Browsers which supports Google Earth 3D plugin include Firefox, Safari and Explorer
• Using other browsers and Google Tour Builder defaults to a 2D version.
• You need a non mobile browser. Use a laptop or desktop to create and or view tours.
• Sign in with your DEC gmail account: eg [email protected] and your password is the same as you use to access DEC portal.
Figure 5: Screenshot from a tour created for Stage 2 students
To view tours created by the IEEC follow the links below:
S1 Wollongong's Blue Mile S2 Beneath Our Feet S3 Kangaroo Valley PS ClimateWatch project
!9
NSW DEPARTMENT OF EDUCATION ILLAWARRA EEC
Visual Representations - VR
Visual representations take many forms and include digital and non digital mediums. Examples include, but are not limited to, diagrams, images, photographs, paintings, illustrations, symbols, models, posters, collages, cartoons, multimedia, infographics and mind maps. Visual representations are used to display, visualise, analyse and communicate geographical data and information. (Reference: BOSTES, 2015 Geography K-10 Syllabus, page 33)
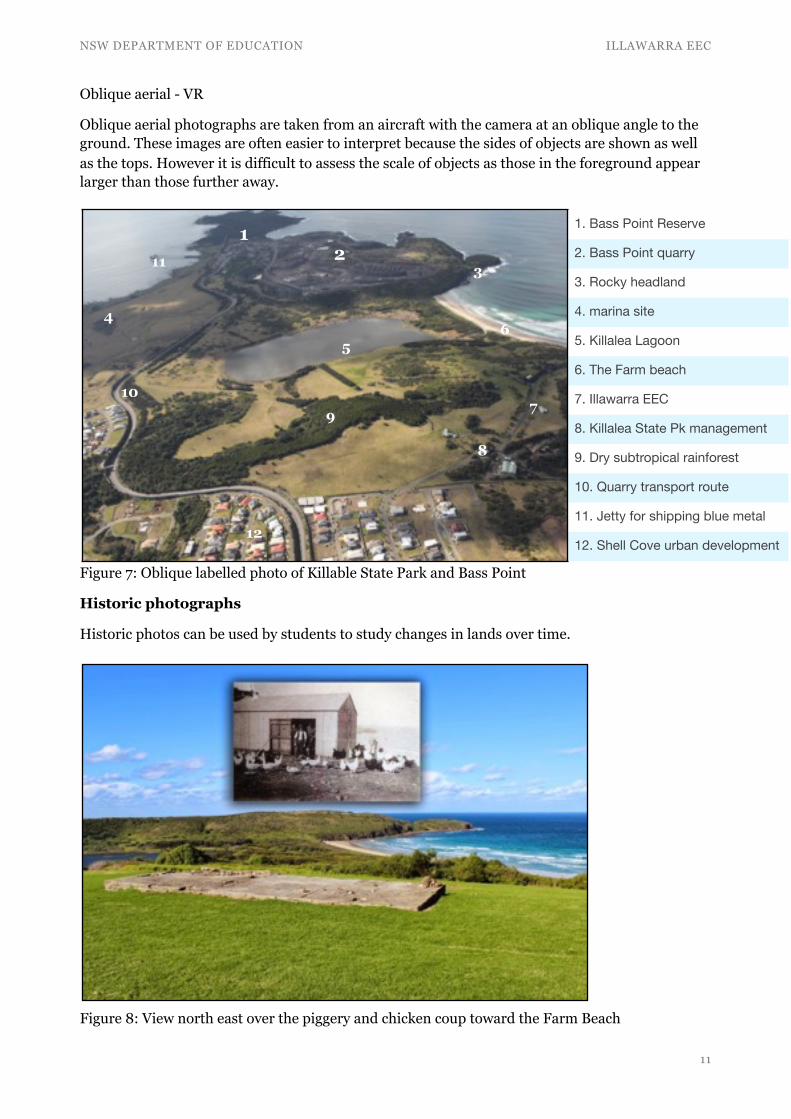
Sketch Maps - VR
Sketch maps can be constructed from vertical aerial photographs of the area studied during fieldwork. Sketch maps should display a border to replicate the same frame as the aerial vertical photograph. The main natural and cultural features of the landscape should be drawn. Main features should be labelled on the sketch map as well as providing a title, scale, north point and legend.
Figure 6: Sketch map of Killalea State Park
Illawarra Environmental Education Centre
Bass Point Reserve
Killalea State Park
Beach / dunes
Other
!10
Shell Cove Bass Point
The Farm
Mystics Beach
Rangoon Island
Minnamurra Headland
Minnamurra River
Killalea
Lagoon
North0 0.5km
Scale
NSW DEPARTMENT OF EDUCATION ILLAWARRA EEC
Oblique aerial - VR
Oblique aerial photographs are taken from an aircraft with the camera at an oblique angle to the ground. These images are often easier to interpret because the sides of objects are shown as well as the tops. However it is difficult to assess the scale of objects as those in the foreground appear larger than those further away.
Figure 7: Oblique labelled photo of Killable State Park and Bass Point
Historic photographs
Historic photos can be used by students to study changes in lands over time.
Figure 8: View north east over the piggery and chicken coup toward the Farm Beach
!113
5
1. Bass Point Reserve
2. Bass Point quarry
3. Rocky headland
4. marina site
5. Killalea Lagoon
6. The Farm beach
7. Illawarra EEC
8. Killalea State Pk management
9. Dry subtropical rainforest
10. Quarry transport route
11. Jetty for shipping blue metal
12. Shell Cove urban development
12
3
5
10
12
6
9
8
11
4
7
NSW DEPARTMENT OF EDUCATION ILLAWARRA EEC
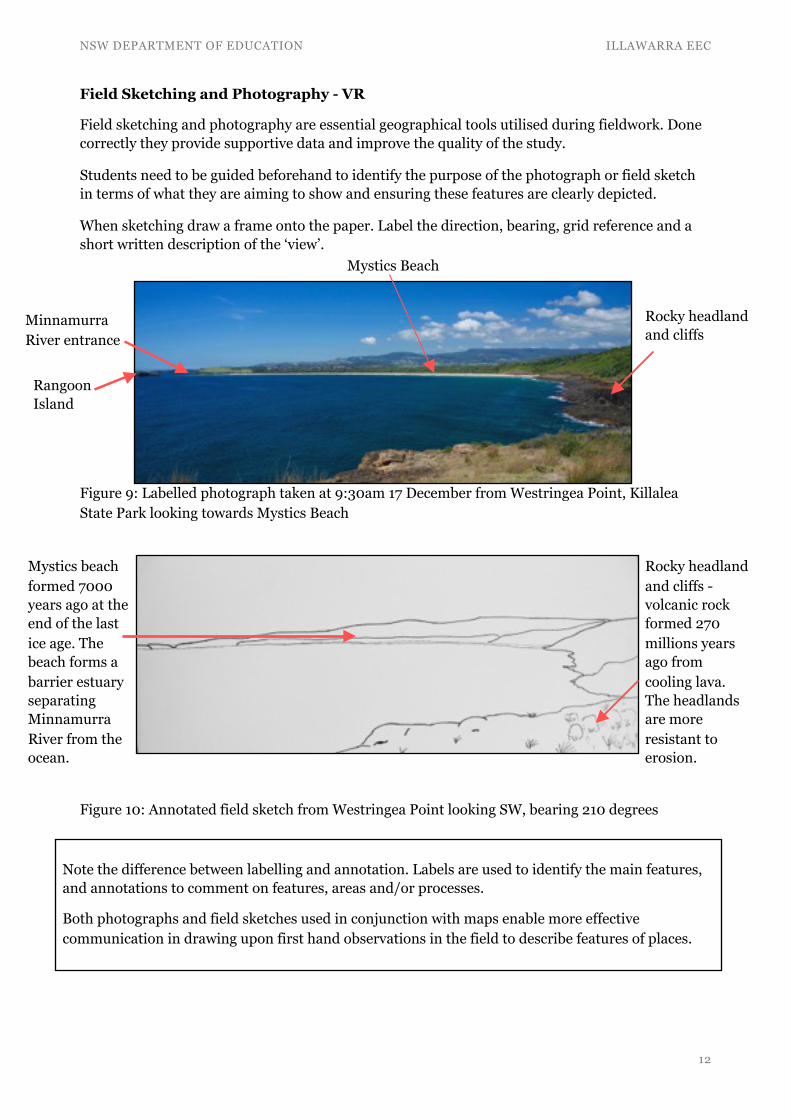
Field Sketching and Photography - VR
Field sketching and photography are essential geographical tools utilised during fieldwork. Done correctly they provide supportive data and improve the quality of the study.
Students need to be guided beforehand to identify the purpose of the photograph or field sketch in terms of what they are aiming to show and ensuring these features are clearly depicted.
When sketching draw a frame onto the paper. Label the direction, bearing, grid reference and a short written description of the ‘view’.
Figure 9: Labelled photograph taken at 9:30am 17 December from Westringea Point, Killalea State Park looking towards Mystics Beach
Figure 10: Annotated field sketch from Westringea Point looking SW, bearing 210 degrees
!12
Note the difference between labelling and annotation. Labels are used to identify the main features, and annotations to comment on features, areas and/or processes.
Both photographs and field sketches used in conjunction with maps enable more effective communication in drawing upon first hand observations in the field to describe features of places.
Rocky headland and cliffs
Mystics Beach
Minnamurra River entrance
Rangoon Island
Rocky headland and cliffs - volcanic rock formed 270 millions years ago from cooling lava. The headlands are more resistant to erosion.
Mystics beach formed 7000 years ago at the end of the last ice age. The beach forms a barrier estuary separating Minnamurra River from the ocean.
NSW DEPARTMENT OF EDUCATION ILLAWARRA EEC
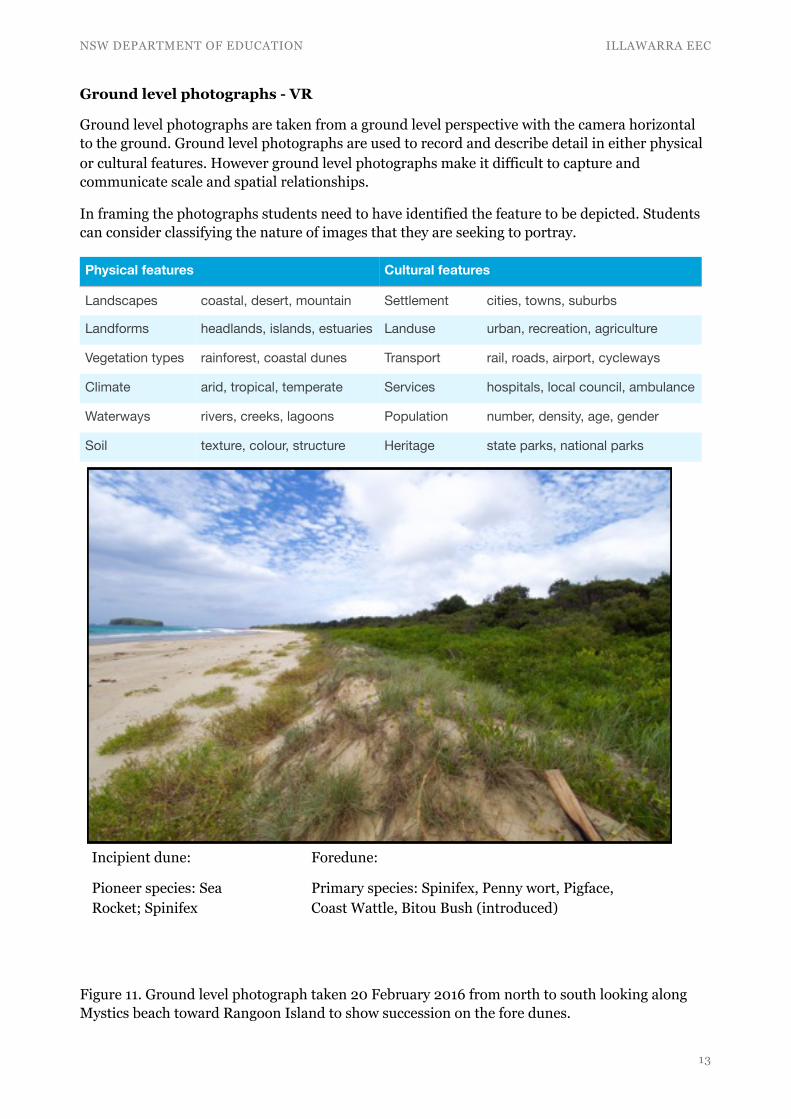
Ground level photographs - VR
Ground level photographs are taken from a ground level perspective with the camera horizontal to the ground. Ground level photographs are used to record and describe detail in either physical or cultural features. However ground level photographs make it difficult to capture and communicate scale and spatial relationships.
In framing the photographs students need to have identified the feature to be depicted. Students can consider classifying the nature of images that they are seeking to portray.
Figure 11. Ground level photograph taken 20 February 2016 from north to south looking along Mystics beach toward Rangoon Island to show succession on the fore dunes.
Physical features Cultural features
Landscapes coastal, desert, mountain Settlement cities, towns, suburbs
Landforms headlands, islands, estuaries Landuse urban, recreation, agriculture
Vegetation types rainforest, coastal dunes Transport rail, roads, airport, cycleways
Climate arid, tropical, temperate Services hospitals, local council, ambulance
Waterways rivers, creeks, lagoons Population number, density, age, gender
Soil texture, colour, structure Heritage state parks, national parks
!13
Incipient dune:
Pioneer species: Sea Rocket; Spinifex
Foredune:
Primary species: Spinifex, Penny wort, Pigface, Coast Wattle, Bitou Bush (introduced)
NSW DEPARTMENT OF EDUCATION ILLAWARRA EEC
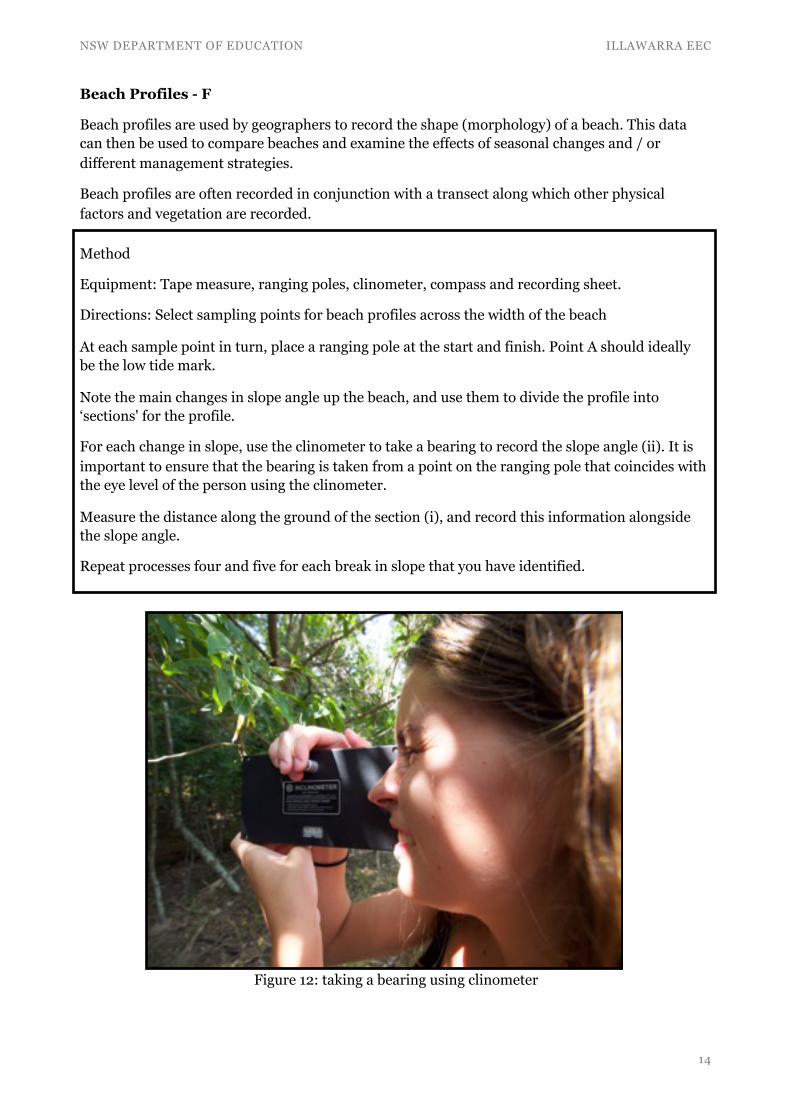
Beach Profiles - F
Beach profiles are used by geographers to record the shape (morphology) of a beach. This data can then be used to compare beaches and examine the effects of seasonal changes and / or different management strategies.
Beach profiles are often recorded in conjunction with a transect along which other physical factors and vegetation are recorded.
Figure 12: taking a bearing using clinometer
!14
Method
Equipment: Tape measure, ranging poles, clinometer, compass and recording sheet.
Directions: Select sampling points for beach profiles across the width of the beach
At each sample point in turn, place a ranging pole at the start and finish. Point A should ideally be the low tide mark.
Note the main changes in slope angle up the beach, and use them to divide the profile into ‘sections' for the profile.
For each change in slope, use the clinometer to take a bearing to record the slope angle (ii). It is important to ensure that the bearing is taken from a point on the ranging pole that coincides with the eye level of the person using the clinometer.
Measure the distance along the ground of the section (i), and record this information alongside the slope angle.
Repeat processes four and five for each break in slope that you have identified.
NSW DEPARTMENT OF EDUCATION ILLAWARRA EEC
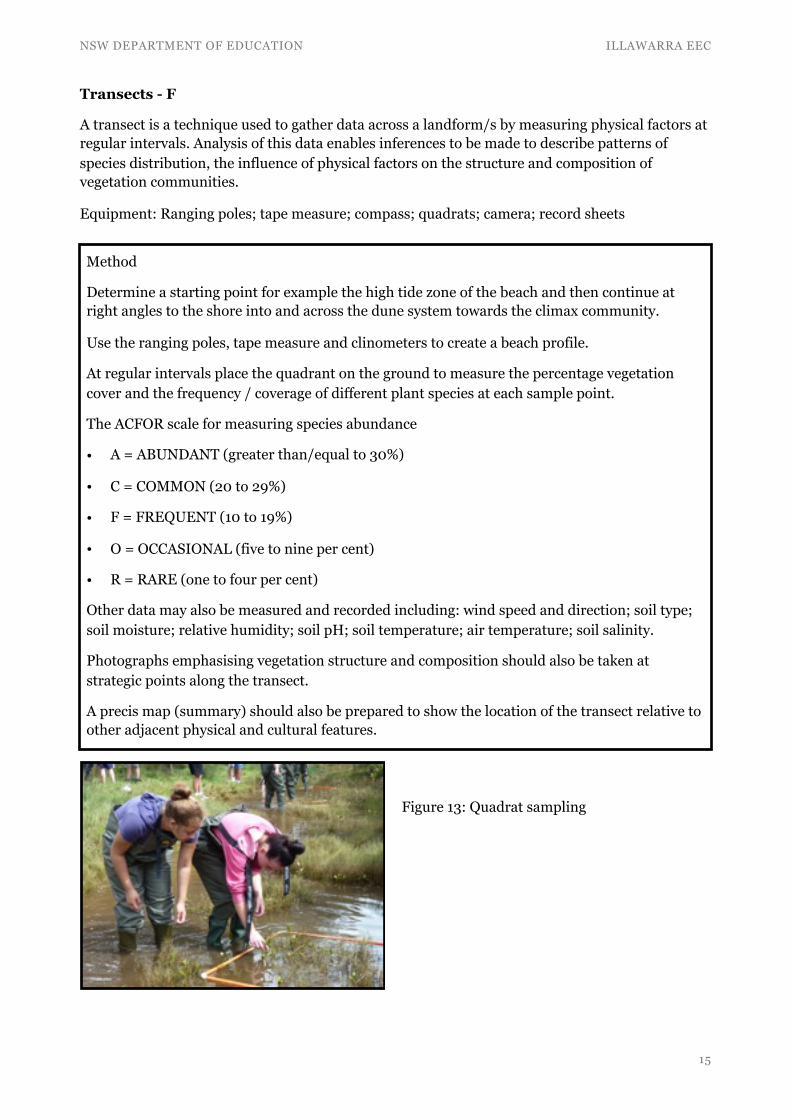
Transects - F
A transect is a technique used to gather data across a landform/s by measuring physical factors at regular intervals. Analysis of this data enables inferences to be made to describe patterns of species distribution, the influence of physical factors on the structure and composition of vegetation communities.
Equipment: Ranging poles; tape measure; compass; quadrats; camera; record sheets
Figure 13: Quadrat sampling
!15
Method
Determine a starting point for example the high tide zone of the beach and then continue at right angles to the shore into and across the dune system towards the climax community.
Use the ranging poles, tape measure and clinometers to create a beach profile.
At regular intervals place the quadrant on the ground to measure the percentage vegetation cover and the frequency / coverage of different plant species at each sample point.
The ACFOR scale for measuring species abundance
• A = ABUNDANT (greater than/equal to 30%)
• C = COMMON (20 to 29%)
• F = FREQUENT (10 to 19%)
• O = OCCASIONAL (five to nine per cent)
• R = RARE (one to four per cent)
Other data may also be measured and recorded including: wind speed and direction; soil type; soil moisture; relative humidity; soil pH; soil temperature; air temperature; soil salinity.
Photographs emphasising vegetation structure and composition should also be taken at strategic points along the transect.
A precis map (summary) should also be prepared to show the location of the transect relative to other adjacent physical and cultural features.
NSW DEPARTMENT OF EDUCATION ILLAWARRA EEC
Physical Factors and tests - F
As within all ecosystems, the physical factors within the environment are the limiting factors controlling the growth, abundance and distribution of all organisms. Geographers measure physical factors to understand the complex relationship between organisms and their habitat.
Measuring, recording and analysing quantitative data about physical factors by isolating and measuring one factor at a time enables geographers to unpack the complexity of interrelationships between lithosphere, atmosphere, biosphere and hydrosphere.
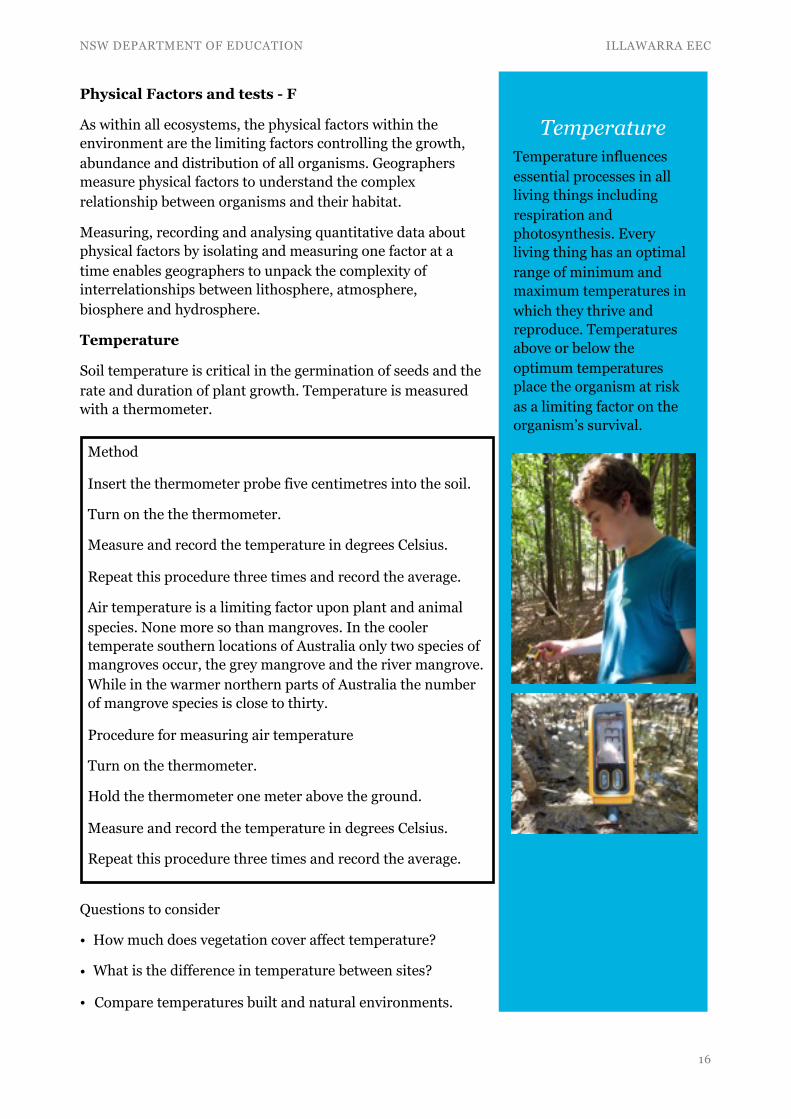
Temperature
Soil temperature is critical in the germination of seeds and the rate and duration of plant growth. Temperature is measured with a thermometer.
Questions to consider
• How much does vegetation cover affect temperature?
• What is the difference in temperature between sites?
• Compare temperatures built and natural environments.
!16
Temperature Temperature influences essential processes in all living things including respiration and photosynthesis. Every living thing has an optimal range of minimum and maximum temperatures in which they thrive and reproduce. Temperatures above or below the optimum temperatures place the organism at risk as a limiting factor on the organism’s survival.
Method
Insert the thermometer probe five centimetres into the soil.
Turn on the the thermometer.
Measure and record the temperature in degrees Celsius.
Repeat this procedure three times and record the average.
Air temperature is a limiting factor upon plant and animal species. None more so than mangroves. In the cooler temperate southern locations of Australia only two species of mangroves occur, the grey mangrove and the river mangrove. While in the warmer northern parts of Australia the number of mangrove species is close to thirty.
Procedure for measuring air temperature
Turn on the thermometer.
Hold the thermometer one meter above the ground.
Measure and record the temperature in degrees Celsius.
Repeat this procedure three times and record the average.
NSW DEPARTMENT OF EDUCATION ILLAWARRA EEC
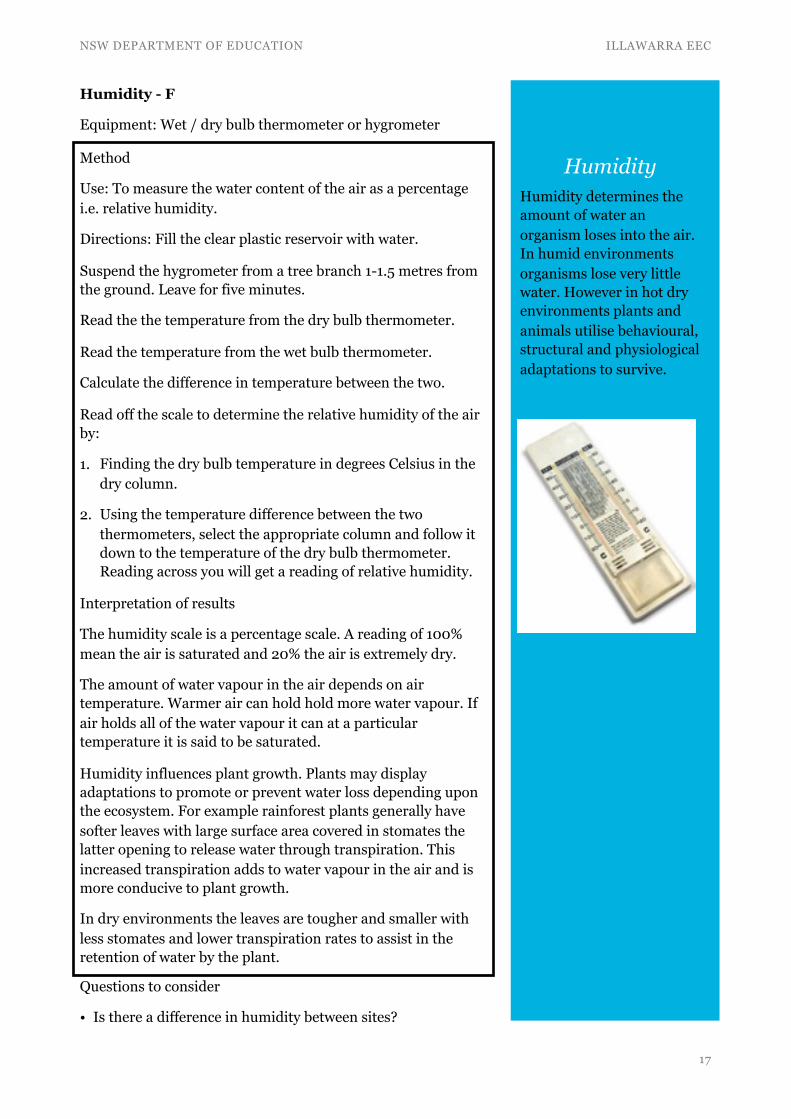
Humidity - F
Equipment: Wet / dry bulb thermometer or hygrometer
Questions to consider
• Is there a difference in humidity between sites?
!17
Method
Use: To measure the water content of the air as a percentage i.e. relative humidity.
Directions: Fill the clear plastic reservoir with water.
Suspend the hygrometer from a tree branch 1-1.5 metres from the ground. Leave for five minutes.
Read the the temperature from the dry bulb thermometer.
Read the temperature from the wet bulb thermometer.
Calculate the difference in temperature between the two.
Read off the scale to determine the relative humidity of the air by:
1. Finding the dry bulb temperature in degrees Celsius in the dry column.
2. Using the temperature difference between the two thermometers, select the appropriate column and follow it down to the temperature of the dry bulb thermometer. Reading across you will get a reading of relative humidity.
Interpretation of results
The humidity scale is a percentage scale. A reading of 100% mean the air is saturated and 20% the air is extremely dry.
The amount of water vapour in the air depends on air temperature. Warmer air can hold hold more water vapour. If air holds all of the water vapour it can at a particular temperature it is said to be saturated.
Humidity influences plant growth. Plants may display adaptations to promote or prevent water loss depending upon the ecosystem. For example rainforest plants generally have softer leaves with large surface area covered in stomates the latter opening to release water through transpiration. This increased transpiration adds to water vapour in the air and is more conducive to plant growth.
In dry environments the leaves are tougher and smaller with less stomates and lower transpiration rates to assist in the retention of water by the plant.
Humidity Humidity determines the amount of water an organism loses into the air. In humid environments organisms lose very little water. However in hot dry environments plants and animals utilise behavioural, structural and physiological adaptations to survive.
NSW DEPARTMENT OF EDUCATION ILLAWARRA EEC
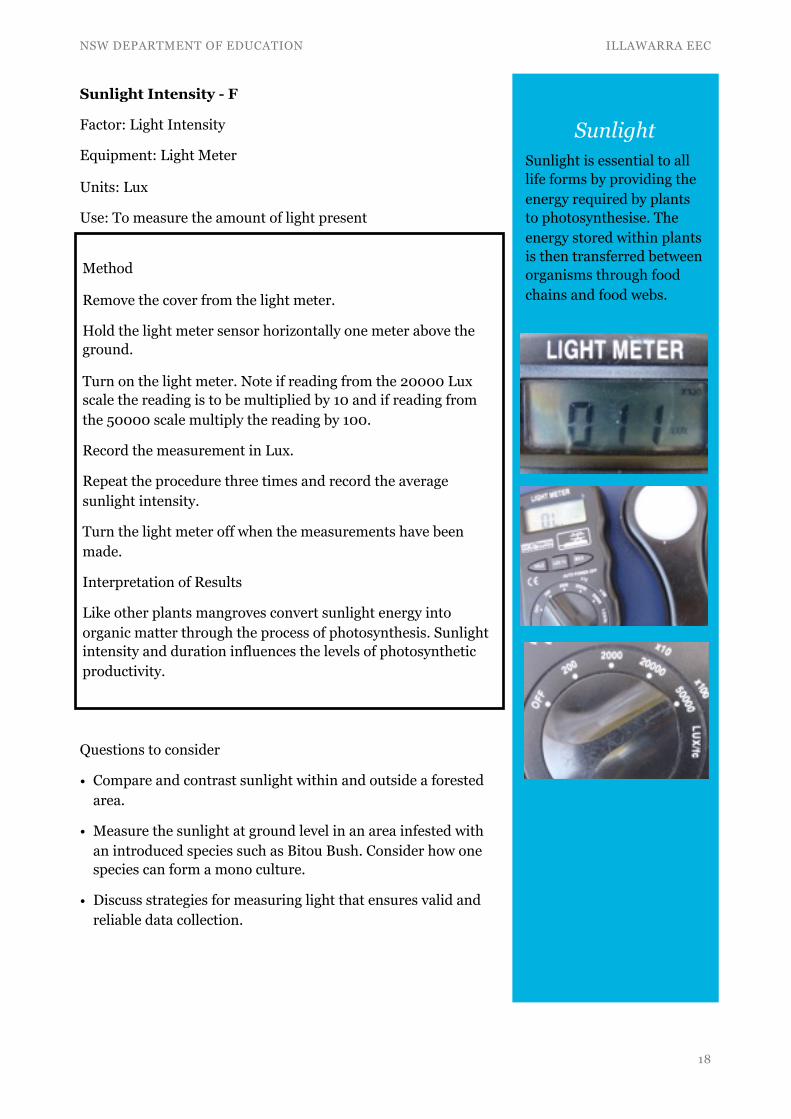
Sunlight Intensity - F
Factor: Light Intensity
Equipment: Light Meter
Units: Lux
Use: To measure the amount of light present
Questions to consider
• Compare and contrast sunlight within and outside a forested area.
• Measure the sunlight at ground level in an area infested with an introduced species such as Bitou Bush. Consider how one species can form a mono culture.
• Discuss strategies for measuring light that ensures valid and reliable data collection.
!18
Method
Remove the cover from the light meter.
Hold the light meter sensor horizontally one meter above the ground.
Turn on the light meter. Note if reading from the 20000 Lux scale the reading is to be multiplied by 10 and if reading from the 50000 scale multiply the reading by 100.
Record the measurement in Lux.
Repeat the procedure three times and record the average sunlight intensity.
Turn the light meter off when the measurements have been made.
Interpretation of Results
Like other plants mangroves convert sunlight energy into organic matter through the process of photosynthesis. Sunlight intensity and duration influences the levels of photosynthetic productivity.
Sunlight Sunlight is essential to all life forms by providing the energy required by plants to photosynthesise. The energy stored within plants is then transferred between organisms through food chains and food webs.
NSW DEPARTMENT OF EDUCATION ILLAWARRA EEC
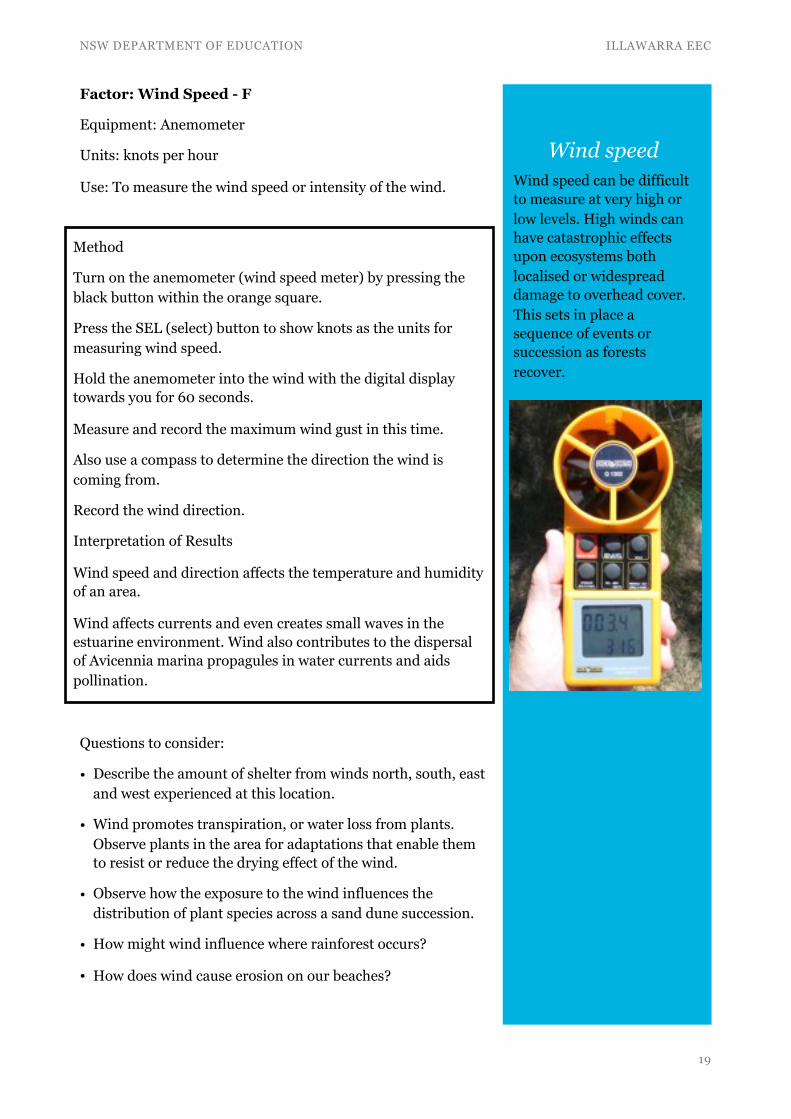
Factor: Wind Speed - F
Equipment: Anemometer
Units: knots per hour
Use: To measure the wind speed or intensity of the wind.
Questions to consider:
• Describe the amount of shelter from winds north, south, east and west experienced at this location.
• Wind promotes transpiration, or water loss from plants. Observe plants in the area for adaptations that enable them to resist or reduce the drying effect of the wind.
• Observe how the exposure to the wind influences the distribution of plant species across a sand dune succession.
• How might wind influence where rainforest occurs?
• How does wind cause erosion on our beaches?
!19
Method
Turn on the anemometer (wind speed meter) by pressing the black button within the orange square.
Press the SEL (select) button to show knots as the units for measuring wind speed.
Hold the anemometer into the wind with the digital display towards you for 60 seconds.
Measure and record the maximum wind gust in this time.
Also use a compass to determine the direction the wind is coming from.
Record the wind direction.
Interpretation of Results
Wind speed and direction affects the temperature and humidity of an area.
Wind affects currents and even creates small waves in the estuarine environment. Wind also contributes to the dispersal of Avicennia marina propagules in water currents and aids pollination.
Wind speed Wind speed can be difficult to measure at very high or low levels. High winds can have catastrophic effects upon ecosystems both localised or widespread damage to overhead cover. This sets in place a sequence of events or succession as forests recover.
NSW DEPARTMENT OF EDUCATION ILLAWARRA EEC
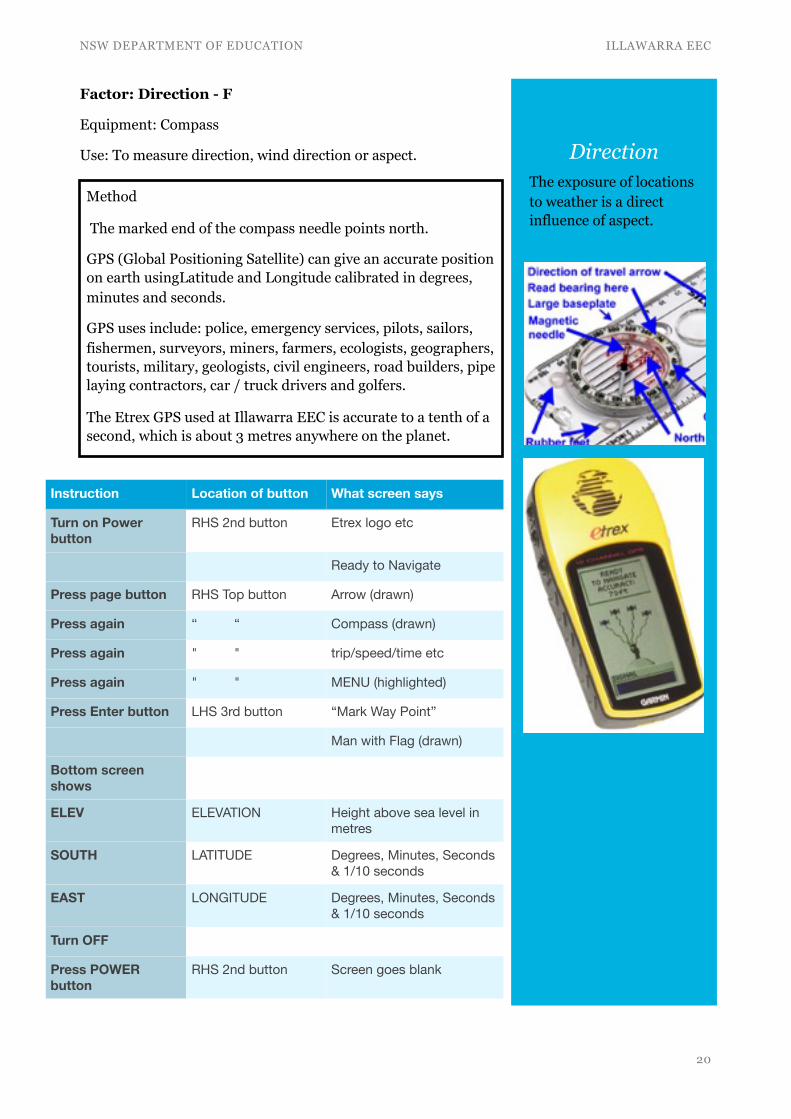
Factor: Direction - F
Equipment: Compass
Use: To measure direction, wind direction or aspect.
!20
Method
The marked end of the compass needle points north.
GPS (Global Positioning Satellite) can give an accurate position on earth usingLatitude and Longitude calibrated in degrees, minutes and seconds.
GPS uses include: police, emergency services, pilots, sailors, fishermen, surveyors, miners, farmers, ecologists, geographers, tourists, military, geologists, civil engineers, road builders, pipe laying contractors, car / truck drivers and golfers.
The Etrex GPS used at Illawarra EEC is accurate to a tenth of a second, which is about 3 metres anywhere on the planet.
Instruction Location of button What screen says
Turn on Power button
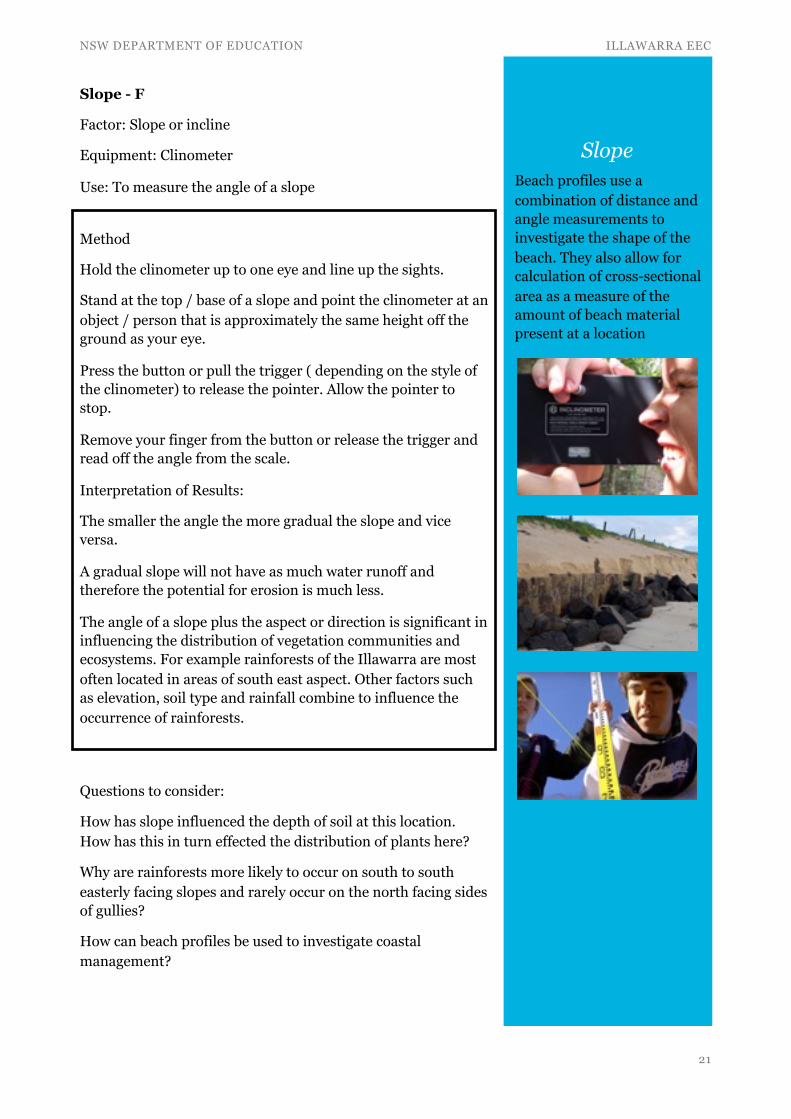
RHS 2nd button Etrex logo etc
Ready to Navigate
Press page button RHS Top button Arrow (drawn)
Press again “ “ Compass (drawn)
Press again " " trip/speed/time etc
Press again " " MENU (highlighted)
Press Enter button LHS 3rd button “Mark Way Point”
Man with Flag (drawn)
Bottom screen shows
ELEV ELEVATION Height above sea level in metres
SOUTH LATITUDE Degrees, Minutes, Seconds & 1/10 seconds
EAST LONGITUDE Degrees, Minutes, Seconds & 1/10 seconds
Turn OFF
Press POWER button
RHS 2nd button Screen goes blank
Direction The exposure of locations to weather is a direct influence of aspect.
NSW DEPARTMENT OF EDUCATION ILLAWARRA EEC
Slope - F
Factor: Slope or incline
Equipment: Clinometer
Use: To measure the angle of a slope
Questions to consider:
How has slope influenced the depth of soil at this location. How has this in turn effected the distribution of plants here?
Why are rainforests more likely to occur on south to south easterly facing slopes and rarely occur on the north facing sides of gullies?
How can beach profiles be used to investigate coastal management?
!21
Slope Beach profiles use a combination of distance and angle measurements to investigate the shape of the beach. They also allow for calculation of cross-sectional area as a measure of the amount of beach material present at a location
Method
Hold the clinometer up to one eye and line up the sights.
Stand at the top / base of a slope and point the clinometer at an object / person that is approximately the same height off the ground as your eye.
Press the button or pull the trigger ( depending on the style of the clinometer) to release the pointer. Allow the pointer to stop.
Remove your finger from the button or release the trigger and read off the angle from the scale.
Interpretation of Results:
The smaller the angle the more gradual the slope and vice versa.
A gradual slope will not have as much water runoff and therefore the potential for erosion is much less.
The angle of a slope plus the aspect or direction is significant in influencing the distribution of vegetation communities and ecosystems. For example rainforests of the Illawarra are most often located in areas of south east aspect. Other factors such as elevation, soil type and rainfall combine to influence the occurrence of rainforests.
NSW DEPARTMENT OF EDUCATION ILLAWARRA EEC
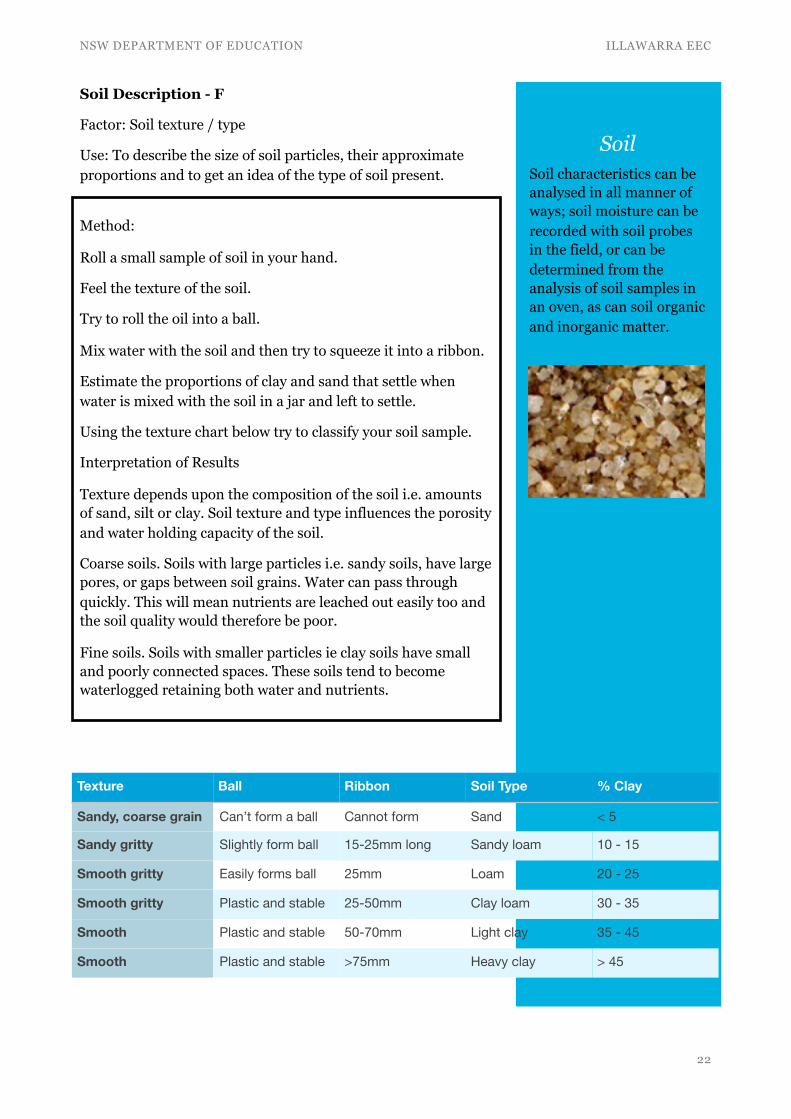
Soil Description - F
Factor: Soil texture / type
Use: To describe the size of soil particles, their approximate proportions and to get an idea of the type of soil present.
!22
Method:
Roll a small sample of soil in your hand.
Feel the texture of the soil.
Try to roll the oil into a ball.
Mix water with the soil and then try to squeeze it into a ribbon.
Estimate the proportions of clay and sand that settle when water is mixed with the soil in a jar and left to settle.
Using the texture chart below try to classify your soil sample.
Interpretation of Results
Texture depends upon the composition of the soil i.e. amounts of sand, silt or clay. Soil texture and type influences the porosity and water holding capacity of the soil.
Coarse soils. Soils with large particles i.e. sandy soils, have large pores, or gaps between soil grains. Water can pass through quickly. This will mean nutrients are leached out easily too and the soil quality would therefore be poor.
Fine soils. Soils with smaller particles ie clay soils have small and poorly connected spaces. These soils tend to become waterlogged retaining both water and nutrients.
Soil Soil characteristics can be analysed in all manner of ways; soil moisture can be recorded with soil probes in the field, or can be determined from the analysis of soil samples in an oven, as can soil organic and inorganic matter.
Texture Ball Ribbon Soil Type % Clay
Sandy, coarse grain Can’t form a ball Cannot form Sand < 5
Sandy gritty Slightly form ball 15-25mm long Sandy loam 10 - 15
Smooth gritty Easily forms ball 25mm Loam 20 - 25
Smooth gritty Plastic and stable 25-50mm Clay loam 30 - 35
Smooth Plastic and stable 50-70mm Light clay 35 - 45
Smooth Plastic and stable >75mm Heavy clay > 45
NSW DEPARTMENT OF EDUCATION ILLAWARRA EEC
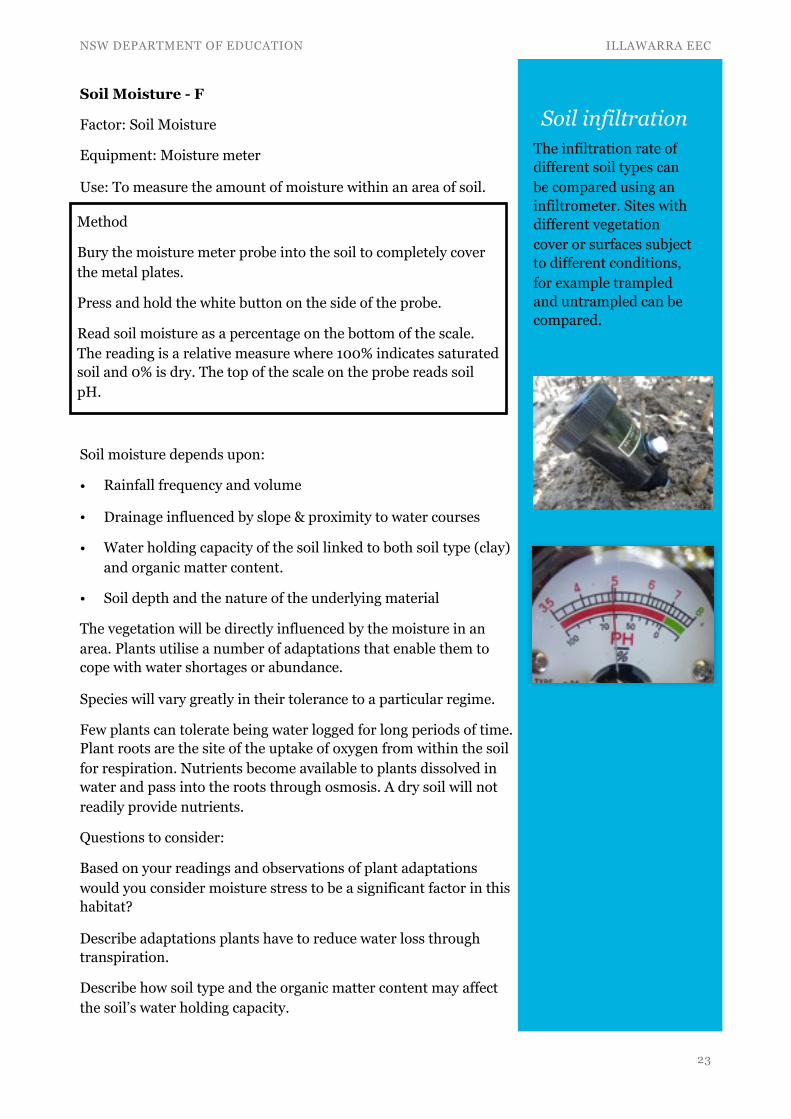
Soil Moisture - F
Factor: Soil Moisture
Equipment: Moisture meter
Use: To measure the amount of moisture within an area of soil.
Soil moisture depends upon:
• Rainfall frequency and volume
• Drainage influenced by slope & proximity to water courses
• Water holding capacity of the soil linked to both soil type (clay) and organic matter content.
• Soil depth and the nature of the underlying material
The vegetation will be directly influenced by the moisture in an area. Plants utilise a number of adaptations that enable them to cope with water shortages or abundance.
Species will vary greatly in their tolerance to a particular regime.
Few plants can tolerate being water logged for long periods of time. Plant roots are the site of the uptake of oxygen from within the soil for respiration. Nutrients become available to plants dissolved in water and pass into the roots through osmosis. A dry soil will not readily provide nutrients.
Questions to consider:
Based on your readings and observations of plant adaptations would you consider moisture stress to be a significant factor in this habitat?
Describe adaptations plants have to reduce water loss through transpiration.
Describe how soil type and the organic matter content may affect the soil’s water holding capacity.
!23
Method
Bury the moisture meter probe into the soil to completely cover the metal plates.
Press and hold the white button on the side of the probe.
Read soil moisture as a percentage on the bottom of the scale. The reading is a relative measure where 100% indicates saturated soil and 0% is dry. The top of the scale on the probe reads soil pH.
Soil infiltration The infiltration rate of different soil types can be compared using an infiltrometer. Sites with different vegetation cover or surfaces subject to different conditions, for example trampled and untrampled can be compared.
NSW DEPARTMENT OF EDUCATION ILLAWARRA EEC
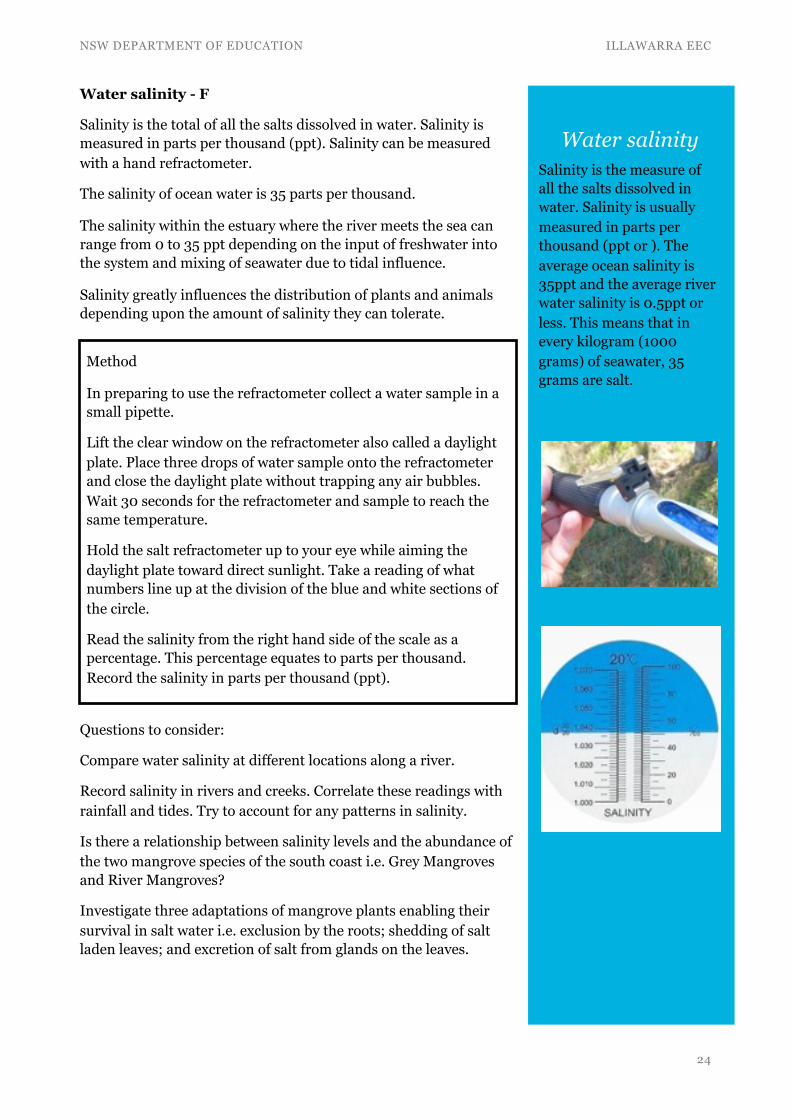
Water salinity - F
Salinity is the total of all the salts dissolved in water. Salinity is measured in parts per thousand (ppt). Salinity can be measured with a hand refractometer.
The salinity of ocean water is 35 parts per thousand.
The salinity within the estuary where the river meets the sea can range from 0 to 35 ppt depending on the input of freshwater into the system and mixing of seawater due to tidal influence.
Salinity greatly influences the distribution of plants and animals depending upon the amount of salinity they can tolerate.
Questions to consider:
Compare water salinity at different locations along a river.
Record salinity in rivers and creeks. Correlate these readings with rainfall and tides. Try to account for any patterns in salinity.
Is there a relationship between salinity levels and the abundance of the two mangrove species of the south coast i.e. Grey Mangroves and River Mangroves?
Investigate three adaptations of mangrove plants enabling their survival in salt water i.e. exclusion by the roots; shedding of salt laden leaves; and excretion of salt from glands on the leaves.
!24
Method
In preparing to use the refractometer collect a water sample in a small pipette.
Lift the clear window on the refractometer also called a daylight plate. Place three drops of water sample onto the refractometer and close the daylight plate without trapping any air bubbles. Wait 30 seconds for the refractometer and sample to reach the same temperature.
Hold the salt refractometer up to your eye while aiming the daylight plate toward direct sunlight. Take a reading of what numbers line up at the division of the blue and white sections of the circle.
Read the salinity from the right hand side of the scale as a percentage. This percentage equates to parts per thousand. Record the salinity in parts per thousand (ppt).
Water salinity Salinity is the measure of all the salts dissolved in water. Salinity is usually measured in parts per thousand (ppt or ). The average ocean salinity is 35ppt and the average river water salinity is 0.5ppt or less. This means that in every kilogram (1000 grams) of seawater, 35 grams are salt.
NSW DEPARTMENT OF EDUCATION ILLAWARRA EEC
Soil pH - F
Soil pH is a measure of the soil acidity or alkalinity in soils.
Soil pH is a significant variable in soils as it controls many chemical processes in soil which affect plant nutrient availability.
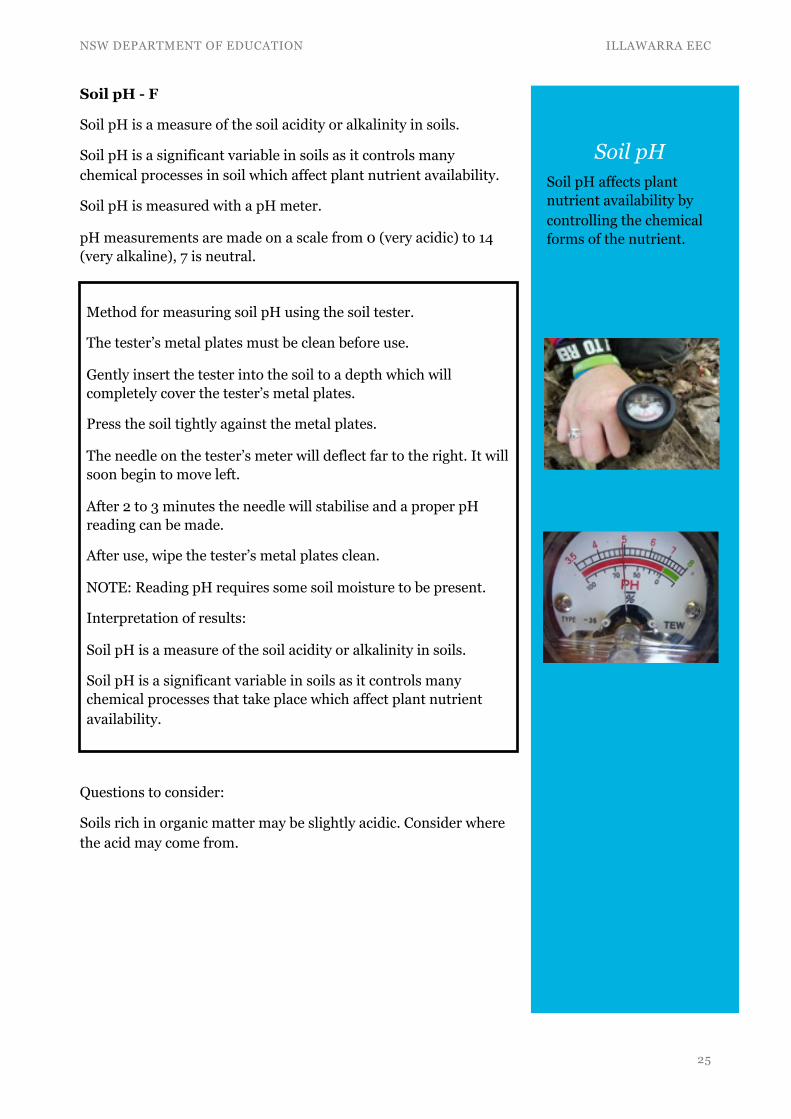
Soil pH is measured with a pH meter.
pH measurements are made on a scale from 0 (very acidic) to 14 (very alkaline), 7 is neutral.
Questions to consider:
Soils rich in organic matter may be slightly acidic. Consider where the acid may come from.
!25
Soil pH Soil pH affects plant nutrient availability by controlling the chemical forms of the nutrient.
Method for measuring soil pH using the soil tester.
The tester’s metal plates must be clean before use.
Gently insert the tester into the soil to a depth which will completely cover the tester’s metal plates.
Press the soil tightly against the metal plates.
The needle on the tester’s meter will deflect far to the right. It will soon begin to move left.
After 2 to 3 minutes the needle will stabilise and a proper pH reading can be made.
After use, wipe the tester’s metal plates clean.
NOTE: Reading pH requires some soil moisture to be present.
Interpretation of results:
Soil pH is a measure of the soil acidity or alkalinity in soils.
Soil pH is a significant variable in soils as it controls many chemical processes that take place which affect plant nutrient availability.
NSW DEPARTMENT OF EDUCATION ILLAWARRA EEC
Turbidity - F
Factor: Turbidity of Water
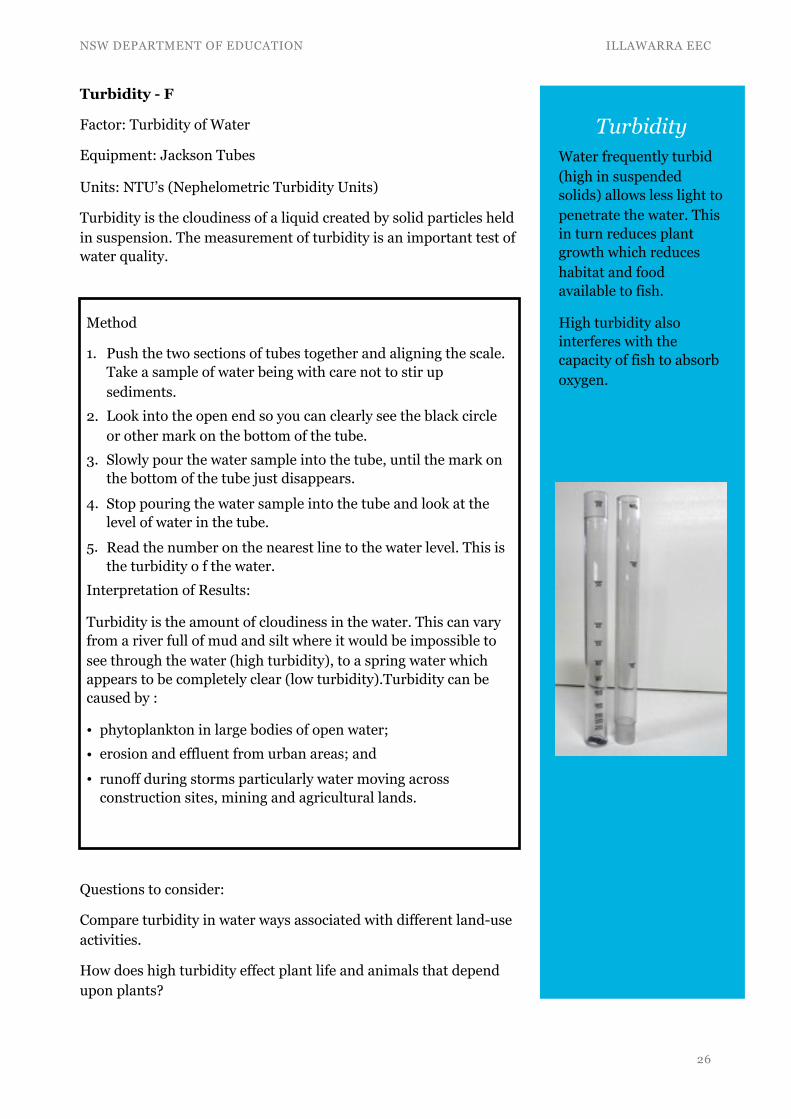
Equipment: Jackson Tubes
Units: NTU’s (Nephelometric Turbidity Units)
Turbidity is the cloudiness of a liquid created by solid particles held in suspension. The measurement of turbidity is an important test of water quality.
Questions to consider:
Compare turbidity in water ways associated with different land-use activities.
How does high turbidity effect plant life and animals that depend upon plants?
!26
Turbidity Water frequently turbid (high in suspended solids) allows less light to penetrate the water. This in turn reduces plant growth which reduces habitat and food available to fish.
High turbidity also interferes with the capacity of fish to absorb oxygen.
Method
1. Push the two sections of tubes together and aligning the scale. Take a sample of water being with care not to stir up sediments.
2. Look into the open end so you can clearly see the black circle or other mark on the bottom of the tube.
3. Slowly pour the water sample into the tube, until the mark on the bottom of the tube just disappears.
4. Stop pouring the water sample into the tube and look at the level of water in the tube.
5. Read the number on the nearest line to the water level. This is the turbidity o f the water.
Interpretation of Results:
Turbidity is the amount of cloudiness in the water. This can vary from a river full of mud and silt where it would be impossible to see through the water (high turbidity), to a spring water which appears to be completely clear (low turbidity).Turbidity can be caused by :
• phytoplankton in large bodies of open water; • erosion and effluent from urban areas; and • runoff during storms particularly water moving across
construction sites, mining and agricultural lands.
NSW DEPARTMENT OF EDUCATION ILLAWARRA EEC
Organic matter - F
Factor: Organic Matter or Humus
Questions to consider:
The humid moist conditions within a rainforest are ideal for decomposers. Discuss why rainforest ecosystems are dependent upon decomposers in the leaf litter.
Investigate the correlation between organic matter and the structure and composition of different plant communities e.g. coastal foredunes and coastal hind dunes.
!27
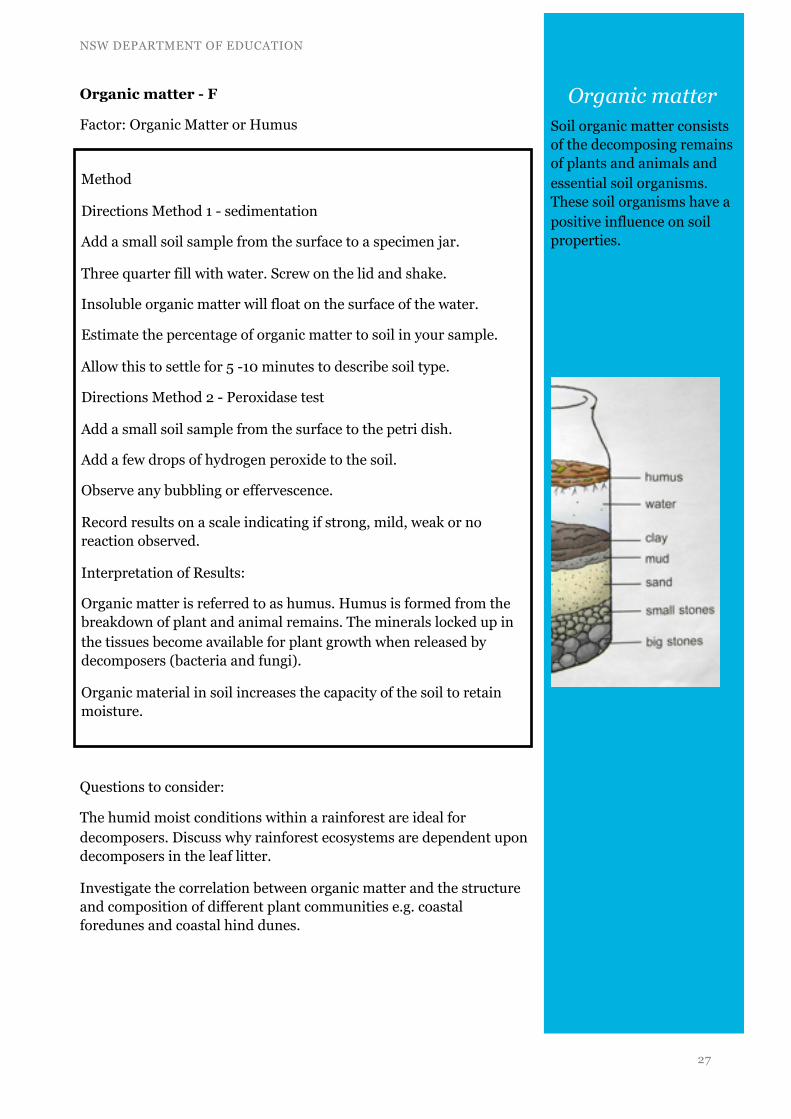
Organic matter Soil organic matter consists of the decomposing remains of plants and animals and essential soil organisms. These soil organisms have a positive influence on soil properties.
Method
Directions Method 1 - sedimentation
Add a small soil sample from the surface to a specimen jar.
Three quarter fill with water. Screw on the lid and shake.
Insoluble organic matter will float on the surface of the water.
Estimate the percentage of organic matter to soil in your sample.
Allow this to settle for 5 -10 minutes to describe soil type.
Directions Method 2 - Peroxidase test
Add a small soil sample from the surface to the petri dish.
Add a few drops of hydrogen peroxide to the soil.
Observe any bubbling or effervescence.
Record results on a scale indicating if strong, mild, weak or no reaction observed.
Interpretation of Results:
Organic matter is referred to as humus. Humus is formed from the breakdown of plant and animal remains. The minerals locked up in the tissues become available for plant growth when released by decomposers (bacteria and fungi).
Organic material in soil increases the capacity of the soil to retain moisture.
NSW DEPARTMENT OF EDUCATION ILLAWARRA EEC
Soil Salinity - F
Factor: Soil Salinity
Questions to consider:
Visit an area of mangroves with adjacent salt marsh plants. Measure and record the soil salinity along a transect from the high tide to several metres beyond the landward edge of the salt marsh. Analyse your data and try to account for any pattern in the salinity level.
!28
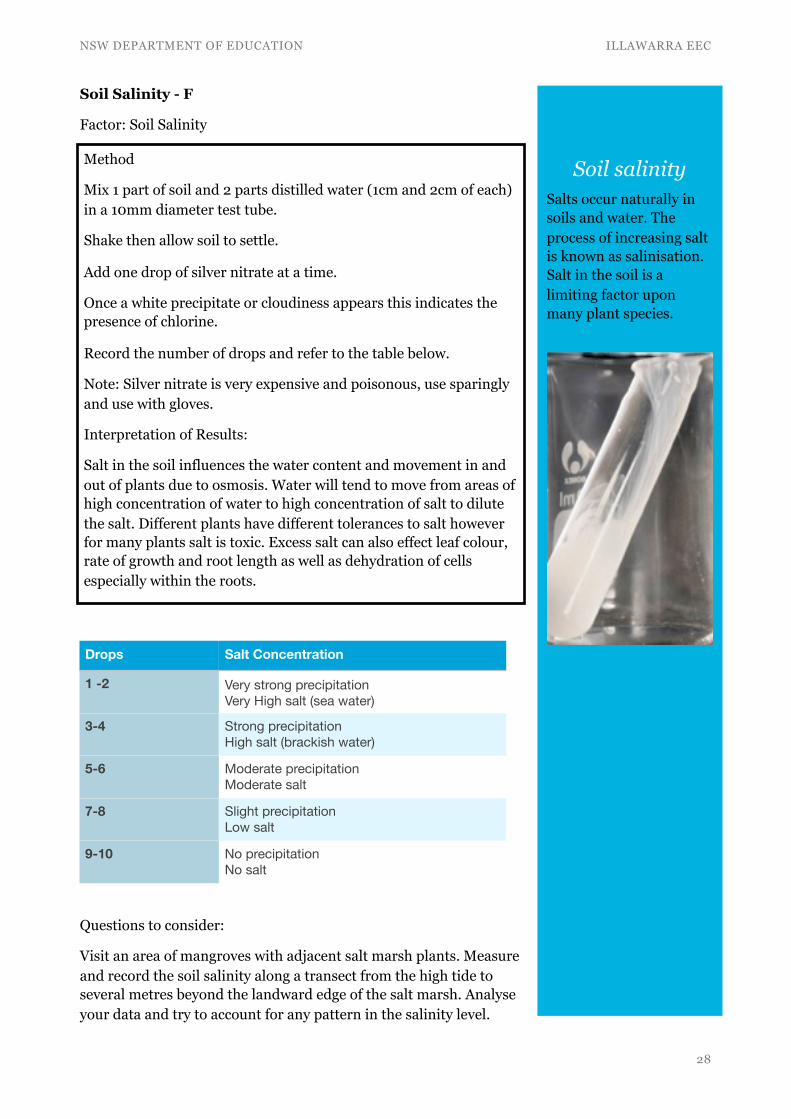
Soil salinity Salts occur naturally in soils and water. The process of increasing salt is known as salinisation. Salt in the soil is a limiting factor upon many plant species.
Method
Mix 1 part of soil and 2 parts distilled water (1cm and 2cm of each) in a 10mm diameter test tube.
Shake then allow soil to settle.
Add one drop of silver nitrate at a time.
Once a white precipitate or cloudiness appears this indicates the presence of chlorine.
Record the number of drops and refer to the table below.
Note: Silver nitrate is very expensive and poisonous, use sparingly and use with gloves.
Interpretation of Results:
Salt in the soil influences the water content and movement in and out of plants due to osmosis. Water will tend to move from areas of high concentration of water to high concentration of salt to dilute the salt. Different plants have different tolerances to salt however for many plants salt is toxic. Excess salt can also effect leaf colour, rate of growth and root length as well as dehydration of cells especially within the roots.
Drops Salt Concentration
1 -2 Very strong precipitationVery High salt (sea water)
3-4 Strong precipitationHigh salt (brackish water)
5-6 Moderate precipitationModerate salt
7-8 Slight precipitationLow salt
9-10 No precipitationNo salt

NSW DEPARTMENT OF EDUCATION ILLAWARRA EEC
Surveys - Fieldwork
Surveys are used to collect primary data about people’s activities or movements for example surveys about traffic, time and motion, public facilities and utilities, how old we are, who we are, what we do and how we live. Surveys can also be used to investigate people's perceptions about an issue, project or development.
On line survey tools such as Survey Monkey and Google Forms enable students to collaborate on the creation, sharing, collation of data and analysis of data.
Using Google Forms students and teachers can collaborate to create forms which include: short answers, paragraph answers, multiple choice, checkboxes, drop down menus, linear scales, multiple choice grids, date, time, photos and video. The data is automatically collated into a spreadsheet and / or summarised with charts.
Figure 14: Sample Survey Using Google Forms
!29
NSW DEPARTMENT OF EDUCATION ILLAWARRA EEC
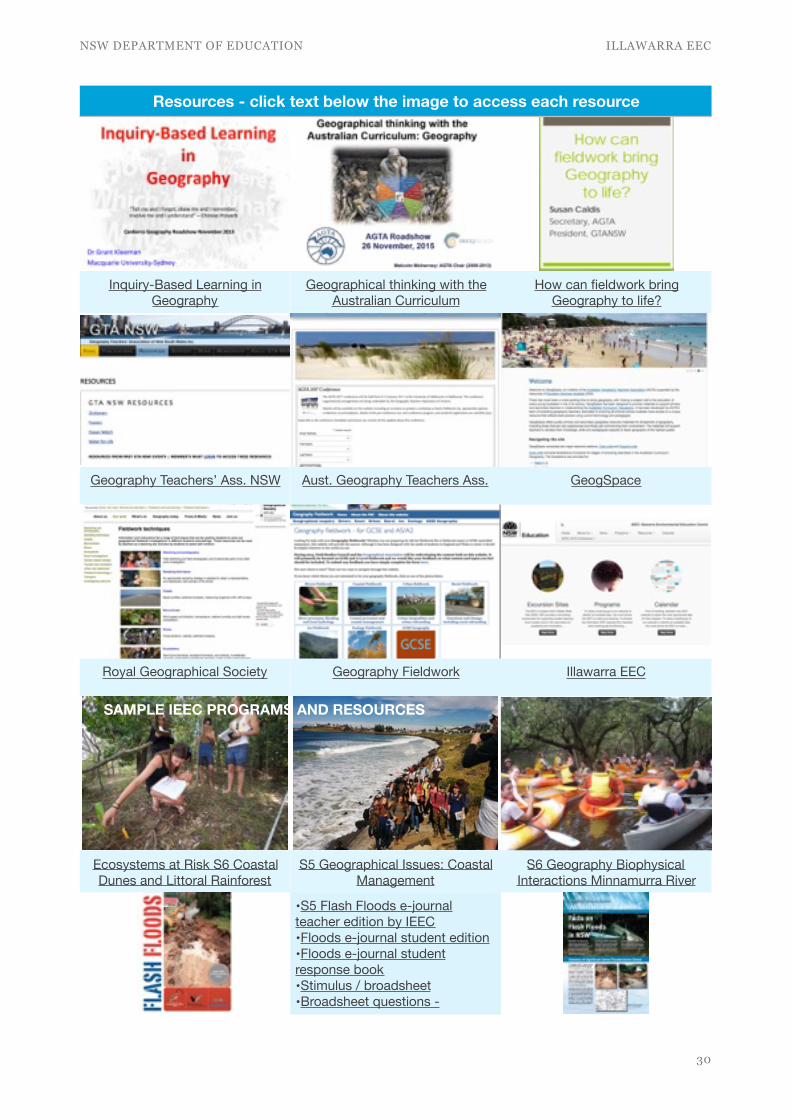
Resources - click text below the image to access each resource
Inquiry-Based Learning in Geography
Geographical thinking with the Australian Curriculum
How can fieldwork bring Geography to life?
Geography Teachers’ Ass. NSW Aust. Geography Teachers Ass. GeogSpace
Royal Geographical Society Geography Fieldwork Illawarra EEC
Ecosystems at Risk S6 Coastal Dunes and Littoral Rainforest
S5 Geographical Issues: Coastal Management
S6 Geography Biophysical Interactions Minnamurra River
•S5 Flash Floods e-journal teacher edition by IEEC•Floods e-journal student edition•Floods e-journal student response book•Stimulus / broadsheet •Broadsheet questions -
!30
SAMPLE IEEC PROGRAMS AND RESOURCES
NSW DEPARTMENT OF EDUCATION ILLAWARRA EEC
The Illawarra Environmental Education Centre is a facility of the NSW Department of Education.
The Illawarra Environmental Education Centre (IEEC) provides excursions, camps, in school sustainability workshops and teacher professional learning Kindergarten to Year 12.
To make a booking go to our calendar to identify an available date. You must phone the IEEC to make your booking. To preview the information IEEC requires from teachers when booking see the Booking Request Form. These details can be phoned through or submit the Booking Request Form.
The IEEC has made organising fieldwork experiences easy.
Teachers visit our website>programs and click on their preferred program title to access a program overview. The program overview details costs, syllabus links, links to risk assessment ideas, links to student log books, location maps and logistics information to organise the best fieldwork experience.
Geography teachers with ideas for fieldwork should contact the IEEC. Programs are developed in collaboration with teachers to meet the needs of all students across the curriculum. The IEEC provides release time for teachers to work with us in developing new fieldwork programs and the subsequent trialling of the fieldwork with their students.
Contact
Telephone: 02 4237 6100 Email: [email protected]
Web: www.ieec.nsw.edu.au
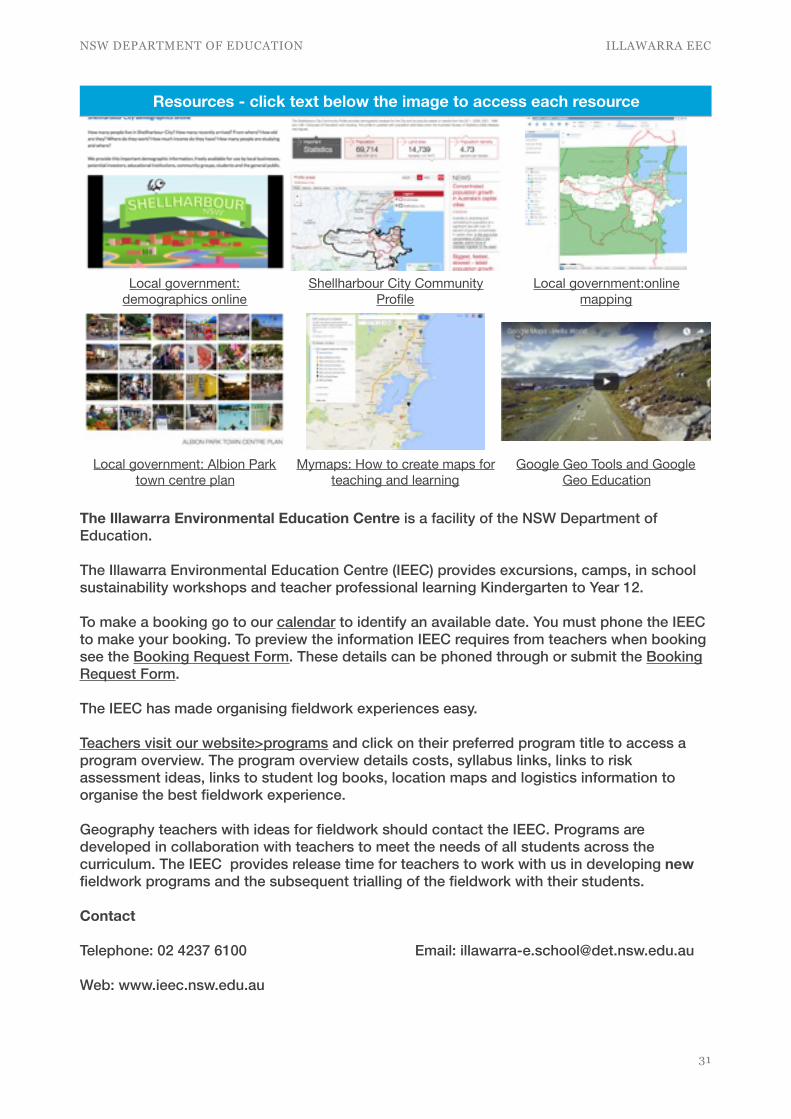
Local government: demographics online
Shellharbour City Community Profile
Local government:online mapping
Local government: Albion Park town centre plan
Mymaps: How to create maps for teaching and learning
Google Geo Tools and Google Geo Education
Resources - click text below the image to access each resource
!31
NSW DEPARTMENT OF EDUCATION ILLAWARRA EEC
!32
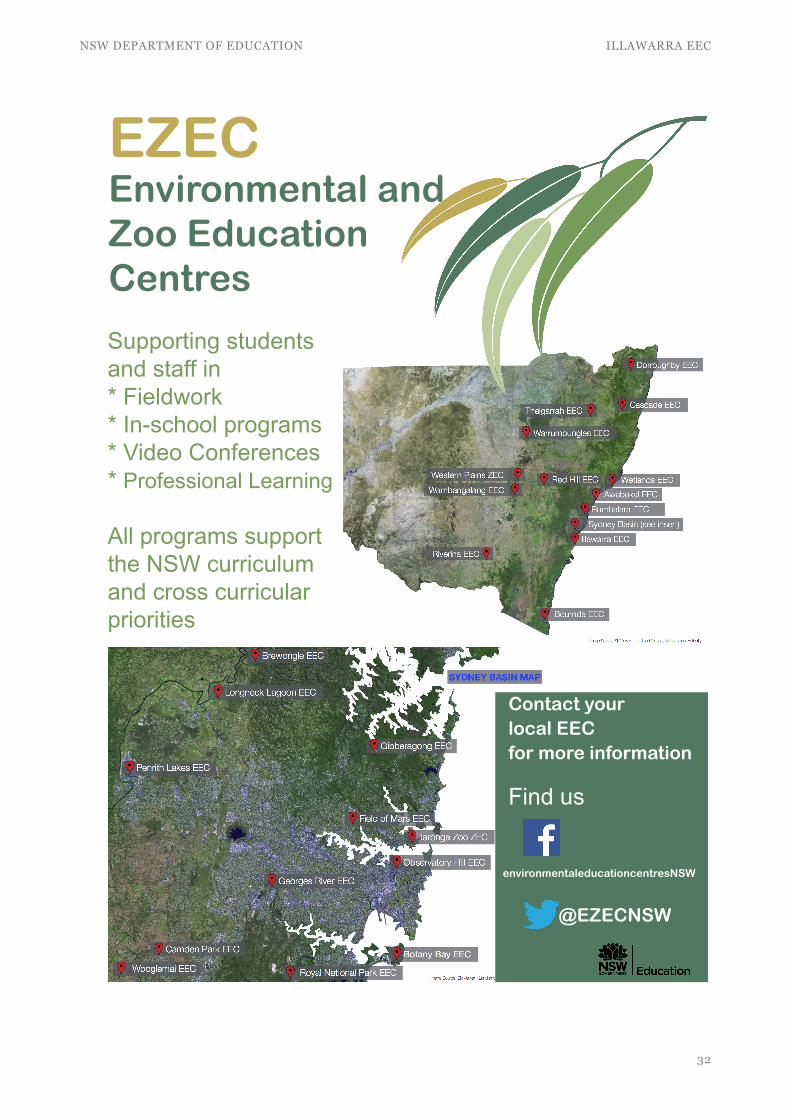
Supporting students and staff in * Fieldwork* In-school programs * Video Conferences* Professional Learning
All programs support the NSW curriculum and cross curricular priorities
Contact your local EEC for more information
Find us
environmentaleducationcentresNSW
@EZECNSW
EZECEnvironmental and Zoo Education Centres