Embed Size (px)
Citation preview

Geologic CO2 storage in Eastern Europe, Caucasus and Central Asia
An initial analysis of potential and policy
UNITED NATIONS ECONOMIC COMMISSION FOR EUROPE


Geologic CO2 storage in Eastern Europe, Caucasus and
Central Asia: An initial analysis of potential and policy
UNITED NATIONS ECONOMIC COMMISSION FOR EUROPE
UNITED NATIONSGENEVA, 2021
©2021 United Nations

All rights reserved worldwide
Requests to reproduce excerpts or to photocopy should be addressed to the Copyright Clearance Center at copyright.com.
All other queries on rights and licenses, including subsidiary rights, should be addressed to: United Nations Publications, 405 East 42nd St, S-09FW001, New York, NY 10017, United States of America
Email: [email protected]; website: https://shop.un.org
The findings, interpretations and conclusions expressed herein are those of the author(s) and do not necessarily reflect the views of the United Nations or its officials or member States.
The designation employed and the presentation of material on any map in this work do not imply the expression of any opinion whatsoever on the part of the United Nations concerning the legal status of any country, territory, city or area, or of its authorities, or concerning the delimitation of its frontiers or boundaries.
Mention of any firm, licensed process or commercial products does not imply endorsement by the United Nations.
This publication is issued in English and Russian.
United Nations publication issued by the United Nations Economic Commission for Europe.

Acknowledgements
Wolfgang Heidug is the lead author of this report. Filip Neele and Lydia Rycroft of the Netherlands Organisation for Applied Scientific Research (TNO), Luca Taschini of the London School of Economics (LSE) and University of Edinburg Business School, and Colin Ward of the King Abdullah Petroleum Studies and Research Centre (KAPSARC) made sig-nificant contributions to this report. Niels-Henrik Bjurstrøm and Marius Foss of Rystad Energy provided data that was used in preparation of the study. Karin Ask of Equinor provided the text on the application of the UNFC framework for CO2 injection projects in the Annex of this report. Vít Hladík of the Czech Geological Survey also contributed to the study by providing advice. Marilyn Smith of the ORENDA Communications provided editing services.
This report has been developed in response to the requests from the Governments of Albania, Azerbaijan, and Ukraine under the UNECE Regular Programme for Technical Cooperation. Iva Brkic, Walker Darke, Oleg Dzioubinski, Scott Foster, and Stefanie Held of the UNECE Sustainable Energy Division contributed to this report through guidance, comments, and oversight. Shuyue Li provided visual communication and design services for this report. Ekaterina Zayash translated this report into Russian.
The report is dedicated to the leadership and memory of late Barry Worthington, Chair of the Group on Experts on Cleaner Electricity Systems.
i

Table of Contents
Acknowledgements ....................................................................................................................... i
Abbreviations and Acronyms .......................................................................................................... iii
Executive Summary ........................................................................................................................ iv
1. Introduction .............................................................................................................................. 1
2. Considerations for Carbon Capture, Utilization and Storage (CCUS) .............................................. 3
2.1 What is geological storage? ......................................................................................................... 3
2.2 Options for geological storage ...................................................................................................... 3
2.3 CO2 supply............................................................................................................................... 5
2.4 Geographical distribution of storage and supply ............................................................................... 5
2.5 Transport and infrastructure for CCUS .......................................................................................... 6
3. Assessment of CO2 Storage Potential ........................................................................................... 7
3.1 Qualitative assessment of storage .................................................................................................. 7
3.2 Quantitative assessment of storage ................................................................................................ 7
3.3 Aquifer storage capacity ............................................................................................................ 7
3.4 Oil reservoir storage capacity ....................................................................................................... 8
4. Assessing CCUS Potential in the Focus Region ............................................................................... 9
4.1 Qualitative assessment ............................................................................................................... 9
4.2 Quantitative assessment ........................................................................................................... 11
4.3 Aquifer assessment in countries of interest ..................................................................................... 11
4.4 Oil reservoir assessment in countries of interest ............................................................................... 13
4.5 CO2 supply determines how much can be practically stored ............................................................... 14
4.6 CO2 supply and storage clusters in focus countries and region ............................................................. 15
4.7 Economics of CO2 storage in focus country oil fields .......................................................................... 17
5. Policies for CCUS ..................................................................................................................... 19
5.1 Policy instruments to accelerate CCUS deployment .......................................................................... 20
5.2 Certificate scheme for CCUS ........................................................................................................ 22
6. Conclusion ................................................................................................................................ 25
Appendix: Resource Classification for CO2 Storage Projects ............................................................ 26
References .................................................................................................................................. 29
ii

Abbreviations and Acronyms
AMC advanced market commitment
CO2 carbon dioxide
CCUS carbon dioxide capture, utilization and storage (geological)
CDM clean development mechanism
CER certifiable emissions reduction
CSU carbon storage unit (or sequestration)
EOR enhanced oil recovery (using CO2)
ETS emissions trading scheme
EU European Union
GCCUSI Global CCUS Institute
Gt gigatonne
IEA International Energy Agency
IEAGHG International Energy Agency Greenhouse Gas R&D Programme
IPCC Intergovernmental Panel on Climate Change
ITMO internationally transferable mitigation outcome
LPG liquefied petroleum gas
MRV measurement, reporting and verification
Mt million tonnes
NDC nationally determined contribution
RBCF results-based climate finance
SDM sustainable development mechanism (under Article 6.4 of the Paris Agreement)
SRL storage readiness level
t tonne
TSAR technically available storage capacity
UNFCCC United Nations Framework Convention on Climate Change
USDOE United States Department of Energy
iii

Executive Summary
In order to avoid the dangerous impacts of climate change, the United Nations Economic Commission for Europe (UNECE) is exploring opportunities to achieve carbon neutrality in the region that comprises the coun-tries of South-Eastern Europe, Eastern Europe, the Cau-casus, Central Asia, Russian Federation and Turkey. Get-ting to ‘net-zero emissions’ in UNECE region would require eliminating 90 gigatonnes (Gt) of CO2 within the next 30 years. Carbon capture, utilization and storage (CCUS) is an essential technology in this quest.
As the name suggests, CCUS is actually a technology chain. The possibility to capture new CO2 emissions at the source or extract latent ones from the air and send them into underground, for indefinite storage enables net-zero or net-negative emissions. Achieving this poten-tial depends, first and foremost, on the availability of suitable storage sites – a geological characteristic found only in some locations. A second criteria is the ability to transport the ‘supply’ of captured CO2 to such forma-tions. The technical aspects of this process are at various stages of development, with transport and storage mechanisms being proven and mature, particularly in the oil and gas industry. A range of capture technologies are being developed for diverse, high-emission indus-tries. Integration across the chain is less well-developed.
However, a multifaceted challenge hampers CCUS de-ployment in the region. At present, relatively little is known about the location, suitability and actual size of potential storage sites – and thus of their usefulness in relation to CO2 sources. While there are clear social and environmental benefits to reducing CO2 emissions, do-ing so carries high costs. The emerging possibility to transform depleted oil reservoirs into storage sites can, under the right conditions, deliver economic returns to oil producers. In fact, the process of using CO2 to boost production (known as enhanced oil recovery or EOR) is the only well-developed ‘utilization’ process and could eventually decarbonize fossil fuels. To date, however, there is no business case to develop the second major storage option – saline aquifers.
These challenges bring to the fore the economic and po-litical factors that countries and regions must consider when assessing the potential for CCUS in their climate mitigation strategies. In the region, such assessment is currently hampered by gaps in information and political commitment.
Based on the limited data and information available, this analysis finds a storage potential in oil reservoirs in the region of 62,000 million tonnes (Mt) of CO2, with 56,410 MtCO2 being located in Russia. The total storage capacity that is ‘matched’ to CO2 sources is lower at 13,000 MtCO2
but CO2 storage capacity may increase with additional supply of CO2 that needs to be stored.
Given the scale of the emissions reduction target, more work is urgently needed to understand the contributions that CCUS – along with other low-, zero-, or negative-car-bon technologies – can make in the climate debate and in policy parity with other carbon-neutral electricity generation technologies (such as nuclear energy or re-newable energy). The long-term aim of the project "En-hancing Understanding of the Implications and Oppor-tunities of Moving to Carbon Neutrality in the UNECE Region across the Power and Energy-intensive Industries by 2050" is to develop a collective ability to contribute to climate change mitigation and sustainable development by transforming economies and society towards net-zero CO2 emissions. Providing a clear vision of how UNECE Member States can achieve carbon neutrality and what measures they should undertake will serve as the short-term impact. The project provides the opportunity for countries to assess options to achieve set targets.
This study seeks to provide countries with tools and methodologies to carry out assessment of CCUS poten-tial and describes policy tools that can support its devel-opment and deployment, including by stimulating pri-vate sector investment.
An important element of the policy recommendations is the proposal to shift the focus of incentive schemes from the capture stage to the storage stage by implementing a certificate scheme for CCUS that would effectively en-able trade of ‘units’ of CO2 stored. Governments could use such a mechanism to support technology develop-ment and deployment while also creating a market such that ‘policy push’ would eventually stimulate to ‘market pull’. Conceived in line with the architecture, mecha-nisms and goals of the COP21 Paris Agreement, such a mechanism could also help government achieve their nationally determined contributions to climate change mitigation.
iv

1
1. Introduction
In order to avoid the dangerous impacts of climate change, the United Nations Economic Commission for Europe (UNECE) is exploring opportunities to achieve carbon neutrality in the region that comprises the coun-tries of South-Eastern Europe, Eastern Europe, the Cau-casus, Central Asia, Russian Federation and Turkey.11
Getting to net-zero emissions would require eliminating 90 gigatonnes (Gt) of CO2 emissions within the next 30 years. This implies pursuing two paths: i) eliminating all sources of CO2 emissions, an enormously difficult and expensive goal; and ii) actively removing CO2 from the atmosphere to balance out emissions that are hard to abate. Carbon capture utilization and storage (CCUS) is a technology that is essential to both paths: it reduces CO2 emissions at the source or from the air and it enables net-zero or net-negative emissions.
Most modelling exercises that comply with aims of the COP21 Paris Agreement emissions reduction targets show trajectories with significant gross emissions even after the point of achieving net-zero on the global scale (IPCC, 2018). This reflects the reality that fossil fuels are likely to remain an important energy vector in some in-dustries. To constrain additional increases in mean glob-
al temperatures in the second half of this century it will be necessary to continually offset emissions from these sources through corresponding enhancements in ‘car-bon sinks’ (G20, 2020).
Two primary options increase the volume of available carbon sinks. Reforestation or afforestation strategies focus on boosting the absorptive capacity of forests. De-ployment of CCUS technologies show strong potential to rapidly remove large volumes of CO2 and to keep it se-curely stored over long periods of time, something that is difficult to achieve with biological sinks.
At present, CCUS is not on track to fulfil its projected role in climate change mitigation. Worldwide, 19 operating CCUS facilities are injecting and permanently storing about 40 million tonnes (Mt) of CO2 annually (Figure 1) (GCSSI, 2019). Massive scale up is needed to achieve the level outlined in the IEA’s SDS scenario, which projects thousands of CCUS sites injecting and storing 1.5 giga-tonnes (Gt) per annum.
Most of the CCUS projects operating serve a specific pur-pose within the oil industry: enhanced oil recovery (EOR) is a process in which CO2 is injected into depleting oil
Figure 1 Overview of operating CCUS projects
Source: Global CCS Institute, 2020COMMERCIAL CCS FACILITIES IN OPERATION & CONSTRUCTION
COMMERCIAL CCS FACILITIES IN DEVELOPMENT
OPERATION SUSPENDED
PILOT & DEMONSTRATIONFACILITIES COMPLETED
PILOT & DEMONSTRATIONFACILITIES IN OPERATION & DEVELOPMENT
COMMERCIAL CCS FACILITIES IN
OPERATION & CONSTRUCTION
COMMERCIAL CCS FACILITIES IN DEVELOPMENT
OPERATION SUSPENDED
PILOT & DEMONSTRATIONFACILITIES COMPLETED
PILOT & DEMONSTRATIONFACILITIES IN OPERATION & DEVELOPMENT
[1] Focus countries for this report include Albania, Armenia, Azerbaijan, Belarus, Bosnia and Herzegovina, Georgia, Kazakhstan, Kyrgyzstan, Moldova, Montenegro, Northern Macedonia, the Russian Federation, Serbia, Tajikistan, Turkey, Turkmenistan, Ukraine and Uzbekistan.

2
reservoirs to support additional oil production by dis-placing in situ oil. The opportunity to recover additional oil can offset the costs associated with injecting CO2. When the reservoir is depleted, virtually all of the inject-ed CO2 remains trapped (stored).
Apart from enhanced oil recovery (EOR), CCUS currently has no other purpose than that of reducing CO2 emis-sions: in effect, the ‘utilization’ element is not yet well developed. With no business case to stimulate CCUS, virtually all other existing projects currently depend heavily on direct or indirect governmental support in the form of grants or financial support for operations, or provision of debt or equity capital.
Despite its importance for mitigating climate change, current climate policies fall short of supporting CCUS in a meaningful way. In Europe, CCUS has been included
among mitigation options covered by the EU Emissions Trading Scheme (EU ETS) since 2012. Yet the scheme has failed to deliver a single CCUS project. In reality, carbon prices under the EU ETS have been well below the level needed to make the investment case for CCUS. Rather than encouraging the long-term strategic investment needed for CCUS, the EU ETS appears to have triggered investments in low-cost abatement action (Marcantonini et al. 2017, Taschini, 2020).

3
2. Considerations for Carbon Capture, Utilization and Storage (CCUS)
CCUS can serve two purposes: preventing new CO2 emis-sions from entering the atmosphere or removing past emissions. It is important to understand CCUS is not a single technology but rather a technology chain consist-ing of three parts, namely:
• Capture refers to technologies that use a variety of chemical and physical methods to secure CO2 at the point of emissions – such as fossil-fueled power plants and industrial facilities. It may also involve di-rectly removing CO2 from the air. Captured CO2 can then be transported to a location where it can be used or stored for the long term.
• Utilization implies that CO2 captured can be directed towards another end-use, an area of substantial re-search at present with creating new materials being one example. EOR is currently the predominant use of captured CO2. Other options only store CO2 tempo-rarily or have a small potential market share of less than a few millions tonnes per year (IEA, 2019)
• Storage refers to mechanisms to ensure long-term containment (i.e. over thousands of years) of CO2 in subsurface rock formations. This is the point at which CO2 is indefinitely removed from the atmosphere.
It thus follows that deployment of CCUS depends on three elements: a supply of CO2 for capture; an infra-structure system to support transport of CO2; and avail-ability of geological sites suitable for long-term storage.
As the benefits of CCUS (neglecting for the moment its utilization as part of EOR) are exclusively related to the control of CO2 emissions, CCUS deployment requires a policy framework that values its climate benefits to at-tract investments in the technology.
2.1 What is geological storage of CO2? Geological storage involves injecting CO2 into rock for-mations than can absorb and contain it for thousands of years. Rocks well suited to this are found in sedimentary basins – i.e. areas of subsidence in the Earth crust in which sediments have accumulated over geological time periods. Typically, these basins extend for thousands of kilometers. In basins, deep saline aquifers, depleted oil and gas fields, and unmineable coal seams have been found suitable for CO2 storage. More recently, the possi-bility of storing CO2 in basalt has been proposed. The first two options (aquifers and oil reservoirs) involve storing CO2 in the pore space of subsurface rocks. In coal
seams, the process of adsorption causes injected CO2 to become firmly bound on the coal matrix. Carbon miner-alization (i.e. a chemical reaction) is the storage mecha-nism in basalt. Because of the variability of the Earth’s geology, the potential for geological storage will not be globally applicable to all countries (Cook, 2012).
Four options exist for storing CO2 in geological forma-tions: saline aquifers, oil reservoirs, coal seams and ba-salt formations. This report focuses on two of the four options, namely those that involve storage in subsurface pore space: saline aquifers and oil reservoirs.
2.2 Options for geological storageDeep saline aquifers
A saline aquifer is an underground structure formed of permeable rock containing salt water (brine). To be con-sidered suitable for CO2 storage, a given aquifer must meet three basic requirements:
• Sufficient porosity, permeability and thickness. Porosity and permeability ensure the rock will absorb the CO2; significant thickness, along with lateral ex-tension of the aquifer, is critical to containing a sub-stantial volume. These features enable high rates of CO2 injection without pressure build up.
• Adequate depth. Ideally, the aquifer should have a minimum depth of ~800 m. While CO2 is a gas at sur-face, at depth it transforms into liquid-like state with high mass density, which is advantageous for stor-age.
• An impermeable barrier rock (caprock or seal). A barrier rock must overlay the aquifer to prevent verti-cal migration of CO2, which has a buoyancy at depth, to the surface where it can escape into the air.
Worldwide, saline aquifers may provide the largest CO2 storage capacity. Thibeau and Mucha (2018) provide an extensive review of national and global capacity esti-mates for saline aquifer storage and review current esti-mation methods.
To date, no economic rationale has been found to sup-port the systematic study of the storage capacity of aqui-fers.
4
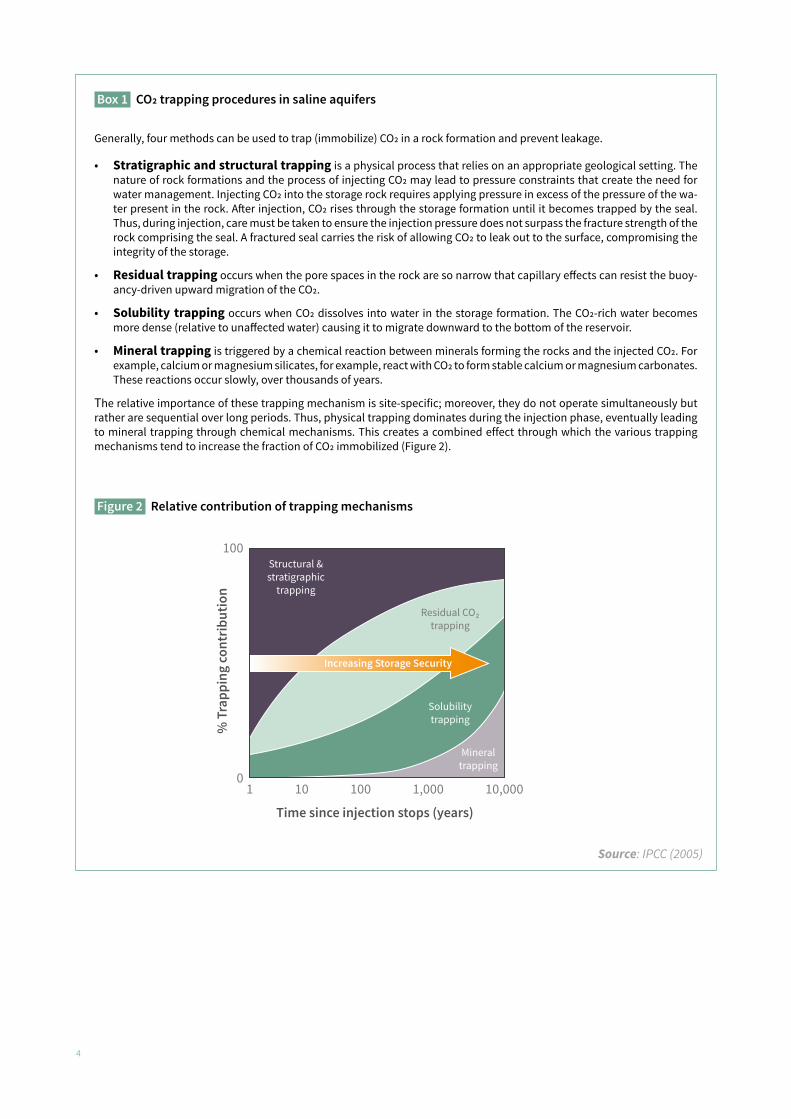
Box 1 CO2 trapping procedures in saline aquifers
Generally, four methods can be used to trap (immobilize) CO2 in a rock formation and prevent leakage.
• Stratigraphic and structural trapping is a physical process that relies on an appropriate geological setting. The nature of rock formations and the process of injecting CO2 may lead to pressure constraints that create the need for water management. Injecting CO2 into the storage rock requires applying pressure in excess of the pressure of the wa-ter present in the rock. After injection, CO2 rises through the storage formation until it becomes trapped by the seal. Thus, during injection, care must be taken to ensure the injection pressure does not surpass the fracture strength of the rock comprising the seal. A fractured seal carries the risk of allowing CO2 to leak out to the surface, compromising the integrity of the storage.
• Residual trapping occurs when the pore spaces in the rock are so narrow that capillary effects can resist the buoy-ancy-driven upward migration of the CO2.
• Solubility trapping occurs when CO2 dissolves into water in the storage formation. The CO2-rich water becomes more dense (relative to unaffected water) causing it to migrate downward to the bottom of the reservoir.
• Mineral trapping is triggered by a chemical reaction between minerals forming the rocks and the injected CO2. For example, calcium or magnesium silicates, for example, react with CO2 to form stable calcium or magnesium carbonates. These reactions occur slowly, over thousands of years.
The relative importance of these trapping mechanism is site-specific; moreover, they do not operate simultaneously but rather are sequential over long periods. Thus, physical trapping dominates during the injection phase, eventually leading to mineral trapping through chemical mechanisms. This creates a combined effect through which the various trapping mechanisms tend to increase the fraction of CO2 immobilized (Figure 2).
Figure 2 Relative contribution of trapping mechanisms
Source: IPCC (2005)

5
Depleted oil and gas fieldsAs noted, EOR is a commonly used process by which CO2 is injected into depleted oil fields as part of operations to extract oil that would be otherwise unproducible. At the end of a field’s lifespan, virtually all of the CO2 injected remains trapped in the reservoir.
Several factors make depleted oil and gas reservoirs good candidates for CO2 storage. First, the presence of effective seals is what has allowed oil and gas to accu-mulate over geological time periods. Second, as the po-rosity and permeability of their formations have been sufficient to produce fluids, they will support CO2 injec-tion. A third point is that detailed knowledge of the geo-logical structure and physical properties of these reser-voirs is built up during exploration and production; ergo, there is less risk that injected CO2 will behave in unex-pected ways.
Perhaps most importantly, injection of CO2 in depleted oil fields offers a commercial benefit: in fact, it is already common practice in some areas (e.g. the United States) to inject CO2 for the sole to support extraction of other-wise unproducible oil – referred to as enhanced oil recov-ery (EOR).
However, not every oil field is amenable to EOR. Oil and reservoir properties must satisfy certain conditions (‘screening criteria’) to qualify.
Storage in basalts
Having high porosity and permeability, basalt is highly reactivity with CO2 such that it ultimately leads to the formation of solid carbonate minerals (calcite, dolomite, etc.). These features make basalt attractive for in situ CO2 storage, which is currently in the research phase. Specifically, studies are being done to assess reactive CO2 flow in basalt, how permeability can be maintained as mineralization progresses and the kinetics of mineral-isation reactions (Kelemen et al. 2019). Basalt formations are found in many regions around the world and are particularly abundant in the north-west of the United States and in India. They warrant consideration as a stor-age option particularly in areas with no suitable sedi-mentary basis (Cook, 2012).
Storage in coal
Coal deposits occur in many sedimentary basins. As a rule, coal seams are mined only to a depth of ~1,500 m. In principle, deeper lying coal seams could be suitable as underground CO2 reservoirs. The storage mechanism of CO2 in coal seams differs from that in aquifers or basalt formations. Once injected, adsorption causes the CO2 to bond firmly to surfaces of the coal matrix.
As with EOR in oil fields, there may be an economic in-centive in this case. Very often coal seams contain coal bed methane that is bound by sorption onto the coal
matrix. As CO2 is absorbed onto the coal matrix, the orig-inally bound methane is desorbed and released, and can be extracted by production wells. The process is known as ‘CO2 Enhanced Coal Bed Methane Recovery’ and is used in the San Juan Basin in the United States.
A crucial criterion for the feasibility of this storage option relates to the permeability of the coal seams, which de-termines if the injected CO2 can reach large parts of the coal matrix. Coal that is too deep to be mined is often strongly compacted and has too little permeability to support effective CO2 injection. In addition, many coal seams swell when injected with CO2, which significantly lowers permeability. Overall, the storage of CO2 in deep, low-permeability coal seams still poses unsolved geoen-gineering challenges (Cook, 2012; Ranatunga, 2017).
Of the four storage options described above, this report considers only deep aquifers and oil reservoirs, reflect-ing their widespread distribution and significant storage potential.
2.3 CO2 supplyThe potential to store CO2 depends on availability of supply – i.e. the capture and transport elements of the chain under investigation. Provided appropriate carbon capture technology is installed to produce a concentrat-ed stream of CO2 at high pressure, suitable emission sources include power generation from coal or gas as well as production of iron and steel, cement, fertilizer and ethanol, and the processing of natural gas.
2.4 Geographical distribution of storage and supplyAn overarching challenge in CCUS is that existing sourc-es of CO2 are very often not sited in the vicinity of stor-age sites. To address this issue, substantial effort has gone in to mapping the geographical distributions of emission sources and storage formations.
In the European Union (EU), projects to quantitively assess regional or national CO2 storage capacity have been ongoing since the early 1990s. The GeoCapacity project, funded by the European Commission, conduct-ed a pan-European assessment that aimed to develop a European Geo-Information System (GIS) for the location of both emission sources and storage sites. Completed in 2008, it provided storage assessments for, inter alia: Albania, Bosnia-Herzegovina, Bulgaria, Croatia, Czech Republic, Estonia, Hungary, Latvia, Lithuania, North Macedonia, Poland, Romania, Slovakia and Slovenia. Including storage locations in Eastern Europe, which were new EU member states at the time, was an import-ant aspect.
Results of the GeoCapacity projected were included in a second EU project, CO2SToP. The main goal of CO2SToP (completed in 2014) was to compile a European-wide

6
dataset of geological parameters and store it in a public database, thus making it possible to estimate CO2 stor-age capacities centrally using a common methodology.
Detailed storage atlases have been developed for other regions and countries currently hosting CCUS projects, including North America, Norway and Australia. The Nor-wegian North Sea Storage Atlas, developed and pub-lished by the Norwegian Petroleum Directorate, consid-ers all relevant geological formations in the study area. It includes extensive seismic and drilling data, which could be used due to free access to the exploration and pro-duction data. The CO2 Storage Atlas of the United States and Canada covers almost all of the North American continent. Due to the size of the area studied, it has been divided into seven regions. A ‘carbon sequestration part-nership’ evaluated capacity for each region. In the US studies, a uniform assessment methodology was applied in each region.
Additional storage projects and atlases include the Queensland CO2 Geological Storage Atlas, the Regional Assessment of the Potential for CO2 Storage in the Indian Subcontinent, the Potential and Suitability Evaluation of CO2 Geological Storage in Major Sedimentary Basins of China and the demonstration project in the Ordos basin.
It must be stressed that national storage assessments, even when they are available, may differ in their underly-ing assumptions and cannot be compared or aggregated to provide regional estimates of CO2 storage (IEA, 2013; Kearns et al., 2016). There is a strong need for a common procedure to “allow for a transparent and robust assess-ment of geological CO2 storage, throughout the world, across geologic settings, regardless of the amount of geological data” (IEA, 2013).
Given the distances often found between supply and storage sites, establishing an infrastructure to transport CO2 is key component for successful implementation of CCUS.
2.5 Transport and infrastructure for CCUSAt present, steel pipelines are the most common means to transport large quantities of gas safely and cost-effec-tively over long distances. Pipeline transport of natural gas and oil is a mature technology used worldwide with several million pipelines operating globally. A main ad-vantage is that pipelines allow continuous transport without needing additional intermediate storage.
Since the 1970s, starting in the United States, more than 6,000 km pipelines for CO2 transport have been con-structed and operated. To use pipeline capacities in a cost-effective manner, CO2 is compressed into a super-critical state, giving it the density of a liquid but the vis-cosity of gas, which eases flow through the pipelines. Pipeline pressure is determined by hydraulics and re-
pressurization stations may be needed to maintain the supercritical state of the CO2, with obvious implications on pipeline cost (Mallon et al., 2013).
Corrosion of steel by carbonic acid is an additional de-sign issue related to pipeline transport of CO2. Captured CO2 contains small percentage of water, which may react and form corrosive carbonic acid. The reaction could be controlled by drying the separated CO2 to reduce the water content or by constructing pipelines using non-corrosive materials such as stainless steel. As the cost of each option varies with routing and the quantity of transported CO2, the question of which is economical-ly reasonable must be decided for each project.
A second option is to transport CO2 via dedicated ships, as the properties of liquefied CO2 are similar to liquified petroleum gas (LPG). Shipping of small volumes of CO2 (<1,500 cubic meters) is currently practiced in the indus-try; the technology could be scaled up to larger carriers, making options to transport larger volumes likely in the future (Santos, 2012).
To select the appropriate means of transport and build up infrastructure, stakeholders must consider the quan-tities of CO2 and the distances to be covered between capture and storage sites CO2.
To minimize investment risk in the early stages of CCUS development, CO2 transport infrastructure is likely to be developed as ‘point-to-point’ links between a single emission source and a particular storage site. Over time, such bilateral links could be superseded by infrastruc-ture clusters, in which emissions from several CO2 sourc-es are combined and collectively transported by pipeline to a common storage site. Spreading the transport cost over several emitters would achieve economies of scale, thereby bringing the cost to each below what a stand-alone project would entail for a single source.
Given the above considerations of available storage sites, available CO2 supply and the need for infrastruc-ture and transportation to link them, planning for CO2 clusters is an efficient and cost-efficient approach. In ad-dition to facilitating aggregation of variable demand across diverse storage projects while also supporting stable supply, the ability to share infrastructure can re-duce overall costs for all stakeholders.

7
3. Assessment of CO2 Storage Potential
The starting point for determining geological storage potential in a given country is to identify the location and features of sedimentary basins. In a next step, the suit-ability of basins for storage should be assessed from qualitative and quantitative perspectives. The first im-plies investigating their ‘storage prospectivity’; the sec-ond aims to estimate the volume of CO2 a given forma-tion can store.
At present, available and revelent geological information varies widely. However, for all types of storage on a glob-al scale, incomplete knowledge and limited access to data pose challenges for robust capacity estimates. As a result, while a good understanding exists of available storage in some OECD countries with high CO2 emissions (including the EU, North America and Australia), a global storage assessment is in its early phase of development.
It is important to note that storage potential – as is the case for other mineral resources – is a depletable natural resource, with its availability decreasing whenever it is used. To aid the evaluation and management of these resources the United Nations Classification for Resourc-es provides a global framework to specify maturity and resource progression for projects. It can be adopted to categorize individual CO2 injection projects according to geological knowledge, technical feasibility and econom-ic viability (UNFC, 2019; see Appendix).
3.1 Qualitative assessment of storage‘How well’ a given basin can store CO2 is the first ques-tion to explore. Since CO2 storage is dependent on the presence of sedimentary basins, carrying out a qualita-tive characterization of those available is a critical first step. For each basin, this includes collecting information on the size and location, the thickness and type of sedi-ments it comprises and details of its geology. This infor-mation helps identify basins most suitable for storage. Next step involves grading basins in terms of their likely suitability for storage (Bachu, 2003). Typically done by a panel of experts, this is a qualitative exercise delivering a ranking of basins in terms of their perceived storage ‘pro-spectivity’.
3.2 Quantitative assessment of storage‘How much’ is the second crucial question of storage potential. Key determining factors are the volume of the storage formation and the available pore space. In addi-tion, temperature and pressure at storage depth are esti-mated, as they determine the amount of CO2 stored per unit volume of porous rock. At depth, low temperatures
are preferred over warm as CO2 can attain higher mass density, allowing for more effective utilization of the available storage space.
During the injection phase and for an extended period thereafter, physical storage mechanisms dominate the trapping of CO2 – to the degree that quantitative storage assessment considers only these processes. Chemical storage mechanisms, which tend to immobilize CO2 only over longer period of time, are typically disregarded in storage capacity assessments.
3.3 Aquifer storage capacityStorage capacity in aquifers is assessed based on a volumetric estimate, which in one or the other form, is used internationally as
G=A×h×φ×ρ×E
where G denotes the technically available storage capac-ity (TASR), A is the areal extent of the region assessed. H denotes the gross thickness of the saline formation; φ its porosity; and ρ the mass density of CO2 at subsurface pressure and temperature. The symbol E denotes the ef-ficiency of storage, defined as the share of pore volume that can be filled with CO2.
The TASR comprises the pore space that can be reason-ably expected to retain CO2 over a long period of time without adverse environmental impact, calculated on the basis of present-day geologic and hydrologic knowl-edge and engineering practices. In this sense, the TASR represents an ‘upper limit’. Factors that could constrain available pore space include:
• Engineering considerations related to the technolo-gies available to access pore space
• Economics and cost
• Socio-political considerations including public ac-ceptance and regulatory limitations
These highlight the difference between the technically available capacity in aquifers and the volume of storage that can actually be used. Taking decisions on what con-straints to apply is part of any CO2 storage assessment activity.

8
3.4 Oil reservoir storage capacityIn the case of oil fields, storage potential can be estimat-ed based on available geological and petrophysical data generated and collected because of commercial inter-ests. Here, CO2 storage via EOR is determined by multiple factors acting in combination that, in turn, depend on the geology of the reservoir and, importantly, on the im-plementation of recovery.
Until recently, EOR was largely viewed as a technology to optimize oil production, with oil companies needing to purchase CO2 for injection. Thus, EOR operators carefully calculate the utilization factor – i.e. the amount of CO2 (in tonnes) used to produce an additional barrel (bbl) of oil – and have an economic interest to achieve a given oil production rate with as little CO2 as possible. EOR is car-ried out only until the tipping point at which CO2 costs exceed the revenues gained from putting extra oil on the market. Yet virtually all CO2 purchased for injection to support EOR ultimately remains stored in the reservoir.
The potential to shift the practice of EOR to a mechanism than can actually reduce CO2 emissions – in effect ‘decar-bonizing oil’ – has emerged only recently. By changing how EOR projects operate, it is possible to significantly increase the volume of CO2 injected so that emissions linked to the additional oil produced are partly or fully offset. With active operational reservoir and well man-agement significantly higher CO2 utilization factors are possible – and would thus support greater CO2 storage.
In the United States, for example, for every barrel of oil currently produced, ~0.3-0.4 tonnes of CO2 (tCO2) are in-jected and stored while combustion of oil releases 0.4 tCO2 to the atmosphere (McGlade, 2019). The IEA (2015) estimates that operations aiming to co-exploit oil pro-duction and storage could see a CO2 utilization of ~0.6 tCO2/bbl , and refers to this EOR scenario as “Advanced EOR+” to distinguish it from “conventional” EOR. The net utilization of CO2 could further increase to up to 0.9 tCO2 when the focus of EOR is on storage. In this case, on a per barrel basis, more CO2 is stored at production than is released upon combustion at the consumer end.
This suggests that EOR may have an important role during the initial phases of CCUS development. As the scope for implementing EOR hinges on narrow geophys-ical and reservoir engineering constraints, it may not present a storage opportunity in all fields. Nonetheless, as oil revenue from EOR offsets some of the cost associ-ated with CO2 storage, it can provide an economically attractive storage option.

9
4. Assessing CCUS Potential in the Focus Region
Assessing CCUS potential in South-Eastern and Eastern Europe, the Caucasus and Central Asia is particularly challenging due to a scarcity of publicly available geo-logical data. To date, no one has undertaken reasonably detailed evaluations of CO2 storage prospectivity of ba-sins in the region or carried out comprehensive quantita-tive assessments of storage potential. As closing this gap is beyond the scope of this report, it aims to do two things:
• Identify basins in the region that are ‘very suitable’ for storage, but without the ambition to provide a full-fledged and detailed storage prospectivity map
• Identify and review existing quantitative assess-ments for countries for which they are available
A recent IJGGC paper featured the concept of a ‘storage readiness level’ (SRL) (based on the widely used concept of technology readiness levels), which will support fur-ther capacity assessments (Akhurst et al. 2021). While the early work regarding SRLs is not yet published, it should be taken into consideration in future work re-garding CO2 storage capacities, particularly to help cata-
logue the varying levels of detail captured within individ-ual capacity assessments. This will allow for a more standardized approach to analyzing the status of storage assessments internationally.
4.1 Qualitative assessmentThe following analysis is based on the publicly accessible Robertson Basins and Plays database (2020), which con-tains information on the location and extent of sedimen-tary basins worldwide.
Ninety-five basins are identified in the region of interest. Seventeen of these basins are categorized in the data-base as being well explored with discovered hydrocar-bon occurrences. As characteristics of these basins are well known, they are prime targets for CO2 storage. This is relevant for the location of both hydrocarbon reser-voirs and aquifers, as when exploring for hydrocarbon, developers often drill ‘dry wells’, which may indicate the presence of aquifers suitable for storage. Basins identi-fied are listed in Table 1 and shown geographically in Figure 3.
Table 1 Basins particularly suitable for storage, ordered according to their extent
Relative extent Basin name Basin and plays
province Max. sediment thickness (km) Location
1 Central Sub-basin - West Siberia West Siberia Sag 16 Onshore & Offshore
2 Amu-Dar'ya Turan Platform 15 Onshore
3 Pannonian Trans-Carpathian Transtensional 7 Onshore
4 North Caucasus Paracaucasus Retro-arc 14 Onshore & Offshore
5 Indolo-Kuban Paracaucasus Retro-arc 11 Onshore & Offshore
6 Sinai - Levant Arabian Passive Margin 11 Onshore & Offshore
7 Moesian Platform Para-Tournquist Platform 12 Onshore & Offshore
8 Euphrates - Sinjar Arabian Foreland 9 Onshore
9 Northern Carpathians Carpathian Foreland 12 Onshore
10 Southeast Turkey Foldbelt Arabian Foreland 10 Onshore & Offshore
11 Dnieper - Donets Ukrainian 20 Onshore

10
Figure 3 Maps of basins in the region of interest; those particularly suited for CO2 storage are in redtent
Source: C. Weismüller and W. Heidug
Source: C. Weismüller and W. Heidug
12 Kura - Kartli Transcaucasus Retro-arc 11 Onshore
13 Southern Carpathians Carpathian Foreland 9 Onshore
14 Fergana Turan Platform 10 Onshore
15 Pripyat Ukrainian 6 Onshore
16 Thrace Aegean Extensional 9 Onshore & Offshore
17 Rioni Transcaucasus Retro-arc 8 Onshore & Offshore

11
Criteria used to select basins that show potential are simple but rather stringent. In particular, they imply the exclusion of storage potential in basins with limited ex-ploration and in geological settings without hydrocar-bon systems. The storage potential of Kazakhstan is a case in point: it is not recognized in this report because of exploration status of the relevant basin is insufficient (Abouv, 2020). Overall, more detailed studies are needed to provide a complete classification of basins in the countries of interest according to their storage prospec-tivity.
4.2 Quantitative assessmentProducing quantitative assessments for storage poten-tial in the region of interest is a much more challenging task.
For the Eastern Europe, the Caucasus and Central Asia areas, the GeoCapacity project (GeoCapacity, 2009) re-mains the best source of the most up-to-date storage assessment data publicly available. Additionally, the IE-AGHG conducted a review of CO2 storage potential in basins with CO2-EOR potential, which included sites in Kazakhstan, Russia and Turkmenistan (IEAGHG, 2009). A report by Kearns et al. (2017) also sought to develop a consistent database for regional geologic CO2 storage capacity worldwide, which included ‘Other Eurasia’ alongside an assessment of EU countries as a whole. Some of the relevant countries have published national storage assessments, which are summarized in the fol-lowing section.
4.3 Aquifer assessment in countries of interestAs noted in Section 2, saline aquifers may provide the largest CO2 storage capacity worldwide. To date, no re-gional estimates of saline aquifers are available for the Eastern Europe, Caucasus and Central Asia regions. Lim-ited public availability of quantitative data on aquifer storage potential is a particular challenge in this region. As exploration of the subsurface through seismics and drilling is costly, it is typically not undertaken without economic rationale. As a result, data for storage in saline formation is low compared to that for oil and gas fields. Some countries have carried out national assessments, the findings of which are listed below.
Albania reports a conservative, ‘effective CO2 storage’ capacity estimate for aquifers of 20 million tonnes (Mt) (Hatziyannis, 2009). This volume is based on a salt dome in the Dumrea area (south of Elbasan) with a large diapir-ic body extending to a depth of 5km, with potential to store CO2 in salt caverns. While a specific site has been identified and an initial assessment conducted, an initial storage concept has not yet been fully developed. (Note: A second study assessed Albania’s hydrocarbon fields.)
Azerbaijan is part of an extensive petroleum system in the South Caspian basin province, along with Iran and Turkmenistan, suggesting the presence of storage po-tential in both aquifers and oil fields. At present, no esti-mates for CO2 storage capacity are publicly available, but SOCAR (the state-owned oil company) has expressed interest in developing CCUS in the region (Hellenic Ship-ping News, 2019). The USGS published information on the hydrocarbon provinces of the Caspian Sea (Smith-Rouch, 2006) but public information on geology at a ba-sin scale seems to be limited (Alizadeh et al., 2017).
Bosnia and Herzegovina estimates 296 Mt of storage capacity in saline aquifers, based on assessment of the Sarajevo-Zenica basin (GeoCapacity, 2009). This should be considered a ‘first-pass’ estimate at basin scale; the geometry of the reservoir is not yet well constrained and more data acquisition is required.
Kazakhstan estimates 403 Gt of storage in saline aqui-fers (Abuov 2020), largely in the carbonate platforms in the pre-salt section of Precaspian basin and in post-salt clastic reservoirs trapped by salt-dome. Details on the assessment methodology are limited, but it appears to be a first-pass assessment.
North Macedonia estimates storage capacity of 390 Mt in an aquifer near the town of Kavadarci (GeoCapacity, 2009) and notes a potential maximum capacity of 1,050 Mt. The national geology mainly comprises crystalline rocks, which are not suitable for storage. The assessment is therefore based on an aquifer in Eocene sediments capped by clays, in which water has a salinity of 10,000 parts per million (ppm). Given that a site has been iden-tified, and the structural map and wells assessed to cal-culate a first-pass capacity assessment, this site is at a low SRL. (Note: No hydrocarbon deposits have been identified in the country.)
Russia A report by Shogenova et al. (2011) included NW Russia in aquifer storage capacity estimates but ulti-mately concluded data were insufficient to estimate ca-pacity for the full country. This report stated that in the European part of Russia, the Middle Cambrian sand-stones of the Tiskre Formation are the most prospective aquifer, although many areas of it are too shallow. A depth of >800 m occurs only in the south-east of the Novgorod Region, within the limits of the Moscow Syne-clise and at a distance of >200 km from the Eesti Power Plant.
Serbia has not published any quantitative capacity esti-mates but has identified 17 potential localities and re-viewed their geology (Komatina-Petrovic, 2007). With eight potential sites identified, the Vadar zone was high-lighted as having the most suitable geology for CO2 stor-age.
Turkey has conducted a few storage assessments, focus-ing primarily on depleting oil and gas fields. Deep saline

12
Figure 4 Map of the region studied near Estonia, with the Moscow Basin area of Russia highlighted to show its extent
Source: Shogeniova et al. 2011
aquifers found in Thrace region, Central Anatolia and South Eastern Turkey, as well as salt caverns of soda mines, have also been identified as potential storage options; to date, no capacity estimations have been made (Okandan et al., 2011).
(Note: The Turkish Ministry of Environment and Urban-ization (2013) conducted a capacity assessment for po-tential CO2-EOR projects and associated storage, which estimated ~108 Mt of capacity in the fields in Batman, Adıyaman and Thrace regions.)
Ukraine, as shown by two reports (Donetsk National University, 2013; Nedopekin et al., 2019), has storage potential in the Donbass region, located in eastern Ukraine and part of south-western Russia. The reports state total potential of 45.7 to 428 Gt. While no detailed
capacity estimations were calculated, the geology in the area has been reviewed, uncovering several promising areas within Paleozoic sediments of the Donbass region, eight of which have been ranked for potential suitability (Nedopekin et al. 2019). This review implies that some elements of capacity are known based on geology, but these are not presented in the report.
No assessments could be found regarding CO2 storage in aquifers in Armenia, Azerbaijan, Belarus, Georgia, Kyr-gyzstan, Moldova, Montenegro, Tajikistan, Turkmenistan, Ukraine or Uzbekistan.
13
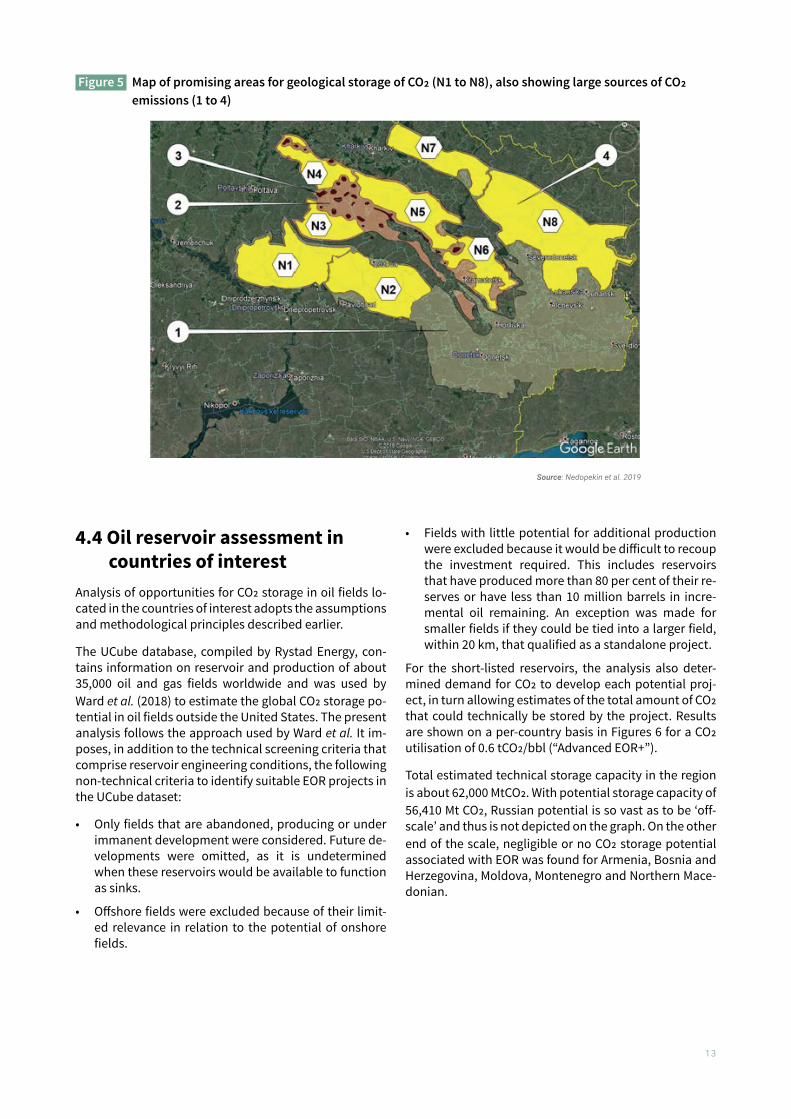
Figure 5 Map of promising areas for geological storage of CO2 (N1 to N8), also showing large sources of CO2 emissions (1 to 4)
Source: Nedopekin et al. 2019
4.4 Oil reservoir assessment in countries of interest Analysis of opportunities for CO2 storage in oil fields lo-cated in the countries of interest adopts the assumptions and methodological principles described earlier.
The UCube database, compiled by Rystad Energy, con-tains information on reservoir and production of about 35,000 oil and gas fields worldwide and was used by Ward et al. (2018) to estimate the global CO2 storage po-tential in oil fields outside the United States. The present analysis follows the approach used by Ward et al. It im-poses, in addition to the technical screening criteria that comprise reservoir engineering conditions, the following non-technical criteria to identify suitable EOR projects in the UCube dataset:
• Only fields that are abandoned, producing or under immanent development were considered. Future de-velopments were omitted, as it is undetermined when these reservoirs would be available to function as sinks.
• Offshore fields were excluded because of their limit-ed relevance in relation to the potential of onshore fields.
• Fields with little potential for additional production were excluded because it would be difficult to recoup the investment required. This includes reservoirs that have produced more than 80 per cent of their re-serves or have less than 10 million barrels in incre-mental oil remaining. An exception was made for smaller fields if they could be tied into a larger field, within 20 km, that qualified as a standalone project.
For the short-listed reservoirs, the analysis also deter-mined demand for CO2 to develop each potential proj-ect, in turn allowing estimates of the total amount of CO2 that could technically be stored by the project. Results are shown on a per-country basis in Figures 6 for a CO2 utilisation of 0.6 tCO2/bbl (“Advanced EOR+”).
Total estimated technical storage capacity in the region is about 62,000 MtCO2. With potential storage capacity of 56,410 Mt CO2, Russian potential is so vast as to be ‘off-scale’ and thus is not depicted on the graph. On the other end of the scale, negligible or no CO2 storage potential associated with EOR was found for Armenia, Bosnia and Herzegovina, Moldova, Montenegro and Northern Mace-donian.

14
Figure 6 Total CO2 storage capacity for Advanced EOR+. As Russian capacity dwarfs that of other countries it is not shown for graphical reasons
4.5 CO2 supply determines how much can be practically stored
Preceding content assumes that CO2 is readily available to be stored in locations identified. This is a courageous assumption as it suggests a collocation of CO2 sources and sinks, which is unlikely to be met in reality. To devel-op a more realistic picture of the practical relevance of CO2 storage – that is, what contribution it can make to reducing emissions – it is essential to understand the supply side of CO2 and specifically the location of CO2 sources.
For this, analysts can draw on data from Rystad Energy CCS database, which provides the geographic distribu-tion of stationary CO2 sources, tracks reported emissions
Figure 7 Geographical distribution of stationary emission sources in 2018. Shown are regions with average annu-al emissions ranging from 5 million tonnes CO2 (yellow) to 50 thousand tonnes (light blue)
Total Storage Capacity (Mt) Advanced EOR+
Kazakhstan
KAZAKHSTAN
Turkmenistan
TURKMENISTAN
Azerbaijan
AZERBAIJAN
UkraineUKRAINE
Turkey
TURKEY
Belarus
BELARUS
Uzbekistan
UZBEKISTANGeorgia
GEORGIA
Serbia
SERBIA
Albania
ALBANIA
Tajikistan TAJIKISTAN
Kyrgyzstan
KYRGYZSTAN
0 500 1000 1500 2000 2500 3000
and models emissions for facilities when data are not available. Emission sources include:
• Power generation from coal or gas• Iron and steel production• Cement production• Gas production• Fertilizer production• Ethanol production
Source: Rystad Energy CCS database

15
4.6 CO2 supply and storage clusters in focus countries and region
To determine how much of CO2 can be practically stored, emissions from sources would need to be matched to storage capacity of sinks. Given the uncertainty regard-ing location and storage potential of aquifers, current information does not allow this matching to be done for them. The situation is more encouraging for oil reser-voirs. After determining potential CO2 sources (from Rystad CCS database) and CO2 demanded (from UCube) for candidate EOR projects, viable supply/demand pairs were identified by selecting the closest source with suffi-
Figure 8 Storage potential and clusters Eastern Europe and Central Asia with Advanced EOR+ using CO2 from currently available sources
KA ZAKHSTAN
SERBIA
UKRAINE
BELARUS
TURK EYTURK MENISTAN
UZBEKISTAN
Advanced EOR Storage Capacity (Mt)
Kazakhstan
Turkmenistan
Azerbaijan
Ukraine
Turkey
Belarus
Uzbekistan
Georgia
Serbia
Albania
Tajikistan
Kyrgyzstan
05 0 100 150 200 250 300 350 400
AZERBAIJAN
GEORGIA
cient supply for each project. For this matching, the fol-lowing conditions were imposed:
• The maximum distance for CO2 transport from source to sink was arbitrarily set at 500 km.
• It was stipulated that CO2 supply must be sufficient to meet peak CO2 demand of the EOR project.
• Political boundaries were disregarded so that CO2 is freely transported across state boundaries.
Results of this matching are shown in Figure 8 and sepa-rately for Russia in Figure 9.
Figure 9 Storage clusters in Russia with Advanced EOR+ using CO2 from currently available sources
Yamal: 859 Mt
Volga Area: 7578 Mt
Southern: 471 Mt
Western Siberia 2642 Mt
All other fields: 348 Mt
16
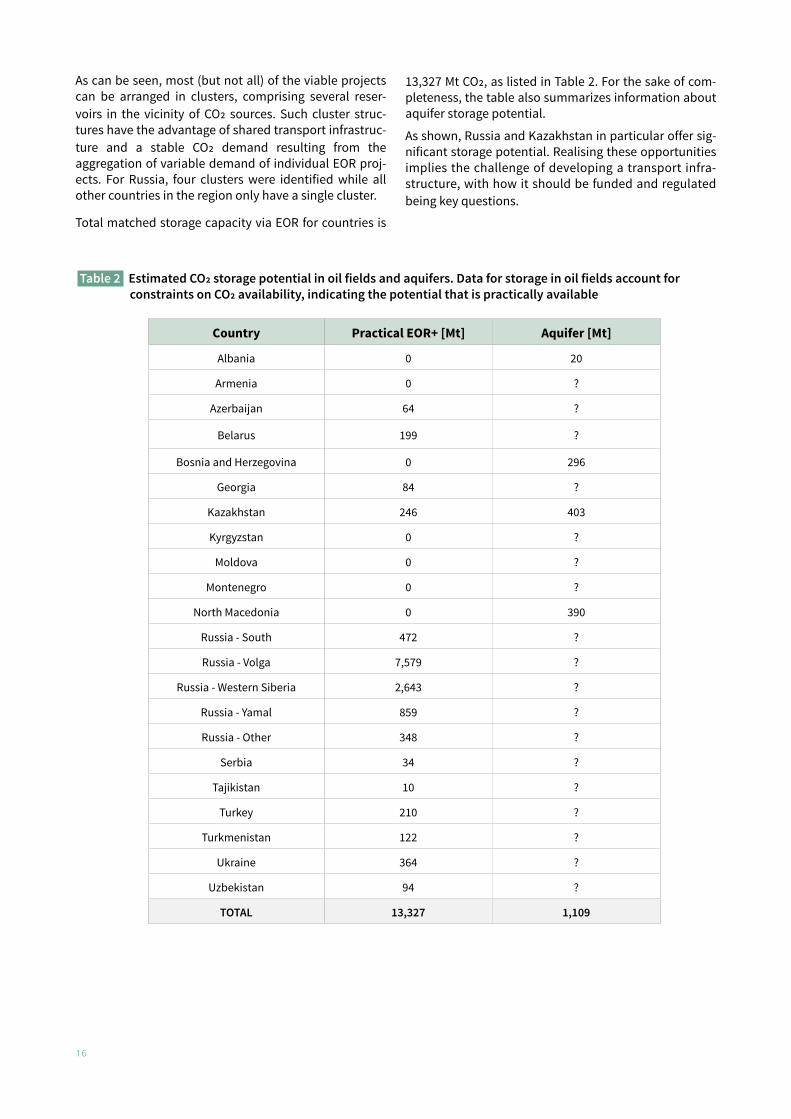
Table 2 Estimated CO2 storage potential in oil fields and aquifers. Data for storage in oil fields account for constraints on CO2 availability, indicating the potential that is practically available
As can be seen, most (but not all) of the viable projects can be arranged in clusters, comprising several reser-voirs in the vicinity of CO2 sources. Such cluster struc-tures have the advantage of shared transport infrastruc-ture and a stable CO2 demand resulting from the aggregation of variable demand of individual EOR proj-ects. For Russia, four clusters were identified while all other countries in the region only have a single cluster.
Total matched storage capacity via EOR for countries is
Country Practical EOR+ [Mt] Aquifer [Mt]
Albania 0 20
Armenia 0 ?
Azerbaijan 64 ?
Belarus 199 ?
Bosnia and Herzegovina 0 296
Georgia 84 ?
Kazakhstan 246 403
Kyrgyzstan 0 ?
Moldova 0 ?
Montenegro 0 ?
North Macedonia 0 390
Russia - South 472 ?
Russia - Volga 7,579 ?
Russia - Western Siberia 2,643 ?
Russia - Yamal 859 ?
Russia - Other 348 ?
Serbia 34 ?
Tajikistan 10 ?
Turkey 210 ?
Turkmenistan 122 ?
Ukraine 364 ?
Uzbekistan 94 ?
TOTAL 13,327 1,109
13,327 Mt CO2, as listed in Table 2. For the sake of com-pleteness, the table also summarizes information about aquifer storage potential.
As shown, Russia and Kazakhstan in particular offer sig-nificant storage potential. Realising these opportunities implies the challenge of developing a transport infra-structure, with how it should be funded and regulated being key questions.

17
4.7 Economics of CO2 storage in focus country oil fields
In EOR, a key financial indicator of profitability is the project’s net present value (NPV), which compares – in current values – revenues and expenditure occurring over the project lifetime. Those having a positive NPV will be profitable. Calculation of the NPV also reveals the main drivers of profitability; in turn, this is relevant for designing policy to encourage CO2 storage via EOR.
A key parameter for the profitability of an EOR project is the supply price of the injected CO2, which could be neg-ative or positive. In the case of current US projects, where the operator purchases CO2 used for EOR, the price is negative. If, by contrast, an operator was paid for long-term storage of CO2 as part of an emissions reduction scheme within climate policy, the price could be positive. In this latter case, the CO2 supply price factors in the cost of CO2 capture from emission sources, the cost of trans-
port to the storage site and the CO2 emission price result-ing from climate change policy. For example, assuming a cost of $50/tCO2 for capture and transport, a $10/t CO2 supply price would be consistent with an emission pen-alty of $60/tCO2. Whether it is positive or negative, the supply price needs to be sufficiently high for the NPV at least to break-even, i.e. for NPV=0.
A detailed calculation of the NPVs for all the EOR projects in the clusters identified above is difficult and far beyond the scope of this study. It would require commercially sensitive data on cost as well as simulations of the pro-duction and storage performance of individual reser-voirs, which in turn requires a rather detailed geological model of storage formation and reservoir. However, with simplifications and plausible assumptions, it is possible to generate estimates of the NPVs of potential projects to provide high-level guidance for policy making. The pres-ent analysis builds on the estimation procedure de-scribed in Ward et al. (2018).
Box 2 Storage cost: data and considerations
CO2 capture cost represents the most expensive element of the CCUS technology chain and varies with appli-cations. The Global CCUS Institute (2017) reports the following data for first-of-kind (FOAK) and next-of-a-kind applications (NOAK):
Onshore pipeline cost exhibits modest economies of scale. Morgan and Grant (2014) report a value of $3.10/tCO2/100 mi for a capacity of 3.2 MtCO2/year decreasing to $1.10/tCO2/100 mi for a capacity of 30 MtCO2.
Aquifer storage cost is in the range of $7.00-13.00/tCO2, depending on reservoir properties (USDOE, 2014).
Storage through EOR incurs additional costs related to drilling of infill wells, CO2 recycling and compression, all of which are considered in the calculation of NPVs.
Power generation Industrail sources
$/tCO2 PC Supercritical
Oxy-comb. Supercritical IGCC NGCC Iron and
Steel Cement Natural Gas Fertilizer Biomass to Ethanol
FOAK 74-83 66-75 97 89 77 124 21.5 25.4 21.5
NOAK 55 52 46 43 65 103 20.4 23.8 20.4

18
Figure 10 Effect of CO2 supply price on economic storage potential for EOR projects in clusters. Selected projects are highlighted for illustrative purposes.
Mill
ion
Tonn
es o
f CO
2 Sto
red
Breakeven Cost or Value of CO2/tonne
Figure 10 depicts the CO2 supply prices at which NPV breaks even for all potential EOR projects in the clusters, together with the corresponding volume of CO2 stored. Underlying this figure are NPV calculations, using the same set of assumptions on capital expenditures, oper-ating cost, oil production and CO2 injection profiles as in Ward et al. The discount factor is set at 10 per cent flat.
As Figure 10 illustrates, CO2 breakeven prices vary among different projects. Additionally, changes in oil prices
have predictable consequences. Higher oil prices corre-spond with lower break-even CO2 prices, since producers find more value in using CO2 to increase production – and will do so even if paid less for CO2 storage. As shown, adoption of EOR throughout the region would require CO2 supply prices in excess of $60/tCO2 when oil prices are in the order of $50/bbl.

19
5. Policies for CCUS
At present, development and deployment of CCUS is lagging behind the scale needed to fulfil its projected role in climate change mitigation.
Given the importance of CCUS for achieving global emis-sions reduction goals, a policy framework and incentives are needed to accelerate it to commercial-scale deploy-ment. To provide credibility and legitimacy to attract in-ternational climate funding, such a scheme should be established internationally under the auspices of the UNFCCC and in line with the COP21 Paris Agreement.
Given the scale of CCUS deployment required, interna-tional and domestic actions need to be complementary, reflecting multilateral cooperation. The various mecha-nisms established under the UNFCCC for financing clean energies could provide the appropriate platform. Article 2 of the Kyoto Protocol, for example, explicitly mentions geological storage and encourages Parties to implement and elaborate policies on the development and in-creased use of carbon sequestration technologies. The IPCC Special Report on Carbon Dioxide Capture and Storage (IPCC, 2005) provides the scientific and technical basis for further policy actions. Important milestones in-clude:
• Agreement of the 2006 IPCC Guidelines on National Greenhouse Gas Inventories (IPCC, 2006), thereby es-tablishing an international framework for countries to monitor and report emissions reduction from CCUS. The agreement proposes protocols for site characterization, modelling of potential leakage pathways and monitoring to ensure that injected CO2 remains isolated from the atmosphere indefinitely. De facto, the Guidelines establish a high-level regula-tory framework for CCUS (Figure 11).
• Agreement, in 2012, of modalities and procedures for CCUS as a clean development project activity (UNFC-CC, 2011). This established guidelines and safeguards by which CCUS projects could earn certifiable emis-sions reduction (CER) through the Clean Develop-ment Mechanism (CDM) of the Kyoto Protocol. It thus laid the foundation for financing CCUS in developing countries. Subsequent collapse of the CER market (late 2012) caused interest in using the CDM for fi-nancing CCUS projects to wane.
Figure 11 Procedures for estimating emissions from CO2 storage sites
Source: IPCC, 2006
The COP21 Paris Agreement provides a framework for international cooperation on mitigating CO2 emissions, including a blueprint for the international flows of cli-mate finance. All signatory countries set their emissions reduction goals in the form of nationally determined contributions (NDCs). Using a range of mechanisms and options outlined in Article 6, the Agreement allows coun-tries to embark on cooperative strategies with other countries in order to meet or exceed the level of ambition set out in their own NDCs. The Article aims to open new avenues for flexible cooperation among countries to de-liver mitigation outcomes, particularly when they align around common interests.
The COP21 Paris Agreement also supports cooperation among countries in pursuit of NDCs through the forma-tion of ‘climate clubs.’ This creates the possibility to es-tablish a ‘CCUS club’ with the primary aim being to pool finance and technical resources to make deploying CCUS a prominent part of climate mitigation strategies, both domestically and via multilateral processes. Such a club would not necessarily need to include all countries but would need motivated members with technical interest and financial capability to deploy CCUS. Membership could increase over time, based on demonstrated bene-fits drawn from early experiences. Developed countries, with the greatest long-term interest in CCUS technology, may be interested in supporting CCUS projects in other countries for a number of reasons:

20
Figure 12 Distinct stages of CCUS technology development can be related to the level of CCUS unit cost and stringency of carbon policy as expressed by carbon prices
Source: IEA, 2012
• Introducing CCUS to a variety of environments, in-cluding non-OECD countries, may lead to greater learning than regionally concentrated pilots and demonstrations
• CCUS development may be possible at lower cost
• Benefits of reduced climate change damage accrue globally, no matter where CO2 is captured and stored
• Article 6 of the COP21 Paris Agreement provides the basis for establishing mechanisms through which co-operative action could flow
5.1 Policy instruments to acceler-ate CCUS deployment
As is the case for policy intervention in technology devel-opment and deployment, it is important to design poli-cies that are appropriate to various stages of CCUS mat-uration. It is helpful to adopt the view that the path to market comprises three main stages that link and over-lap (IEA, 2012; Krahé, 2013; Grubb, 2014) (Figure 12).
Early-stage support
Aiming primarily to incentivize research and develop-ment, support for CCUS applications in the early stages is likely to require capital grants and operating subsidies. Faced with a combination of technology risk, immature regulatory and policy frameworks, and low or absent market revenues, investors will be reluctant to commit substantial sums. Public funding via capital grants and operating subsidies could ensure that CCUS projects are demonstrated to allow for basic learning. The extent of public sector involvement is likely to vary from country to country depending on factors such as:
• Governmental ownership of the sectors involved
• Political concerns regarding pass-through of CCUS cost to customers (e.g. in the electricity sector)
• The strategic role of CCUS for building a country’s technical capabilities and for its climate ambitions
The first ‘demonstration phase’ (early) establishes the technical viability of CCUS for practical deployment (IEA 2012). In the second (middle) ‘market formation’ phase, the technology is exposed to limited market-based learning that, in turn, reduces risk and cost to enhance investor confidence. In the case of CCUS, this form of early market experience could come from sector-specific deployment in niche markets where CCUS could be im-plemented at low cost, such as EOR. Finally, ‘diffusion’, the third (late) stage of the deployment path, involves wide-scale deployment driven by economies of scale, infrastructure and regulatory developments that togeth-er allow CCUS to compete as a mature technology with other CO2 emissions reduction options.
The nature, scale and scope of policy instruments need to be calibrated to the specific phases of CCUS develop-ment and deployment. Rather than a single instrument, CCUS requires an integrated policy framework compris-ing a suite of policy instruments, each designed to re-spond to the need of a particular technology develop-ment phase.
Generally, this can be thought of as the ‘policy push’ phase of support as instruments are designed to be ap-propriate for pre-commercial technologies.
Mid-stage support
At this stage, the technology is proven but significant scale-up of deployment is needed to realise cost reduc-tion potential. As the benefits of lower cost will not be fully retained by those investing, technology-specific policies to support CCUS may be justifiable. This is broadly the stage that many more mature renewable energy technologies are successfully navigating.
Policies in this stage could consist of a quantity-support mechanism, e.g. a governmental purchasing contract or a portfolio standard with infrastructure support policy. Such a scheme might work, for instance, by governments committing to purchase a certain (and perhaps increas-ing) number of CCUS storage certificates each year, with

21
Besides AMC, other market-pull instruments have been designed to artificially create rents, thereby making investments in CCUS more attractive. Three types of instruments discussed here (Gosh et al., 2012) share the characteristic of providing ex post financial support, based on verified emissions reduction.
Direct purchase
Under direct purchase, participants purchase verified emissions reduction through CCUS directly from a cen-tral authority or the government. The central authority or regulator would offer to buy CCUS reductions at a pre-specified price using public funds. Determining who gets to sell the CCUS reductions and at what price are key policy design questions. Allocating funds via a reverse auction could be a cost-effective solution. The cen-tral authority would solicit bids from CCUS investors who specify the volume of CO2 they are willing to supply at a given price. The central authority then chooses the bids with the lowest prices.
Top-up instrument
Under a top-up mechanism, the government tops up revenues from the sales of verified CCUS reductions to a pre-agreed value of CCUS reductions. More specifically, the instrument could be structured to have the central authority pay CCUS investors or CCUS reduction vendors the difference between an agreed price and the pre-vailing carbon price (i.e. the carbon tax rate or the market price of emission permits) when the CCUS reductions or the corresponding credits are delivered to market. If the prevailing carbon price exceeds the agreed-upon price when the CCUS investor is ready to deliver the emissions reductions – the central authority pays nothing, the CCUS investor’s obligation to the buyer ends, and the credits are simply offered on the market for a higher price. As in the previous case, a reverse auction may be a cost-effective solution to deploy this instrument.
Tradable options
Tradable options give the option holder the right to sell verified emissions reduction at a specified price before a specified date. For various reasons, a CCUS investor may not be able to deliver promised reductions. In this case, put option contracts could provide a possible solution. Such a contract provides the CCUS investors with the right, but not the obligation, to sell to the funder a certain number of reductions at a certain agreed price by a certain time (Müller, 2008; Pizer, 2011; Grüll and Taschini, 2011). If these contracts are tradable when the
these certificates obtained for every tonne of CO2 secure-ly stored.
A more innovative approach that combines mar-ket-based financing with public intervention could in-volve the creation of an ‘advanced market commitment’ (AMC). An AMC is a legally binding agreement that sup-ports the creation of a market for CCUS by guaranteeing ex ante the purchase (at a fixed price) of a number of CCUS credits for as yet unavailable CCUS technology. AMCs gained prominence in the public health sphere in the last decades, where they are generally used to pro-mote investments into vaccines for neglected diseases that disproportionally affect populations in the develop-ing world. Options other than AMC to channel public funds to support CCUS in a cost-effective manner are discussed in Box 3.
However, at the domestic level, these may not be suffi-cient to drive CCUS deployment at the scale required. International collaboration, in conjunction with perfor-mance-oriented market-pull instruments, may be neces-sary to attract the required investment to accelerate de-ployment. These efforts could be based on a storage crediting scheme for CCUS, of the type recently proposed
by Zakkour and Heidug (2019) and Zakkour et. al. (2020). A specific feature of this concept is that it invokes options for international climate financing created by the COP21 Paris Agreement (see below).
Mature stage support
When CCUS is mature, the presumption should be that deployment will be incentivized through carbon pricing instruments alone. The justification for the use of carbon pricing (e.g. carbon taxes and cap-and-trade programs) emerges from the observation that imposing a common price on emissions reduction has the effect of equalizing marginal costs across regulated firms. This ensures re-ductions are achieved cost-effectively – i.e. maximum emissions reduction at minimum aggregate cost. Carbon pricing is a technology-agnostic instrument in that it en-sures CCUS is deployed only when it is a cost-effective means of reducing emissions, with that cost-effective-ness improved by the earlier stages of support described above.
Box 3 Performance-oriented instruments to create market pull

22
current holder decides they are unlikely to use them, the possibility to sell them to other CCUS investors or CCUS reduction vendors ensures they will be used.
An important consideration across these instruments is that the first two contracts lock in the maximum po-tential revenues (the agreed-upon price). An option contract, by contrast, removes such obligation as the CCUS reductions vendor could simply sell emissions in the market and receive the market price. In fact, if the market price is higher than the agreed price, the CCUS reduction vendor is better off by selling into the market, and the option contract will not be exercised.
Storage-focused policy instruments of the type dis-cussed above could also play a role in supporting the development of a CO2 transport infrastructure. Given uncertainty in the future value of CO2 transport capacity, investors may hesitate to invest in CCUS infrastructure, potentially resulting in under-provision of transporta-tion services. This uncertainty is reduced through perfor-mance-based policy instruments that offer long-term contracts through which governments ‘buy’ a certain volume of securely stored CO2 within a certain time peri-od.
In this context, the IEA (2016) proposes the establish-ment of a public agency as an intermediary between emitter and storage companies. The agency would enter into long-term, ‘ship-and-pay’ contracts with storage service providers to develop storage sites and transpor-tation infrastructure. This arrangement effectively re-moves the CO2 delivery risk faced by the storage provider and could provide a bankable structure for the develop-ment of CO2 infrastructure.
5.2 Certificate scheme for CCUSStrong arguments can be made to support the view that policy should seek to incentivize the storage part – as opposed to capture part – of the CCUS technology chain. This would support the sink enhancement necessary for reaching carbon neutrality while also tying incentives to actual storage performance. As discussed above, this is a required feature of mid-stage CCUS policies. In addition, for reasons related to reducing investment risk and spelled out in IEA (2016), incentivizing storage would make it easier to finance CCUS projects.
The following section describes an international storage certificate scheme that would meet these requirements, as recently proposed by Zakkour and Heidug (Zakkour and Heidug, 2019, 2020; Zakkour et al. 2020). The core feature of this scheme would be a ‘carbon storage unit’ (CSU). As described above, a CCUS club could apply the provisions of the COP21 Paris Agreement to use the CSU to establish a crediting mechanism for storage (Zakkour and Heidug, 2019).
A CSU would represent a verified record of a tonne of CO2 securely stored in a geological reservoir (Figure 13). The concept is similar to a renewable energy certificate (REC) (also known as a green energy certificate or a tradable renewable certificate) that offers proof of energy having been generated from renewable sources (e.g. solar or wind). When coupled with placing renewables obliga-tions on electricity generators, an REC subsidizes renew-able power in a way that complements carbon pricing. Each REC represents the environmental benefits of 1 megawatt hour (MWh) of renewable energy generation. When an entity purchases an REC, renewable energy is generated on its behalf.

23
Figure 13 A CSU is a measure of stored emissions. The difference between stored emissions and avoided emissions arises from the energy penalty of capture
A CSU is a non-tangible, tradable commodity that acts as proof that a tonne of CO2 has been safely stored in geo-logical formations. It would have no intrinsic emissions reduction value but would provide a verified record of geological storage.
A pledge to procure CSUs in an NDC would represent a financial and technological contribution toward CCUS deployment, with the implicit co-benefit of emissions reduction. The CSU concept has parallels with other types of ‘non-GHG’ targets evident in some current NDCs, such as megawatts (MW) of installed renewable energy capacity, gains in energy efficiency for certain sectors or appliances, or land area targets for afforestation. These non-GHG targets are expressed in terms other than emis-sions or removals, such as MWs of renewable energy de-ployed or square kilometers of newly forested land.
Initially, demand for CSUs would be established through a results-based climate finance (RBCF) mechanism, a method proven in other areas of climate policy. In situa-tions where other sources of demand do not exist, RBCF involves producing flows of finance from a centralized fund to procure quantified emissions reduction or re-moval units. This would be the situation facing CSUs in a transitional period. In practice, CCUS club members would pledge to procure CSUs and establish a fund that, using RCBF, enters forward contracts to purchase CSUs from CO2 storage operators at agreed prices, volumes and timeframes.
In addition to establishing explicit support for CO2 stor-age, this approach aggregates and pools finance to re-duce any single country’s exposure to the cost of deploy-ment. It also provides building blocks for commercial CCUS deployment in future phases.
Over time, RBCF could transition to a mechanism that creates systematic demand for CSUs. For this, club mem-bers would need to establish in their NDCs geological storage targets against which the acquisition and trans-fer of CSU would be counted. The coexistence of geolog-ical sequestration and emissions reduction targets would provide a double incentive to support CCUS activ-ities, while avoiding double counting; the CSUs would not avail any explicit emissions rights to club members.
In addition, and as discussed in detail by Zakkour and Heidug (2020), the CSU concept could be used to estab-lish pathways for decarbonizing fossil fuels. In effect, by implementing CCUS and generating CSUs through stor-age, oil producers could sequester CO2 at rates that would allow importing countries to zero-rate end-use emissions – essentially establishing a system whereby CSUs at the production stage offset emissions from com-bustion of fossil fuels. Main policy drivers to stimulate this strategy would include various low-carbon fuel port-folio standards (e.g. EU Renewable Energy Directive II and low-carbon fuel standards in US states and Canadi-an provinces).
In summary, a storage crediting mechanism based on CSUs can address some of the issues that have hampered development and deployment of CCUS. Attractive fea-tures include:
• Applicability to a wide range of countries and circum-stances. The CSU approach is a variable mechanism that can be tailored to specific national circumstanc-es, individual projects, and the availability of other sources of finance and revenue.
• The mechanism fits well with the current state of CCUS technology development. Given that carbon pricing is unlikely to incentivize significant invest-
Modified from Zakkour and Heidug, 2019

24
ment, CSUs will add an additional layer of finance to kick-start new CCUS projects. A crediting scheme in-volving CSU addresses the shortcomings of carbon pricing policies for CCUS and adds value to industry and consumers, while making a long-term contribu-tion to climate change mitigation goals.
• CSUs are compatible with the COP21 Paris Agreement architecture, mechanisms and goals. A new layer of finance for CCUS can be an integral element of NDCs and internationally transferred mitigation outcomes (ITMOs). It could also dovetail with national or re-gional carbon pricing schemes and other incentive programs that include CCUS, allowing CSUs to drive deeper ambition than can be achieved through a common price signal for all types of CO2 emissions abatement technologies alone.

25
6. Conclusion
Two significant gaps – lack of information and policy commitment – need to be closed before CCUS can sup-port, in a meaningful way, the decarbonization strategies of the countries in South-Eastern Europe, Eastern Eu-rope, the Caucasus and Central Asia, as well as the Rus-sian Federation and Turkey.
Knowledge of national storage capacity and its geo-graphical distribution is indispensable for any decarbon-ization strategy involving CCUS. As this analysis shows, the vast majority of these countries often have rudimen-tary fragmented and incomplete information, particular-ly regarding storage potential in aquifers. The situation is slightly better with regards to storage in oil fields but ef-fort is needed to assure and improve the consistency and quality of available data.
Carrying out a qualitative assessment of basins suitable for CO2 storage could be a first step towards closing this gap. Discussion in this report could provide the basis for a systematic approach to grading basins, using estab-lished geological criteria. Such analysis could be accom-plished by a panel of experts in a short timeframe and presumably with modest budget.
Quantitative assessments of storage potential of basins identified as suitable would logically follow. To facilitate comparison of results of national assessments, an im-portant aspect is to explicitly state assessment method-ologies used. Guidance for improving the consistency of storage estimates is given in IEA (2013), which builds on expert recommendations to propose best practices. While this effort could be undertaken by national geolog-ical survey organizations, it should be coordinated inter-nationally to ensure compatibility of assessments.
Low engagement reflects uncertainty on the part of vari-ous stakeholders and could be addressed through policy mechanisms that would provide incentives for CCUS in-vestment, development and deployment. Policies to support CCUS have been enacted in some OECD coun-tries, including the EU Emissions Trading Scheme and the tax credit for CCUS in section 45Q of US tax code. To date, countries outside the OECD have not established policy frameworks that could attract private investments to support CCUS deployment. Designing an appropriate policy mechanism for the regions covered in this report should be seen as an international task to foster intra-regional cooperation and demonstrate broad global commitment. For reasons given above, the mechanism should be technology-specific and aim to facilitate inter-national deployment of CCUS.
A certification scheme for CCUS, aligned with the COP21 Paris Agreement and operated under the auspices of the UNFCCC, could provide a viable option. Establishing such a CCUS certification scheme would need the politi-
cal support and buy-in of key countries with interest in CCUS, including the United States and the EU. Further work would be required to define a governance structure and establish rules and mechanisms for its operation. Rules concerning the origination of credits, including site selection and monitoring, could be based on existing UNFCCC ( IPCC, 2005) standards for CCUS. It will also be necessary to establish an accounting approach, particu-larly to avoid double counting of emissions reduction.
Such a CCUS mechanism would fit into the emerging in-ternational landscape of climate change policy. With countries and regions declaring ambitions to reach net-zero emissions targets in the second half of this cen-tury, there is need for policies that value and monetise sink enhancement activities as well as other types of carbon removal technology, including geological se-questration, direct air capture and forestry (G20, 2020). A CCUS certification scheme of the type discussed would facilitate using the significant storage potential available in geological carbon sinks to the extent that various studies show is needed to reach net-zero goals.

26
AppendixResource classification for CO2 storage projects
Resource classification is a concept that has been ap-plied in the mining as well as oil and gas industry for many decades and several acknowledged classification systems are available world-wide. The common element of the systems currently applied by industry and regula-tors is that they classify resources based on the technical and economical maturity of the projects designed to ex-tract and sell these resources.
In the oil and gas industry, the Petroleum Resource Management System21, published by the Society of Pe-troleum Engineering and others (SPE-PRMS), is exten-sively used worldwide. This system is thus well known to both industry and regulators, as well as by the investor community. Resources are classified according to the level of maturity of the recovery projects, also referred to as the ‘Chance of Commerciality’ of each project.
The SPE-PRMS classifies oil and gas resources as:
• Reserves – discovered resources that can be com-mercially extracted.
• Contingent resources – discovered resources for which some level of contingency remains before they can be classified as commercial.
• Prospective resources - resources yet to be discov-ered.
Each main class is divided into sub-classes and catego-ries, depending on the maturity of the project activities.
The United Nations Framework Classification for Re-sources (UNFC)32is another project-based classification system, developed by the UNECE to help define the envi-ronmental-socio-economic viability and technical feasi-bility of projects to develop resources. It provides a con-sistent framework to describe the level of confidence of the future quantities produced by each project.
Terms such as ‘resources’ and ‘reserves’ are deliberately avoided in the UNFC. It is a principles-based system in which the products of a resource project are classified – using a numerical coding system – based on three funda-mental criteria: environmental-socio-economic viability (E); technical feasibility (F); and degree of confidence in the estimated quantities (G).
• The E axis designates the degree of favourability of environmental-socio-economic conditions in estab-
lishing the viability of the project, including consider-ation of market prices and relevant legal, regulatory, social, environmental and contractual conditions.
• The F axis designates the maturity of technology, studies and commitments necessary to implement the project. These projects range from early concep-tual studies through to a fully developed project that is producing.
• The G axis designates the degree of confidence in the estimate of the quantities of products from the proj-ect.
• The categories and sub-categories are the building blocks of the system and are combined in the form of ‘Classes’.
The UNFC is aligned with some other classification sys-tems via so called Bridging Documents, including the SPE-PRMS.
UNFC as applied to injection projects for the purpose of geological storage
In recent years, the UNECE Expert Group on Resource Managements (EGRM) has also developed specifications for how to apply the UNFC to other energy-related com-modities, including several renewable energy resources and injection projects for the purpose of geological stor-age, such as CO2 storage. Recovery projects are replaced with injection projects, with associated quantities re-flecting what can be stored in the recipient reservoirs of the different injection projects, given the defined project activities and costs. These quantities can then be classi-fied based on the same E, F and G categories. The injec-tion projects specifications were first published in 201643.
The injection projects specifications include definitions and supporting explanations for each category and sub-category. For the E and F categories, the numbers represent a defined level of development. The G catego-ries represent a low, best and high quantity estimate or, in other words, the uncertainty in the estimated stored quantities. The E, F and G categories and sub-categories can be combined to create classes that define the level of maturity of the injection project. Table A.1 shows what is expected to be the most commonly used combinations, but other combinations may be equally valid depending on the specifics of the evaluated projects.
[4] They can be found on the UNECE web site under Areas of Work along with other commodity-specific specifications.
[2] The latest update from 2018 can be downloaded from www.spe.org
[3] The 2019 edition and specifications for its application are available at the UNECE web site: www.unece.org

27
Table A.1 UNFC classes defined by categories and sub-categories as applied to injection projects
Total geological storage in an evaluated area or portfo-lio of projects is the sum of all quantities that have been and will be stored by current and/or planned projects and quantities that may be stored by future, not yet de-fined injection projects (screening projects). It may also include quantities reflecting areas or reservoirs where storage for some reason is not feasible. This last category is comparable to unrecoverable volumes in place in oil and gas projects.
Commercial injection projects are those confirmed to be commercially viable. They may or may not be com-mercial in the traditional sense; as long as the project’s environmental-socio-economic viability and technical feasibility can be confirmed, the project can be classified as commercial5. It can also be sub-classified as econom-ic to develop on its own (E1.1) or as a project made viable through government subsidies and/or other consider-ations (E1.2). (Not shown in Table A.1).
The F3 sub-categories have been developed specifically for application to injection projects to facilitate differen-tiation of screening projects at different stages of evalu-ation before a defined injection project has been identi-fied.
The SPE-SRMS – Storage Resource Management System
In 2017, the SPE also published a version of its resource management system adapted for CO2 storage, the Stor-age Resource Management System (SPE-SRMS).61This is based on the SPE-PRMS, again following the same princi-ples of project-based classification of storage resources. The storage resources are classified as:
• Storage capacity – quantities anticipated to be com-mercially accessible in the characterized geologic for-mation through application of development projects.
• Contingent storage resources – potentially accessible quantities in known geologic formations, but where the applied project(s) are not yet considered mature enough for commercial development.
• Undiscovered storage resources – where the suitabil-ity for storage has not been ascertained within the target geologic formation.
Project maturity sub-classes are also identified in line with the SPE-PRMS (Table A.2).
UNFC Classes Defined by Categories and Sub-Categories as Applied to Injection Projects for the Purpose of Geological Storage
Total Geological Storage
Lost Quantities
Injected and Stored Quantities
vCategories
Sub-classCategories and Sub-categories
E F G E F G
Future storage by commercial injection
projects
Commercial Injection Projects 1 1 1,2,3
Active Injection 1 1.1 1,2,3
Approved for Development 1 1.2 1,2,3
Justified for Development 1 1.3 1,2,3
Future storage in known reservoirs by
commercial injection projects
Potentially Commercial Injection Projects 2 2 1,2,3
Development Pending 2 2.1 1,2,3
Development on Hold 2 2.2 1,2,3
Non-Commercial Injection Projects 3 2 1,2,3
Development Unclarified 3.2 2.2 1,2,3
Development not Viable 3.3 2.3 1,2,3
Storage Not Feasible 3 4 1,2,3 Storage Not Feasible 3.3 4 1,2,3
Potential future storage in undiscov-
ered reservoirs by injection projects
Screening Projects 3 3 4
Geological Storage Identified 3.2 3.1 4
Geological Storage Indicated 3.2 3.2 4
Geological Storage Inferred 3.2 3.3 4
Storage Not Feasible 3 4 4 Storage Not Feasible 3.3 4 4
[5] In the UNFC injection projects specifications, the term ‘commercial projects’ is still used. The 2019 update replaces this with ‘viable proj-ects’, defined as projects for which the environmental-socio-econom-ic viability and technical feasibility have been confirmed. [6] The complete SPE-SRMS document is available at www.spe.org
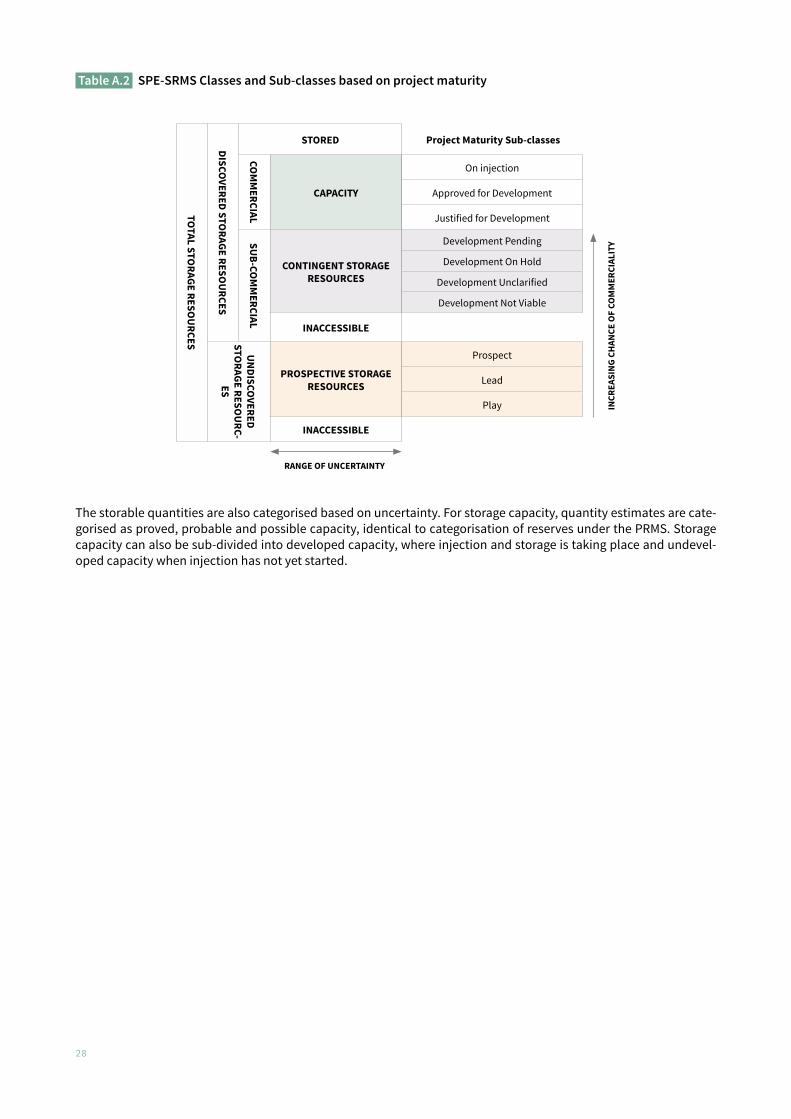
28
Table A.2 SPE-SRMS Classes and Sub-classes based on project maturity
The storable quantities are also categorised based on uncertainty. For storage capacity, quantity estimates are cate-gorised as proved, probable and possible capacity, identical to categorisation of reserves under the PRMS. Storage capacity can also be sub-divided into developed capacity, where injection and storage is taking place and undevel-oped capacity when injection has not yet started.
TOTAL STO
RAGE RESOU
RCES
DISCOVERED STO
RAGE RESOU
RCES
STORED
COM
MERCIAL
CAPACITY
SUB-CO
MM
ERCIAL
CONTINGENT STORAGE RESOURCES
INACCESSIBLE
UN
DISCOVERED
STORAGE RESO
URC-
ES
PROSPECTIVE STORAGE RESOURCES
INACCESSIBLE
On injection
Approved for Development
Justified for Development
Development Pending
Development On Hold
Development Unclarified
Development Not Viable
Prospect
Lead
Play
RANGE OF UNCERTAINTY
INCR
EASI
NG
CHAN
CE O
F CO
MM
ERCI
ALIT
Y
Project Maturity Sub-classes
29
REFERENCES
AAPG (2020). Robertson Basins and Plays – Sedimentary Basins of the World. Available at: www.arcgis.com/home/item.html?id=9845f1f30a1641efbe54dd1f9c8c668b Accessed on X December 2020.
Abuov, Seisenbayev, and Woojin Lee (2020). CO2 storage potential in sedimentary basins of Kazakhstan. Int.J. Greenh. Gas Control, vol. 103, No. 103186 (December).
Alizadeh, A., Guliyew, I.S., Kadirov, F.A., and L.V. Eppelbaum (2017). Geosciences of Azerbaijan – Volume II: Economic Geology and Applied Geophysics. Springer. E-book.
Bachu, Stefan (2003). Screening and ranking of sedimentary basins for sequestration of CO2 in geological media. Environmental Geology, vol. 44, No. 277-289 (March).
Compass International Inc. (2020). Industrial/Commercial Construction Cost Engineering Data. Available at: https://compassinternational.net/product/global-construction-costs/
Cook, Peter (2012). Clean energy, climate and carbon. Balkema, Netherlands: CRC Press.
Donetsk National University (2013). Guidelines for the Implementation of CCT and CCUS technologies in the Eastern region of Ukraine. Part II, 30 December.
EU GeoCapacity (2009). Assessing European Capacity for Geological Storage of Carbon Dioxide. Available at: www.geology.cz/geocapacity
G20 (2020). Achieving net-zero in the G20: A novel supply-side climate policy to value carbon sinks, 10 December 2020. Available at: www.g20-insights.org/policy_briefs/achieving-net-zero-in-the-g20-a-novel-supply-side-climate-policy-to-value-carbon-sinks
Global CCUS Institute (2017). Cost of Carbon Capture and Storage, June 2017.
Ghosh, Arunabha, Müller, B., Pizer, W., and G. Wagner (2012). Mobilizing the Private Sector: Quantity- Performance Instruments for Public Climate Funds. Oxford Energy and Environment Brief.
Grubb, Michael (2014). Planetary Economics. Taylor & Francis: London.
Grüll, G., and Taschini, L. (2011). Cap-and-Trade Properties under Different Hybrid Scheme Design, Journal of Envi-ronmental Economics and Managemen, vol. 61, No. 1 (January).
Interview: Azerbaijan’s SOCAR not concerned about future gas sales (2019). Hellenic Shipping News, 14 December. Available at: www.hellenicshippingnews.com/interview-azerbaijans-socar-not-concerned-about-future-gas-sales/.
IEA (International Energy Agency) (2013). Methods to assess geologic CO2 storage capacity: status and best practice. Workshop, September 2013. Paris.
-(2015). Storing CO2 through Enhanced Oil Recovery. Paris.
-(2016). Disaggregating CCUS - Spurring storage and other parts of the CCUS value chain. In: 20 years of carbon capture and storage: Accelerating future deployment. November 2016. Paris.
-(2019). Putting CO2 to Use. September 2019, Paris.
International Energy Agency Greenhouse Gas Programme (2009). CO2 Storage in Depleted Oilfields: Global applica-tion criteria for carbon dioxide enhanced oil recovery, 2009-12, December 2009. Available at: https://ieaghg.org/docs/General_Docs/Reports/2009-12.pdf
Intergovernmental Panel on Climate Change (2005). IPCC Special Report on Carbon Dioxide Capture and Storage. Cambridge, UK: Cambridge University Press.
-(2006). 2006 IPCC Guidelines for National Greenhouse Gas Inventories, 2006. Japan.
-(2018). Global warming of 1.5°C. An IPCC Special Report on the impacts of global warming of 1.5°C above pre-indus-trial levels and related global greenhouse gas emission pathways, in the context of strengthening the global re-

30
sponse to the threat of climate change, sustainable development, and efforts to eradicate poverty, 2018. Cam-bridge.
Kearns, Jordan, Teletzke, G., Palmer, J., Thomann, H., Keshgi, H., Chen, Y.-H., Paltsev, S., and H. Herzog (2017). Devel-oping a consistent database for regional geologic CO2 capacity worldwide. Energy Procedia, vol. 114, No. 4697-4709 (July).
Kelemen, Peter, Benson, S., Pilorgé, H., Psarras, P., and J. Wilcox (2019). An Overview of the Status and Challenges of CO2 Storage in Minerals and Geologic Formations. Frontiers in Climate, vol. 1, No. 9 (November).
Komatina-Petrovic, Snežana (2007). Geology of Serbia and Potential Localities for Geological Storage of CO2. Avail-able at: www.geology.sk/co2neteast/documents/workshop_zagreb/Snezana_Komatina-Petrovic-Geology_of_Ser-bia_and_potential_localities_for_geological_storage_of_CO2.pdf Accessed on January 2021.
Mallon, Wim, Buit, L., Wingerden, J.v., Lemmens, H., and N.H. Eldrup (2013). Cost of CO2 Transportation Infrastruc-ture Markets, Energy Procedia, vol. 37, No. 2969-2980.
Marcantonini, Claudio, Teixido-Figueras, J., Verde, S.F. and X. Labandeira, X. (2017). Low-carbon Innovation and Investment in the EU ETS. Policy Brief from Robert Schuman Centre for Advanced Studies, vol. 2017/22 (July).
McGlade, Christopher and Paul Etkins (2015). The geographical distribution of fossil fuels unused when limiting global warming to 2 °C. Nature, vol. 517, No. 187–190 (January).
Morgan, D. and T. Grant (2014). FE/NETL CO2 Transport Cost Model: Model Overview. Presentation DOE/NETL-2014/1668. National Energy Technology Laboratory, Pittsburgh, PA
Müller, Benito (2008). Bonn 2007: Russian Proposals, Policy CDM and ‘CER Put Options’ (CERPOs). Oxford Institute for Energy Studies, Energy and Environment Comment.
Nedopekin, F., Shestavin, N., and V. Yurchenk (2019). Prospects of implementation of carbon dioxide capture and geological storage technologies in the Donbass for mitigation of the effects of climate change, Procedia Environ-mental Science, Engineering and Management, vol. 6 (September).
Okandan, Ender, Karakece, Y., Çetin, H., Topkaya, I., Parlaktuna, M., Akın, S., Bulbul, S., Dalha, C., Anbar, S., Cet-inkaya, C., Ermis, I., Yılmaz, M., Ustun, V., Yapan, K., Erten, A.T., Demiralın, Y., and E, Akalan (2011). Assessment of CO2 storage potential in Turkey, modeling and a prefeasibility study for injection into an oil field. Energy Procedia, vol. 4. Available at: www.sciencedirect.com/science/article/pii/S1876610211007314
Pizer, William (2011). Seeding the market: Auctioned Put Options for Certified Emissions Reductions, Nicholas Institute for Environmental Policy Solutions, Duke University.
Ranathunga, A.S, Ranjith PG, and MSA Perera (2017). Challenges and issues for CO2 storage in deep coal seams. In Rock Mechanics and Engineering Volume 4, Wiltshire, UK: CRC Press.
Santos, Stanley (2012). CO2 Transport via Pipeline and Ship. Available at: https://ieaghg.org/docs/General_Docs/IEAGHG_Presentations/3._CO2_Transport_Overview_-_S._Santos_IEAGHG.pdf. Accessed December 2020.
Shogenova, Alla, Shogenov, K., Vaher, R., Ivask, J., Sliaupa, S., Vangkilde-Pedersen, T., Uibu, M., and R. Kuusik (2011). CO2 geological storage capacity analysis in Estonia and neighbouring regions. Energy Procedia, vol. 4. Available at: www.sciencedirect.com/science/article/pii/S1876610211003791
Taschini, Luca (2020). Flexibility Premium of Emission Permits. Journal of Economic Dynamics and Control. Avail-able at: www.sciencedirect.com/science/article/pii/S0165188920301810?dgcid=author
Thibeau, S., and V. Mucha (2011). Have We Overestimated Saline Aquifer CO2 Storage Capacities?, Oil & Gas Science and Technology, vol. 66 No. 1 (March).
Turkey, Ministry of Environment and Urbanization (2013). Technical Assistance for Developed Analytical Basis for Formulating Strategies and Actions Towards Low Carbon Development. Available at: www.lowcarbonturkey.org/wp-content/uploads/2018/05/LCDTR-Activity-1.1.1.-Status-Report.pdf
United Nations Framework Classification for Resources 2016 (UNFC). Available at: https://unece.org/unfc-and-injec-tion-projects-0
United Nations Framework Convention on Climate Change (2011). Modalities and procedures for carbon dioxide

31
capture and storage in geological formations as clean development mechanism project activities, 09 November. Available at: https://unfccc.int/files/meetings/durban_nov_2011/decisions/application/pdf/cmp7_carbon_stor-age_.pdf
US Department of Energy (2014). CO2 saline storage model: model description and baseline results. National Tech-nology Energy Center, July 2014.
Ward, Colin, Wolfgang Heidug (2018), and Nils-Henrik Bjurstrøm. Enhanced Oil Recovery and CO2 Storage Potential Outside North America: An Economic Assessment. Report King Abdullah Petroleum Studies and Research Center (KAPSARC), Riyadh.
Zakkour, Paul, and Wolfgang Heidug (2019). A Mechanism for CCUS in the Post-Paris Era. Report King Abdullah Petroleum Studies and Research Center (KAPSARC). Riyadh.
-(2020). Supply-side Climate Policy for Crude Oil Producers. Report King Abdullah Petroleum Studies and Research Center (KAPSARC). Riyadh.
Zakkour, Paul, Heidug, W., Howard, A., Haszeldine, R.S., Allen, M.R., and D. Hone (2020). Progressive supply-side poli-cy under the Paris Agreement to enhance geological carbon storage, Climate Policy, vol. 21, No. 1 (January).

This report has explored potential for CO2 storage in Eastern Europe, the Caucasus, and Central Asia, which can support achieving Sustainable Development Goals and attaining carbon neu-trality targets.
The study highlights tools and methodologies that countries can use to assess potential and develop policies in support of carbon capture, utilization and storage (CCUS), which can make CCUS technologies a reality sooner.
United Nations Economic Commission For Europe
Palais des NationsCH - 1211 Geneva 10, SwitzerlandTelephone: +41(0)22 917 12 34E-mail: [email protected]: http://www.unece.org
Geo
logi
cal C
O2 s
tora
ge in
Eas
tern
Eu
rope
, Cau
casu
s an
d Ce
ntra
l Asi
aA
n in
itial
ana
lysi
s of
pot
entia
l and
pol
icy