Embed Size (px)
Citation preview

Geologic Mapping of the Franklin Volcanic Field Western Ross Sea, Antarctica
A Senior Honors Thesis
Submitted in Partial Fulfillment of the Requirements for graduation with distinction in Geological Sciences in the undergraduate colleges
of The Ohio State University
by
Adrienne E. Smith
The Ohio State University December 2004
Project Advisor: Terry J. Wilson, Department of Geological Sciences
Approved by
Terry J Wilson

Acknowledgements
I would like to thank Terry Wilson for allowing me to be part of the NBP 04-01 research expedition and for her perpetual guidance thereafter.
A great deal of credit is due to Marcy Davis, Stuart Henrys, Jerome Hall and other members of the NBP 04-01 cruise research team.
This work would also not be possible without the support of my committee members, parents, sisters, fellow geology students and Michael A. Block.
This research was funded by a grant from the National Science Foundation and the Research Experience for Undergraduates Initiative.

Abstract
The RVIB N. 8. Palmer collected bathymetric and seismic data in the western Ross Sea
in January/February 2004 with the specific purpose of mapping neotectonic structural and
volcanic features on and beneath the seafloor. The Franklin Volcanic Field (FVF) is an important
feature revealed by the bathymetric data. The volcanic field, which is expressed as a regional
bathymetric high, is a minimum of 80 km long and up to 40 km wide. As one moves north, the
overall trend of the volcanic field appears to curve from N-S to NE. Superimposed on the regional
high are the subaerial portion of Franklin Island and clusters of submarine volcanic cones.
Franklin Island has been interpreted as the western remnant of a shield volcano and has a single
K-Ar date of 4.8+2 Ma. Its submarine morphology is characterized by a steep western flank and
an eastern flank that, within the limits of the mapped region, appears to have a shallower slope.
North of the island, there are 8 discrete cones, three of which were dredged, yielding basaltic
lava, hyaloclastite and tuft. The seafloor morphology in the northern sector of the field is
characterized by lineations at several scales, some hummocky terrain marked by circular to oval
depressions, and superimposed iceberg scours. Based on morphology alone, the linear features
could reflect volcanic ridges, faults, or glacial lineations, or may have formed by a combination of
these processes. The origin of the seafloor features within the FVF has been determined through
integrated analysis of magnetic, gravimetric and seismic data. Using the spatial associations of
the features, this work proposes a reconstruction of the direction of glacial flow during the Last
Glacial Maximum as well as maximum and minimum crustal stress directions during the formation
of the Franklin Volcanic Field.

Table of Contents
Introduction . . . . . . . . . . . . . . . . . . . . . . . . . . . . . . . . . . . . . . . . . . . . . . . . . . . . . . . . . . . . . . . . . . . . . . . . . . . . . . . . . 1
Objectives and scope of the Study ••••••••.••••••••••.•••••••••••••••.••.••••.••••• 2
Geologic setting
Antarctic Plate setting ••••••••.•••••••••••••••••••••••••••••.••.••.••.•••••••••••••••• 3
West Antarctic Rift System-Transantarctic Mountains ......................... 3
Terror Rift
Cenozoic Volcanic Rocks ••••••.•.•••••.•.•.•.•.•.••••.•.••.•••••••.••.••.••••.•.•.• 5
McMurdo Volcanic Group
Franklin Island
Glacial History ••••••••.•.•.•.•••.•••.•.•.••••••••••••••••••••••••••••••••••••••••••••• 7
Methods
Discrimination of Seafloor Features •••••.•.•.•.••••••••••••••.••.••.••.••••••••••• • 9
Interpretation of Seafloor Features ••••••••••••••••••••••••••••••••••••••.•••••• ..... 10
Glacial Flow directions
Stress orientation
Geophysical Data
Bathymetry Data •••••••••.•.•••.•.••••••••••••••••••••••••••••••••••••••.•••••••••• •• 14
Magnetic Data
Earth's Magnetic Field •••.•••••.••••••••••.••••••.•.••.••••.•••••.••••••.•. •. 15
Treatment of magnetic data ..•.•.•.•.••••••••.••••.••.••.•••••••..•••.• .•.••. 18
Gravity Data
The Gravity Field •••••.•••.•.•.••••••••••••.•.••••••.••.••••••••.•••••••••.•• • 21
Treatment of gravity data ••••••.•.•.•••••••••••••••.••.••.••••.••••••••• .••••• 24
Seismic Data
Seismic surveying •••••••••••••••••••••••••••••••••••••••••••••••.••.••••••.••• • 25
Treatment of seismic data •••••••••••.•.•.••••••••••••••••••••••••••••••.•.•• • 26
ii

Results
Bathymetric Maps: Description and Initial interpretation ....................... 27
Western hummocky terrain ••••••••••••••••••••••••.•.••.••.••.••.••••.•.•.• 28
Central volcanic terrain ••••••••.•.•.•.•.•••••••••••.••••••••••••••••.•.•.• •• 29
Eastern lineated terrain ••••••••.•••••.••••••••.••.••••.••••••••••••••••••••• . 31
Magnetic Data
Observations •••••••••••••••••••••••••••••••••••••••••••••••••••••.•••••.• ••••• 32
I nte rp re tation •••••••••••••••••••••••••••••••••••••••••••••••••••••••••••••••••• 33
Gravity Data
Observations ••••••••••••••••••••••••••••••.•.••••••••••••••••••••.••••••••.• .• 35
I nte rp re tation •••••••••••••••••••••••••••••••••••••••••••••••••••••••••••••••••• 35
Seismic Data
Observations •••••.•••••.•••••.••••••••••••••••••.••.••••.••.••.••.•.••••.•. •••. 36
Interpretation ••.•.•.•.•••••••••.•.•.•.•.••••••••.•.••••••••••.•••••.•.••••••. •• 39
Discussion
Glacial reconstruction ••••••••••••••.•••••.•.•.•.••••••.•.••.•.••.••.•••••.•.••.•.• ••. 44
Stress reconstruction ••••.•••.••••••••••••••••••••.•.••••••.••.••••••••••••••••••.•.• .• 45
Conclusions ................................................................................... . 46
References
Appendices
A. Geologic and Magnetic Polarity Time Scales
B. Data addendum
iii

Introduction
Within the western Ross Sea, Antarctica, abundant faulting and volcanism have
long been known and recently interpreted as the manifestation of extension in the West
Antarctic rift system. The rift system has been the site of Mesozoic to Cenozoic extension
and Cenozoic volcanism including that responsible for the formation of Franklin Island.
In the last two decades, marine geophysical surveys had begun to display the regional
structures, including tectonically formed basins and basement highs underlying the
western Ross Sea (Figure 1). However, detailed regional surveys had not been undertaken.
In January - February 2004 a geophysical survey was completed aboard the RVIB
Nathaniel B. Palmer (NBP 04-01) during which 7000 km of multibeam bathymetric,
magnetic and gravity data were obtained (Figure 2 and 3). In addition, extensive new
multichannel (2000 km) and single-channel (500 km) seismic reflection profiles were
acquired. During the course of this survey, mapping of the seafloor features adjacent to
Franklin Island revealed clusters of submarine volcanoes, possible volcanic ridges,
curvilinear escarpments and probable glacial features on the seafloor. Due to these
discoveries, this region became a focus for more continuous bathymetric mapping of the
seafloor and seven seismic profiles were collected across the northern part of the field.
Because of the wealth of diverse features, and abundant data, this region then became the
focus of this study. This region is referred to here as the Franklin Volcanic Field after the
emergent Franklin Island.
1

<
~ A: MCS tracks in western Ross Sea. ANTOSTRAT (1995).
B: Multibeam and ~i.-.:.SCS lines, Rice Univ.
170'
Shipp et al. ( 1999)
Ross· ·1ca SHelf
Figure 1: A) Previous multichannel seismic surveys. B) Pre-existing multibeam survey. Note the wide spacing observations within these geophysical data sets.
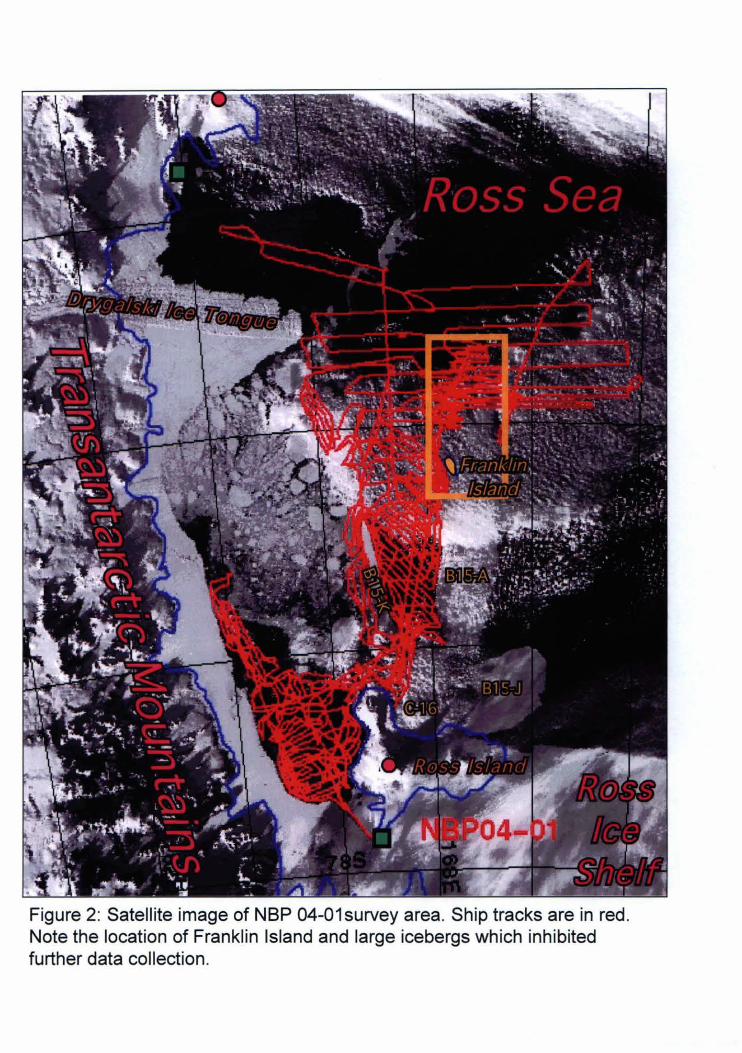
Figure 2: Satellite image of NBP 04-01 survey area. Ship tracks are in red. Note the location of Franklin Island and large icebergs which inhibited further data collection.
r
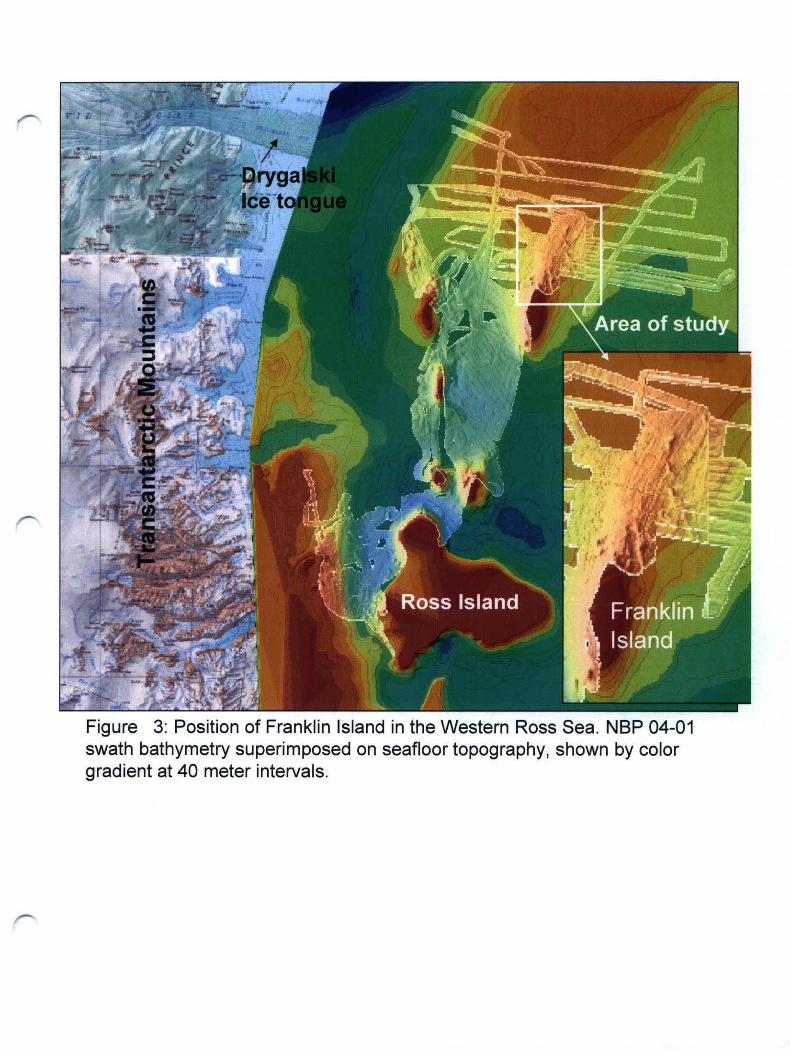
Figure 3: Position of Franklin Island in the Western Ross Sea. NBP 04-01 swath bathymetry superimposed on seafloor topography, shown by color gradient at 40 meter intervals.
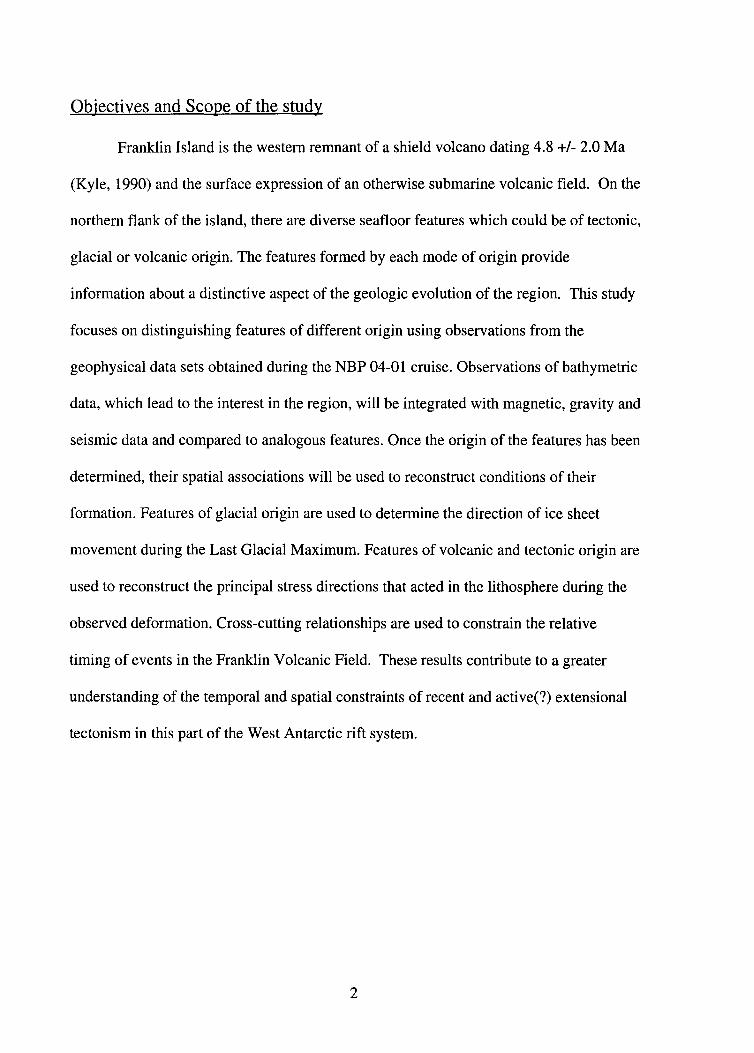
Objectives and Scope of the study
Franklin Island is the western remnant of a shield volcano dating 4.8 +/- 2.0 Ma
(Kyle, 1990) and the surface expression of an otherwise submarine volcanic field. On the
northern flank of the island, there are diverse seafloor features which could be of tectonic,
glacial or volcanic origin. The features formed by each mode of origin provide
information about a distinctive aspect of the geologic evolution of the region. This study
focuses on distinguishing features of different origin using observations from the
geophysical data sets obtained during the NBP 04-01 cruise. Observations of bathymetric
data, which lead to the interest in the region, will be integrated with magnetic, gravity and
seismic data and compared to analogous features. Once the origin of the features has been
determined, their spatial associations will be used to reconstruct conditions of their
formation. Features of glacial origin are used to determine the direction of ice sheet
movement during the Last Glacial Maximum. Features of volcanic and tectonic origin are
used to reconstruct the principal stress directions that acted in the lithosphere during the
observed deformation. Cross-cutting relationships are used to constrain the relative
timing of events in the Franklin Volcanic Field. These results contribute to a greater
understanding of the temporal and spatial constraints of recent and active(?) extensional
tectonism in this part of the West Antarctic rift system.
2
_COl:Wf118Jtjtl
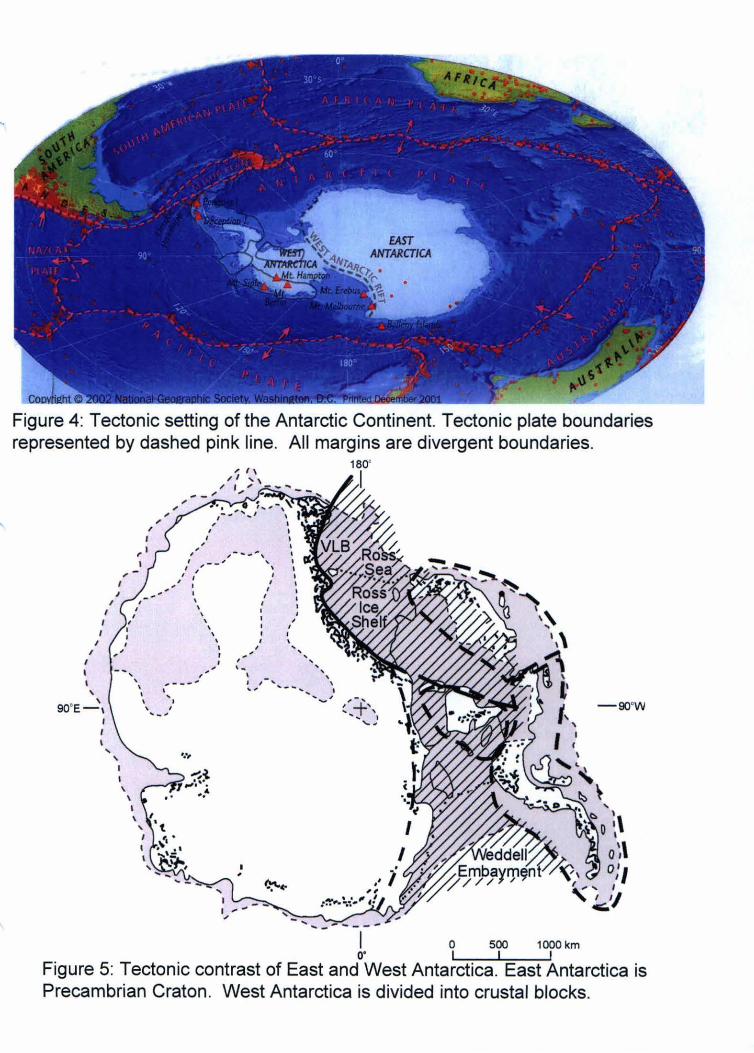
Figure 4: Tectonic setting of the Antarctic Continent. Tectonic plate boundaries represented by dashed pink line. All margins are divergent boundaries.
I
I I
I
' . ' 90 E-1 I I I
,, I
- oo•w
...... ____ I__ o soo 1oookm
o• I I I
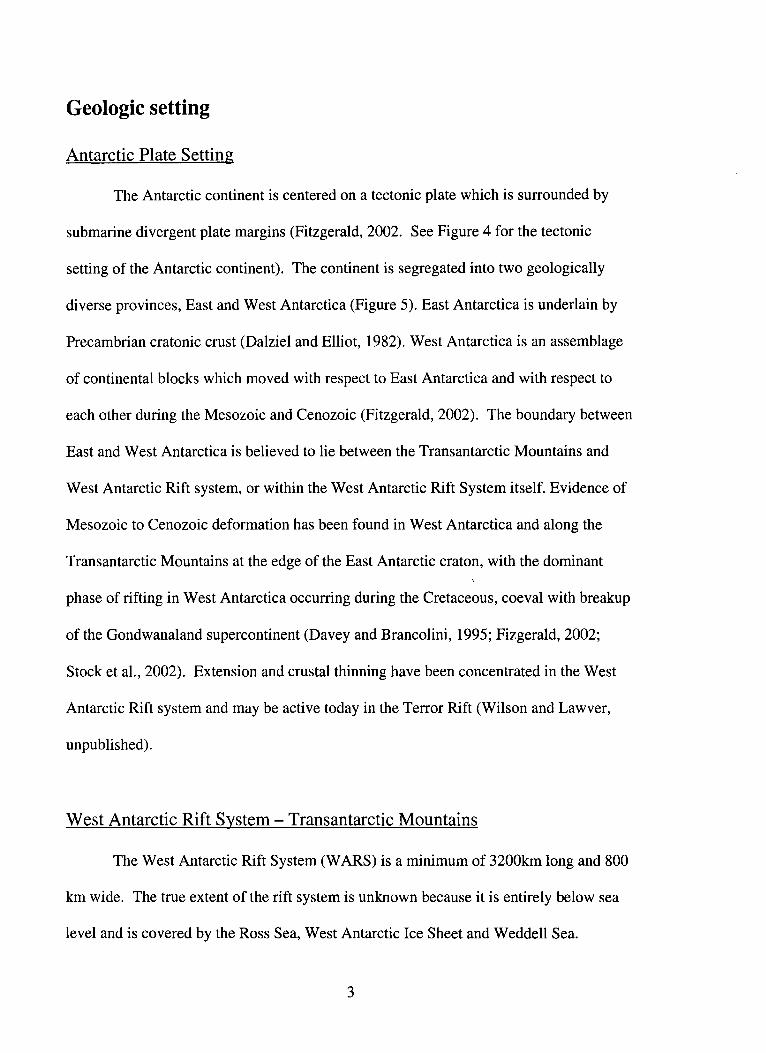
Figure 5: Tectonic contrast of East and West Antarctica. East Antarctica is Precambrian Craton . West Antarctica is divided into crustal blocks.
Geologic setting
Antarctic Plate Setting
The Antarctic continent is centered on a tectonic plate which is surrounded by
submarine divergent plate margins (Fitzgerald, 2002. See Figure 4 for the tectonic
setting of the Antarctic continent). The continent is segregated into two geologically
diverse provinces, East and West Antarctica (Figure 5). East Antarctica is underlain by
Precambrian cratonic crust (Dalziel and Elliot, 1982). West Antarctica is an assemblage
of continental blocks which moved with respect to East Antarctica and with respect to
each other during the Mesozoic and Cenozoic (Fitzgerald, 2002). The boundary between
East and West Antarctica is believed to lie between the Transantarctic Mountains and
West Antarctic Rift system, or within the West Antarctic Rift System itself. Evidence of
Mesozoic to Cenozoic deformation has been found in West Antarctica and along the
Transantarctic Mountains at the edge of the East Antarctic craton, with the dominant
phase of rifting in West Antarctica occurring during the Cretaceous, coeval with breakup
of the Gondwanaland supercontinent (Davey and Brancolini, 1995; Fizgerald, 2002;
Stock et al., 2002). Extension and crustal thinning have been concentrated in the West
Antarctic Rift system and may be active today in the Terror Rift (Wilson and Lawver,
unpublished).
West Antarctic Rift System - Transantarctic Mountains
The West Antarctic Rift System (WARS) is a minimum of 3200km long and 800
km wide. The true extent of the rift system is unknown because it is entirely below sea
level and is covered by the Ross Sea, West Antarctic Ice Sheet and Weddell Sea.
3

Volcanism and extensional strain have repeatedly focused in the WARS due to the
lithospheric weakness of the region. The underlying crust has been thinned to a minimum
of 17km thick beneath the Victoria Land Basin in the western Ross Sea but thickens
regionally to 36 km in the Transantarctic Mountains. Where sufficient data exists,
discrete rift basins have been defined within the West Antarctic Rift system (Figure 6).
In the Ross Sea, there are four basins formed by WARS extension and separated by
basement highs (Davey and Brancolini, 1995). One of these basins is the Victoria Land
Basin which is in the westernmost WARS, adjacent to the TAM.
The Transantarctic Mountains (TAM) are a topographic boundary between East
and West Antarctica as well as the edge of the West Antarctic Rift System and the
western boundary of the Ross Sea. They stretch across the Antarctic continent for
approximately 3500km and reach elevations of over 4000m. Their raised topography is
derived from the uplift of crustal blocks along a series of normal faults running parallel to
the range's length. Exhumation of the range began in the Early Cretaceous, but the major
episode of rapid uplift occurred 50-55Ma. The Transantarctic Mountain Front, which
faces the Ross Sea, is a zone of major normal faulting along which fault blocks have been
downthrown toward the coast as part of the subsidence of the West Antarctic Rift System.
(Davey and Brancolini, 1995; Fitzgerald, 2002) Figure 7 shows the known regional
structures in the TAM adjacent Ross Sea.
Terror Rift
The Terror Rift is located within the Victoria Land Basin of the Western Ross Sea
(Figure 8, Cooper et al., 1987). It is part of a north-south trending fault system which is
4
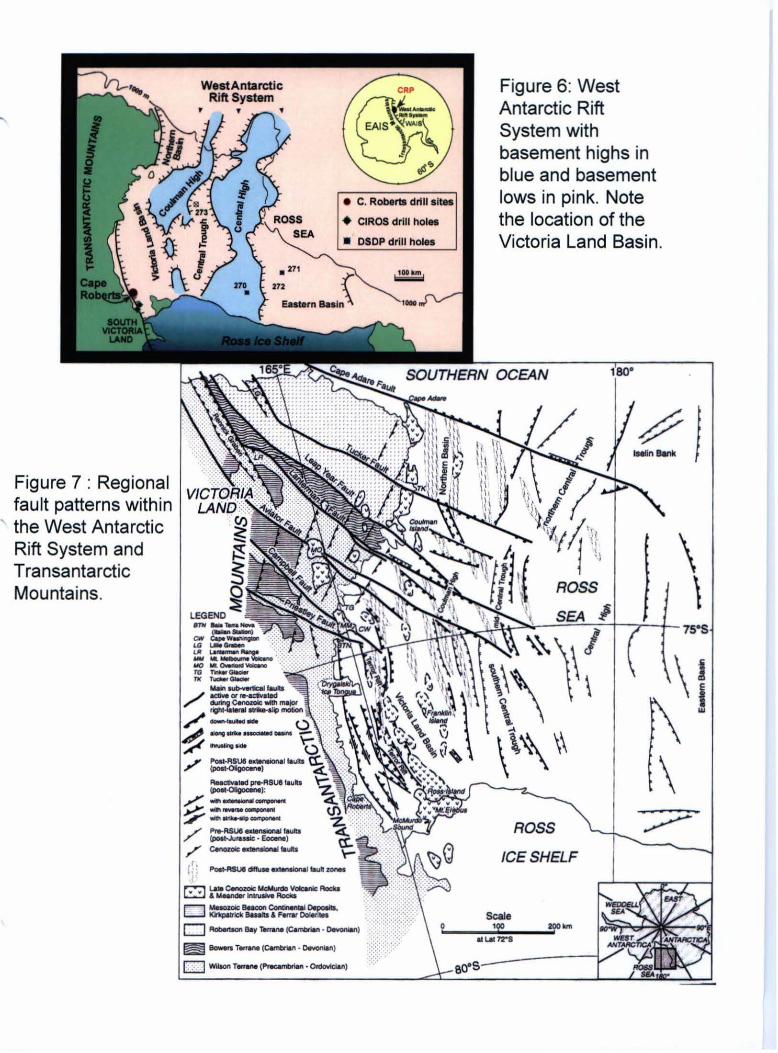
Figure 7 : Regional fault patterns within
' the West Antarctic Rift System and Transantarctic Mountains.
e C. Roberta drill sites
+ CIROS drill hol•
Figure 6: West Antarctic Rift System with basement highs in blue and basement lows in pink. Note the location of the Victoria Land Basin. • DSDP drill holes
/ Pre-RSU8--/' {post.Jutasllc. ""'-e)
/Cenozoic_ ....... , .. -.ASUll---...... (!3~~--
D - - Conlirlenal Dlpoojls, Kk1cpelric:k BuUa & ,..,,., Ooleritn
D Aobelllorl 8ay Terrane <~. o..oni.ni
~ - T.,,.,,. (c.mbrlan • o..onian)
D Willon T-("'-"btlen. OtdcMclan)
ROSS \ \
SEA j ~":".li...~~~,---=::....;_~lr-+- 1s•s
ROSS
ICE SHELF
Scale ___ ,90._ _ ___,2Q0km
atlM7rS

10•
0 200
75° KILOMETERS
LATE CENOZOIC
• VOLCANIC ROCKS
ONSHORE ANO POSSIBLE
CENOZOIC OR INTRUSIVE
STRUCTURES OFFSHORE
1 so• 1110•
,.
Location of known structures in the Terror Rift. (Cooper et al., 1987)
,.I' ..
}\)" .. :fj
170•
ROSS
SEA
+
ROSS ICE
180°
711 '
Figure 8
Location and known extent of the Terror Rift. O indicates approximate location of Franklin Island. Note the distribution of Cenozoic volcanic rocks. (Cooper et al., 1987)
EASTERN
BASIN
170°

1------------------V
IC
TO
RIA
LA
NO
B
AS
IN .--
l
~--TERROR
RIF
T -
---4
IN
E
L_
_QIS
CO
VE
RY
____
__L_
_ L
EE
I
I G
RA
BE
N ---.-
-A
RC
H--
, F
RA
NK
LIN
IS
o.
f ....... i::
_ ... :
c::::::
::: <=
::G1
c"~ .
.....
r;;::M
",t I
-rt
t-R
tyj
-
' , ,
"'
"
0 I K
M
20
I
,
/ ,,.. --
-..._
..,
...-_
I,...
_ B
? -
PA
LE
OG
EN
E
-
--/
,,..._
,-.
...,,
.-v
r........
----
r --
PR
E-B
EA
CO
N
PA
LE
OZ
OIC
AN
D P
AfC
AM
BA
IAN
BA
SE
ME
NT
--s?
,,,,,-- ,..
~
_.,,,.
....
,.
A -L
AT
E
CE
NO
ZO
IC
INT
RU
SIV
ES
B?
-P
OS
SIB
LE
B
E1
\CO
N
SU
PE
RG
RO
UP
R
OC
KS
Figu
re 9
: C
arto
on c
ross
sec
tion
Terr
or R
ift a
s de
fined
fro
m s
eism
ic p
rofil
es
by C
oope
r et
al.
( 198
7).
5 10
KM
15
20

parallel to the overall trend of the TAM (Salvini, 1997). It is commonly defined to
extend between the active volcanoes Mt. Melbourne in the north and Mt Erebus in the
south, but may link to onshore faults in the TAM of north Victoria Land and may
continue southward beneath the Ross Ice Shelf (Wilson, 1999). The Terror Rift is the
youngest location of extensional tectonism in the WARS, and the presence of faults and
volcanic rocks reaching the seafloor led Cooper et al. (1987) to suggest that it still may be
an active feature. The Terror Rift was defined seismically by Cooper et al (1987) and
divided into two structural zones: Lee Arch, which is intruded by volcanic bodies; and
Discovery Graben, which is bounded by normal faults with displacements up to 3km
(Figure 9). Salvini et .al (1997) note that the tectonic regime reflects both extensional
and lateral components, making it a transtensional setting. The detailed geometry of
faults and the extent of faulting associated with the Terror Rift are not known due to the
sparse spacing of seismic profiles which cross it. A major goal of the NBP 04-01
expedition was to collect denser seismic data as well as bathymetric data over Terror Rift
to further constrain its geographic boundaries (Wilson and Lawver, unpublished).
Cenozoic Volcanic Rocks
McMurdo Volcanic Group
The McMurdo Volcanic Group is defined as all Cenozoic volcanic rocks within
the Transantarctic Mountains or the Ross Sea Embayment (meaning the sea itself or the
adjacent Ross Ice Shelf, Figure 10). It is further subdivided into three provinces which
are delineated by their spatial distribution and tectonic setting and which show variable
lava compositions. The Mt. Melbourne province is located within the TAM as well as at
5

Fig
ure
10
Kno
wn
dist
ribut
ion
of te
rres
tria
l vol
cani
c ro
cks
prox
imal
to t
he T
erro
r R
ift.
•In
dic
ate
s th
e ap
prox
imat
e lo
catio
n of
Fra
nklin
Isl
and
.
NV
L
TA
MD
EF
•
r r
J -·
. •
---..
75• SV
L
()"
!) C
enoz
oic
McM
urdo
V
olca
nic
Gro
up
\ F
ault
\\R
ift
Bas
in
Ros
s Se
a
) I
Wes
t Ant
arct
ic
~Rif
t S_
\'.<te
m
JOO
km 75
•

the bounding normal faults separating the TAM and the Ross Sea and lies at the north end
of the Terror Rift. (Kyle, 1990) The oldest magmatic intrusions in the province are dated
to 50 Ma (Rocchi et. al, 2002) with volcanism extending to the present. The Mt. Erebus
volcanic province is located at the intersection of fault zones bounding the TAM, at the
southern end of the Ross Sea portion of the Terror Rift. Volcanic activity within this
province dates back to about 25 Ma from drill core records, with the oldest volcanic
outcrops dated at 19 Ma (Kyle, 1990)
Franklin Island and surrounding seafloor volcanoes
Franklin Island is located approximately 1 OOkm NNE of Mt. Erebus and east of
the region currently defined as the Terror Rift (76d10' S, 168d23'E). The island has an
elongate North-South trend and measures 7.6km long, 2 km wide and 247 meters high. It
is interpreted as the western remnant of a shield volcano which deposited the interbedded
lava flows and tuffs that are exposed on the Island's steep eastern flank. The olivine
bearing basalt lava on the island yielded a K-Ar date of 4.8Ma +/ - 2.0 Ma. (Kyle, 1990
Ch A.13)
Other volcanoes formed on the western Ross Sea floor were suggested by an
aeromagnetic survey in 1984 (Duerbaum and Tessensohn), and some volcanic centers
were mapped again during a 1987 marine geophysical survey by Behrendt et. al. (Kyle,
1990). The presence of extensive Cenozoic volcanic rocks on or beneath the seafloor of
the western Ross Sea has been interpreted from regional aeromagnetic anomaly patterns
(Figure 11, Behrendt et. al, 1996). Anomalies on the seafloor show a roughly North
South elongation and are attributed to basic igneous rocks which have intruded into or
6

r
Figure 11: Shaded relief map of aeromagnetic anomalies in the Ross Sea (Data from Chiappini (2001 )). Dark blues are magnetic lows grading to red and purple which are magnetic highs. Note location of Franklin Island in broad, positive magnetic anomaly. Coastal boundaries in black.

been extruded onto sedimentary basin rocks. Franklin Island falls within such a magnetic
high.
Data on individual volcanic edifices, their alignment relative to each other and on any
related faults were collected during the NBP 04-01 cruise.
Glacial History
The West Antarctic Ice Sheet
The West Antarctic Ice Sheet formed due to the amalgamation of ice caps during
the Oligocene and early Miocene. Throughout the late Miocene and into the Pleistocene
it periodically advanced over the continental shelf of the Ross Sea Embayment, eroding
the substrate and creating glacially-carved landforms and extensive unconformities, as
well as leaving glacial deposits on the seafloor. During the Last Glacial Maximum, the
ice sheet extended to within lOOkm of the shelf break of the western Ross Sea and to the
shelf edge of the central and eastern Ross Sea (Figure 12). Retreat of the ice sheet began
between 15,000 and 12,000 yr B.P. and proceeded at an average rate of lOOm/ yr. By
11,500 yr B.P. the grounding line was proximal to the Drygalski Ice Tongue and by 7,000
yr B.P. had retreated to Ross Island. Between 7,000 and 5,000 yr B.P. the ice sheet
underwent an episode of rapid retreat. (Anderson and Shipp, 2001) Grounding line
retreat to the current glacial extent continued through the Holocene to the present
(Anderson et al, 2002).
Throughout the embayment, the signature of the ice sheet consists of mega scale
glacial lineations up to tens of kilometers in length that result from the deformation of
soft subglacial debris under a grounded ice sheet (Figure 13). The lineations indicate
7

Fig
ure
12
Max
imum
ice
exte
nt a
t the
L
ast G
laci
al M
axim
um
eo·s
60·w--~30-W
........
...
~I-
EXPL
ANAT
I~ ----
-----
----
Pre
sent
-<la
y g
rou
nd
ing
lin
e
--
-
I~!'
----
LG
M g
rou
nd
ing
lin
o
I ''°"
../ I
ce-s
urf
ace
co
nto
ur
(m)
--
-M
ajo
r Ic
e n
ow
line
---
Ice
div
ide
-..
.._ --
Ice
str
ea
m
30
'£
e5·s
so
·e
Den
ton
and
Hug
hes,
200
0
/
75•5
i~1 I
/
\//
/
' ,~o·
Ret
reat
of W
est A
ntar
ctic
Ic
e S
heet
sin
ce L
GM
.,.,
r ----
--
----
-~
I ,,
( ,...
-
·-.....
/
'-+
"\
/,,.
I . ,
·< ~ ~:
\
.. .
., ··. .
I
~""
...
We
st A
nta
rctic
'-.
;'!/[!:;
...,.
.····M;':
Ic
e S
hM
t x \
t• ~
;-::
..
'~if
!&
~
~ ""
/
I -....
........
31
~I
RO
SS
S
EA
• 1
" --
------
--
-.Ml
C
onw
ay e
t al.,
199
9

rapidly moving ice and demonstrate a unidirectional flow regime except where diverted
around bathymetric highs. Drumlins and flutes are present at the transition between
landward crystalline basement and the sedimentary infilling of the embayment due to the
changing velocity of ice advance. (Anderson and Shipp, 2001; Wellner et. al, 2001) The
retreat signature of the ice sheet is marked by ridge and groove moraine topography with
cross cutting iceberg furrows (Figure 13B). The late stage episode of rapid retreat led to
the calving of large icebergs from the glacier front. These icebergs moved offshore
cutting iceberg furrows into the shelf at depths up to700m below current sea level.
(Anderson and Shipp, 2001)
8

r
Figure 13: Retreat signature of the West Antarctic Ice Sheet.
179°00W 11a0 sow
76°$
11a0 4ow
0 1 2 3 4 5
Kilometers
A) Mega scale glacial lineations (Shipp and Anderson, 1997)
----=:::::ii2 .... ca==·~· _..g ~ Kllometere
B) Iceberg furrows (Anderson, 1999)

Methods
Discrimination of Seafloor Features
In order to understand the geologic context and significance of the seafloor
features in the Franklin Volcanic Field, their mode of origin must be distinguished.
Using a basic understanding of geologic processes, a generalized set of criteria for feature
origin can be established. Bathymetric data allows the examination of the morphology of
the features. Seafloor hills in the Ross Sea region could be either glacially-formed
drumlins or volcanic cones. Escarpments could be tectonically formed faults, dikes or
glacial erosion surfaces. In most cases, morphologic characteristics are not sufficient to
identify the origin of a seafloor feature and additional data types are required.
The NBP 04-01 geophysical data and dredge records provide a means to confirm
or delineate the origin of ambiguous bathymetric features. Dredging uses a metal bucket
to pluck rocks from the sides of seafloor hills. The lithologies present can then be
identified directly. When the depth or relief of seafloor features prevents dredging,
geophysical data is used. Magnetic data are used to detect iron bearing rocks, especially
basalts, which are associated with volcanic origin. Gravity data allow the detection of
subsurface or surface concentrations of dense bodies of mass in volcanic intrusions.
Seismic profile data provide a cross sectional view which can be examined for truncation
and offset along faults or stratigraphic disruption by volcanic intrusions.
This study first uses the surface expression of features on the seafloor to create
hypotheses for their mode of origin. Then through examination of the geophysical data
sets, and integration of observations, the origin of the features is constrained based on the
expectations outlined in Table A.
9

Tab
le A
: G
eop
hys
ical
cha
ract
eris
tics
of p
osit
ive
reli
ef s
ea f
loor
fea
ture
s
Gla
cial
ly f
orm
ed
Vol
cani
call
y fo
rmed
F
ault
s (t
ecto
nica
lly f
orm
ed)
Mor
phol
ogy
Bev
eled
tops
V
olca
noes
: C
onic
al o
r be
vele
d L
inea
r or
cur
vili
near
in m
ap
Elo
ngat
ion
in g
laci
al
Elo
ngat
e or
roun
d vi
ew
Bat
hym
etri
c fl
ow d
irec
tion
H
igh
surf
ace
reli
ef
char
acte
r L
ee s
ide
in u
p-fl
ow
Low
to m
oder
ate
surf
ace
reli
ef
dire
ctio
n D
ikes
: E
long
ate,
cur
vili
near
M
oder
ate
surf
ace
reli
ef
Low
sur
face
rel
ief
Dis
trib
utio
n C
lust
ered
due
to
chan
ges
Pot
enti
al r
egio
nal
alig
nmen
t P
aral
lel,
conj
ugat
e or
bra
nchi
ng
in g
laci
er v
eloc
ity
Clu
ster
s co
mm
on
orie
ntat
ion
Isol
ated
ven
ts c
omm
on
Seis
mic
cha
ract
er
Sur
fici
al f
eatu
res
Fee
der
syst
em p
enet
rate
s at
dep
th
Pen
etra
te a
t dep
th
disr
upti
ng s
ubst
rate
lay
ers
Lac
ks i
nter
nal
Off
set o
f su
bstr
ate
laye
rs
stra
tifi
cati
on
Inte
rnal
str
atif
icat
ion
abov
e m
edia
n se
aflo
or s
urfa
ce le
vel
Mag
neti
c ch
arac
ter
No
sign
atur
e H
igh
mag
neti
c pr
ofil
e du
e to
nat
ural
P
oten
tial
ly h
igh
if a
mag
neti
c re
mna
nt m
agne
tiza
tion
and
mag
neti
c bo
dy is
clo
ser
to t
he s
urfa
ce d
ue
susc
epti
bili
ty o
f bas
ic i
gneo
us r
ocks
to
fau
lt d
ispl
acem
ent
Gra
vim
etri
c ch
arac
ter
No
sign
atur
e H
igh
loca
lly
due
to c
once
ntra
tion
of
Pot
enti
ally
hig
h or
low
. de
nse
rock
F
eatu
res
whi
ch c
once
ntra
te
Low
reg
iona
lly
due
to c
rust
al
mas
s w
ill c
ause
pos
itiv
e lo
adin
g an
d m
antl
e de
pres
sion
an
omal
ies.

Interpretation of seafloor features
Glacial Flow Directions
Glaciers have the capacity to carry large volumes of rock debris which can be
used to erode the underlying substrate or can be deposited by the glacier on top of the
substrate. One mechanism of glacial erosion is abrasion, in which material trapped at the
bottom of the glacier cuts scours into the underlying rock units. These features show a
variety of scales ranging from inch long striae to the mega scale glacial lineations
mapped on the Ross seafloor by Shipp et al. (1999). Abrasive erosion requires the
surface lithology to be softer than the material being carried at the base of the glacier.
(Hambrey, 1994) Thus, glaciers are more efficient in eroding unlithified or sedimentary
rock units than igneous bodies such as basalt lava flows.
Glaciers also act constructively, depositing unsorted debris in drumlins,
asymmetric hills which taper in direction of glacial flow, or moraines, ridges of
unconsolidated material. The location of drumlins in the Ross Sea has been correlated to
the contact between sedimentary and crystalline substrate lithologies by Anderson et al.
(2001). The lithologic contrast creates a change in the glacier's basal flow velocity and
results in a combination of erosional and depositional processes which create the
asymmetric geometry of the drumlins. Moraines are deposits parallel or perpendicular to
the direction of glacial flow. Parallel moraines develop in subglacial areas where the base
of the glacier is not in direct contact with the substrate and are lineated in the direction of
glacier flow (Hambrey, 1994). Thus, the ridge and groove topography of glacial
lineations can be either erosional or depositional but both types of lineation constrain
glacial flow to be parallel to their elongation direction.
10

The following section summarizes the method for interpreting stress directions
from the alignment of tectonic or volcanic features. Material is referenced from Suppe
( 1985) unless otherwise noted.
Stress Orientation
Fractures in rock are constrained to geometric patterns that are controlled by the
orientation of the stress field in the crust at the time of their formation. The principal
components of the stress field are S 1, the direction of maximum compression; S3, the
direction of least compression and S2; the intermediate principal stress. Because the
atmosphere of the Earth is a fluid and incapable of transmitting stress, one principal stress
must be oriented perpendicular to the surface of the Earth confining the other two to the
horizontal plane which approximates the Earth's surface. Because of the predictable
relations between stress orientations and fracture geometry, the orientation of principal
stresses can be reconstructed by mapping the orientations of fractures. When examining
fractures on a two dimensional surface, only the relative magnitudes of the two horizontal
stresses can be determined. Then, the convention of using S 1, S2 and S3 is negated and
the stresses are referred to as the maximum or minimum horizontal stress.
In homogeneous rock, extension fractures open in the direction of least
compressive stress (S3) and propagate parallel to the Sl-S2 plane (Figure 14). Dikes and
volcanic fissures are extension mode fractures created by magmatic pressure. Thus the
opening and elongation directions of tabular magmatic intrusions also correspond to S3
and the Sl-S2 plane, respectively. When observing dikes or fissures in map view, the
direction of opening in the fractures is parallel to the minimum horizontal stress (i.e.
11
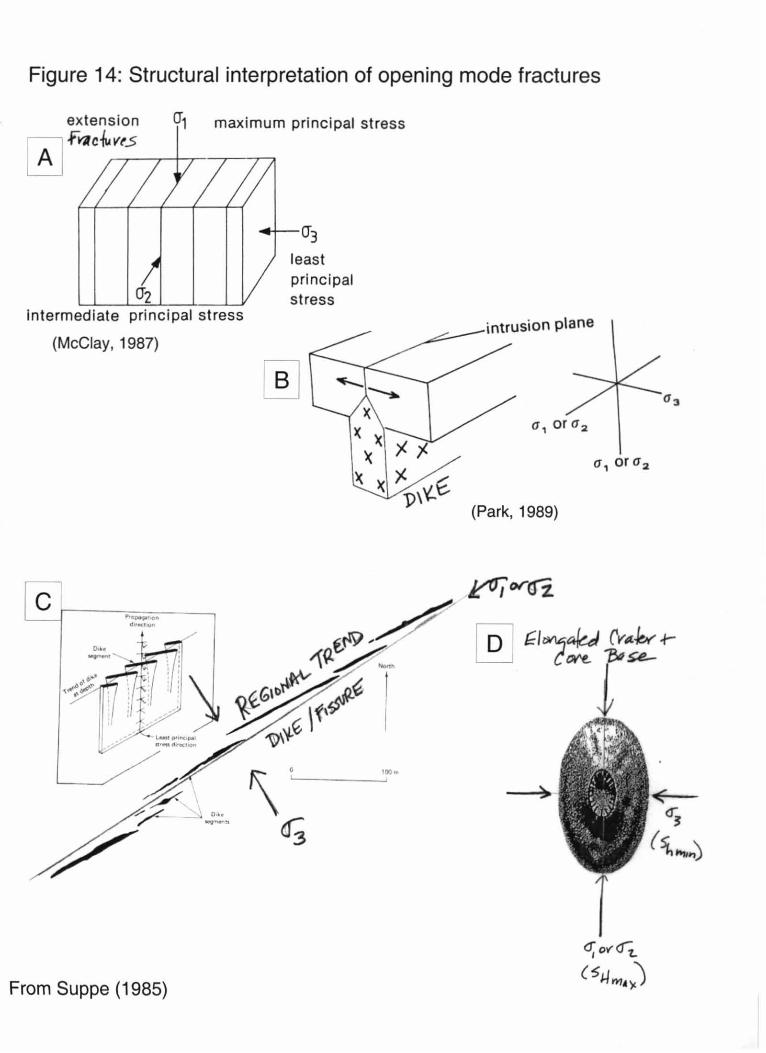
Figure 14: Structural interpretation of opening mode fractures
rr, maximum principal stress
intermediate principal stress
(McClay, 1987)
From Suppe (1985)
0"3
least principal stress
intrusion plane
a, or a 2
(Park, 1989)

perpendicular to the dike trend) which could correspond to S3 or S2. The trend of the
dike is parallel to the maximum horizontal stress, which could correspond to S 1 or S2.
Volcanic cones have underlying feeder dikes with an orientation constrained by the stress
field. Elongate cones on the surface of the Earth result from parallel, elongate feeder
systems in the subsurface (Nakamura, 1977). Therefore, using the elongation direction of
volcanic cones, the trend of the underlying feeder system, which parallels the maximum
horizontal stress direction, can be mapped (Figure 14D).
Faults are shear fractures along which slip occurs, causing displacement of rock
units across the trace of the fault plane. Anderson's theory of faulting predicts the sense
of shear which will occur along shear fractures based on the orientation of the three
principal stresses in the Earth's crust (Figure 15). Given that the stresses are mutually
perpendicular, there are only three unique possibilities for stress component orientation.
The following summarizes the predicted orientation and sense of displacement along
fault planes relative to the surface of the Earth depending on stress component orientation:
when S 1 is vertical, faults are inclined at 60 degrees (measured down from the surface)
and have normal-sense displacement; when S2 is vertical, faults form vertically and have
strike-slip displacement; when S3 is vertical the fractures are inclined at 30 degrees and
have thrust displacement. Anderson's theory also predicts the formation of conjugate sets
(i.e. two sets of planes formed at the same time, with an internal angle between them of
60 degrees). Sl bisects the acute angle between conjugate fault planes.
The internal pressure inside a cylindrical conduit which feeds magma to the
surface at a major volcanic center creates stresses in the surrounding rock that are parallel
and perpendicular to the conduit. When the local stress field is dominated by magmatic
12

Figure 15: Structural interpretation of shear fractures (faults)
conjugate IT1 shear f,.c.futt6
(Mcclay, 1987)
(a) (b) (c)
Anderson's Theory of faulting predicts conjugate sets of a) normal faults when S1 is vertical b) thrust faults when S3 is vertical c) strike slip faults when S2 is vertical.

Figure 16: Interpreting stress from regional dike swarms.
RA-P1'\L Dr~~ S~M At<.6UND \f1 LCftt\Jll Ct:NTEJ2.
·······-· · r.~-1~ •. ~ loo.) s1'ves\ • ...
· !~ .. ~~2,~~v~~--r.-t-.;__;_
tel
p1~t:" ~M ~mt' Htnli<6LAS$' 5H-AP.t" AiZhVND V•LrA;rlrc (!~ee._ ~-----C_o_~,,....-1_1~_-.bj 'ft,1ot'\lll s~~ il'1 CvusC-
N
o to",...
-- IO I
l•I

pressure, a radial pattern of dikes and fissures develops around the volcanic center
(Figure 16A). In the presence of a strong regional stress field, the dikes and fissures
around the magmatic center may initially be radial, but at distance are reoriented to align
with the regional Sl-S2 plane (Figure 16B). (Nakamura, 1977)
One can apply the principles outlined above to use existing fractures, faults or
volcanic bodies to reconstruct the stress field orientation responsible for their formation.
In this application, the timing of the structural deformation must be constrained. The
presence of pre-existing faults or fractures creates zones of weakness that may become
reactivated by stresses, rather than a new fracture forming (Nakamura, 1977). It is
commonly thought that magma may follow pre-existing fault planes, if they are suitably
oriented close to the direction in which a new opening-mode fracture would form.
13

Fig
ures
: B
athy
met
ry D
ata
Fig
ure
17:
Col
lect
ion
of
bath
ymet
ry d
ata
in a
sw
ath
bene
ath
the
ship
.
J
'*-F
.. ~ ~1~7.vl25 2
0()
.Q1
4 2'
3H31
pmtl
67
Ullllt--•~~J\lllJlll,lll...,../~"""""""'·~Jl"Clbl
.... .....
. ....
""
,,,,.
""'
,
-..,..
. .
.....
.....
... . R
-
--
--
Fig
ure
18:
Bat
hym
etri
c d
ata
cor
rect
ion
. A)
Bef
ore
editi
ng d
ata
are
skew
ed d
ue to
a f
ew
ext
rem
e de
pth
valu
es. B
) E
dite
d fil
e be
tter
sh
ows
the
true
cha
nge
in d
epth
fo
r the
map
ped
area
. (F
iles
edite
d by
the
aut
hor)
Fig
ure
19: A
rtifa
cts
in b
athy
met
ric
da
ta p
aral
lel s
hip
trac
klin
es.
""
Geophysical Data
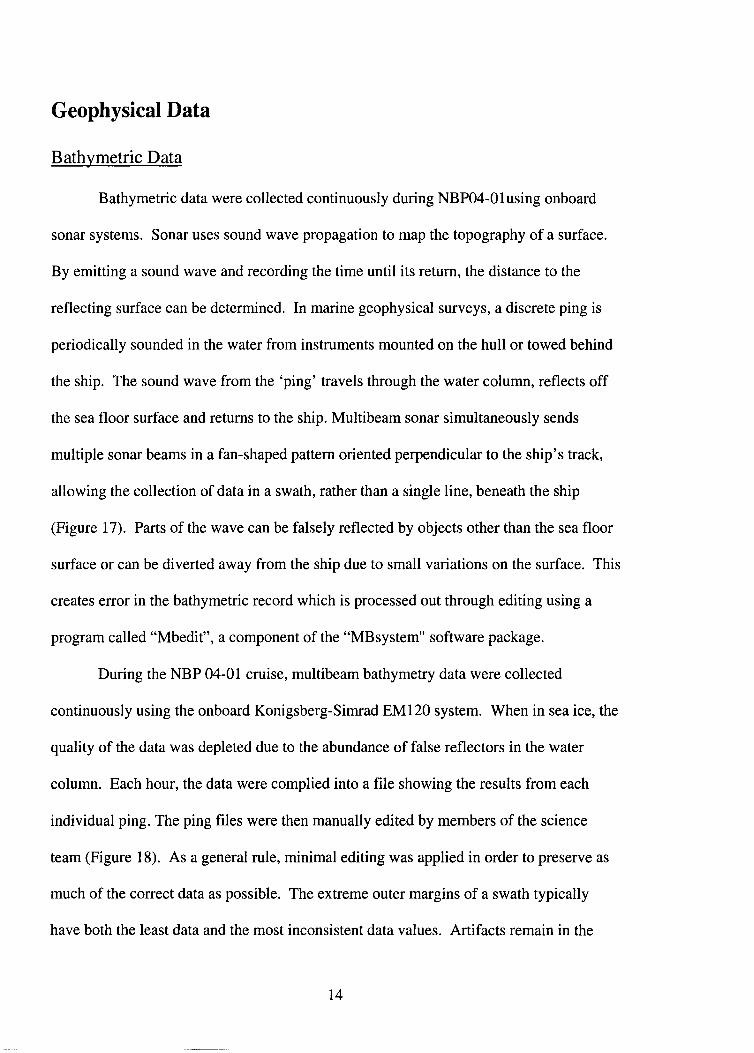
Bathymetric Data
Bathymetric data were collected continuously during NBP04-0lusing onboard
sonar systems. Sonar uses sound wave propagation to map the topography of a surface.
By emitting a sound wave and recording the time until its return, the distance to the
reflecting surface can be determined. In marine geophysical surveys, a discrete ping is
periodically sounded in the water from instruments mounted on the hull or towed behind
the ship. The sound wave from the 'ping' travels through the water column, reflects off
the sea floor surface and returns to the ship. Multibeam sonar simultaneously sends
multiple sonar beams in a fan-shaped pattern oriented perpendicular to the ship's track,
allowing the collection of data in a swath, rather than a single line, beneath the ship
(Figure 17). Parts of the wave can be falsely reflected by objects other than the sea floor
surface or can be diverted away from the ship due to small variations on the surface. This
creates error in the bathymetric record which is processed out through editing using a
program called "Mbedit", a component of the "MBsystem" software package.
During the NBP 04-01 cruise, multibeam bathymetry data were collected
continuously using the onboard Konigsberg-Simrad EM120 system. When in sea ice, the
quality of the data was depleted due to the abundance of false reflectors in the water
column. Each hour, the data were complied into a file showing the results from each
individual ping. The ping files were then manually edited by members of the science
team (Figure 18). As a general rule, minimal editing was applied in order to preserve as
much of the correct data as possible. The extreme outer margins of a swath typically
have both the least data and the most inconsistent data values. Artifacts remain in the
14

bathymetric maps, consisting mainly of linear traces parallel to the ship's track, along the
center and outer margins of the swath, due to sound wave diffraction and the ping editing
process (Figure 19).
During the course of the NBP0401 survey, the discovery of numerous seafloor
hills and ridges in the vicinity of Franklin Island led to the decision to carry out a more
complete survey in the region. The area to the east of Franklin Island could not be
surveyed due to the presence of the B-15A mega-iceberg. The very shallow water to the
south of Franklin Island precluded extensive surveying there, as ship procedure mandated
surveying in depths greater than 100-200 m below sea level in uncharted areas. We were
able to carry out a more complete surveying to the north of Franklin Island, and these
data are the focus of this study. The resulting bathymetric map is displayed as Figure 30
and discussed below.
Magnetic Data
The following two sections incorporate background information on the origin,
collection and processing of geomagnetic data. This material is referenced from
Reynolds (1997) except where otherwise noted.
The Earth's Magnetic Field
The Earth's magnetic field is modeled by a dipole which is the magnetic field
surrounding a common bar magnet (See Figure 20). The different orientation of the two
poles generates a magnetic flux, or gradient, between the two ends, which then generates
a magnetic field surrounding the magnet in a three-dimensional sphere. The analog to this
15

Fig
ure
20
.
--.
'"'"
'.,,
..,
"'.,
, ',
I\
I
----
--·.
,...·.
:.C,'.!
:';'
.··
. .. . .::~
:: }).\!/
..::·:<~
;~_ :_. ....
.
...
--~:::
~:: ... ::::
.:·::=:
=--·
. .
: .··
:~,.ill
-.:;
:: ·<
C·
• ••
. .,
;•
-,..
...
.. "'
--.
,'
·. . .
' •
~ I
• '
• •
\ .
, ,
'. .
• -+
I
I ,
. .
. .
-.. ,
-. .
. •
• •
• -c
-~~:-
·l~-"
. ..
. . '
. . -
--. :
-:· :.·.~
·~.:: :
>-.
. :
... . . .
-~ ~: ~:
:::::::=:::
:: .. :::·:.-:
:_::_-..
. . ...
. Cl:
,>"
•• :
...
....
...
....
. --•
• ..,,
..
.. r
::·,.
._ . ...
_·-.
.-·
,,'
, ,•
T , '
',
.. .. ..
.......
.. ...
. . .
I I
I \
...
. ..
' ....
...
..
..
' •
, ,
# •
····
-...
. ':.c
_ ••
y : 1
' ...
....
..
. -. : . : :.:: :~:
:]}Jj~~
;i0 ~~:::
::: :.·. 1 : g
~ ~r
rent
;
. . '"
:::s;
:;t:
:: --
... ·'
.. ...
... ~. :, ...
,•,,·,·~
·.~: .. \
: ... ~ ....
.... ..
. .· . .
.. ..
, ',
''•
.,. •''
.... ...
. . -~ ~ ~
~ ~: ;:
~:::/ .. T
.. -..::-·.-~-:~ :i:-
:: ~ ~ ~
~ --..
, , t.
' . "'4
..
.. ,
, :
'f ..
', '...
. .. ...
......
I t
I \
"'
-··
.. . .
. . . . . . .
.......
......
..
· .
..
rota
tion
axis
mag
netic
.
north
pol
e
equa
tor
mag
oe\ic
e~ua
\of
------
-• • • ' • • • ---
----
\mag
netic
so
uth
Sim
ilari
ty o
f the
dip
ole
mod
el o
f th
e m
agne
tic fi
eld
of A
) a
bar
mag
net
B)
a cu
rren
t con
duct
ing
coil
and
C)
the
Ear
th.
D)
illus
trat
es th
e in
clin
atio
n of
the
E
arth
's m
agne
tic fi
eld
and
the
rela
tive
loca
tions
of t
he m
agne
tic p
oles
to th
e ''t
rue"
or
geog
raph
ic p
oles
. (M
usse
t and
Kha
n, 2
001)
"
" . . " . . . .

process is a hybrid of two more familiar natural processes: a river flowing down its
stream gradient and the flow of electricity in a completed circuit.
The Earth's magnetic field is inclined to its axis of rotation by 11.5 degrees.
Therefore, the magnetic poles do not correspond to the geographic poles which are
referred to as "true" North/South. Since the magnetic field is a vector field, it can be
broken down into components. The total force vector, F, has an orientation with respect
to North, defined by the declination, D, and an angle from the horizontal, called the
inclination, I (Figure 21). The declination angle is the angle between true north and the
magnetic north pole. At the magnetic poles, the magnetic field points directly into the
Earth in direct contrast to the equator where the magnetic field is oriented parallel to the
surface of the Earth. In between these two extreme latitudes, the magnetic field is
directed at an acute angle to the surface of the Earth which is termed the inclination angle.
Together, the declination and inclination angles relate the orientation of the magnetic
field at a point to the location of the magnetic poles. The total force vector, F, can be
resolved into an H component, which is directed horizontally along the surface of the
Earth and points to magnetic North, and the Z component which is directed perpendicular
to the Earth.
The strength of the magnetic field is commonly measured in nanoTesla, a unit
equivalent to IQA-9 Tesla and abbreviated "nT." The magnitude of the field is greatest
near the magnetic poles, where the field enters or exits the dipole, and measures
approximately 60,000 nT. At the magnetic equator, the field is the weakest measuring a
minimum of 30,000 nT. Also, since the field is generated inside the Earth, it decreases in
strength at greater distance from the Earth's core.
16

In contrast to the geographic poles, the north and south magnetic poles are drifting
around the high latitude regions of the planet and thereby creating periodic variation
within the field. From day to day, the Earth's magnetic field sees periods of high and low
intensity known as diurnal variations. These can be considered magnetic tides because
they occur twice daily and mark the maximum and minimum values of the field strength
under normal conditions. In the upper atmosphere of the Earth, in a region known as the
ionosphere, charged particles are sometimes liberated from ionic bonds by solar radiation.
During periods of intense radiation, such as when sunspots propel large quantities of
charged particles into the ionosphere, fluctuations of hundreds of nT are globally
observed. (Kearey and Brooks, 1984) This hyperactivity is known as a magnetic storm
and often prevents the collection of usable data for the day or days on which it persists.
Based on measuring and modeling of the global magnetic field over time, the
International Geomagnetic Reference Field, or IGRF, has been developed. This model
predicts the undisturbed strength of the magnetic field at a given location for a given time.
(Kearey and Brooks, 1984) Localized divergence from these predicted values of magnetic
field strength can be caused by geological features, in addition to the natural variation of
the Earth's magnetic field. Some igneous rocks contain an abundance of iron bearing
minerals, which may have a high magnetic susceptibility meaning that the rock has a
greater propensity to record the magnetic field orientation and strength at the time of its
formation (known as natural remnant magnetization) as well as being more responsive to
the current magnetic field. In a magnetic profile comparing them to surrounding rock,
these igneous bodies produce an outlying field strength value which does not conform to
the predicted pattern of natural variation. That outlying value is a magnetic anomaly. The
17

susceptibility and natural remnant magnetization of concealed basic igneous rocks allows
their detection from remote locations through the examination of the magnetic anomalies
they produce.
Throughout geologic time, there have been time intervals during which the
magnetic poles have had a reverse orientation relative to the modern orientation which is
conventionally called normal. This pattern is best recorded at mid-ocean ridges where the
crystallization of basaltic magma is continuous on a geologic time scale. Upon
crystallization, the basaltic rock records the location of the magnetic pole and, thereby,
the orientation of the magnetic field. During marine surveys, a striped pattern in the
magnetic orientation of seafloor rocks emerged allowing the establishment of a polarity
time scale (Appendix A). The most recent reversal to normal polarity occurred 780 Ka.
Thus, a rock which yields a strong negative anomaly was aligned with a reversed
magnetic field at the time of its formation and pre-dates 780Ka. (Musset and Kahn, 2001)
Igneous bodies with strong remnant magnetization may thus have a positive anomaly
(where the remnant magnetization is 'normal' and adds to the Earth's field) or a negative
anomaly (where the remnant magnetization is 'reverse' and substracts from the Earth's
field).
Treatment of Magnetic Data
Magnetic data over Franklin Volcanic Field was extracted in a series of east-west
profiles from the data set for NBP 04-01. To map magnetic signatures of geological
bodies, it is necessary to process magnetic field values measured during a survey. First,
the values attributable to the Earth's magnetic field must be removed. This is done using
18

Mag
netic
nor
th
Ge
og
rap
hic
nor
th
N
' )
/ ,.
/' ,
s
I= 0
° N
'///
s
N ~
s
Fig
ure
21: C
hang
e in
inc
linat
ion
angl
e w
ith g
eogr
aphi
c la
titud
e. I
nclin
atio
n A
ngle
is 9
0 d
egre
es a
t m
agne
tic p
oles
a
nd
zer
o de
gree
s a
t the
equ
ator
. (R
eyno
lds,
199
7)
Fig
ure
22:
Idea
l su
rve
y gr
id f
or a
n ae
rom
agne
tic s
urv
ey
(Rey
nold
s, 1
997)

the IGRF model for the survey region. For this study, the author provided the FVF data
to Dr. Beata Csatho at the Byrd Polar Research Center, who removed the IGRF from the
data using the Geosoft magnetic data processing software package. Second,
contributions from other sources of natural magnetic variation (i.e. diurnal variation or
magnetic storms) must be removed. There are many available methods to accomplish
this correction; however, none have yet been applicable to the Franklin Volcanic Field for
reasons discussed below.
Surveys designed primarily for detection of magnetic anomalies generally are
carried out in a series of relatively closely spaced, parallel survey lines, linked by
perpendicular 'tie lines' (Figure 22). In the presence of a constant field, the value at each
crossover point would be the same over time. By observing the variation between the first
and second readings at crossover points, one can calculate the change in field strength,
which is then directly attributed to fluctuations in the magnetic field. Since a tie line
crosses all the lines in the region, it allows the calculation of variation over time, thereby
modeling the natural fluctuation of the magnetic field (Kearey and Brooks, 1984). These
data are also later compared to readings at a local base station in order to identify natural
variation in the values.
For shipborne surveys where the primary goal is to collect magnetic data, two
magnetometers are commonly used. Each is towed behind the vessel, with a mutual
spacing which corresponds to the scale of features which are being observed so that as
one magnetometer passes over a feature of interest, the other does not and provides a
reference value. The proximity of the two magnetometers is sufficient to allow the
inference that there is a direct correlation between the total magnetic field at one
19

magnetometer and the expected total magnetic field at the other. Thus, any differential
field measured between the two magnetometers can be interpreted as a local anomaly and
used to calculate that anomaly's magnitude.
During the NBP 04-01 cruise, a single magnetometer was towed and neither of
these common survey modes was used. The original intent of the research expedition
was more dependent on the identification of seafloor hills as volcanic features based on
seafloor morphology and seismic profiling. The magnetic data was aimed at detecting
the signature of basaltic volcanic bodies at or beneath the seafloor by identifying relative
highs or lows in the magnetic data, compared with local background values. Problems
arose in trying to remove contributions from non-geological sources of natural magnetic
variation from the survey data. A first approach to identify and remove diurnal variation
and magnetic storm components planned to use data from geomagnetic observatories in
the region as base stations for the surveys. Data was obtained from the Scott Base from
http://www.intermagnet.org, courtesy of Stuart Henrys, and from the Terra Nova Bay
Magnetic Observatory courtesy of Dr. Domenico Di Mauro (lstituto Nazionale di
Geofisica e Vulcanologia, Rome, Italy). These data were graphed together with NBP 04-
01 profile data for identical time intervals. This revealed significant differences between
magnetic intensity between the base stations (Figure 23), indicating that the base stations
could provide information about the general magnetic conditions during a given time, but
were not useful for removing diurnal variations from the NBP data.
Using local observations where tie lines provide crossover points to level the
magnetic field values for the area is commonly used in well-gridded aeromagnetic
surveys but has not been possible for the Franklin Volcanic Field due to the nature of the
20

r
Figure 23 Comparison of Magnetic Observations at Three Locations
"C Qi u:::: al
'O Qi LL al
66500.0
66000.0 -
65500.0 I
65000.0
64500.0
64000.0 --r"" A.--~". 109.u.J I IU
63500.0 I I
168.40 168.50 168.60 168.70 168.80 168.90 169.00 169.10 169.20 169.30
Longitude
64300.0
64200.0
64100.0
64000.0
63900.0
63800.0
1-NBP - TNB SBA I
Comparison of Magnetic Observations at Three Locations
-75.65853,
63700.0 +-------,.------.------.-----.----.----..-------,.-----.-----i
168.40 168.50 168.60 168.70 168.80 168.90 169.00 169.10 169.20 169.30
Longitude
1-NsP - TNB ssA j
A) Data along the N1 profile. Longitude is the location of the NBP. Contrasting magnitude of observations for time equivalent magnetic data prevents direct subtraction of base station values to calculate magnetic anomaly magnitude at NBP. 8) Same data, rescaled to show detail. Note that general conditions of the magnetic field are analogous.

survey. The Franklin Volcanic Field and its adjacent low lying areas were surveyed on
various days over a month-long period. Data were obtained in the region on the 20, 23-
25th and 27- 29th of January and on the 6, 7, and lzth days of February. In the case of
NBP 04-01, data along the tie lines were collected days or weeks after the original
parallel grid lines were observed. The time expansive nature of the NBP survey makes
the classic grid technique inadequate because the time in which the magnitude of
variation can be modeled using the cross over points is limited. Furthermore, the tie
lines provide clusters of data which skip entire days and therefore entire cycles of diurnal
variation and potential magnetic storms.
Because of the aforementioned limitations, profile analysis was applied instead of
producing an anomaly map from gridded values. The observed magnetic anomaly value
for each minute was plotted against the corresponding position as recorded by the
vessel's GPS. Once the series of parallel profiles is complete, the anomalies observed in
each individual line can be correlated to magnetic anomalies in other lines which cross
the same feature. In order to ease spatial correlation of the profile data, data were
imported into the GIS and color coded according to the calculated anomaly magnitude.
The resulting map is included in the descriptive section below. In order to enhance the
quality of the data display, anomaly values along profile N30 and other extreme
maximum and minimum values were removed. The correlation of anomalies across two
dimensional space in map view allows the anomalies to be directly attributed to sea floor
features mapped from the bathymetry data.
21

Gravity Data
The following section incorporates background information on the origin and
collection of gravity data. This material is referenced from Reynolds ( 1997) unless
otherwise noted.
The Gravity Field
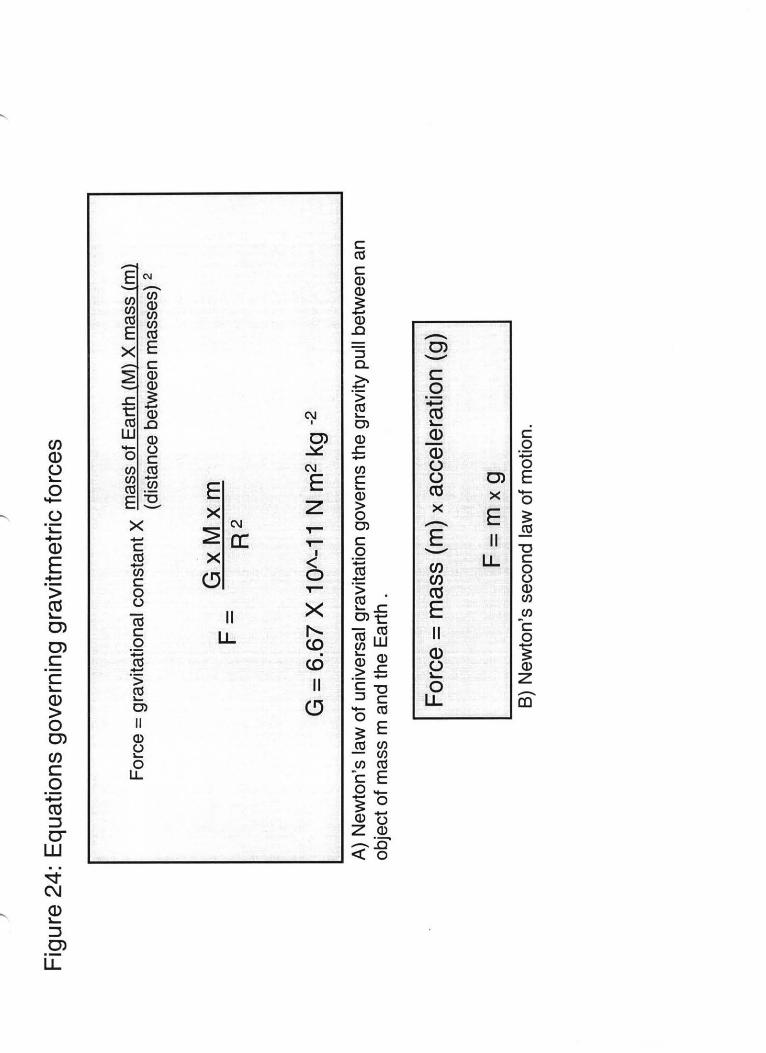
According to Newton's universal law of gravitation, gravity acts to pull two
massive objects toward each other. The magnitude of this attraction depends on the mass
of the two objects as well as the square of the distance between them (See Figure 24 for
equations governing magnitude of gravity force). The magnitude of the force of gravity
is proportional to the acceleration that it causes between two objects. By convention, the
acceleration of an object due to the Earth's gravity field is denoted g which is
approximately 980crn/s2 (1 crn/s2 = 1 Gal) at the surface of the Earth. Measurements of g
are taken with respect to the geoid, a surface which is always perpendicular to the gravity
field and connects all points of equal field strength. If the Earth were a smooth,
homogeneous sphere sitting motionless in space, the geoid would be aligned exactly
along its surface. However, in addition to its rotation, the Earth is flattened at its poles,
has an uneven distribution of mass and uneven surface topography, all of which act to
warp the geoid and produce long wavelength anomalies. (See Figure 25) Superimposed
on the long wavelength anomalies are shorter wavelength anomalies due to near surface
variations in mass distribution and surface morphology.
Gravimeters, which measure changes in the gravity field, respond to variable
mass distribution or density of the material in the subsurface. Commonly, the gravimeter
22
J I
Fig
ure
24:
Equ
atio
ns g
over
ning
gra
vitm
etr
ic fo
rces
For
ce =
grav
itatio
nal c
onst
ant x
mas
s of
Ear
th (
M)
X m
ass
(m)
(dis
tanc
e be
twee
n m
asse
s) 2
F-
GxM
xm
-
R2
G =
6.6
7 X
1 Q
A-11
N m
2 k
g -2
A)
New
ton
's la
w o
f un
iver
sal g
ravi
tatio
n go
vern
s th
e gr
avity
pul
l be
twee
n an
ob
ject
of
mas
s m
and
the
Ear
th .
For
ce =
ma
ss (
m)
x ac
cele
ratio
n (g
)
F=
m x
g
8)
Ne
wto
n's
sec
ond
law
of
mot
ion
.
l

I
N
A
I s
~
Con
tine
nt
Elli
pse
of r
ota
tion
.--~S
pher
e
Ref
eren
ce e
llips
e of
rot
atio
n
Fig
ure
25:
Orig
in o
f lon
g w
avel
engt
h gr
avity
an
omal
ies.
A
) T
he t
rue
sha
pe
of
Ear
th
rela
tive
to i
deal
sph
ere
. W
arpi
ng o
f the
geo
id d
ue to
B)
top
og
rap
hy
and
C)
rela
tivel
y de
nse
body
of
rock
. (R
eyno
lds,
199
7)
~J_ ---
---
-,, I
} exte
nsio
n
m (g
+og
}
@]
War
p
Re
fere
nce
ellip
se
of r
otat
ion
:::
::::
=:·
:·:·
:·:
·:·
:::.
:::
.:::
.::
::~
·:·:
·:·:
.
. .
. .
. .
. .
. .
. .
. ..
...
....
.....
...
. . .
. .
. .
. .
. .
. .
. .
. .
. . .
. . .
. . .
. .
. .
. . .
. . .
. .
. .
.
. ....... .
.
. .
. .
. .
. ..
...
.
. .
. .
. .
. .
. .
..
. .
. .
. .
. .
. .
. .
. .
. .
. .
. .
. .
. .
. .....
. .
. . .
. .
. .
. .
. .
. .
. .
. : :
: :
: : :
: : :
: :
: : :
: : :
: :
: :
: : :
: : :
: :
: j
..........
..
.....
. .
. .
. .
. .
. .
. .
. . .
. .
. .
. .
......
. .
. .
. . .
. .
. .
. .
. . .
.
. .
. .
. .
. .
. .
. .
. .
. .
. .
. .
. .
. .
. . ..
.
. .
. .
. ...
.....
....
..
..
: : :
: : :
: : : :
: : : :
: : : :
: : : :
: : : :
: : : :
: : : :
~ .-
:-~ ~
~ .
. .
Fig
ure
26:
Sim
ple
gra
vim
ete
r. A
mas
s on
a s
prin
g is
dis
plac
ed d
ue
to t
he p
ull
of e
xces
s m
ass
in th
e s
ubsu
rfac
e.
(Rey
nold
s, 1
99
7)
/

uses a mass and spring system based on the principle that displacement of the spring is
directly proportional to the local change in g resulting from a change in mass distribution
(Figure 26). The magnitude of gravity anomalies, which can be either high or low, are
measured with respect to the value expected from the location of the geoid in the area of
interest. When surface elevations are sufficiently constrained, modem gravimeters are
sophisticated enough to measure the variation in gravimetric acceleration on the order of
microGal (10"-6 Gal).
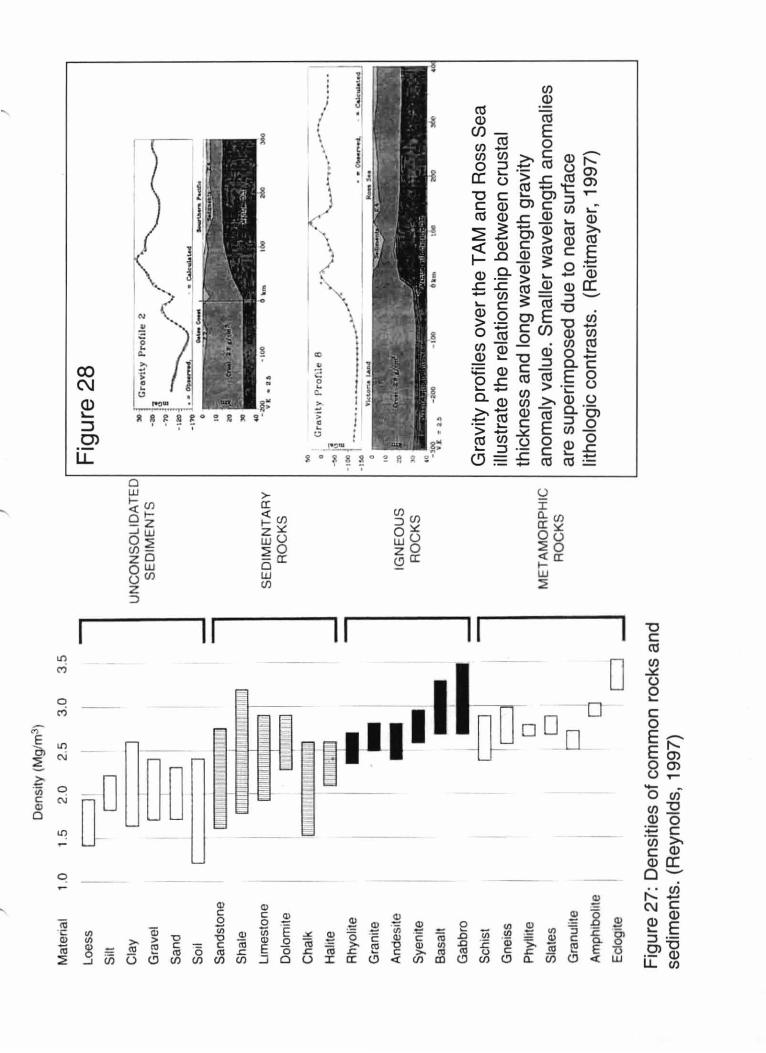
In geologic settings, variable rock types and crustal thicknesses are common
causes of gravimetric anomalies. Rocks, depending on their origin and composition,
have a characteristic density (mass per unit volume). As a general rule, sedimentary
rocks are less dense than igneous rocks (See Figure 27). Thus an igneous rock will
appear more massive than a sedimentary rock of the same volume. The local thinning of
crust allows the mantle to rise up closer to the surface. Since the mantle is a denser layer
than the crust (3.3 g/cm3 as compared to 2.75 g/cm\ this upwelling increases the local
pull of gravity. Thus areas of extensional tectonism, like WARS, are commonly
gravimetric highs relative to their surroundings, meaning that acceleration due to gravity
is locally enhanced. In contrast, during mountain building, contractional deformation
produces crustal thickening and thereby lowers the level of the crust-mantle boundary,
called the Moho, toward the center of the Earth. Depression of high density mantle
material creates a relative gravimetric low corresponding to a local decrease in g (See
Figure 28). (Barret et. al, 1995; Reitmayr, 1997)
On a broad scale, the regional gravity signature of the TAM-WARS system
conforms to these predictions. The TAM are associated with a broad gravity low,
23
'
Mat
eria
l 1
.0
Lo
ess
Sill
Cla
y
Gra
vel
San
d
Soi
l
Sa
nd
sto
ne
Sha
le
Lim
est
on
e
Dol
omite
Cha
lk
Hai
ne
Rhy
olite
Gra
nite
And
es1
te
Sye
rnte
Bas
alt
Gab
bro
Sch
ist
Gne
iss
Phy
lhte
Sla
tes
Gra
nulit
e
Am
phi b
ol1t
e
Ecl
og1te
De
nsi
ty (
Mg
lm3)
1.5
2
0 2
5 3
.0
3.5
I I c=
i I
I I
I I
I
I I
I 11
e I I
·-=- - - ~
0 D
D
0 C
J
Fig
ure
27:
Den
sitie
s of
com
mon
roc
ks a
nd
sedi
men
ts.
(Rey
nold
s, 1
997)
l
UN
CO
NS
OL
IDA
TE
D
SE
DIM
EN
TS
SE
DIM
EN
TA
RY
R
OC
KS
IGN
EO
US
R
OC
KS
ME
T A
MO
R P
H IC
R
OC
KS
Fig
ure
28
'°h
roV
lly
Pro
file
2 /~
--3
1 ~
•
-111
s
f\./
-12
0f ..
~
. Co
lc..
ialo
M ---
-
-111
1 -
-0 10
i!I "" ..,
-...
.. .....
.. ·~~
....
.,.-
: --..
_~
--... ..
.. ,~ ~
-· ..,
·s.··
----
---
i;-~·;
' ••
• 1.
...-
·-· ...
... --
,..
-'--
..
..
••• -l-
•;.:.1
.t_•;
-."':'
-:zoo
-1
00
6
'm
16o
t6o
300
YI:
•
26
00
-
--
"""l
~-
"'-G
ravi
ty P
roh
lc 8
·.'
>,.
A
\.
-·'
·-
· ·--.
0 ~
,,.,
....
. .
"'-'-~·
•
•OO
lJ
,{
I -100
1··-·-
----~
-..,..
/ . -~
.... •C
olc
..a.l
ri
·1$
0 ,,
~-
.. . --
.-'t-
. ~!,
. ...
-~
;: :
·.
. .~
l-~
I •
-..
----· --
-_
_ ..
..-.
.:i_
c -=
---II
·-
-----
---·
----
-1
0
..... -._
,.....
~,-..---_
;;;_;;;;_
::: __
:0
Gra
vity
pro
files
ove
r th
e T
AM
and
Ros
s S
ea
illus
trat
e th
e re
latio
nshi
p be
twee
n cr
usta
l th
ickn
ess
and
long
wav
elen
gth
grav
ity
an
om
aly
val
ue.
Sm
alle
r w
avel
engt
h an
omal
ies
are
sup
erim
pose
d du
e to
ne
ar
surf
ace
litho
logi
c co
ntra
sts.
(R
eitm
ayer
, 19
97)

whereas the region of the WARS under the Ross Sea has relatively higher gravity values
(Reitmayer, 1997). Sediment-filled rift basins are expected to be marked by gravity lows,
and some Ross Sea basins are anomalous in having relatively higher gravity than adjacent
basement block uplifts. This may relate to underplating by magmatic intrusions, from
mechanical flexure of the crust, or other, as yet unidentified, sources. On a local scale,
shorter wavelength anomalies are superimposed on the regional trends, reflecting the
distribution of mass within the upper crust. Where short wavelength anomalies are
greater than the regional mean, they indicate the presence of relatively dense rock types
such as the basaltic igneous rocks of the McMurdo Volcanic Group. Short wavelength
anomalies with values less than the regional mean are indicative of sediment infilling of
surface depressions.
Treatment of Gravity Data
Gravity data from the NBP 04-01 cruise was obtained using a gravimeter mounted
in the ship. A tie between the shipboard gravimeter and a land-based gravity station at
McMurdo Station was made prior to the cruise. Before the end of the cruise, values were
corrected using the EOTVOS subtraction which accounts for the motion of the ship
relative to the rotation of the Earth. Additional correction for depth of the features
relative to the gravimeter has not yet been undertaken. The anomaly values obtained from
the cruise were plotted along tracklines in the FVF using the location given by the ships
GPS. The resulting map is included in the descriptive section below.
24

Seismic Reflection Data
The following section incorporates background information on the origin and
collection of seismic data. This material is referenced from Musset and Khan (2001)
unless otherwise noted.
Seismic surveying
Seismic reflection surveying uses ground penetrating energy pulses, or 'seismic
waves', to map a cross section through the Earth's crust (Figure 29). The ability of a rock
unit to transmit the acoustic energy signals varies with its density, and hence its lithology,
as well as with its structure. As the seismic waves pass through the subsurface they are
reflected at boundaries between units with different acoustic impedance. These
boundaries commonly correspond to lithologic changes in the subsurface. The cross
section produced shows the geometric relationship of rock units throughout the
underlying area. Sedimentary basins, characterized by thick accumulations of
approximately horizontal sedimentary layers, are well-suited for seismic analysis because
horizontal and gently-dipping layers produce the most coherent reflections. Through the
study of the geometry and lateral continuity of the reflectors, post-depositional
disturbances to strata within basins can be identified and mapped.
The Franklin Volcanic Field is developed within the Victoria Land rift basin,
characterized regionally by flat-lying or dipping strata. Lateral disruptions or truncations
of sedimentary layers could be the result of faulting, glacial erosion, paleotopography, or
volcanic intrusions. Faults produce offset of otherwise continuous strata across a linear
zone. This is observed in the seismic lines as a truncation and change in the position of a
25

r
t
.,__ _____ __ 3 km approx--------.
48
Figure 29: Cartoon of seismic surveying shows streamer in tow behind the vessel
I faul ts
t
I Figure 30 Truncation and offset of strata across a fault zone as seen in seismic section.

reflector across a dipping, planar surface, the fault (Figure 30). Glacial erosion alters
surface morphology and can reduce the thickness of the rock units it scours. Receding
glaciers can create unconformable contact surfaces in the stratigraphic column and can
spawn stream channels that carve into the substrate. Paleotopography created by past
glaciations or tectonic movements is filled in by later stage sedimentary strata which are
deposited horizontally. Deposition on top of pre-existing structure and dipping layers
creates a change in bedding orientation across the contact. Since the contact represents a
significant geologic time gap between the units it is referred to as an angular
unconformity. Volcanic intrusions cut upward through pre-existing layers and so appear
as zones of interrupted reflector patterns. Dike intrusions have contacts that are at a high
angle to the general bedding dip. Morphology of intrusion contacts and patterns within
volcanic bodies can be variable. Some units have internal stratification which differs
from that of the surrounding rock, some units lack stratification and other units do not
seem to inhibit the passage of very bright reflectors at all.
Treatment of seismic data
During the NBP 04-01 cruise, seismic data were collected along tracks
perpendicular to the general trend of the Franklin Volcanic Field (Figure 31). During
optimal conditions, the system operated 6 GI Air Guns which used compressed air to
generate the necessary acoustic energy wave. The streamer, which was towed in the
water at near constant depth, contained hydrophones which recorded small local changes
in pressure as the energy waves returned to the surface. Initial processing was conducted
onboard the ship by members of the science team to produce seismic profiles showing
26
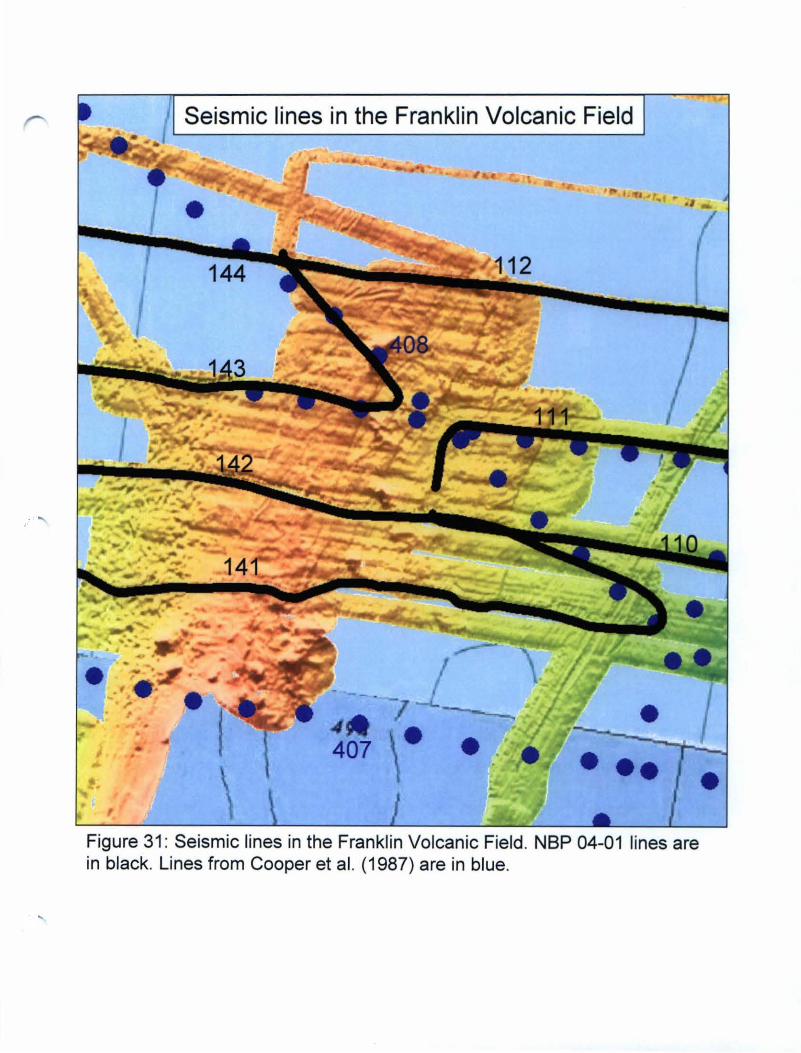
r
r
Seismic lines in the Franklin Volcanic Field
• .. • • •
, Figure 31 : Seismic lines in the Franklin Volcanic Field. NBP 04-01 lines are in black. Lines from Cooper et al. (1987) are in blue.
•

subsurface reflector position relative to two-way travel time. Additional processing is
being conducted at the Institute of Geological and Nuclear Sciences in New Zealand
(Stuart Henrys). Since rock units have a wide range of acoustic velocities, converting the
units of a seismic profile from two-way travel time to depth is an involved process which
has not yet been undertaken for the NBP 04-01 seismic data. This study focuses on the
subsurface shape of features and their spatial correlation with seafloor topography, so that
their absolute depth is inconsequential.
Processing of the seismic profiles is ongoing. At this time, only single channel
seismic data are available for profiles 141, 142, 143 and 144. The current single channel
seismic profiles have high vertical exaggeration which stretches vertical disruptions while
compressing and obscuring the horizontal dimension. Very narrow dikes and steep,
small-offset fault zones are particularly hard to distinguish on such lines. Current
interpretations of small features from seismic data are tentative, and must rely on the
integration of other geophysical data sets to draw conclusions about their mode of origin.
In addition, it appears that the geographic location recorded for seismic shot points is not
correctly registered spatially with the bathymetric maps. Thus, the bathymetric
expression of the seismically observed features is consistently to the west of the locations
given by the seismic profile's shot point numbers. Finally, the resolution of the seismic
data is such that features with less than 15 meters vertical expression may not be
observed.
27

Results
Bathymetric Maps: Description and Initial Interpretation
Based on the bathymetric maps, the Franklin Volcanic Field is divided into three
north-south trending terrains with distinct morphological characteristics: the western
terrain is marked by hummocky topography and abundant surface depressions, the central
terrain is dominated by conical bathymetric highs and long, branching linear features, and
the eastern terrain is characterized by a closely-space fabric of linear traces (See Figure
32). The contrasting morphology of each terrain provides a basis for interpreting their
respective mechanism(s) of formation as the result of different geologic processes.
Western Hummocky terrain
The hummocky terrain occupies the western slope of the Franklin Island Ridge.
The slope is shallow, dropping from 440 meters to 500meters below sea level in
approximately 8 km. For the length of the slope, there are randomly distributed surface
depressions up to 1 km in diameter and 30 meters deep. The depressions show variable
shapes from oval to round. The negative relief and frequency of these features suggests a
glacial rather than volcanic origin however, the depressions are unique within the Ross
Sea Floor and lack a submarine analog. Two modes of formation have been suggested by
Julia Wellner via e-mail correspondence. The depressions could be kettle holes formed
by deformation of sedimentary layers under the weight of a large ice block or they may
be depositional structures formed as sediment is deposited around blocks of partially
grounded ice. Both hypotheses agree that the features formed under stationary blocks of
ice which were left by the ice sheet during its retreat.
28

,, . .,. , Curvilinear ,, .... scarps
......
... .... ,.,.,,.,
• ... .. ... ... ... .. ... .. Figure 32 : Bathymetrically defined terrains and nomenclature of features North of Franklin Island. Image illumination from the West and North.

Central Volcanic terrain
The Franklin Island Ridge has a regional N-S trend which curves toward the
northeast near Franklin Island. The raised topography of the ridge, its association with
Franklin Island, and the broad magnetic anomaly over it were early indications of its
volcanic origin. The origin of cones A, C, G and Potter Peak was determined during the
NBP 04-01 cruise through the collection of samples from the sides of these edifices.
Through dredging, basalt, hyaloclastite and tuff from the four hills were obtained for
geochemical analysis and age dating. The presence of basalt on each points to a volcanic
origin. Based on their similar morphology and spatial association, the cones B, D, E, and
F are also interpreted as volcanic cones. The morphological characteristics of cones A-G
are summarized in Table B.
Cone A sits on the margin between the hummocky and volcanic terrains. Its
symmetric shape prevents definitive correlation with other volcanic features. The trend of
the long axis of cone B is parallel to the trend of the regional volcanic ridge. Cone C has
a more easterly elongation than any other volcanic feature and sits very near the axis of
the regional ridge. Cones D, E and F are clustered just east of the central ridge axis.
Each of the cone bases has a north-south elongation; craters on cones D and F have north
south and northwest elongations, respectively, which are all different than the northeast
elongation of the cones to the west of the central ridge axis. Cones E and F sit on a
superimposed ridge which trends northwest. Cone G is the most prominent topographic
high, and is positioned on a northwest trending ridge, Rl. Rl is surrounded by lobate
ridges extending outward from its flank at a high angle. These lobate ridges are
29

Table B Dimensions Basal morphology & Crater morphology elongation; cone and elongation
symmetry A 1.34 km long Circular cone base with Round (west) 1.34 km wide steep pyramidal sides
11 Om total relief B 1.34 km long Stubby oval shape, NE- Oval, elongated to the
1.09 km wide SW elongation northeast 60m total relief Steep western flank
c 1.43 km long Stubby oval shape, NE-0.71 km wide SW elongation no visible crater 50m total relief Steep western flank
D 1.64 km long Oval shape, N-S Oval, elongate in north-0.88 km wide elongation south direction 30m total relief Steep eastern flank
E 1.18 km long Oval shape, N-S 0.80 km wide elongation no visible crater 30m to 90m total Steep eastern flank relief
F 2.02 km long Oval shape, N-S Oval, elongate to the 1.18 km wide elongation northwest 35m to 70m total Steep eastern flank relief
G 1.30 km long Nearly round with (east) 1.09 km wide slight N-S elongation no visible crater
50m total relief

interpreted to be lava flows that were extruded from a vent (or vents) coevally with the
formation of the ridge itself.
Further north from the steep slope of Franklin Island, there are two additional
northwest trending ridges named R2 and R3, a prominent double cone named 'Potter
Peak', and by long, curvilinear escarpments El, E2 and E3. R2 and R3 have
superimposed cones which are elongate to the northwest. The cones have relatively
shallow flanks and are up to 50 meters tall. Depending on the perspective, these two
ridges may look to be parts of the same northwest trending ridge. However, since
bathymetric linkage between the two is lacking, they have been interpreted as separate
but parallel volcanic ridges forming an en echelon pattern. 'Potter Peak' is a triangular
edifice with the largest dimension in the area, having a maximum cross section of 3.3 km.
The cone has a total relief of 75 meters. The triangular morphology is in part due to a
flanking lava flow which extends from the southern face of the cone. At the northern
limit of the mapped area, there is a low relief cone, cone H, which is approximately 20m
high on its steep western side. Its ovate morphology is elongate to the northwest. The
curvilinear scarps E 1, E2 and E3 are at least 10 m high, step down to the east, and extend
north-northeast for 25km in the mapped region. The westernmost scarp, El, appears to
link Franklin Island with Potter Peak, however, it branches into three traces (Ela, Elb,
and Elc) that curve to the northeast adjacent to Potter Peak. From bathymetry alone, the
origin of the curving scarps is not clear. They could represent volcanic ridges, fault scarps,
or glacial lineations.
The eastern margin of the volcanic terrain is defined by a set of lobate scarps LS 1
and LS2. Each steps down-to-the-east with a drop of approximately 10 meters. To the
30

south and east of LS2, there are a series of subparallel, curving low-relief escarpments,
all stepping down to toward the east. The lobate form of these scarps (LS 1, LS2 and
related features), and the overall setting within a volcanic province, suggests they may be
the margins of lava flows.
Superimposed on the volcanic terrain are sharp, elongate depressions of 10 to 15
meters with distinctive angular bends. These are only observed where the seafloor is
above about 400 m depth. The sharp, steep sides suggest they were formed where
iceberg keels dragged across the seafloor. Although lineations are also carved by the
motion of grounded ice sheets, the sudden change in movement direction recorded by
these features, their lack of continuity, and their development only in the shallow portions
of the region, are indicative of iceberg movement.
Eastern lineated terrain
The lineated terrain shows some overlap with the eastern edge of the volcanic
terrain. The lineations in this zone have 5 to 20 meters of vertical relief, 5 per kilometer
frequency of spacing, and can be traced nearly continuously across the eastern terrain.
Across the region, the lineations show a systematic change in trend from east-west over
the volcanic region, to northeast in the eastern terrain. The traces are continuous for 6
km before crossing over the lobate escarpments interpreted as the margins of lava flows.
The lineations are much more pronounced in the easternmost part of the mapped region
where single ridges can be traced for 8 km before leaving the extent of the mapped area.
The contrast in total relief, frequency and lineation direction of these features
point to a different mode of formation than that of the volcanic cones and ridges. The
31

,. .....
....... ft I,
,.,. ,.., ,.,.,
Figure 33 Nomenclature of features for use with seismic, magnetic and gravity observations
Contact
Franklin Island
, ..... ••••••••••••• • • • • lnfwTed contact
- - - - - - Elonpi-•-
.. ... ... ... ... -
.... .,., , ... ,11 ,.,.,,'( .......
. ,, . ..,
11·ors
, ... ,lt
... ... ...

r
Figure 34: Magnetic anomalies of the Franklin Volcanic Field
ANOMALY
MAGNITUDE -164.99 - -126.83
• -126.82 - -104.37
• -104.36 - -87.97
• -87.96 - -73.85
• -73.84 - -61.37
• -61 .36 - -49.51
• -49.50 - -37.01
• -37.00- -23.18
• -23.17 --7.58
-7.57 - 9.43
• 9.44 - 26.55
• 26.56 - 48.02
• 48.03 - 100.93
~
-·~ j -19. 7 -----
\ )

lineations are interpreted as glacial lineations formed by the passage of grounded ice
across the region during the Last Glacial Maximum because they are similar to those
previously mapped throughout the Ross Sea Embayment. These glacial scours are
evidence of a unidirectional flow regime which diverts from the norm around bathymetric
highs such as Franklin Island. (Anderson and Shipp, 2001; Anderson and Wellner, 1997).
The fact that they are superimposed across the lava flow margins indicates the lineations
post-date volcanism, consistent with formation during LGM. The prominence of glacial
lineations at the eastern extent of the mapped region is an indication that this area has a
softer surface lithology (i.e. unlithified sediment) and provides further evidence that the
curving escarpments to the west are the edges of lava flows.
Magnetic Data
Throughout this section the stated value of a magnetic anomaly is taken with
respect to the magnetic anomaly values that are immediately adjacent on either side.
Observations
Figure 34 displays the magnetic anomalies of the Franklin Volcanic Field.
Discrete positive anomalies overlie Potter Peak and Cones A-H, with Potter Peak and
cone H having the largest magnitude anomalies. The trace of Rl is characterized by a
positive anomaly. R2 lacks an anomaly signature but Cone J which sits on its
northwestern end is a positive anomaly. Three of the four lines crossing escarpment E2
show a drop in the anomaly values from West to East but escarpments El and E3 lack a
strong signature. There are two conflicting observations over the northernmost part of E3.
32

One profile shows a short wavelength positive anomaly but the line immediately north of
it has an asymmetric anomaly which increases on the eastern side of the scarp trace. The
area west of LS2 has a series of broad positive anomalies which cannot be correlated to
an individual seafloor feature. Some tracklines show a drop in the magnetic anomaly
from west to east across LS2 and LS 1, however, the majority of profiles across each
lobate scarp lack a signature. Although Area 1 does not have a bathymetrically observed
feature, each of the three profiles which cross over it show broad positive anomalies.
Due to the color scale used to plot the magnetic anomaly values, small magnitude
anomalies may not be observable if they occur within one of the anomaly value intervals.
In order to refine or confirm the observations, profile data across the escarpments and
lobate scarps was examined. Some sample profile plots are provided in Appendix B. The
profiles show that magnetic values across El and E3 generally show variation of about 10
nT on either side of the median value. Lo bate scarp 1 and 2 (LS 1 and LS2) lack discrete
anomalies but each correlates to a change in flexure along a nearly linear trend.
Interpretation
The occurrence of a positive anomaly indicates that the corresponding feature
contains iron bearing rocks which formed during a period of normal magnetic field
polarity. Thus cones A-Hand J as well as Potter Peak are composed of normally oriented
volcanic rocks. Based on the time scale for magnetic reversals, this constrains their age
to be within the last 780 Ka or older than 1 My. The escarpments El and E3 lack a
magnetic signature both in the raw NBP observations and the corresponding anomaly
values. The anomaly signature of E2 on the map indicated a systematic drop in the
33

magnetic field value to the east of this escarpment however, profiles failed to produce
any measurable anomaly across the feature and thus the corresponding color change may
be due to the level slicing of the color scale. The profiles of LS2 show a decreasing trend
across the escarpment which has a slight change in flexure across the contact. The
absence of an anomaly in this case does not discredit the original hypothesis that these
lobate scarps are the edges of successive lava flows. It could simply be that the layer east
of the contact is also magnetic and similar in age and therefore produces analogous
anomaly values. The general decrease of anomaly values may be the result of the
changing depth of the seafloor surface.
It is well known that the McMurdo Volcanic Group has both high magnetic
susceptibility and natural remnant magnetization and produces short wavelength
magnetic anomalies of 100-1300nT (Behrendt, 1987). The cones and ridges which
proved anomalous in the Franklin Volcanic Field were expressed as anomalies of
approximately 50nT. This divergence from the expectation can be explained by the noise
of diurnal variation which remains in the data set, from the similar magnetic properties of
adjacent material, a sediment cover which obscures the natural remnant magnetization of
the features, or a combination of these and other effects.
Gravity Data
Figure 35 displays the gravity anomalies of the Franklin Volcanic Field.
Throughout the next two sections, anomalies are described as positive meaning positive
relative to the immediately adjacent values or negative, meaning negative relative to
34

r ,
r
Figure 35: Gravity anomalies of the Franklin Volcanic Field
• -59.0 - -54.0
• -53.9 - -50.9
• -50.8 - -47.3
• -47.2 - -43.2
-43.1 - -39.4
-39.3 - -35.8
• -35.7 - -32.0
• -31.9 - -28.4
• -28.3 - -25.-4
• -25.3 - -22.6
• -22.5 - -19.9
• -1 9.8 - -17.7
• -17.6--15.3
• -15.2 - -12.1
• -12.0 - -8.2
• -8.1 - -3.6 • -3.5 - 1.9
2.0 - 13.0

immediately adjacent values. The term discrete gravity high is reserved for only those
values which are framed by lower anomaly values on both sides.
Observations
Gravity anomalies are greatest along the Franklin Island Ridge and decrease to the
North and East of it. The gravity values, as depicted in 'level slices' by the color scale,
define subparallel bands across the area which trend to the northwest in the western
sector and trend NNE in the eastern sector. The high gravity values of Franklin Island
ridge itself extend out to the adjacent cones, A and B, as well as encompassing the
superimposed cones C, D, E and F. Cone G lacks a discrete gravity high but is part of the
broader high associated with Rl. Cone Hand Potter Peak are the largest discrete gravity
highs relative to their surroundings but are still negative anomalies with reference to the
geoid. The southern portion of LS2 shows some indication of increasing gravity anomaly
magnitude across the contact; however, this pattern is not seen in the North, which may
be due to the 'level slices' of the color scale. Escarpments El, E2 and E3 lack notable
signatures. Where track lines curve, there are strong variations in gravity field values
which do not correlate to seafloor features.
Interpretation
The trend of the relative positive gravity anomalies suggest an overall trend of
northwest for the magmatic bodies underlying Franklin Island Ridge whereas the
bathymetric expression trends more directly north to northeast. The overall trend of
decrease out from the ridge may correspond to a thinning of volcanic bodies overlying or
35

within the sedimentary sequence. Superimposed on the regional trend, Ridge I, cones A
H, and Potter Peak are all short wavelength positive gravity anomalies which indicate a
local concentration of relatively dense, igneous rock. The drop in gravity values across
LS2 is subtle but systematic. This change can be explained with the initial hypothesis
that the lobate scarps are the edges of lava flows. At the edge of a lava flow, the ratio of
sedimentary to volcanic rock increases causing a decrease in the local gravity field.
Furthermore, as the topography steps down, the gravity anomalies measured should also
step down due to the increased distance between the seafloor and the ship which is filled
by low density saltwater. If the units are of significantly different density, the step will be
large. In the case of overlapping lava flows, each of basaltic composition, it is expected
that the step is decidedly smaller and depends only on the changing depth of the bodies.
The anomalous gravity values coincident with sharp ship turns suggest that the EOTVOS
correction is incomplete and that the anomaly values on the turns are due to the changing
orientation of the ship and not geological bodies.
Seismic Data
Observations
The NBP 04-01 expedition produced four parallel seismic tracks across the
northern part of the Franklin Volcanic Field. In addition, an earlier survey reported by
Cooper et al. (1987) provides two additional seismic lines, one just North of Franklin
Island and the other trending southeast through Potter Peak. Figure 36 shows the location
and subsurface expression of prominent seismic features in the Franklin Volcanic Field.
36

c::::::111111111112:::::;::::::::::::::_~. :::::::::::::::::::::; ... :::::::::: ... ;:::::::::;;:: ... :::::::::::::;: ... ~ .... ~ .... ~ ... ~ .... ~ •• 10 140 - -

The three bathymetrically defined terrains show a strong degree of contrast in the
seismic sections. Common features observed on the seismic lines in the region include
an unconformable surface between the gently dipping reflectors of the substrate and the
bright near-surface reflectors, vertical zones of blurred and/or arched reflections which
are interpreted as igneous intrusive bodies, and steeply dipping lines or linear zones of
truncation and offset of reflectors, interpreted as faults.
The regional pattern of reflectors across the Franklin Volcanic Field defines a
broad syncline in sedimentary basin strata. In the west, east-dipping strata are truncated
and overlain by subhorizontal layers, whereas in the east the west-dipping strata of the
syncline are truncated at the seafloor. Along the Franklin Island ridge there is a
superimposed central arch overlying the broad syncline. Layers which comprise the arch
dip and thin away from the central axis suggesting that it has been built up by successive
volcanic intrusions.
Western Hummocky terrain
The substrate of the hummocky terrain consists of subhorizontal or gently east
dipping planar reflectors. The surface is marked by sparse depressions under which the
reflectors on either side are downwarped toward the center of the depression and the
uppermost reflector thickens at the base. Near the northern limit of the western terrain, in
the area labeled Area A, there is a broad, steep-sided zone of near-complete disruption of
reflectors. This feature lacks surface expression. Inside this feature, near the surface,
linear zones of possible reflections or diffractions dip steeply into the zone. To the south,
37

in the same region, there are two closely spaced features which also have steep sided
contacts and internal zones with strongly arched reflectors.
Central Volcanic terrain
Lines 112, 141, 142, 143 and 408 transect the curvilinear escarpments (El, E2
and E3) which extend the length of the northern FVF. Due to the current state of data
processing, their subsurface character is obscure on lines 141, 142 and 143. On line 142,
a narrow zone that has sharp boundaries and is associated with abrupt dip changes of
reflectors is co-located with E2. Line 112 shows minimal evidence of El and E2 on
surface topography and in cross section. Line 408 shows a zone of closely spaced offsets
just east of Potter Peak that appear to coincide with the branches of the El escarpment,
and a plane with offset and truncation which correlates with the E3 escarpment.
Zones of closely spaced, steeply dipping lines of truncation and offset can be
observed on lines 141 and 142. The western margin of these zones is an east dipping line
which shows truncation and down-to-the-east offset of reflectors. The eastern margin of
these zones dips steeply west and has down-to-the-west offset of reflectors. In between
the zone boundaries, reflector geometry is irregular.
Cone H is underlain by a broad zone with nearly vertical contacts surrounding
near completely disrupted reflectors. Reflectors immediately adjacent to the contacts dip
steeply away from the zone. Within the zone, bright reflectors dip toward the center.
Escarpment LS 1, which shows some topographic linkage with Cone H, is underlain by a
narrow zone of arched reflectors, seen on profile 111.
38

Near the border between the volcanic and lineated terrains there is a sharp line of
offset and truncation of reflectors along profiles 142 and 110 with strata displaced down
to the east. The offset and truncation observed in these sections is not evident on lines
141 and 112 therefore this feature has limited lateral extent.
Eastern Lineated terrain
The lineated terrain has an irregular surface topography consisting of low relief
ridges and grooves. In the north, the subsurface reflectors are gently west dipping and
uninterrupted. Although not distinctive bathymetrically, Area B shows a zone that is
either characterized by disrupted or strongly arched reflectors on lines 141, 142, and 408.
Reflectors adjacent to the contacts dip steeply away from the zone margins. Correlation
of this feature between the seismic lines indicates it has a northeast trend. Projection of
this trend southwestward intersects line 407 where a similar, but less well defined, zone
occurs. The top of the zone of arched reflectors reaches the surface and is truncated by a
plane of ridge and groove morphology much like the areas to the north.
Interpretation
Based on examples from Bally (1983), steep sided zones in which reflectors are
strongly disrupted and/or arched upward are common signatures of intrusive bodies.
Normal faults are indicated by steeply dipping lines or zones of truncation and offset.
Using the seismic expressions of these features as analogues, the following hypotheses
were formed.
39

Western hummocky terrain
The dip of surf ace reflectors into the depressions suggests either downward
collapse or deposition over an existing low point. The thickening of the unit that
underlies the base of the depression points to localized deposition in a depression. These
are probably glacial depositional features, presumably associated with retreat of grounded
ice from the region.
The broad, near vertical disruptions or reflectors are interpreted as dike intrusions.
The two steep arched features of line 142 are two dikes and a broader dike intrusion is
interpreted on line 143.
Central volcanic terrain
The layered arch along the axis of the Franklin Volcanic Field is interpreted to be
constructed of extrusive volcanic layers. Along line 407 (Cooper et al, 1987) there is a
broad, near vertical intrusion corresponding to the location of Franklin Island ridge
(Figure 37). This is presumably part of the main feeder system for the volcanic field. In
addition to the magmatic body under the main ridge, line 407 shows dike intrusions are
vertical feeders below volcanic cones D and E. Both line 407 and Line 141 show a
narrow dike-like body below ridge Rl, just east of the Franklin Island ridge axis. This
intrusion supports the previous hypothesis that this ridge is the result of magmatic
intrusion and that its flanking lobate morphology is due to extrusive lava flows.
The geometry and offset seen in the zone of truncation and offset on lines 141 and
142 is typical of a graben downdropped between normal faults, a tectonic structure
typical of extensional settings. The boundaries of this feature are indicative of faulting
40

West East
FIR r
Figure 37: Volcanic intrusions of seismic line SP Lee 407 (Cooper et al. , 1987)

whereas the disruption of strata implicates a magmatic origin. Although some seismic
lines are shifted from their true location, the positive relief of R2 can be observed on the
seismic lines and does not correlate with the graben.
The subsurface structure below escarpments El, E2 and E3 is difficult to observe
on most seismic sections. The underlying strata are in fact disturbed but the nature of
that disturbance is difficult to discern, and could mark faults or intrusive bodies.
However, the fact that there is subsurface expression does suggest that the features are
not formed by glacial erosion. Line 408 best displays the cross sectional view, showing
three closely spaced truncations which correlate to the Ela, Elb and Elc branches and an
additional truncation at E3 (Figure 38). The truncated geometry points to faults with
normal displacement underlying the El scarps. Based on their close association in trend
and morphology, all the escarpments appear to most likely be normal faults.
Cone H is volcanic in origin, and is underlain by a dike intrusion. The apparent
dip of internal reflectors may be an indication that there is a cap on the surface of the
intrusion which is harder than the surrounding lithology.
LS 1 sits halfway between the edge of the E3 escarpments and lobate escarpments
defining the margins of the central terrain as defined here. Its origin was in question
because of its intermediate location, orientation and morphology in comparison to
escarpments on either side. In the seismic section, LS 1 is underlain by a volcanic
intrusion which is much wider than the scarp itself. This intrusion points to a more ridge
like geometry for the escarpment which is not well defined bathymetrically.
The eastern margin of the volcanic terrain (vicinity of LS2), was preliminarily
interpreted as the edges of successive lava flows. This region shows a stair case pattern in
41

Fig
ure
38:
US
GS
Sei
smic
Lin
e 4
08
(C
oo
pe
r et
al.
, 19
87)
Pot
ter
Pea
k in
trus
ion~ r;;:
~ ~
-.,,
,~.
Sur
face
esc
arpm
ents
ar
e th
e br
anch
es o
f E 1
)

cross section on the seismic profiles. Along line 141, the staircase 'steps' occur where
west-dipping layers intersect the seafloor. This is compatible with the lobate escarpments
marking the margins of lava flows, although some erosional truncation of the volcanic
layers may also have occurred.
Eastern Lineated terrain
The overall ridge and groove morphology points to erosional processes.
Individual ridges and grooves appear to lack any associated subsurface structure, which is
consistent with their formation by glacial erosion of the seafloor. Area B has either the
disrupted reflectors or the arched reflector geometry which is commonly seen in volcanic
intrusions. The truncation of the arch at the surface is an indication that post depositional
erosion leveled off this feature. Thus the current surface morphology is a combination of
volcanic and glacial processes.
42

Discussion
Combining the observations made in the magnetic, gravity and seismic data sets
the features can be divided into three classes of different origin. The class of volcanic
features includes the FIR, cones A-J, Rl, R2, the lobate scarps (LSI, LS2 and LS3) as
well as the intrusive bodies under Area A and Area B. The most likely interpretation for
the long escarpments, El including its branches, E2 and E3 is that they are tectonically
formed normal faults with displacement down to the east. The glacial features include
the surfaces depressions of the western hummocky terrain, the ridge and groove
morphology of the eastern lineated terrain and the ice berg scours throughout the central
volcanic terrain. The classification of these features is depicted spatially in Figure 39.
Within the each class of origin, the trends of surface and subsurface features can
be mapped. Surface features are mapped by lateral continuity whereas subsurface
features, such as the intrusion under Area A, are mapped by correlation between seismic
lines or consistent trends in both the seismic and bathymetric data. The map reveals two
volcanic trends. The northeast orientation is expressed on the surface by the Franklin
Island ridge, the curvilinear escarpments and the elongation of cones B and C. In the
subsurface, this trend is paralleled by the intrusions under Area A and Area B. The
northwest trend is expressed on the surface by ridges Rl, R2 and R3; cones Hand J; and
the elongate crater of cone F. The number of associated features and greater continuity of
the northeast trend suggest it is the primary trend of the Franklin Volcanic Field. A radial
pattern, which is commonly associated with large magma conduits, is not observed in the
cones near Franklin Island, indicating that the regional stress field was stronger than the
magmatic pressure built up by the intrusives.
43

Figure 39: Features of the Franklin Volcanic Field distinguished by . . origin
( Subsurface ,, .. ,,, Y.~_lcan ~c\t
.......
I i / ..
--- '""'-
••••••·•·•••·••·· '"'9T-ei~uct --------• . .. "' ...
,, ....
"\ Subsurface
.. ....
... ... ... ... ... ... , ..

The bathymetric and seismic superposition of the cones suggests that they formed
at a later date than the ridge on which they sit. The subsurface dikes, which may be
feeders for the cones or sources of the local lava flows, may be either coeval or younger
than the FIR. The El, E2 and E3 escarpments cross cut features of volcanic origin,
including cone H and R2, pointing to a younger age for the tectonic features. However,
there is also evidence that lava flows of RI and FIR may overly the escarpments. The
fault observed on seismic line 110 cross cuts substrate reflectors but appears to be
truncated by the bright surface reflectors which are currently interpreted as lava flows.
This indicates that this fault preceded the extrusion of the most recent lava flow which is
defined by the LS2 escarpment. Given that the volcanic and tectonic features show
evidence of temporal overlap, it is reasonable to consider them two modes of response to
the same stress regime. The regional occurrence of two volcanic trends suggests that one
of the trends is either controlled by pre-existing structure or formed by a different stress
regime acting at a different period of time.
Glacial flow reconstruction
The frequency and regular spacing of the lineations of the eastern lineated terrain
suggests they formed in the direction of ice sheet movement. The ridge and groove fabric
trends approximately 25 degrees east of North. Although the measure of lateral continuity
is limited by the extent of the mapped region, the features may be additional mega-scale
glacial lineations like those mapped throughout the Ross Sea by Shipp et al. (1999).
These lineations form as soft sediment is deformed at the basal contact of a grounded ice
44

sheet and parallel the direction of ice flow. Figure 40 compares the local flow direction
observed in the eastern lineated terrain with regionally mapped patterns.
The features of the western hummocky terrain lack an indication of glacial flow
direction. However, they support the current reconstruction which calls for a grounded
ice sheet throughout the embayment during the Last Glacial Maximum.
Stress reconstruction
Based on the geometry of the FIR and trend of the escarpments, it is concluded
that the length of these features parallels the maximum horizontal stress whereas the
underlying feeder system has opened perpendicular to the long axis and parallels the
minimum horizontal stress. The observation of faults in the seismic profiles constrains
the magnitude of the third, vertical stress direction which is perpendicular to the surface
'Of the Earth. According to Anderson's theory of faulting, the normal displacement along
the curvilinear escarpments formed in response to the maximum principal stress, S 1,
being oriented vertically while the direction of downdropping points to extension, in
response to S3, in the east-west direction. Thus, in the Franklin Volcanic Field, S2, the
intermediate compressive stress is oriented 11 degrees east of North, with S3
perpendicular in the horizontal plane and S 1 perpendicular in the vertical dimension
(Figure 41).
45

)
, ·~
, F
igur
e 4
0:
~ ) L
----
Ro
ss I
ce S
hel
f
Loca
l ic
e flo
w
dir
ect
ion
s a
s in
dic
ate
d b
y 25
Ea
st o
f N
orth
tr
end
of t
he
ea
ster
n lin
eate
d te
rrai
n


Conclusions
• Franklin Island is the surface expression of a submarine volcanic field which
trends roughly north-south for at least 80km and east-west for at least 40km
• The field is divided into three morphologically defined terrains, the western
hummocky terrain of glacial origin, the central volcanic terrain, and the eastern
lineated terrain, also of glacial origin.
• The Franklin Island ridge formed during multiple phases of volcanic intrusion,
producing a prominent ridge with superimposed volcanic cones
• The ridge is cut by parallel normal faults which are either coeval or post date
volcanic activity as indicated by the cross cutting relationships with Cone H and
Ridge 1.
• The axis of the Franklin Island ridge parallels the maximum horizontal stress,
trending -11 degrees east of North, and is perpendicular to the least compressive
stress. The maximum principal stress, S 1, is vertical.
• An additional volcanic trend observed in the regional bathymetry is oriented -30
degrees west of North.
• Glacial lineations indicate a local ice flow trend -25 degrees east of North
46

References
Anderson, John B., 1999. Antarctic Marine Geology Cambridge University Press, New York pp. 29, 65-70, 241
ANTOSTRAT Project, 1995. Seismic stratigraphic atlas of the Ross Sea, Antarctica. In: A.K. Cooper, P.F. Barker, and G. Brancolini (Editors), Geology and Seismic Stratigraphy of the Antarctic Margin. American Geophysical Union, Antarctic Research Series, 68: Plates.
Bally, A.W. (editor) 1983, Seismic expression of structural styles: A picture work atlas Vol. 1. The American Association of Petroleum Geologists
Barrett P.J., Henrys S., Bartek L.R., Brancolini G., Busetti M., Davey F.J., Hannah M.J. & Pyne A.R., 1995. Geology of the margin of the Victoria Land basin off Cape Roberts, southwest Ross Sea. In: Cooper A.K., Barker P.F. & Brancolini G. (eds.), Geology and Seismic Stratigraphy of the Antarctic Margin, Antarctic Research Series, 68 AGU, Washington, 183-208.
Cape Roberts Science Team, 1999. Studies from the Cape Roberts Project, Ross Sea, Antarctica - Initial Report on CRP-2/2A. Terra Antarct., vol. 6, p. 1-173.
Chiappini, M., Ferraccioli, F., Bozzo, E., Damaske, D., 2001. Geomagnetic investigations and regional aeromagnectic anomaly map over the Transantarctic Mountains - Ross Sea sector of the Antarctic. Tectonophysics
Cooper, A.K., Davey, F.J. and Behrendt, J.C. 1987. Seismic stratigraphy and structure of the Victoria Land Basin, Western Ross Sea, Antarctica. in Cooper, A.K. and Davey, F.J. The Antarctic Continental Margin: Geology and Geophysics of the Western Ross Sea. CPCEMR, Sb, Houston, Texas. p27-77.
Cooper, A.K., Davey, F.J., Behrendt, J.C. 1987. Seismic Stratigraphy and Structure of the Victoria Land Basin, Western Ross Sea, Antarctica in The Antarctic Continenetal Margin: Geology and Geophysics of the Western Ross Sea, CPCEMR Earth Science Series, v. 5b pp. 27-76
Davey, F.J. And Brancolini, G., 1995. The Late Mesozoic and Cenozoic structural setting of the Ross Sea Region. In: A.K. Cooper, P.F. Barker and G. Brancolini (Editors), Geology and seismic stratigraphy of the Antarctic Margin, Antarct. Res. Ser., AGU, Washington D.C., vol. 68, p.167-183.
Dalziel, I.W.D. and Elliot, D.H., 1982. West Antarctica: Problem child of . Gondwanaland. Tectonics, 1: 3-19.
47

Fitzgerald, P., 2002. Tectonics and landscape evolution of the Antarctic Plate since the breakup of Gonwana, with an emphasis on the West Antarctic Rift System and the Transantarctic Mountains. Royal Society of New Zealand Bulletin 35: 2002, pp453-469
Hambrey, M., 1994. Glacial Environments. UVC Press, Vanvouver. pp. 81-109
Kearey, P., and Brooks, M., 1984. An Introduction to Geophysical Exploration Sec Ed. Blackwell Scientific Publications. Ch 7 pp. 148-171
Kyle, P.R., 1990. McMurdo Volcanic Group, western Ross Embayment: Introduction, in LeMasurier, W.E. and J. W. Thomson, (eds.), Volcanoes of the Antarctic Plate and southern Oceans. AGU Antarctic Res. Ser., vol. 48, p. 19-25.
Kyle, P.R. 1990. The Erebus Volcanic Province. in LeMasurier W.E. and Thomson, J.W. (eds) 1990.Volcanoes of the Antarctic Plate and Southern Oceans. Washington D.C. American Geophysical Union. p81-88.
Kyle, P.R., 1990. Chapter A.13 Franklin Island in LeMasurier, W.E. and J. W. Thomson, (eds.), Volcanoes of the Antarctic Plate and southern Oceans. AGU Antarctic Res. Ser., vol. 48, p. 91-93.
McClay, Ken, 1987. The Mapping of Geologic Structures. John Wiley and Sons Publishers New York, 161 pp.
Musset, A.E., and Khan, M. A., 2000. Looking into the Earth: An introduction to geological geophysics. Cambridge University Press, New York, 470 p
Nakamura, Kazuaki., 1977. Volcanoes as possible indicators of tectonic stress orientation- principal and proposal. Journal of Volcanology and Geothermal Research., vol 2: 1-16
Park, R. G., 1989. Foundations of Structural Geology. Chapman and Hall, New York, 148 pp.
Rocchi, S, Armieti, P, D'Orazio, M., Tonarini, S., Wijbrans, J. R., Di Vincenzo, G. 2002 Cenozoic magmatism in the western Ross Embayment: Role of mantle plume versus plate dynamics in the development of the West Antarctic Rift System. Journal of Geophysical Research, Vol. 107 No B9, 2195
Salvini, F., and Storti, F., 1999, Cenozoic tectonic lineaments of the Terra Nova Bay region, Ross Embayment, Antarctica. Global and Planetary Change, 23: 129-144.
Shipp, S.S. and Anderson, J.B., 1997. Lineations on the Ross Sea Continental Shelf, Antarctica in Glaciated Continental Margins: an Atlas of Acoustic Images. Davies, T.A editor. Chapman and Hall. London 315 p.
48

Shipp, S.S. and Anderson, J.B., 1999.Late Pleistocene-Holocene retreat of the West Antarctic Ice-Sheet system in the Ross Sea: Part 1-Geophysical result. Geological Society of America Bulletin vol. 111, no 10. pp.1486-1516
Suppe, J., 1985. Principals of Structural Geology. Prentice-Hall Inc. Englewood Cliffs, New Jersey. 537 p.: ill.; 29 cm
Verosub, K.L., 2000. Paleomagnetic Dating in Quaternary Geochronology: Methods and Applications. Noller, J.S., Sowers, J.M. and Lettis, W.R. (editors) American Geophysical Union
Wellner, J., Lowes, A.S., Shippe, S.S. and Anderson, J.B., 2001. Distribution of glacial geomorphic features on the Antarctic Continental shelf and correlation with substrate: implications for ice behavior. Journal of Glaciology, vol 47, No158 pp.397-411
49

Appendix A: Relevant Time scales

Geologic time scale for the Phanerozoic
Era Perio r- Period 0 u
20 0 Ou11trna1y
N "' 0 c 34 1 8 Q> c: g
s~ Cl> Neooene PllOCllll () .!!
60 .,,
Pl octnt Q.. 5.3 65 \
Upper \ .. \ ::i I 0 100 Cl> 99 \
u
\ ~ • (.)
()
140 0 142 N Upper 0 (/') u 159 Cl> ·;;;
Mlddlt ~
.. 180 ~ 180 :> ....
206
220 u Upper -;;; .., 227 "' Mlcldlt I ;: ..... 242 Present 0
248 260 c: 256
-;;;- .,, ~ 5'5
::::i: ......... "' 0.. Q) 290
I E F= 300 "' Upper
::i 0 (Pennsylvanian) Proterozoic i I c I 0 I J:>
340 ;; (.)
354 -C1'
2500 ~ u 370 -c: .. Cl)
380 0 -c: E N 0
0 > 391 ~ • Cl> 0 Archaean n:s
I co 417 420 a.. 423 I 443 I -4000
c Upper I Hade an 460 .,, -458/ ·;:; Middle _ 470 Formation > 4550 0 of Earth "t:I
0 495
c sOS !!! I .D - 518 E I .,, Lower (.)
540 545

2.60
3.0 Kaena Gauss Mammoth
3.55
4.0 Cochiti Nunivak
Gilbert Sidufjall 5.0 Thvera
5.70 ___ ._ _______ _.
Magnetic polarity time scale. Periods of normal polarity are shaded. (Noller et al., 2000)

Appendix B: Magnetic Data Addendum

Magnetic profiles over Cone H
63940.0 ...-----------------------------.,
63920.0 -1----------- ------------- -----i
~ 63900.0 -!------- ------------ -- 1-------1-c :; 63880.0 1--------oi...'='"'-..:---- -=:----------Qj ir 63860.0 +-----------~ ~~----(.)
"f; 63840.0 -1-----------------'~----H+t------c Cl ~ 63820.0 +----------.......:::=--..=:::::::::::::--~--'--f--r=-...~-
63800.0 l----------------='---'~-J---\--
63780.0 -l----~-----....---...------.,..----r----r----.,......------!
>-
168.40 168.50 168.60 168.70 168.80 168.90 169.00 169.10 169.20 169.30
Longitude (degrees East)
l-N1 - N2 1 Profiles along lines N1 and N2 show a relative anomaly of 50 nT to 70 nT over cone H. Note contrast to profiles for scarps.
Magnetic anomaly profiles over cone H
0.00 ~----~--~--~--....--~---r----.---~
16 .40 168.50 168.60 168.70 168.80 168.90 169.00 169.10 169.20 16 .30 -10.00 +------------------i---------f
~ -30.00 0 c ~ -40.00 -·1-------------------f .. Cl)
c g> -50.00 +-------------~----:E
-70.00 ~------------------------
l_ Longitude (deg East)
l-N1 - N2 1 Corresponding magnetic anomaly profiles over the same cone. The absence of a relative anomaly in the N2 anomaly values is suspect.

Magnetic profiles over LS1
63840.0 ~-----------------------.
i=' 63800.0 +----------------------; c - -+-N6 ~ 63780.0 +------
~ -------------- --- N9
.~ 63760.0 +----------------G> c g> 63740.0 +-----------------~ . __..---.
63720.0 -+-------·--·--·-~·~·~-·-63700.0 +-- --...,.----.---...,...------.,---...,...----...,.---;
169.08 169.10 169.12 169.14 169.16 169.18 169.20 169.22 169.24
Longitude (degrees East)
Profiles over LS1 with location of the scarp marked by black boxes.
There is a slight change in flexure observed on 3 of the 4 profiles.
Magnetic profiles over LS2
63860.0 ...-------------------- -------
63840.0 -i-----------------'---=-...=:m:a=-----i
N14
N15
63820.0 -t-------- -----------------< • - --1-
.s 63800.0 -r----....,.----------------------t ,, Qi ;o:: 63780.0 -1-------- ----'"""""'=---_:_;:"""9.=-------l u
~ 63760.0 +----------~ Cl ca
::!: 63740.0 -r----------------.·=---------1
63720.0 +--------------------== --------!
63700.0 +--- -...-----.--------...-----.-----------l 169.22 169.24 169.26 169.28 169.30 169.32 169.34 169.36 169.38 169.40 169.42
Longitude
Profiles over LS2 with location of scarp marked in black. 3 of 5 lines
show a small change in flexure at the location of the scarp.
-+-N9
--- N14
N15
N17
~N18

Magnetic profiles over E2
63740.0 ~------------------------.
63730.0 -1----~ '----------------------;
I=' 63710.0 -1---------------------------i c -
63670.0 -·1-----------__,,,.-------- ------1
63660.0 -·l-------------___:.- -----------1
63650.0 +-------------,-----~----.-----.---~
168.62 168.64 168.66 168.68 168.70 168.72 168.74 168.76 168.78
Longitude of NBP
Magnetic anomaly profiles over E2 J
0 -.---..,----...----...--- -..,----...----,..---,.-----,
1 .62 168.64 168.66 168.68 168.70 168.72 168.74 168.76 16 .78
-20 -+-------
-40 +--------------------------l
-140 -t---------------------------1 -160 _,__ _____ _________________ __.
Longitude
~N23
--- N24
N27
l -+-N23
- N24
N27
_J
Both magnetic and magnetic anomaly profiles over the E2 escarpment lack evidence of a discrete anomaly.

I Magnetic profiles over E1
p 63780.0 c:: -~ 63760.0 :;
63660.0 +--------~-----.,.--------------1
168.60 168.65 168.70 168.75
Longitude
168.80 168.85 168.90
Magnetic profiles across escarpment E1 at varying latitudes. No anomalies are observed.
Magnetic profiles over E3 I
63815.0 ,.----------------------,
63810.0 +-------------------------"
63805.0 -1------------------------l
p 63800.0 +-------------------------l c: :;;- 63795.0 +-----------4~----..---=---------J
£ 63790.0 +-------------2 --~----------1 .~ 63785.0 +-----------" a; §, 63780.0
~ 63775.0 -t-------------- ---=--'---------!
63770.0 _,____ _____ --- --------------! • 63765.0 +------------------------"
63760.0 +-------,----..--------.-----.,-----.,.------i
168.90 168.95 169.00 169.05
Longitude
169.10 169.15 169.20
r Magnetic profiles with the location of the E3 escarpment in black. Note that variations are only on the order of 15 nT as opposed to the 50nT anomaly seen at cone H.
-+-N15
--N16
N18
N19
--N21
-+-N3
~N4
NS N9