Embed Size (px)
Citation preview
Technical Report Documentation Page 1. Report No. FHWA/TX-11/0-5377-1
2. Government Accession No.
3. Recipient's Catalog No.
4. Title and Subtitle GEOMETRIC DESIGN AND OPERATIONAL FACTORS THAT IMPACT TRUCK USE OF TOLL ROADS
5. Report Date February 2010 Published: September 2010 6. Performing Organization Code
7. Author(s) Christopher Poe
8. Performing Organization Report No. Report 0-5377-1
9. Performing Organization Name and Address Texas Transportation Institute The Texas A&M University System College Station, Texas 77843-3135
10. Work Unit No. (TRAIS) 11. Contract or Grant No. Project 0-5377
12. Sponsoring Agency Name and Address Texas Department of Transportation Research and Technology Implementation Office P.O. Box 5080 Austin, Texas 78763-5080
13. Type of Report and Period Covered Technical Report: September 2006–August 2008 14. Sponsoring Agency Code
15. Supplementary Notes Project performed in cooperation with the Texas Department of Transportation and the Federal Highway Administration. Project Title: Operational Factors that Impact Truck Use of Toll Roads URL: http://tti.tamu.edu/documents/0-5377-1.pdf 16. Abstract This purpose of this project was to identify the potential factors that could impact truck use of toll roads or managed lanes. The researchers outlined the trucking and freight industry needs through synthesis of existing literature. Identification of geometric and operating factors that are important to truck drivers and operators in terms of safety and efficiency will better characterize what makes toll roads attractive to those users. The factors are organized around industry needs (e.g., safety, travel reliability), facility design characteristics (e.g., access, ramp design, system connectivity), operating characteristics (e.g., signing and pavement markings), and corridor operating characteristics (e.g., traffic, congestion). The research resulted in published guidelines to help transportation planners, highway designers, and transportation operations professionals determine the geometric design and operational factors important to attract the trucking and freight industry to toll roads. The research was done through known relationships of design, safety, and operations. 17. Key Words Geometric Design, Highway Operations, Truck Operations, Toll Roads
18. Distribution Statement No restrictions. This document is available to the public through NTIS: National Technical Information Service Springfield, Virginia 22161 http://www.ntis.gov
19. Security Classif.(of this report) Unclassified
20. Security Classif.(of this page) Unclassified
21. No. of Pages 78
22. Price
Form DOT F 1700.7 (8-72) Repr oduction of completed page authorized


GEOMETRIC DESIGN AND OPERATIONAL FACTORS THAT IMPACT TRUCK USE OF TOLL ROADS
by
Christopher Poe, PhD, P.E. Senior Research Engineer
Texas Transportation Institute
Report 0-5377-1 Project 0-5377
Project Title: Operational Factors that Impact Truck Use of Toll Roads
Performed in cooperation with the Texas Department of Transportation
and the Federal Highway Administration
February 2010 Published: September 2010
TEXAS TRANSPORTATION INSTITUTE The Texas A&M University System College Station, Texas 77843-3135

v
DISCLAIMER
This research was performed in cooperation with the Texas Department of Transportation
(TxDOT) and the Federal Highway Administration (FHWA). The contents of this report reflect
the views of the authors, who are responsible for the facts and the accuracy of the data presented
herein. The contents do not necessarily reflect the official view or policies of the FHWA or
TxDOT. This report does not constitute a standard, specification, or regulation. This report is
not intended for construction, bidding, or permit purposes. The engineer in charge of the project
was Christopher Poe, PhD, P.E. #70345.
vi
ACKNOWLEDGMENTS
This project was conducted in cooperation with TxDOT and FHWA. Thanks and
appreciation is extended to the project coordinator, project director, members of the project
monitoring committee, and the staff at the TxDOT Research and Technology Implementation
Office.
Program Coordinator
Bob Daigh, P.E., Austin District, TxDOT
Project Director
Bubba Needham, P.E., Austin District, TxDOT
Technical Panel
Ron Fagan, Central Texas Regional Mobility Authority
Clayton Howe, North Texas Tollway Authority
Catherine Sanchez, Texas Turnpike Authority Division, TxDOT
Wade Odell, P.E., Research and Technology Implementation Office, TxDOT
The author would also like to extend special thanks to Dr. Beverley Kuhn, P.E., for her
assistance with information on active traffic management, Dr. Dan Middleton and Dr. Jodi
Carson for assistance with the literature review, and Ms. Kristine Miller for her assistance in
production of the report. In addition, the author would like to thank the American Association of
State Highway and Transportation offices for the use of exhibits from “A Policy on Geometric
Design and of Highways and Streets,” Copyright 2004, by the American Association of State
Highway and Transportation Officials, Washington, D.C. The exhibits are used by permission.
Documents may be purchased from the AASHTO bookstore at 1-800-231-3475 or online at
http://bookstore.transportation.org.
vii
TABLE OF CONTENTS
Page List of Figures ............................................................................................................................... ix List of Tables ................................................................................................................................. x CHAPTER 1: INTRODUCTION ................................................................................................ 1
Problem Description ................................................................................................................... 1 Purpose of Research .................................................................................................................... 2 Research Methodology ............................................................................................................... 2
CHAPTER 2: LITERATURE REVIEW.................................................................................... 5 Facility Geometric Design Characteristics ................................................................................. 5
Accommodating Trucks on Highways: State Department of Transportation Reviews .......... 8 Corridor Operational Characteristics ........................................................................................ 10
Washington ........................................................................................................................... 11 California .............................................................................................................................. 12 Florida ................................................................................................................................... 13 Georgia .................................................................................................................................. 13
Industry Characteristics ............................................................................................................ 15 Summary ................................................................................................................................... 20
CHAPTER 3: SURVEYS OF TRUCKING INDUSTRY ........................................................ 21 Summary ................................................................................................................................... 24
CHAPTER 4: GEOMETRIC DESIGN FACTORS ................................................................ 25 TxDOT Roadway Design Manual ............................................................................................ 26
Freeways ............................................................................................................................... 26 Mobility Corridors ................................................................................................................ 26
AASHTO Policy on Geometric Design of Highways and Streets ............................................ 26 Basic Design Criteria ................................................................................................................ 27
Design Speed ........................................................................................................................ 27 Design Vehicles .................................................................................................................... 28 Stopping Sight Distance ........................................................................................................ 29
Horizontal Alignment ............................................................................................................... 31 Curve Widening in Horizontal Curve Design ....................................................................... 31 Reverse Curve Design ........................................................................................................... 32
Vertical Alignment ................................................................................................................... 33 Grades ................................................................................................................................... 33 Vertical Curve Design ........................................................................................................... 35
Cross Section ............................................................................................................................ 36 Lane Widths .......................................................................................................................... 36 Shoulder Widths .................................................................................................................... 36
Ramps and Interchanges ........................................................................................................... 36 Entrance Ramps near Upgrades ............................................................................................ 39
Rural Toll Roads ....................................................................................................................... 39 Connecting Facilities ................................................................................................................ 40
Intersections .......................................................................................................................... 40 Rest Area Parking ................................................................................................................. 41

viii
CHAPTER 5: TRAFFIC OPERATIONS/ENGINEERING FACTORS ............................... 43 Design for Operational Analysis ............................................................................................... 43 Signing ...................................................................................................................................... 43 Roadway Delineation ................................................................................................................ 45
Rumble Strips........................................................................................................................ 45 CHAPTER 6: CORRIDOR OPERATION FACTORS .......................................................... 47
Automatic Vehicle Identification .............................................................................................. 47 Intelligent Transportation Systems ........................................................................................... 48
Active Curve Warning System for Trucks............................................................................ 48 Incident Management ............................................................................................................ 49
Active Traffic Management ...................................................................................................... 50 Speed Harmonization/Speed Management ........................................................................... 50 Queue Warning ..................................................................................................................... 51 Temporary Shoulder Use and Speed Harmonization ............................................................ 52 Dynamic Lane Assignment ................................................................................................... 53
CHAPTER 7: CONCLUSIONS AND RECOMMENDATIONS ........................................... 55 Geometric Design Recommendations ...................................................................................... 56 Traffic Operation Recommendations ........................................................................................ 56 System and ITS Recommendations .......................................................................................... 57 Further Research Needs ............................................................................................................ 57
CHAPTER 8: REFERENCES ................................................................................................... 59 Report References ..................................................................................................................... 59 Bibliography of Additional References .................................................................................... 62
APPENDIX: SUGGESTED TRUCK SURVEY ON GEOMETRIC DESIGN FACTORS .......................................................................................................................... 65

ix
LIST OF FIGURES
Page Figure 1. HOV/Managed Lane Projects Using Reduced Design Values (30). ............................. 25 Figure 2. Minimum Turning Path for Interstate Semitrailer – WB-67 (29). ................................ 29 Figure 3. Speed-Distance Curves for Heavy Truck on Upgrades (200 lb/hp) (29). ..................... 34 Figure 4. Speed-Distance Curves for Heavy Truck on Downgrades (200 lb/hp) (29). ................ 34 Figure 5. Minimum Deceleration Lengths for Exit Terminals (28).............................................. 38 Figure 6. Minimum Acceleration Lengths for Entrance Terminals (28). ..................................... 38 Figure 7. Dual Speed Warning Sign for Trucks – Gantry Mounted. ............................................ 44 Figure 8. Dual Speed Warning Signs for Trucks – Ground Mounted. ......................................... 44 Figure 9. Example of Longitudinal Rumble Strips (41). .............................................................. 45 Figure 10. Curve Warning Barrier Markings. ............................................................................... 46 Figure 11. Example of Automatic Vehicle Identification (42). .................................................... 48 Figure 12. Active Curve Warning System. ................................................................................... 49

x
LIST OF TABLES
Page Table 1. Summary Profile of Motor Carriers Interviewed. ........................................................... 20 Table 2. Truck Braking Distance on Wet Pavement. .................................................................... 30 Table 3. Stopping Sight Distance on Grades (29)......................................................................... 31 Table 4. Traveled Way Widening on Horizontal Curves (adapted from 29). ............................... 32 Table 5. Minimum Crest and Sag Vertical Curve Lengths. .......................................................... 35 Table 6. Recommended Length and Spacing for Passing Lanes for Rural Toll Roads (38). ....... 39 Table 7. Recommended Gap Times for Intersection Sight Distance – Right Turn and Crossing
Major Road from Stop Control (Case B2 and B3) (29). ....................................................... 40 Table 8. Recommended Gap Times for Intersection Sight Distance – Turning Left from Stop
Control (Case B1) (29).......................................................................................................... 41

1
CHAPTER 1: INTRODUCTION
PROBLEM DESCRIPTION
Texas has approximately 300 miles of toll roads, predominantly in the three largest and
most congested urban areas of Austin, Dallas, and Houston. The Texas Turnpike Authority
(TTA) Division of the Texas Department of Transportation (TxDOT) and the Central Texas
Regional Mobility Authority are developing a substantial toll road network in the Austin area.
The North Texas Tollway Authority and the Harris County Toll Road Authority are responsible
for the toll road systems in the Dallas/Fort Worth and Houston areas. Both of these agencies
have new expansion projects under development in their areas. TTA also operates a toll road on
SH 49 in Tyler, Texas, in a more rural environment of east Texas. Additional toll road and
managed lane projects are in development by TxDOT through comprehensive development
agreements in the Dallas/Fort Worth and Austin/San Antonio areas.
At the same time, the freight and trucking industry are growing at an increasing rate. The
vehicle miles of truck travel have increased 216 percent since 1970, whereas overall vehicle
miles of travel have only increased 137 percent in the same time (1). Of all goods moving,
90 percent measured by value are moved by truck (2). Truck safety is also a concern. According
to 2007 data from the Federal Motor Carrier Safety Administration, Texas leads the nation in the
number of fatal crashes involving large trucks with 421 crashes (large trucks defined as gross
vehicle weight exceeding 10,000 lb) (3). Because of Texas’ size and significant trucking
industry, a higher number of crashes would be expected. However, Texas exceeds the next two
highest states, California, by 30 percent and Florida, by 60 percent.
There are several managed lane projects in Texas with a pricing component to assist in
managing traffic demand. As these second generation managed lanes are developing in Texas,
there are more multi-lane facilities with physical barriers separating managed lanes from general
purpose lanes. The positive physical separation makes these facilities candidates for truck use.
Some of these managed lanes are expecting as much as 10 percent of their annual toll revenue to
be from truck traffic. Decisions related to the geometric design and operation of these facilities
directly influence the likelihood of truck use.
From a transportation system management perspective, increasing truck and traffic
volumes strain both the transportation agency’s ability to manage congestion and provide

2
sufficient capacity as well as the trucking industry’s ability to operate safely and efficiently on
the highway network. As more toll road infrastructure is built in Texas, it will be important to
understand how the freight and trucking industry can make effective use of these facilities.
PURPOSE OF RESEARCH
The purpose of this project was to identify the potential factors that could impact truck
use of toll roads and managed lanes. The researchers summarized the trucking and freight
industry needs through synthesis of existing literature. Geometric design and roadway
operational factors that are important to truck drivers and freight operators were identified for
inclusion in new toll road design in hopes of building facilities that are more attractive to those
users in terms of safety and efficiency. The factors are organized around facility geometric
design characteristics (e.g., horizontal alignment, vertical alignment, cross section, ramp design),
operating characteristics (e.g., signing and pavement markings), industry needs (e.g., safety,
travel reliability), and corridor operational strategies (e.g., transportation management, intelligent
transportation systems).
RESEARCH METHODOLOGY
The research methodology primarily focused on extracting findings from past research,
existing guidelines, and published industry surveys. The scope of the research was kept to full
access-controlled facilities that represent toll roads and most managed lanes. The research did
not investigate pavement design needed for trucks and heavy vehicles. In addition, the scope of
the research was not to address impact pricing might have on trucks use of toll roads. The
approach was to be “pricing-neutral.” That is, the researchers investigated the design and
operational factors that may increase safety and operational efficiency. The rationale was that if
a facility could be built with the design and operational features that are more attractive to truck
drivers and freight operators, then there is a greater chance for use by the trucking industry. If a
facility is perceived or found to be more efficient and safe, truck drivers may be more likely to
use the facility assuming it is fairly priced.
The research resulted in published guidelines to help transportation planners, highway
designers, and transportation operations professionals determine the geometric design and

3
operational factors important to attract the trucking and freight industry to toll roads. The
research was done through past researched relationships of design, safety, and operations.

5
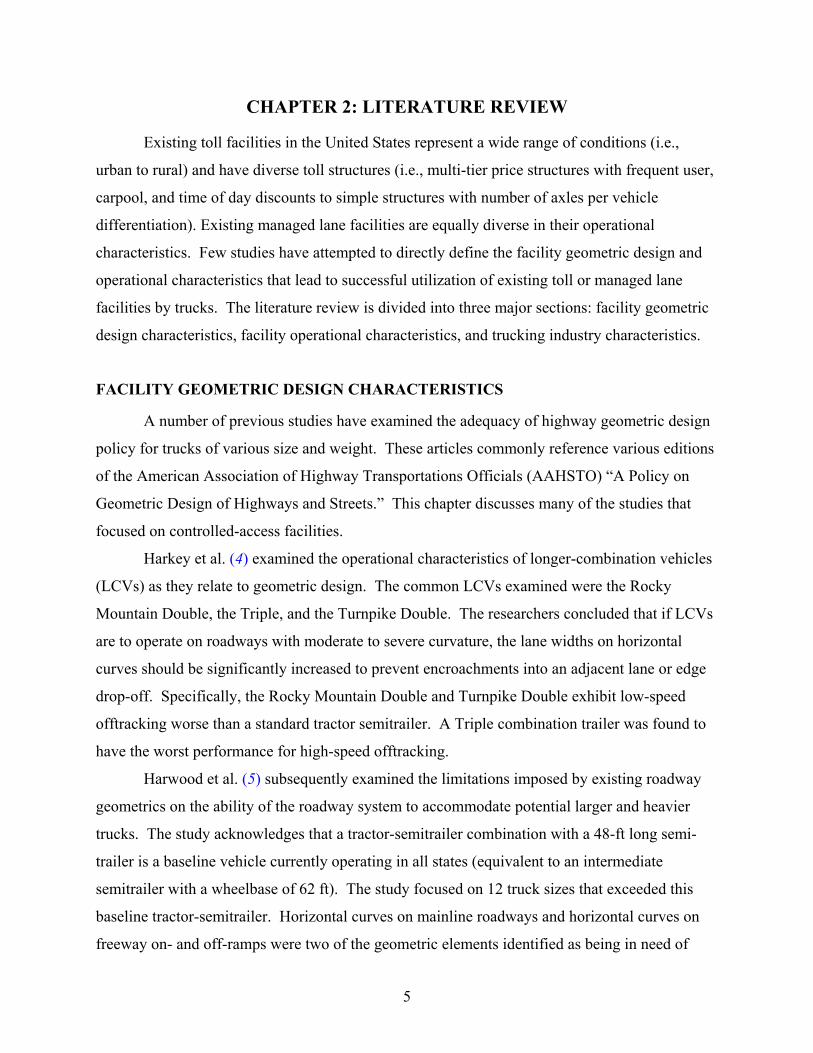
CHAPTER 2: LITERATURE REVIEW
Existing toll facilities in the United States represent a wide range of conditions (i.e.,
urban to rural) and have diverse toll structures (i.e., multi-tier price structures with frequent user,
carpool, and time of day discounts to simple structures with number of axles per vehicle
differentiation). Existing managed lane facilities are equally diverse in their operational
characteristics. Few studies have attempted to directly define the facility geometric design and
operational characteristics that lead to successful utilization of existing toll or managed lane
facilities by trucks. The literature review is divided into three major sections: facility geometric
design characteristics, facility operational characteristics, and trucking industry characteristics.
FACILITY GEOMETRIC DESIGN CHARACTERISTICS
A number of previous studies have examined the adequacy of highway geometric design
policy for trucks of various size and weight. These articles commonly reference various editions
of the American Association of Highway Transportations Officials (AAHSTO) “A Policy on
Geometric Design of Highways and Streets.” This chapter discusses many of the studies that
focused on controlled-access facilities.
Harkey et al. (4) examined the operational characteristics of longer-combination vehicles
(LCVs) as they relate to geometric design. The common LCVs examined were the Rocky
Mountain Double, the Triple, and the Turnpike Double. The researchers concluded that if LCVs
are to operate on roadways with moderate to severe curvature, the lane widths on horizontal
curves should be significantly increased to prevent encroachments into an adjacent lane or edge
drop-off. Specifically, the Rocky Mountain Double and Turnpike Double exhibit low-speed
offtracking worse than a standard tractor semitrailer. A Triple combination trailer was found to
have the worst performance for high-speed offtracking.
Harwood et al. (5) subsequently examined the limitations imposed by existing roadway
geometrics on the ability of the roadway system to accommodate potential larger and heavier
trucks. The study acknowledges that a tractor-semitrailer combination with a 48-ft long semi-
trailer is a baseline vehicle currently operating in all states (equivalent to an intermediate
semitrailer with a wheelbase of 62 ft). The study focused on 12 truck sizes that exceeded this
baseline tractor-semitrailer. Horizontal curves on mainline roadways and horizontal curves on
freeway on- and off-ramps were two of the geometric elements identified as being in need of
6
improvement. Horizontal curves, either on mainline roadways or ramps, require greater lane
width to accommodate the swept-path width of these trucks. Geometric design guidelines
typically call for a lane width in these horizontal curves of 14 to 15 ft. The 12 trucks sizes
examined would all require a lane width in excess of 15 ft. Without these geometric
improvements, trucks would encroach on other lanes or shoulders and potentially create a safety
hazard.
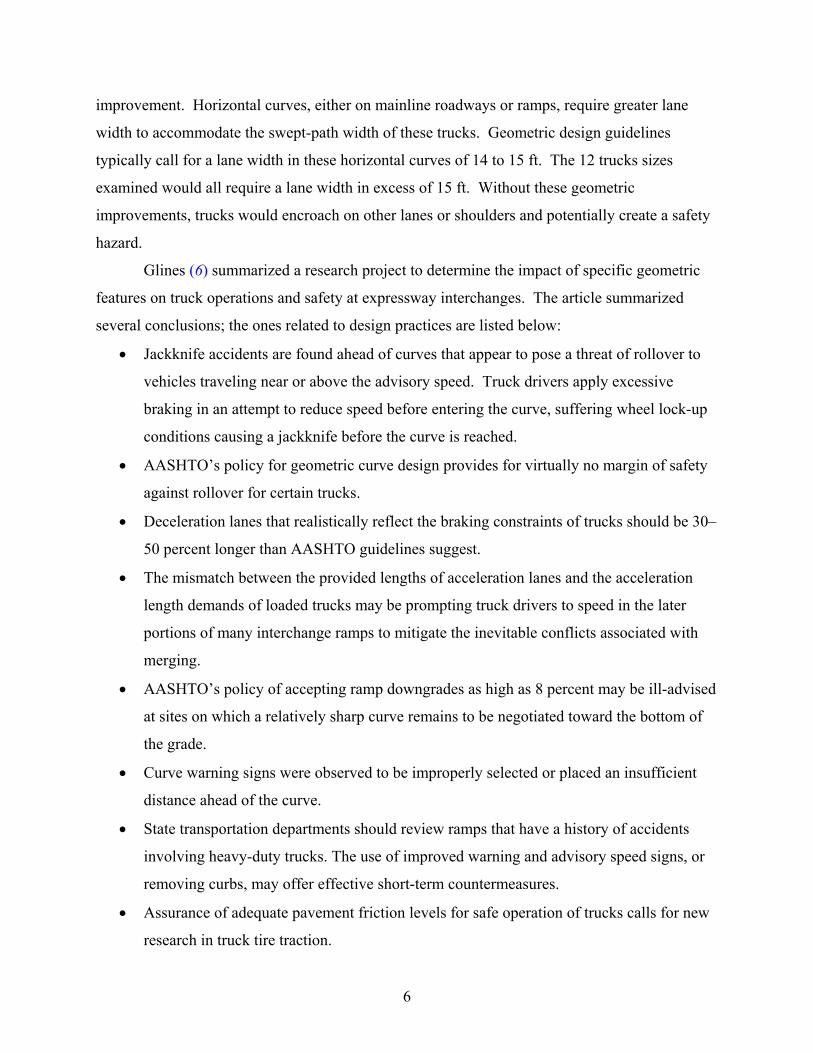
Glines (6) summarized a research project to determine the impact of specific geometric
features on truck operations and safety at expressway interchanges. The article summarized
several conclusions; the ones related to design practices are listed below:
• Jackknife accidents are found ahead of curves that appear to pose a threat of rollover to
vehicles traveling near or above the advisory speed. Truck drivers apply excessive
braking in an attempt to reduce speed before entering the curve, suffering wheel lock-up
conditions causing a jackknife before the curve is reached.
• AASHTO’s policy for geometric curve design provides for virtually no margin of safety
against rollover for certain trucks.
• Deceleration lanes that realistically reflect the braking constraints of trucks should be 30–
50 percent longer than AASHTO guidelines suggest.
• The mismatch between the provided lengths of acceleration lanes and the acceleration
length demands of loaded trucks may be prompting truck drivers to speed in the later
portions of many interchange ramps to mitigate the inevitable conflicts associated with
merging.
• AASHTO’s policy of accepting ramp downgrades as high as 8 percent may be ill-advised
at sites on which a relatively sharp curve remains to be negotiated toward the bottom of
the grade.
• Curve warning signs were observed to be improperly selected or placed an insufficient
distance ahead of the curve.
• State transportation departments should review ramps that have a history of accidents
involving heavy-duty trucks. The use of improved warning and advisory speed signs, or
removing curbs, may offer effective short-term countermeasures.
• Assurance of adequate pavement friction levels for safe operation of trucks calls for new
research in truck tire traction.
7
Tom and Fong (7) summarized the activities of an evaluation of truck merging operations
at a selection of four California freeway on-ramp locations with significant truck volumes. The
50th percentile merge location for truck combinations was approximately 1072 ft, compared to
498 ft for cars, 489 ft for recreational vehicles, and 565 ft for all vehicles. Researchers found that
as more length was provided to accelerate and merge, more length was used by drivers. At each
site, more than half of the merging maneuvers took place in the latter half of the length provided.
Ervin (8) summarized a research study to establish how particular expressway ramps
cause drivers of tractor-semitrailers to lose control of their vehicles. The most basic conclusion
of the study was that highway design in the United States does not sufficiently account for the
special maneuvering limitations of heavy trucks. Ervin’s study recommended that all AASHTO
policies relating to the geometric design of highway ramps and other curved roadways be
examined from the viewpoint of the maneuvering requirements of heavy trucks.
The author selected several sites to be illustrative of the range of ramp design problems
identified by the computer simulations. The sites illustrated the more significant aspects of
geometric design that limited margins of safety for heavy trucks operating on freeway connectors
and ramps. Both the physical size of trucks and limitations in their physical performance caused
problems when negotiating connector roadways. Several of the sites illustrated the major
problems identified by crash records and by computer simulation.
• Site 1 – Tight curve with insufficient superelevation;
• Site 2 – Hazardous sequence of curves (flatter curves approaching tighter curves leading
to errors in driver expectations);
• Site 3 – Short deceleration lane leading to tight-radius curve (deceleration lane lengths
are deficient for trucks, resulting in excessive speeds at the entrance of sharply curved
ramps);
• Site 6 – Poor pavement friction on high-speed curve (lightly loaded truck tires are
sensitive to pavement texture in avoiding hydroplaning on high-speed ramps);
8
• Site 13 – Curb placed along the outside of curve (curbs placed on the outer side of curved
ramps pose a peculiar obstacle that may trip and overturn articulated truck combinations);
and
• Site 8 – Ramp downgrade leading to a tight curve (an exit ramp leading to a downward
slope followed by a tight curve may result in truck drivers exceeding the safe speed).
Perera et al. (9) focused on the task of determining the critical speed of a ramp for heavy
vehicles, then translating that into a safe operating speed. Through the use of computer
simulation models and input of geometric design elements from an example ramp, researchers
determined critical speed and safe operating speed for a baseline vehicle and a vehicle with a
high center of gravity. The critical speed was the lowest speed at which the wheels of the subject
vehicle would either begin to lift off of the ramp surface (rollover) or run off the ramp
(offtracking). The safe operating speed was determined by dividing the critical speed by a factor
of safety, assumed to be 2.0 for this test. For both vehicles (baseline and high center of gravity),
the safe operating speed was determined to be 13 to 18 mph lower than the corresponding
AASHTO design speed, based on the equations developed through the model.
Accommodating Trucks on Highways: State Department of Transportation Reviews
In response to increased truck traffic and experience with truck safety, several states have
done reviews of how trucks are being accommodated on the highways in their state. The
following highlights reports from Texas, Virginia, and Kentucky.
The Research and Technology Implementation Office of TxDOT did a survey of their
districts in 2001 to determine what actions were being undertaken to accommodate the higher
truck traffic being experienced in Texas (10). The survey consisted to two parts: what the
districts were doing and suggested actions from district staff. At the time, the districts were
undertaking a number of activities in the geometric design and traffic operations area:
• design: lane and shoulder widening project, providing passing lanes and providing
climbing lanes, construction of additional rest stops, and construction of additional
parking areas; and
• traffic: truck tipping hazard signs at selected interchanges, variable transverse striping at
interchanges, and speed marking at interchanges.
9
The survey also suggested geometric and traffic operations measures to be undertaken.
Specific recommendations made by district personnel were:
• reduce design criteria for maximum percent grade to result in a speed reduction of only
5 mph, rather than 10 mph allowed under current guidelines;
• provide wider shoulders along controlled-access facilities;
• adopt the Texas Super 2 guidelines for primary two-lane roads with high truck traffic;
and
• use truck-oriented dynamic message sign displays.
Fontaine performed a state-of-the-practice review for the Virginia Department of
Transportation (DOT) on engineering and technology measures to improve truck safety (11).
The study used both a literature review and a survey of Virginia DOT personnel. The study
found support for the following measures:
• design: climbing lanes, truck escape ramps, improved ramp geometry, improved
geometric design of interchanges, and improved design of parking facilities;
• traffic: rumble strips; and
• intelligent transportation systems (ITS): ITS speed advisory systems, automatic truck
rollover warning systems, and improved traveler information.
The study also mentioned that there was no consensus on the use of truck lane restrictions
and differential speed limits for trucks. The Kentucky Transportation Center also conducted a
study on impacts of large trucks on highway safety (12). Similarly, this study recommended
countermeasures related to design, traffic engineering, and ITS:
• design: construct climbing lanes, emphasize truck needs in work zones, increased use of
concrete median barriers, and provide additional parking facilities;
• traffic: include audible rumble strips on shoulders; and
• ITS: provide real-time congestion/incident information, provide real-time weather
information, and use speed monitoring equipment in advance of ramps with low design
speeds.
In summary, facility geometric design characteristics that may affect truck use of toll
roads and managed lanes include:
• general design characteristics including design speed, horizontal and vertical clearance,
stopping sight distance, superelevation, cross slope, minimum turning radius, horizontal
10
and vertical curvature and gradient, lane and shoulder width, and the number of lanes set
aside as tolled or managed lanes;
• ramp junctions, including within or entering or exiting from the tolled/managed lane
facility;
• direct connect ramps and ramp configurations; and
• system connectivity.
CORRIDOR OPERATIONAL CHARACTERISTICS
A number of study efforts have attempted to define the corridor operational
characteristics that would lead to successful operation of trucks on highways, most commonly,
studies on exclusive truck facilities. A study done for the Federal Highway Administration
(FHWA) (13) developed a method and computer program called Exclusive Vehicle Facilities
Software (EVFS) to help determine the economic feasibility of separating light and heavy
vehicles on interstate and other controlled-access highways. EVFS calculates the net present
worth, benefit-cost ratio, and other corridor performance measures for various lane
configurations that designate existing lanes or provide additional lanes exclusively for trucks or
passenger vehicles. Cost components include engineering and construction, right-of-way
acquisition and demolition, and periodic pavement resurfacing.
Most recently, Samuel et al. (14) considered the feasibility of truck tollways. In doing so,
they developed an analysis methodology consisting of three main components: pavement design,
productivity analysis, and feasibility analysis. The pavement design examined various scenarios
of truck usage, enabling realistic estimation of initial investment, and providing input to
pavement deterioration models. The productivity analysis quantified the impact that the truck
tollway system would have upon the productivity of truck fleets, measured by the resulting
changes in operating costs. Results provide information about the range of tolls that could be
levied from trucks using the truck tollway system (14). The feasibility analysis estimated the
likely feasibility of the proposed toll truck tollway concept using modeled pavement
deterioration and corresponding estimated road user costs. The feasibility analysis considers two
major facets: the overall economic feasibility of the project from the system-wide point of view
and the private (financial) feasibility of the project from the standpoint of a private truck tollway
developer/operator.
11
Utilizing this same analysis procedure and building upon the earlier work of Samuel et al.
(14), Holguin-Veras et al. (15) considered the effects of exclusive truck lanes in combination
with high gross weight limits and sizes for trucks using the system, actual tolls levied on trucks
using the system, and providing gas tax rebates for exclusive lane-miles traveled. The feasibility
study, complemented by a sensitivity analysis on key variables, strongly suggests that at
relatively low traffic levels (20,000 vehicles per day) exclusive lane implementation has a
beneficial economic effect. As traffic increases, so does the benefit. As determined by the
balance between revenue stream and the annualized exclusive lane building and operating costs,
the financial feasibility analysis indicates that tolls between $0.25 and $0.50 per kilometer ($0.40
and $0.80 per mile) yield a rate of return higher than the opportunity cost of the capital
(estimated at 6 percent).
Middleton and Venglar (16) conducted VISSIM microsimulation analysis on generic
rural highway sections to examine the capacity of truck roadways under varying geometric
design elements. The geometric design variables they looked at were vertical grade, longitudinal
coverage of grade, and interchange spacing. The researchers also varied the percent of entering
and exiting truck traffic at the ramp junctions. The simulation results indicated that truck
facilities capacities could range from 1025 to 1475 trucks per hour per lane depending on the
grade and interchange spacing.
In practice, exclusive lanes for trucks are infrequent. According to NCHRP Synthesis
314, Strategies for Managing Increasing Truck Traffic (1), only one state of 25 reports approval
of a dedicated road for trucks; the New York State DOT (NYSDOT) has allocated $11 million
for a new truck-only route along Edgewater Road between the southbound Sheridan Expressway
and the Hunts Point Market. Because of limited implementation, the majority of site-specific
studies conducted (i.e., Washington, California, Florida, Georgia, and the I-35 multi-state
corridor) have considered the feasibility of exclusive truck lanes and simulated impacts; no
implementations have provided observed evaluation results.
Washington
A simulation study conducted in Washington (17) considered the effects of both
exclusive truck lanes and the use of existing high-occupancy vehicle (HOV) lanes by trucks
12
along several routes in the greater Seattle area. The study considered operational impacts,
economic impacts, safety impacts, and pavement deterioration rates, as well as public opinion.
The study found that “reserved capacity” strategies for trucks would offer nearly
$10 million in annual travel-time savings for the trucking industry in the Seattle region. The
impact on individual trips would be small, about 2.5 minutes saved per average trip (less than
8 percent savings in trip travel time). The biggest impact of truck reserved capacity strategies is
in the travel-time savings they would create for single-occupant vehicles, almost $30 million per
year. This travel-time savings would be an artifact of the current underutilization of HOV lanes
in the Seattle area and not necessarily a virtue of reserved-capacity strategies. The difference in
travel times between the reserved capacity strategy that adds trucks to the existing HOV lanes
and the one that adds an exclusive truck lane are insignificant, providing little justification for
construction of an exclusive lane.
California
Similarly, Taylor (18) completed a feasibility study on exclusive lanes for commercial
trucks along State Route 60 (SR-60), from I-710 to I-15, a distance of approximately 38 miles.
This freeway, serving intermodal freight yards and bridging between the Ports of Long
Beach/Los Angeles and inland areas, currently carries a daily truck volume of more than 20,000
in some locations, projected to more than double by 2020. SR-60 is identified in the Southern
California Association of Government’s (SCAG) adopted 2001 Regional Transportation Plan as
one of four highways planned to include exclusive truck lanes by 2025. In the current Regional
Transportation Plan for Southern California, the SCAG identifies dedicated truck lanes as a
means to more efficiently keep goods movement flowing smoothly, improve overall mobility
along the freeway, and improve traffic safety and air quality.
Three main strategies were considered: 1) allowing trucks to share the HOV lanes during
limited time periods, 2) adding truck lanes to the freeway at grade, and 3) adding lanes above the
freeway grade. The shared HOV option was dropped due to a number of barriers including legal
and funding obstacles. The study recommended combining the two remaining strategies, with
at-grade truck lanes built where feasible and above-grade mixed-flow lanes (trucks would
operate at grade for safety) built where right-of-way acquisition would be difficult. Above-grade
13
lane sections should be kept to a minimum due to safety and operational consideration, as well as
higher construction costs.
Florida
With a directed focus on areas where trucks have a significantly negative impact on
safety and congestion, Reich et al. (19) considered the feasibility of separating large trucks from
the traffic mix. Researchers constructed several geographic information system (GIS) models to
identify “hot spots” based on truck crashes, truck volume and percent, and level of service. Both
rural and urban locations were considered, as each scenario presented a different set of
challenges. Lastly, researchers assessed the feasibility of countermeasures for each site.
Researchers determined that most of Florida’s interstate system was suitable for exclusive truck
facilities, with the most appropriate areas having sufficient available right of way.
Georgia
Most recently, Parsons, Brinkerhoff, Quade, and Douglas (20) completed a feasibility
study in Atlanta that considers HOV, high-occupancy toll (HOT), and truck-only toll (TOT)
lanes. With respect to TOT lanes, the stated facility objectives are to: 1) improve safety – the
inherent safety problem created by the size disparity between trucks and other automobiles and
danger of traveling side by side at high speeds and in congested areas is avoided; 2) improve
efficiency – freight could travel more efficiently without placing a strain on the already limited
federal, state, and local highway funds; and 3) generate revenue – tolls provide an additional
source of revenue to pay for transportation improvements. The overall goal is to manage heavy-
duty vehicle flow in transportation corridors by maximizing the utilization of transportation
infrastructure in order to improve productivity and enhance safety.
The project study area included all limited-access facilities in the 13-county Atlanta
region. This study examined three TOT lane alternative concepts (scenarios):
• A1 Major Truck Corridors. Along two of the most promising corridors in the region,
two TOT lanes would be constructed in each direction, in addition to HOV lanes, with
access provided to the local road network at appropriate locations.
• A2 Service to Deliveries. Assuming that the TOT lanes of A1 are in place, the current
HOV lanes inside I-285 would additionally be reserved for light-duty commercial
vehicles willing to pay a fee during the midday.
14
• A3 Regional TOT Network. All existing and proposed HOV lanes would be converted
into TOT lanes (except inside I-285, where the current prohibition for through truck trips
is maintained), with no need to construct separate TOT lanes.
Measures of the long-term performance of each scenario were developed to determine if
any fatal flaws exist in the TOT concept. The study found that under any of the three scenarios:
1) total vehicle hours traveled are reduced with a negligible change in vehicle miles traveled; 2)
trucks can save a significant amount of time; 3) congestion in general-purpose lanes is
significantly improved; and 4) respectable amounts of revenue can be generated to cover
operating and maintenance costs.
In summary, the operational characteristics that may affect truck use of toll roads and
managed lanes include:
• overall congestion levels (peak period and other) on the facility, including tolled or
managed lanes and general purpose lanes;
• percentage of trucks in the general traffic stream;
• entrance and exit activity for trucks (local vs. long-haul, industry centers, etc.);
• allowable speed limits on the facility, including tolled or managed lanes and general
purpose lanes;
• speed differentials within the toll/managed lane facility and between the tolled/managed
lane facility and the general purpose facility;
• availability of and traffic and geometric conditions on potential alternate routes;
• tolled/managed lane accessibility, including the type and degree of separation from the
general purpose facility and the number and frequency of ingress/egress points;
• tolled/managed lane hours of operation (i.e., continuous, extended hours, or peak travel
periods only);
• tolled/managed lane eligibility criteria, including vehicle types, vehicle occupancies, toll
structures, etc.;
• tolled/managed lane enforcement strategies; and
• freight movement incentives, including allowable use of longer combination vehicles,
higher gross vehicle and axle weight limits, etc.

15
INDUSTRY CHARACTERISTICS
Perhaps the most important factor influencing truck and freight use of toll roads or
managed lanes are the industry’s own needs and business processes. Surprisingly, few of the
studies that have considered the feasibility or impact of trucks in tolled or managed roadways
have also considered the trucking industry perspective to any great extent. Several factors may
offer explanation:
• The trucking industry is diverse, comprising local and long-haul carriers, less-than-
truckload carriers, interstate and intrastate carriers, common and private carriers, small
carriers with a single truck to carriers managing fleets of several thousand, etc. Each has
distinctive administrative and operational practices and philosophies.
• Because of the competitive nature of the industry, the information to support an
investigation of the administrative and operational practices and philosophies is not
readily accessible.
• Administrative and operational philosophies are determined by numerous factors
including local, state, and federal regulation related to noise ordinances, driver hours,
shipper and receiver constraints and logistics, commodity types and delivery windows,
load/unload times, etc.
• The trucking industry is dynamic, constantly changing to improve efficiency and reduce
delays.
Bill Webb, President of the Texas Motor Transportation Association, spoke to the Trans-
Texas Corridor Advisory Committee in September 2005 (21). His comments reflect many
published comments of the trucking and freight industry. The trucking industry in Texas is large
and diverse. There are 43,000 trucking companies registered to operate in the state. The top 100
carriers represent 60 percent of the industry, with the average being a 12-truck, family owned
operation. Some of his observations of what the industry may support include:
• tolls on new capacity, not on existing facilities;
• toll in corridors where a “free” alternative is available;
• tolled facilities that allow for increased speed, size, and weight;
• tolled facilities that are managed to control consistency of speed;
• interoperability of tag/transponder technology; and
• tax relief where tolls are levied.
16
The underlying question for this research project is: do the potential benefits provided by
a toll road or managed lane (i.e., reduced delay, improved reliability, enhanced safety, etc.) offer
something of value to the trucking industry that outweighs the potential costs (i.e., increased
operating costs attributable to tolls, negative public reaction, etc.)? To answer this question, one
must have a clear understanding of how congestion-related delays and unpredictability in travel
times truly affect the overall delivery process (i.e., how do congestion delays rank in comparison
to other delays caused by limits on driver’s hours, double handling of the product, wait time for
connections or access, rough pavement, company-imposed maximum speed restrictions, etc.) and
the range of alternative solutions (to avoid paying a toll) that the trucking industry can draw from
(i.e., changing hours of operation to avoid peak travel periods, changing travel routes to avoid
congested segments of the roadway, etc.).
For example, using traffic simulation of the Seattle-area roadways, Trowbridge et al. (17)
estimated an annual savings in truck travel time of 395.8 vehicle hours during the peak morning
hour or $9,786,551 per year (assuming an average of $15.85 per hour for truck drivers) if they
were allowed to use the HOV lanes. While this seems significant, the actual per-trip savings for
trucks is small, only about 2.5 minutes per trip. Whether these savings could be translated into
improved productivity is questionable; 2.5 minutes is too small a time increment to be used
productively by manufacturing inventory control and dispatching. An exclusive lane shows
somewhat smaller benefits of saving 7.8 truck hours during the morning peak period. These
small improvements reflect the relatively small number of heavy trucks. A reduction in variance
was considered but not quantified as part of this study. The study did suggest, however, that
since much of a truck’s total trip takes place on non-exclusive or reserved facilities, that the
change in variance attributable to truck only lanes would be small.
As part of this same study (17), several attitudinal surveys were conducted to gauge the
reaction to both exclusive truck lanes and the use of existing HOV lanes by trucks along several
routes in the greater Seattle area. Researchers solicited opinions from: 1) the trucking industry,
2) truck drivers (local and long-haul), 3) motorists who do and do not use the existing HOV lane,
and 4) law enforcement officers. To capture the broader trucking industry perspective: 1) mail-
back surveys were handed out at truck stops, 2) two large companies were contacted and had
their drivers participate, and 3) the state trucking association distributed surveys to their
members. The following description summarizes the findings from those surveys.

17
Truck Company Survey
The key findings from the trucking industry surveys are as follows:
• Routes of choice for truck drivers are not regulated by companies according to 65 percent
of respondents.
• Only 8 percent of companies regulate travel times of urban highways to avoid general
peak commute times.
• Most companies, 87 percent, regulate the speed of their trucks on the highways with the
most common allowable maximum speed being 60 mph or below.
• A majority of respondents felt that separating trucks would improve both safety and
congestion.
• Strong disagreement was reported by 69 percent of respondents that large trucks should
pay a special usage fee for using a reserved or shared lane.
General Public Survey
The key findings from the survey of the general public are as follows:
• Loaded trucks will cause problems for empty trucks on uphill grades, such as speed
differential within the lane.
• Survey respondents do not want trucks impeding faster moving HOV or toll traffic.
• Traffic backups cost money that cannot easily be charged back to customers.
• Overcoming “left-lane restriction” mentality, most trucks are used to being restricted to
the right-hand lanes, traveling in left lanes may be uncommon.
• Time sensitivities of materials hauled (i.e., concrete, etc.).
• Lane widths should be wider than normal to accommodate oversize/overweight loads.
• Do not want trucks speeding.
• Pay trucks by the hour instead of by the mile to increase safety.
• Differences between long-haul passing through and local requiring access.
• Much of the industry requests and encourages greater enforcement of existing
restrictions—level playing field.

18
Truck Driver Survey – Long Haul
The key findings from the long haul truck drivers are as follows:
• Changing their hours of operation to account for congestion was reported by 76 percent
of truck drivers.
• Changing their route to account for congestion was reported by 81 percent of truck
drivers.
• 65 percent disagree strongly that large trucks should pay a special usage fee for using a
reserved or shared lane.
Truck Driver Survey – Local
The key findings from the local truck drivers are as follows:
• Changing their hours of operation to account for congestion was reported by 22 percent
of the truck drivers.
• Changing their route to account for congestion was reported by 69 percent of truck
drivers.
• Pay a special usage fee for using a reserved or shared lane was strongly disagreed to by
73 percent of the respondents.
General Overall Survey Findings:
The key overall survey findings are as follows:
• Consistency in lane “rules” is important to both general public and trucking industry.
• Trucks impact other lane users by increased delay, decreased safety, and decreased
visibility.
• Speed differentials are caused by trucks within the lane and between the lanes; large
trucks cannot maintain a constant speed.
• Speed differentials are caused when entering and exiting the lane.
• Some delay is incurred at the warehouses due to loading/unloading.
• Consideration should be given on how trucks using this lane preserve intended use of the
lane. For example, HOV lanes are intended to encourage carpooling, reduce fuel
consumption, and reduce pollution; however it is not clear how trucks impact these
intended uses.
19
• Increased merging maneuvers can result depending on the lane location. Cars will often
not allow trucks to merge in congested conditions.
• The trucking industry is sensitive to increased fees due to already increased fuel taxes,
license fees, etc.
Despite 82 percent of the general public agreeing that large trucks are important to our
nation’s economy, only 28 percent of the general public thought that trucks should have the same
travel benefits as public transit and HOV. Seventy-eight percent of truckers thought they should
share these benefits. Only 2 percent of truckers agreed that trucks should pay a special usage fee
to use a reserved lane or existing HOV lane, compared to 35 percent of the general public. The
general public expressed concerns related to speed differential, poor visibility, safety, diesel
smell, intimidation, congestion in preferential lane, etc.
Researchers with the Texas Transportation Institute (TTI) have contacted and worked
extensively with various elements of the motor carrier community for many years. These
contacts include contacts of individual carriers in a variety of states, state level organizations of
motor carriers, and the American Trucking Associations (ATA) Foundation (now American
Trucking Research Institute). In one recent federally funded research project, TTI worked
directly with the ATA Foundation interviewing a wide range of motor carrier representatives.
TTI has become very familiar with the Texas Motor Transport Association (TMTA) through
involving their staff and members in a variety of research projects, mostly sponsored by TxDOT.
In the federal research mentioned above, TTI contacted and interviewed a large body of
industry representatives, including motor carriers and their drivers. Table 1 summarizes some
aspects of these interviews to give an indication of their breadth. The research included
interviews with a full spectrum of private and for-hire carriers. These included the large for-hire
carriers operating over 2000 units down through smaller regional and commodity-specific
carriers, including some owner-operators operating one to 10 units. Large fleets included large
less-than-truckload (LTL) carriers using van-type cargo trailers, mid-size and small fleets
included tanker operations, and material haulers. The subject of the interviews was the feasibility
of using on-board diagnostics to enhance roadside safety inspections. Clearly, most drivers and
some management personnel anticipated that the introduction of any means of monitoring the
vehicle could also monitor their behavior and were very skeptical. However, the TTI interviews
were structured to capture the appropriate information while allaying fears of privacy intrusion.

20
Table 1. Summary Profile of Motor Carriers Interviewed. Category No. of Carriers No. of Tractors
Owner Operator 8 19
For Hire 33 86,282
Private 9 4,738
SUMMARY
There has been considerable research in the past on trucks’ impact on the design and
operation of highway facilities. This information can be effectively synthesized to create
guidelines on which corridors may have operational and design characteristics suitable for truck
use of toll roads or lanes or, conversely, what characteristics are needed to attract truck use to a
facility. The subsequent chapters use the information available to craft these guidelines to be
most effective for use by highway engineers designing toll road and managed lane facilities.
21
CHAPTER 3: SURVEYS OF TRUCKING INDUSTRY
A survey on opinion of geometric design elements was prepared to solicit input from
truck drivers and the trucking industry. The Appendix presents the survey questions. In an
effort to reduce research costs, the survey was to be combined with another TxDOT project on
value pricing and truck drivers’ understanding of toll roads (22). Once the surveys were
compiled, the researchers felt that the length of the combined survey would deter responses due
to the time to complete the survey, ultimately not serving either project. The value pricing
project survey was administered, and this chapter summarizes the findings. To gather input on
the trucking industry needs related to geometric design and operational factors, the project made
use of other relevant published surveys.
The TxDOT value pricing project conducted surveys in the I-35 area around Austin,
Texas, to better understand truckers’ use of toll roads. Trucker responses to incentives were
classified as follows:
• Lower fuel prices were the biggest motivation for using the toll roads.
• Other responses were: no congestion, dining facilities with better parking lots for trucks,
and wide shoulders for emergencies all received an above average score.
• Smaller trucking companies (owner-operator) clearly preferred the non-toll route, citing
the fact that tolls come directly out of their expenses and it is difficult to pass these costs
on to their customers.
• Larger companies were more likely to carefully weigh the benefits and costs of using the
toll route when making their decision rather than avoiding toll roads in general.
The American Transportation Research Institute (ATRI) conducted a survey on behalf of
the Georgia State Road and Tollway Authority. The survey asked opinions of motor carriers on
potential TOT lanes in the Atlanta area. Responses were received from 71 Georgia-based
trucking firms, mostly for-hire carriers and private fleet operators. The key findings from this
survey were:
• Georgia carriers were willing to use optional TOT lanes when no costs exist and a pricing
mechanism could successfully keep TOT lanes at free-flow levels.
• Congestion was thought to lead to the use of alternate routes by 49 percent of the
respondents.
22
• Use of alternate routes in anticipation of congestion was reported by 42 percent of the
respondents.
• Only 3 percent said delivery time was flexible.
• Highways congested and traffic accidents were the two greatest reasons for using TOT
lanes.
Darrin Roth, speaking to the International Symposium on Road Pricing, made the
following statements concerning the trucking industries views on use of pricing and tolls (23):
• A recent study found significant diversion from Ohio Turnpike following an 82 percent
toll rate hike.
• Vehicles are using congested alternate routes instead of free-flowing turnpikes.
• 70 percent of trucks on one arterial are using the road solely to avoid a toll.
• Facilities that are supported by the trucking industry include:
o Reason Foundation truck lanes,
o Trans-Texas Corridor,
o Southern California truck lane proposal,
o Electronic toll collection lanes (e.g., FAST lanes), and
o HOT lanes on existing HOV lanes.
Wolshon and Ciprian (24) conducted a study on trucker perceptions of lane restriction
and differential speed limit policy on freeways in Louisiana. A total of 159 responses were
received from trucking companies. Overall, truckers were not in favor of the restrictions
imposed on their driving, and the truck drivers did not perceive a significant safety benefit.
Other findings from the survey were:
• 83–85 percent of respondents said information on lane restrictions are effectively
communicated and clearly understood by truckers.
• 57 percent of respondents expressed that the existing speed deferential policies worked to
diminish safety.
• The most common complaint was that the reduced speed policy resulted in long queues
of trucks in the right lane, which in turn led to reductions in sight distance.
• Lower speeds resulted in reductions in levels of driver alertness.
• The most common reasons for lane changing into the restricted lane were to avoid
breakdowns and slower moving vehicles.

23
Ko et al. (25) conducted a survey to understand the trucking industry’s perceived factors
affecting level-of-service on freeways. Approximately 500 surveys were received from Florida
truck drivers and truck company mangers (459 truck drivers and 38 truck company managers).
The following findings were developed:
• The top two most important factors, ranked by both truck drivers and truck company
managers, were passenger car drivers’ knowledge about truck driving characteristics and
passenger car drivers’ road etiquette.
• The top five geometric design factors felt to influence level-of-service, ranked by truck
drivers, were: availability and condition of signage, lane width, road striping, shoulder
width, and length of merge/diverge lanes. (The signing factor was not specific to location
of the sign.)
• Truck company mangers gave more importance to timing of construction activities—
availability of alternate routes—and tended to be more concerned about the overall travel
time as opposed to the truckers concern for drive quality and consistency of travel during
the trip.
The survey also presented some proposed performance measures and asked which should
be used as a performance measure for freeways. The top ranked performance measures by truck
drivers were good ride quality (i.e., enhanced ride comfort and minimize impact on truck
equipment and goods being transported) and ease of maintaining a consistent speed (i.e.,
enhanced driving safety and minimize the need for acceleration and deceleration).
Adelakun and Cherry (26) explored truck driver perceptions of urban congestion and
safety and gauged their interests in potential geometric or operational solutions. The researchers
conducted an intercept survey at truck stops along I-75 and I-40 in Knoxville, Tennessee. One
question specifically asked drivers about the interactions with passenger vehicles on roadways.
Truck drivers were asked to pick two factors from a list as to which most significantly reduced
their efficiency and safety.
• Two of the top five answers were vehicles exiting off-ramps and vehicles entering on-
ramps.
• The other three responses in the top five were aggressive drivers, lane changing, and fast
trucks.
24
The American Trucking Associations Federation for several years has commissioned the
ATRI to conduct an annual survey on critical issues facing the trucking industry (27).
Congestion continued to rise in priority of responses from the ATRI survey. Congestion was
ranked 4th place in 2007, up from 5th place in 2006 and 8th place in 2005. Possible solutions
were noted as:
• Identify tools and strategies for expanding roadway capacity with an emphasis on
infrastructure maintenance and expansion for the highest congested corridors. Fifty-six
percent of the respondents ranked this the number one strategy.
• Examine the potential for truck-only lanes/corridors/networks. Responses focused on the
voluntary use, reasonable tolls, adequate entrance and exit points, and assurances that
passenger vehicles would be prohibited from use.
SUMMARY
While many of the surveys conducted with truck drivers and trucking companies had
different focuses, there were some consistent answers on what geometric design elements are
important to truck drivers. Lane width, shoulder width, signing, pavement markings, ramp and
interchange design, and supporting parking facilities were mentioned as important factors to
trucking operations.
The top concerns of truck drivers and trucking managers in several of the surveys were
passenger car drivers’ lack of knowledge on truck driving and passenger car driver behavior in
the traffic stream on roadways. Truck drivers also gave consistent answers on their frustration
with congestion, speed differentials, and lane restrictions. Truck drivers may support truck only
facilities, but their preference is for these facilities to exclude passenger cars, charge reasonable
or no tolls, and remain congestion free.

25
CHAPTER 4: GEOMETRIC DESIGN FACTORS
The Texas geometric design guide is TxDOT’s Roadway Design Manual (28). The
national guide is the AASHTO Green Book (29). Both of these design guidelines incorporate
trucks and heavy vehicles into their procedures. This chapter looks at the horizontal alignment,
vertical alignment, and cross section geometric elements that could be considered in designing
toll roads and managed lanes to increase truck driver comfort to improve driving efficiency and
safety. In general, these recommendations reinforce or exceed the criteria in the state and
national geometric design guides.
These design factors are important, as there is increasing pressure in developing projects
in developed corridors to use minimum or reduced design values. A recent review of high-
occupancy and managed lane projects in the United States found nearly two-thirds of the projects
(i.e., those coded with red squares) use some form of reduced design values (30).
Figure 1. HOV/Managed Lane Projects Using Reduced Design Values (30).
While many of these projects may be termed interim projects, the findings show a trend
of what may be the difficulty in constructing new facilities in developed corridors. Highway

26
designers must make design trade-off decisions routinely on projects as they are developed
within the context of the surrounding environment. However, designers must recognize that
these decisions may have a negative impact on the willingness of truck drivers to use these
facilities.
TXDOT ROADWAY DESIGN MANUAL
The Texas Roadway Design Manual was developed by the Department “to provide
guidance in the geometric design of roadway facilities. The manual represents a synthesis of
current information and operating practices related to the geometric design of roadway facilities”
(28). There are two sections that specifically address the type of facility with which toll roads
would be most associated. Section 6 of Chapter 3 presents the freeway guidelines and Chapter 8
presents the mobility corridors guidance.
Freeways
Freeways are typically the highest functional classification of facility. Access is fully
controlled to provide the highest level of mobility. Section 6 discusses freeway design criteria
within Chapter 3 on new location and reconstruction (4R) design criteria. The freeway design
criteria includes: basic design criteria, access control, mainlanes, vertical and horizontal
clearance at structures, frontage roads, and interchanges.
Mobility Corridors
Mobility corridors is a relatively new section of the Texas Roadway Design Manual.
Mobility corridors are focused on mobility and thus have full control of access to these facilities.
One of the characteristics that separate these facilities is the high range of design speeds between
85 mph and 100 mph.
AASHTO POLICY ON GEOMETRIC DESIGN OF HIGHWAYS AND STREETS
The national guidelines for roadway geometric design are the American Association of
State Highway and Transportation Officials (AASHTO) A Policy on Geometric Design of
Highways and Streets (referred to as the Green Book) (29). Throughout the Green Book, there is
27
guidance on roadway design for trucks. Specifically, the Green Book addresses the following
design elements:
• design vehicle characteristics:
o length, width, and height,
o combinations,
o minimum turning radius,
o off-tracking,
o weight-to-power ratio;
• driver characteristics:
o driver eye height;
• design for operational analysis;
• braking capability and stopping sight distance;
• control grades and critical length of grades:
o operating characteristics on grades,
o deceleration on grades,
o acceleration on grades; and
• climbing lanes.
BASIC DESIGN CRITERIA
The following section identifies the basic design criteria related to designing toll roads
and managed lanes for increased attractiveness to truck drivers. If a design element is not
addressed, it should be assumed that there is no additional information beyond what is currently
presented in the Texas Roadway Design Manual.
Design Speed
Design speed “is a selected speed used to determine the various geometric design features
of the roadway” (29).
• For toll roads and managed lanes, a design speed of 70 mph should be considered,
regardless of urban or rural environment. Higher design speeds should be considered in
relationship to the mobility corridor criteria.

28
Selection of a realistic design speed is critical to safety for trucks (31). When trucks
exceed the design speed, the likelihood of skidding or rolling over is higher for trucks due to
having different vehicle characteristics from passenger vehicles (e.g., higher center of gravity).
The most unstable trucks can roll over when traveling as little as 5 to 10 mph over the design
speed. Special care should be taken when selecting design speeds less than 30 mph to confirm
that these design speeds will not be exceeded by trucks.
Design Vehicles
Trucks generally require more generous geometric designs than do passenger vehicles.
This is attributed to trucks having longer wheel bases and greater minimum turning radii. Trucks
are one of four general classes of design vehicles described in the Green Book. The truck class
includes eight different design vehicles as follows:
• single-unit truck,
• intermediate semitrailer – WB-40 (40-ft wheel base),
• intermediate semitrailer – WB-50 (50-ft wheel base),
• interstate semitrailer – WB-62 (62-ft wheel base),
• interstate semitrailer – WB-67 (67-ft wheel base),
• double-trailer combination – WB-67D (67-ft wheel base),
• triple-trailer combination – WB-100T (100-ft wheel base), and
• turnpike-double combination – WB-109 (109-ft wheel base).
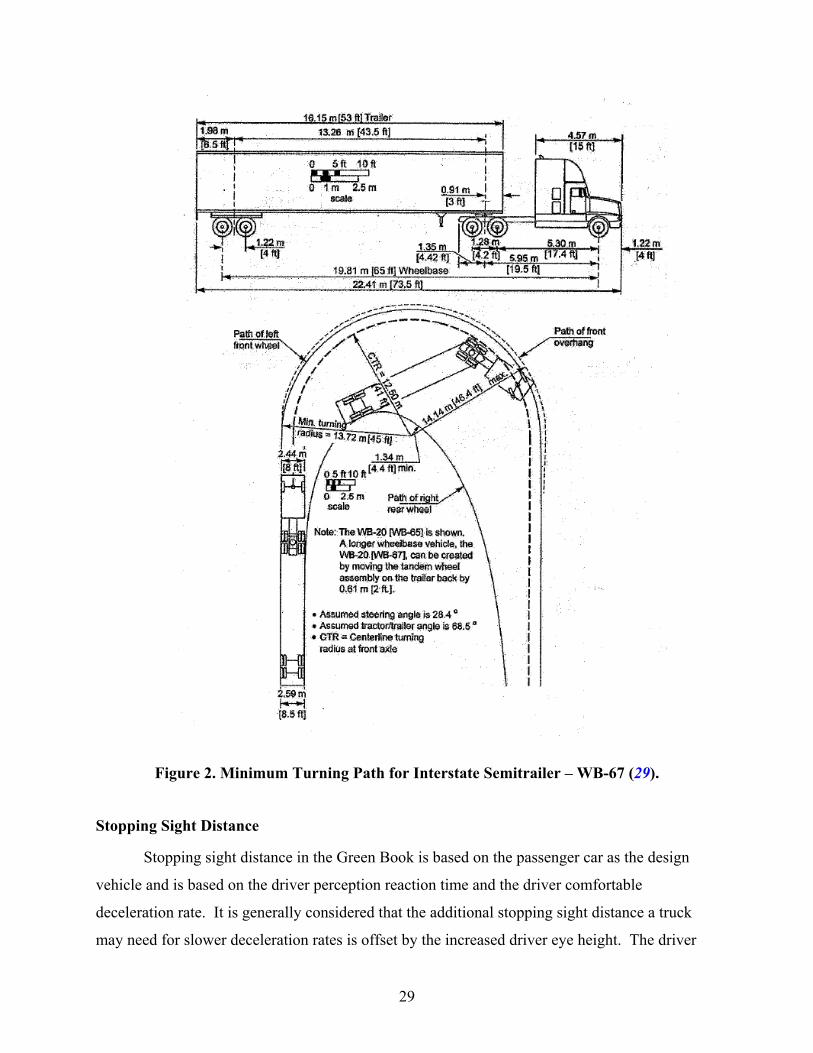
The Green Book states that the interstate semitrailer WB-67 should generally be the
minimum size design vehicle for consideration for freeway ramp terminals intersection with
frontage roads or arterials streets on routes that provide access for trucks. Figure 2, from the
Green Book, shows an example of the design vehicle characteristics for the truck class of
Interstate semitrailer WB-67 (29).
29
Figure 2. Minimum Turning Path for Interstate Semitrailer – WB-67 (29).
Stopping Sight Distance
Stopping sight distance in the Green Book is based on the passenger car as the design
vehicle and is based on the driver perception reaction time and the driver comfortable
deceleration rate. It is generally considered that the additional stopping sight distance a truck
may need for slower deceleration rates is offset by the increased driver eye height. The driver

30
eye height for a truck driver ranges from 5.9 to 7.9 ft. The Green Book recommends a value of
truck driver eye height for design of 7.6 ft. Comparatively, the driver eye height for a passenger
vehicle is assumed to be 3.5 ft.
Braking distance is one of the components of stopping sight distance. Two studies (32,
33) discuss additional braking distances for trucks. Truck braking distance should consider both
the best- and worst-case drivers. Table 2 shows the braking distances for passenger cars from
the AASHTO Green Book. Anti-lock brake systems are not required on most trucks; however,
there is still a significant percentage of the truck traffic population with improper performing
brakes (34). Table 2 also shows the braking distances for worst performing truck drivers, best
performing truck drivers, and trucks with anti-lock brake systems.
Table 2. Truck Braking Distance on Wet Pavement.
Design Speed (mph)
AASHTO Criteria for
Passenger Cars (ft)
Braking Distance for Trucks (ft) Worst-
Performance Driver
Best-Performance
Driver
Anti-lock Brake System
20 38 77 48 37 30 86 186 115 88 40 154 344 213 172 50 240 538 333 267 60 345 744 462 375 70 470 1013 628 510
One situation the Green Book does call out for additional stopping sight distance for
trucks is on downgrades. The Green Book states “Although the average truck driver tends to be
more experienced than the average passenger car driver … it is desirable under such conditions
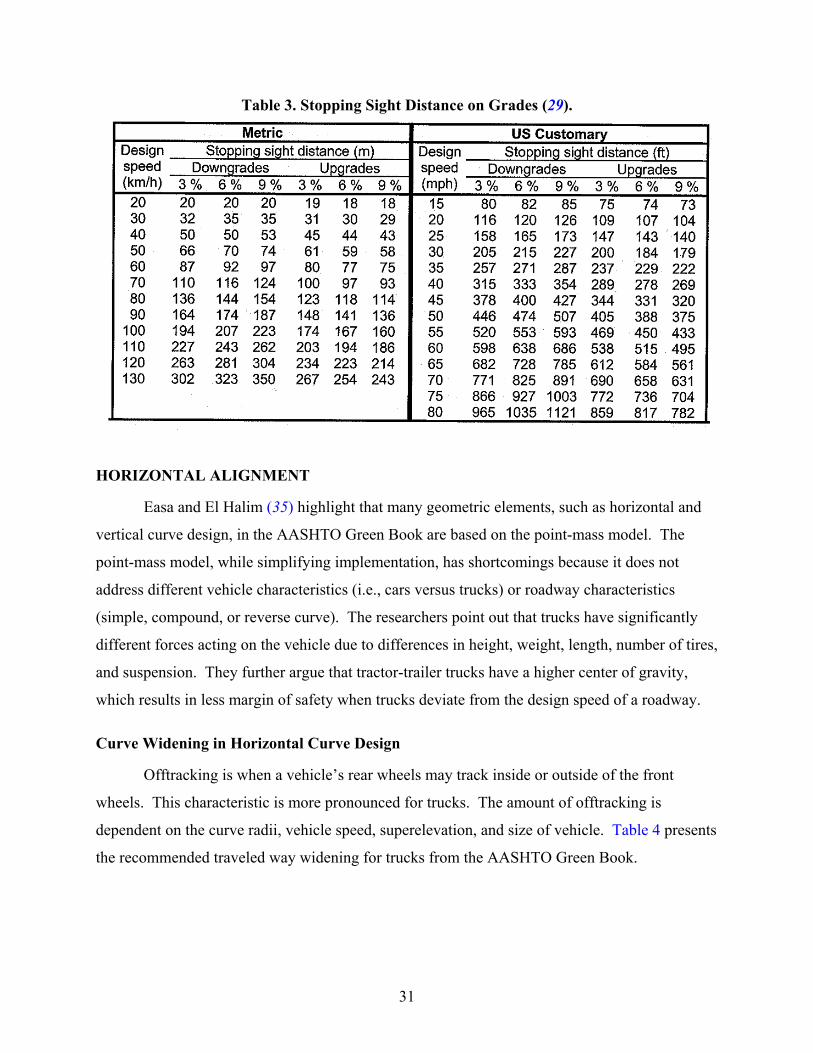
to provide stopping sight distances that exceed the values [in Table 2].” Table 3 shows the
stopping sight distance needed on downgrades from the AASHTO Green Book.
31
Table 3. Stopping Sight Distance on Grades (29).
HORIZONTAL ALIGNMENT
Easa and El Halim (35) highlight that many geometric elements, such as horizontal and
vertical curve design, in the AASHTO Green Book are based on the point-mass model. The
point-mass model, while simplifying implementation, has shortcomings because it does not
address different vehicle characteristics (i.e., cars versus trucks) or roadway characteristics
(simple, compound, or reverse curve). The researchers point out that trucks have significantly
different forces acting on the vehicle due to differences in height, weight, length, number of tires,
and suspension. They further argue that tractor-trailer trucks have a higher center of gravity,
which results in less margin of safety when trucks deviate from the design speed of a roadway.
Curve Widening in Horizontal Curve Design
Offtracking is when a vehicle’s rear wheels may track inside or outside of the front
wheels. This characteristic is more pronounced for trucks. The amount of offtracking is
dependent on the curve radii, vehicle speed, superelevation, and size of vehicle. Table 4 presents
the recommended traveled way widening for trucks from the AASHTO Green Book.

32
Table 4. Traveled Way Widening on Horizontal Curves (adapted from 29). Design Values for Pavement Widening on Highway Curves (ft)
Curve Radius
(ft)
24 ft 22 ft 20 ft Adj for
WB-100T
Adj for
WB-109D
Design Speed (mph) Design Speed (mph) Design Speed (mph) 30 40 50 60 30 40 50 60 30 40 50 60
7000 6500 2.0 0.1 0.3 6000 2.0 0.1 0.3 5500 2.1 0.1 0.4 5000 2.0 2.1 0.1 0.4 4500 2.1 2.2 0.1 0.5 4000 2.0 2.2 2.3 0.1 0.5 3500 2.1 2.3 2.4 0.1 0.6 3000 2.0 2.2 2.4 2.6 0.1 0.7 2500 2.2 2.4 2.6 2.8 0.1 0.8 2000 2.1 2.4 2.6 2.8 3.1 0.2 1.0 1800 2.0 2.2 2.5 2.8 3.0 3.2 0.2 1.1 1600 2.2 2.4 2.7 2.9 3.2 3.4 0.2 1.3 1400 2.1 2.4 2.6 2.8 3.1 3.4 3.6 0.2 1.5 1200 2.1 2.4 2.7 2.9 3.1 3.4 3.7 3.9 0.3 1.7 1000 2.0 2.4 2.4 2.7 3.0 3.4 3.4 3.7 4.0 4.4 0.3 2.0 900 2.0 2.3 2.6 3.0 3.3 3.6 4.0 4.3 0.4 2.3 800 2.2 2.6 2.9 3.2 3.6 3.9 4.2 4.6 0.4 2.6 700 2.2 2.6 3.0 3.2 3.6 4.0 4.2 4.6 5.0 0.5 2.9 600 2.7 3.1 3.5 3.7 4.1 4.5 4.7 5.1 5.5 0.6 3.4 500 3.3 3.7 4.3 4.7 5.3 5.7 0.7 4.1 450 3.7 4.1 4.7 5.1 5.7 6.1 0.7 4.6 400 4.2 4.7 5.2 5.7 6.2 6.7 0.8 5.1 350 4.8 5.3 5.8 6.3 6.8 7.3 1.0 5.9 300 5.6 6.6 7.6 1.1 6.9 250 6.8 7.8 8.8 1.4 8.3 200 8.5 9.5 10.5 1.7 10.5
Notes: Values shown are for WB-50 design vehicle; last two columns are adjustments beyond values Values less than 2.0 ft may be disregarded For 3-lane roadways, multiply above values by 1.5; for 4-lane roadways, multiply by 2.0
Reverse Curve Design
When designing reverse curves (31), consideration should be given to increasing the
minimum radii for curves and for inclusion of a tangent section between curves to accommodate
trucks. The vehicle dynamics of trucks make it more difficult to negotiate reverse curves.
Increasing the curve radius or inclusion of a tangent section between reverse curves
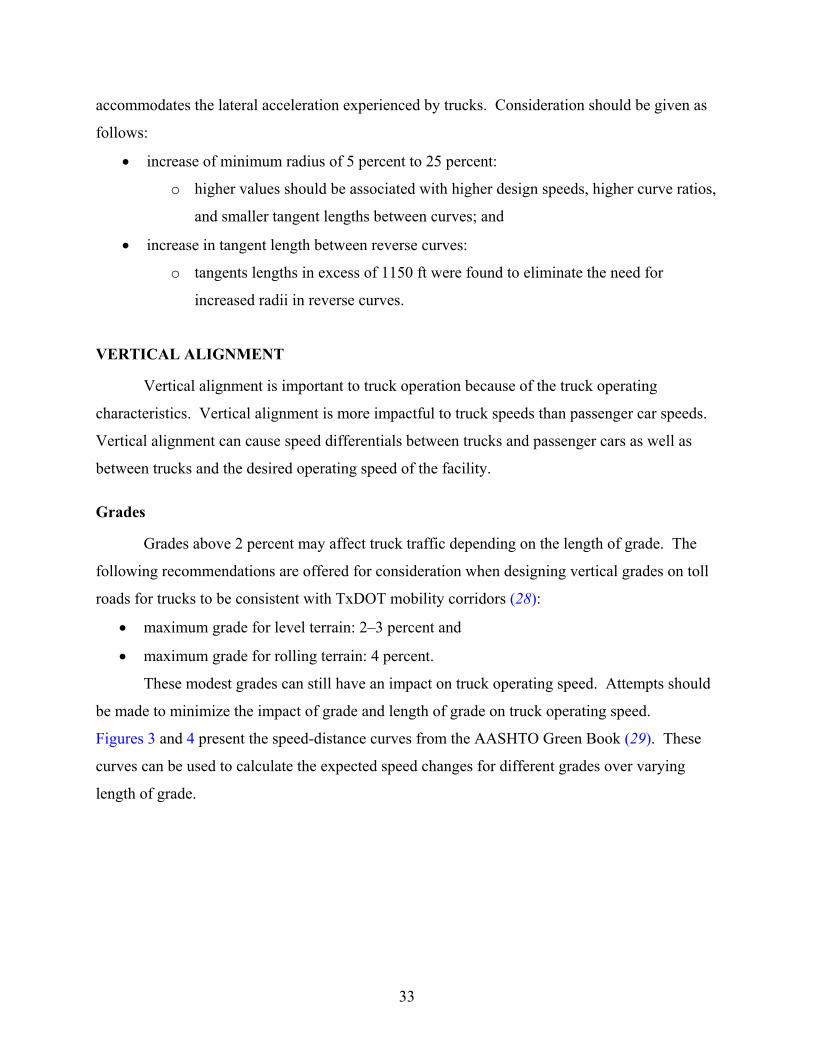
33
accommodates the lateral acceleration experienced by trucks. Consideration should be given as
follows:
• increase of minimum radius of 5 percent to 25 percent:
o higher values should be associated with higher design speeds, higher curve ratios,
and smaller tangent lengths between curves; and
• increase in tangent length between reverse curves:
o tangents lengths in excess of 1150 ft were found to eliminate the need for
increased radii in reverse curves.
VERTICAL ALIGNMENT
Vertical alignment is important to truck operation because of the truck operating
characteristics. Vertical alignment is more impactful to truck speeds than passenger car speeds.
Vertical alignment can cause speed differentials between trucks and passenger cars as well as
between trucks and the desired operating speed of the facility.
Grades
Grades above 2 percent may affect truck traffic depending on the length of grade. The
following recommendations are offered for consideration when designing vertical grades on toll
roads for trucks to be consistent with TxDOT mobility corridors (28):
• maximum grade for level terrain: 2–3 percent and
• maximum grade for rolling terrain: 4 percent.
These modest grades can still have an impact on truck operating speed. Attempts should
be made to minimize the impact of grade and length of grade on truck operating speed.
Figures 3 and 4 present the speed-distance curves from the AASHTO Green Book (29). These
curves can be used to calculate the expected speed changes for different grades over varying
length of grade.
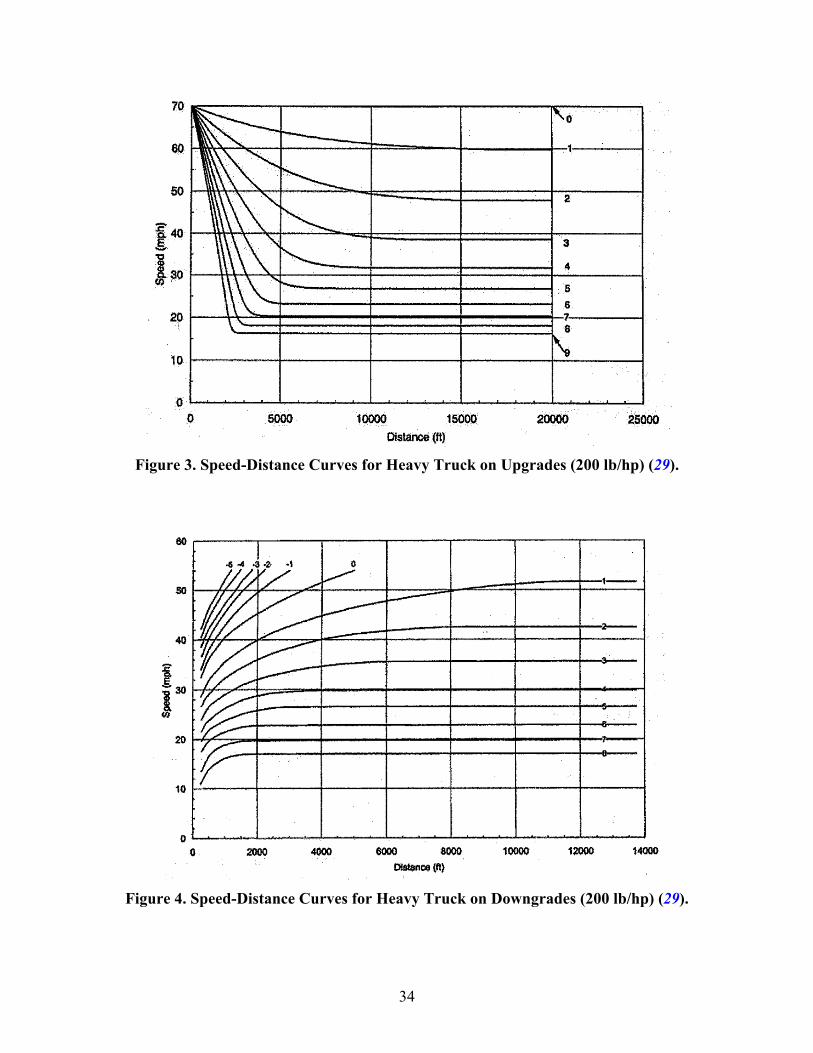
34
Figure 3. Speed-Distance Curves for Heavy Truck on Upgrades (200 lb/hp) (29).
Figure 4. Speed-Distance Curves for Heavy Truck on Downgrades (200 lb/hp) (29).
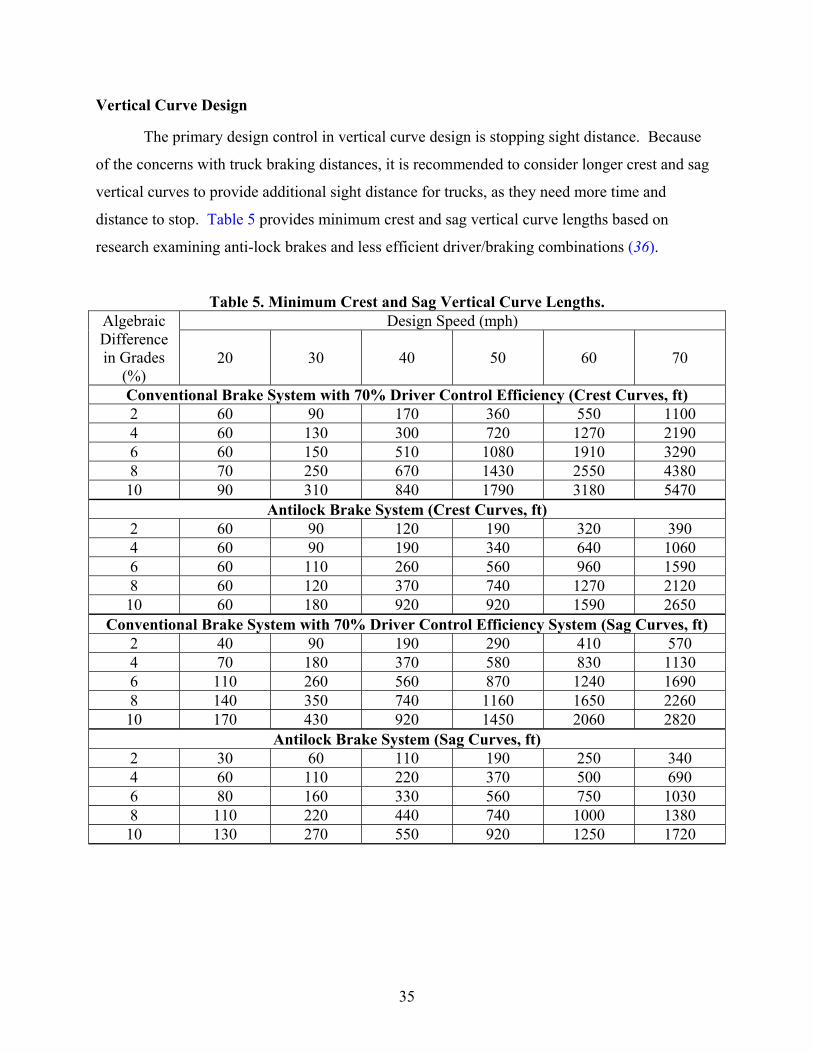
35
Vertical Curve Design
The primary design control in vertical curve design is stopping sight distance. Because
of the concerns with truck braking distances, it is recommended to consider longer crest and sag
vertical curves to provide additional sight distance for trucks, as they need more time and
distance to stop. Table 5 provides minimum crest and sag vertical curve lengths based on
research examining anti-lock brakes and less efficient driver/braking combinations (36).
Table 5. Minimum Crest and Sag Vertical Curve Lengths. Algebraic Difference in Grades
(%)
Design Speed (mph)
20 30 40 50 60 70
Conventional Brake System with 70% Driver Control Efficiency (Crest Curves, ft) 2 60 90 170 360 550 1100 4 60 130 300 720 1270 2190 6 60 150 510 1080 1910 3290 8 70 250 670 1430 2550 4380 10 90 310 840 1790 3180 5470
Antilock Brake System (Crest Curves, ft) 2 60 90 120 190 320 390 4 60 90 190 340 640 1060 6 60 110 260 560 960 1590 8 60 120 370 740 1270 2120 10 60 180 920 920 1590 2650
Conventional Brake System with 70% Driver Control Efficiency System (Sag Curves, ft) 2 40 90 190 290 410 570 4 70 180 370 580 830 1130 6 110 260 560 870 1240 1690 8 140 350 740 1160 1650 2260 10 170 430 920 1450 2060 2820
Antilock Brake System (Sag Curves, ft) 2 30 60 110 190 250 340 4 60 110 220 370 500 690 6 80 160 330 560 750 1030 8 110 220 440 740 1000 1380 10 130 270 550 920 1250 1720

36
CROSS SECTION
The cross section of a toll road or managed lane includes the traveled way, shoulders, and
roadside. The traveled way is the portion of the highway, toll road, or managed lane for the
movement of vehicles, exclusive of the shoulders. The roadway is the portion of a highway, toll
road, or managed lane, including shoulders, for vehicular use. The U.S. Department of
Transportation defines a toll road or managed lane positively separated from another highway
(i.e., concrete barrier or pylons) as a separate facility. Each facility should be designed to meet
design guidance on its own accordingly.
Lane Widths
Lane widths are critical for trucks driver’s comfort in operating larger vehicles. The
following recommendations are offered for consideration when designing mainlanes on toll
roads and managed lanes for comfortable truck operation: the minimum and usual mainlane
width should be 12 ft.
Shoulder Widths
Shoulders allow for emergency parking and disabled vehicles. Shoulder widths of 12 ft
should be used for facilities with high truck traffic demand (29). A common problem for trucks
operating on urban freeways is inadequate left shoulder widths for emergency stops. Trucks are
unable to completely clear the lane when inadequate shoulders are present, which requires
parking on the median or encroaching on the adjacent travel lane (37). The following
recommendations are offered for consideration when designing mainlanes on toll roads and
managed lanes for comfortable truck operation:
• The minimum inside shoulder widths should be 12 ft.
• The minimum outside shoulder widths should be 12 ft.
• Shoulders should be continuous and uniform.
RAMPS AND INTERCHANGES
A complete ramp system consists of the three interrelated parts: the ramp terminal with
the highway, the ramp proper, and the ramp terminal with the intersecting cross street or frontage
road. The Texas Roadway Design Manual states “there should be a definite relationship between
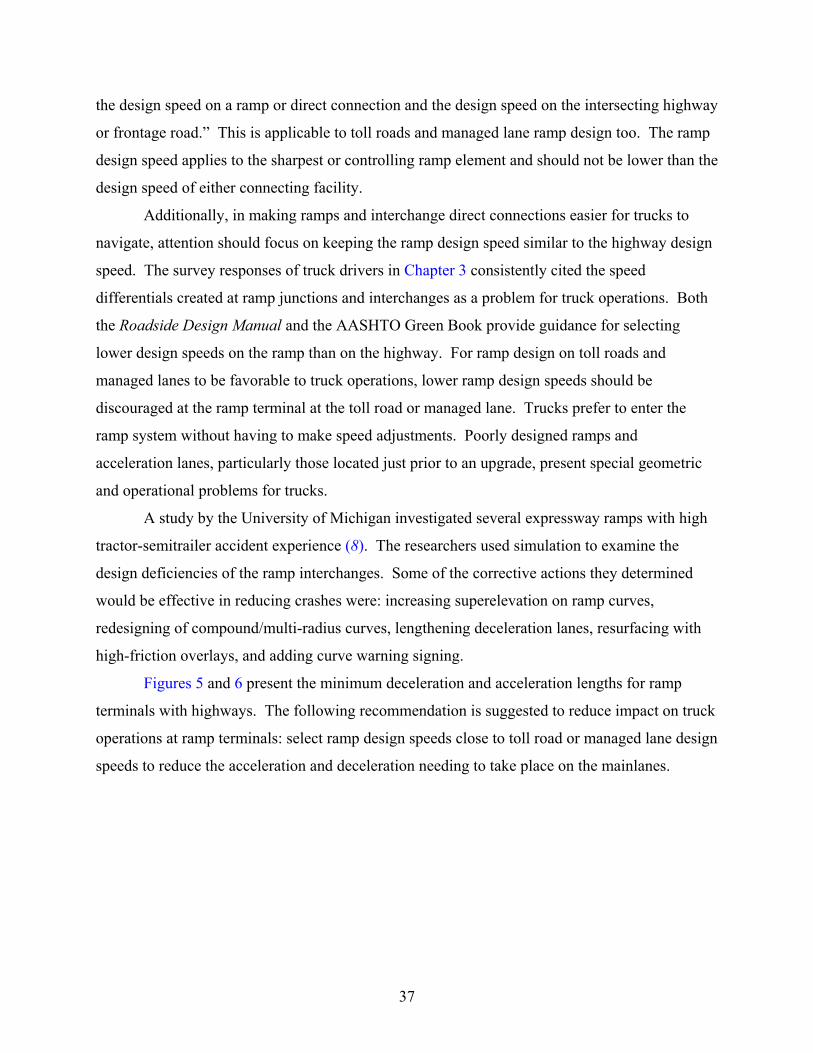
37
the design speed on a ramp or direct connection and the design speed on the intersecting highway
or frontage road.” This is applicable to toll roads and managed lane ramp design too. The ramp
design speed applies to the sharpest or controlling ramp element and should not be lower than the
design speed of either connecting facility.
Additionally, in making ramps and interchange direct connections easier for trucks to
navigate, attention should focus on keeping the ramp design speed similar to the highway design
speed. The survey responses of truck drivers in Chapter 3 consistently cited the speed
differentials created at ramp junctions and interchanges as a problem for truck operations. Both
the Roadside Design Manual and the AASHTO Green Book provide guidance for selecting
lower design speeds on the ramp than on the highway. For ramp design on toll roads and
managed lanes to be favorable to truck operations, lower ramp design speeds should be
discouraged at the ramp terminal at the toll road or managed lane. Trucks prefer to enter the
ramp system without having to make speed adjustments. Poorly designed ramps and
acceleration lanes, particularly those located just prior to an upgrade, present special geometric
and operational problems for trucks.
A study by the University of Michigan investigated several expressway ramps with high
tractor-semitrailer accident experience (8). The researchers used simulation to examine the
design deficiencies of the ramp interchanges. Some of the corrective actions they determined
would be effective in reducing crashes were: increasing superelevation on ramp curves,
redesigning of compound/multi-radius curves, lengthening deceleration lanes, resurfacing with
high-friction overlays, and adding curve warning signing.
Figures 5 and 6 present the minimum deceleration and acceleration lengths for ramp
terminals with highways. The following recommendation is suggested to reduce impact on truck
operations at ramp terminals: select ramp design speeds close to toll road or managed lane design
speeds to reduce the acceleration and deceleration needing to take place on the mainlanes.

38
Figure 5. Minimum Deceleration Lengths for Exit Terminals (28).
Figure 6. Minimum Acceleration Lengths for Entrance Terminals (28).

39
Entrance Ramps near Upgrades
Slowly accelerating vehicles often cause undesirable operations, possibly resulting in a
breakdown of the traffic flow. The following recommendations are offered for consideration
when designing an entrance ramp near vertical upgrades on toll roads: a ½-mile or more
separation is recommended between an entrance ramp and an upgrade hill (16).
RURAL TOLL ROADS
A two-lane rural toll road on SH 49 was constructed in 2007 in the TxDOT Tyler
District. This is the first segment of an “hour glass” loop that would surround the cities of Tyler
and Longview. For a facility such as SH 49, design considerations associated with a “Super 2
Highway” may be appropriate to improve capacity as traffic and truck demand increase. Some
of the key characteristics of a Super 2 Highway are (38):
• added passing lanes in one or both directions of travel to facilitate passing maneuvers,
• increased lane and shoulder widths to give motorists more space to recover from driver
error, and
• improved signing and marking to enhance the safety and efficiency of the roadway.
In the survey findings from Chapter 3, truck drivers wanted consistent operation and
traffic flow over the length of a facility. Two-lane rural toll roads can potentially experience
delays as traffic volumes increase and faster moving vehicles encounter slower moving vehicles.
To prevent congestion and delay on rural toll roads, passing lane length and frequency are
recommended from the “Super 2” design guidelines for two-lane roadways.
Table 6. Recommended Length and Spacing for Passing Lanes for Rural Toll Roads (38). ADT (vehicles per day) Recommended
Passing Lane Length (mi)
Recommended Distance
between Passing Lanes (mi)
Level Terrain Rolling Terrain
≤1950 ≤1650 0.8 – 1.1 9.0 – 11.0 2800 2350 0.8 – 1.1 4.0 – 5.0 3150 2650 1.2 – 1.5 3.8 – 4.5 3550 3000 1.5 – 2.0 3.5 – 4.0
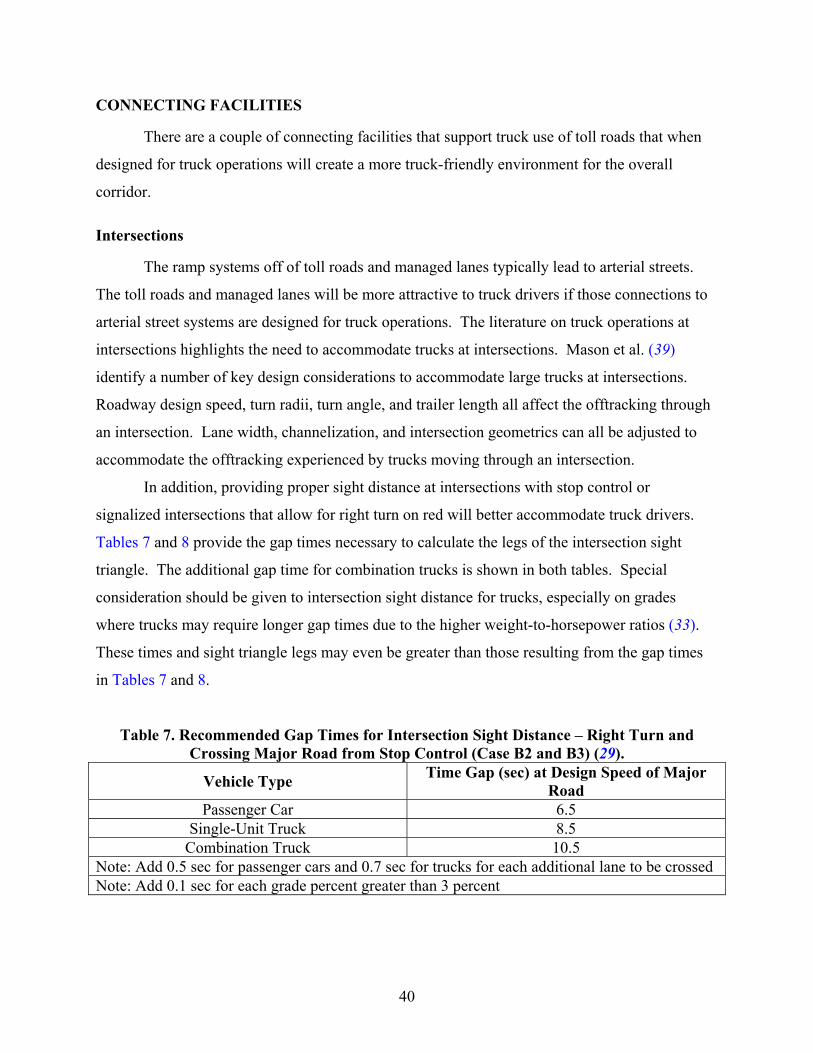
40
CONNECTING FACILITIES
There are a couple of connecting facilities that support truck use of toll roads that when
designed for truck operations will create a more truck-friendly environment for the overall
corridor.
Intersections
The ramp systems off of toll roads and managed lanes typically lead to arterial streets.
The toll roads and managed lanes will be more attractive to truck drivers if those connections to
arterial street systems are designed for truck operations. The literature on truck operations at
intersections highlights the need to accommodate trucks at intersections. Mason et al. (39)
identify a number of key design considerations to accommodate large trucks at intersections.
Roadway design speed, turn radii, turn angle, and trailer length all affect the offtracking through
an intersection. Lane width, channelization, and intersection geometrics can all be adjusted to
accommodate the offtracking experienced by trucks moving through an intersection.
In addition, providing proper sight distance at intersections with stop control or
signalized intersections that allow for right turn on red will better accommodate truck drivers.
Tables 7 and 8 provide the gap times necessary to calculate the legs of the intersection sight
triangle. The additional gap time for combination trucks is shown in both tables. Special
consideration should be given to intersection sight distance for trucks, especially on grades
where trucks may require longer gap times due to the higher weight-to-horsepower ratios (33).
These times and sight triangle legs may even be greater than those resulting from the gap times
in Tables 7 and 8.
Table 7. Recommended Gap Times for Intersection Sight Distance – Right Turn and Crossing Major Road from Stop Control (Case B2 and B3) (29).
Vehicle Type Time Gap (sec) at Design Speed of Major Road
Passenger Car 6.5 Single-Unit Truck 8.5
Combination Truck 10.5 Note: Add 0.5 sec for passenger cars and 0.7 sec for trucks for each additional lane to be crossed Note: Add 0.1 sec for each grade percent greater than 3 percent
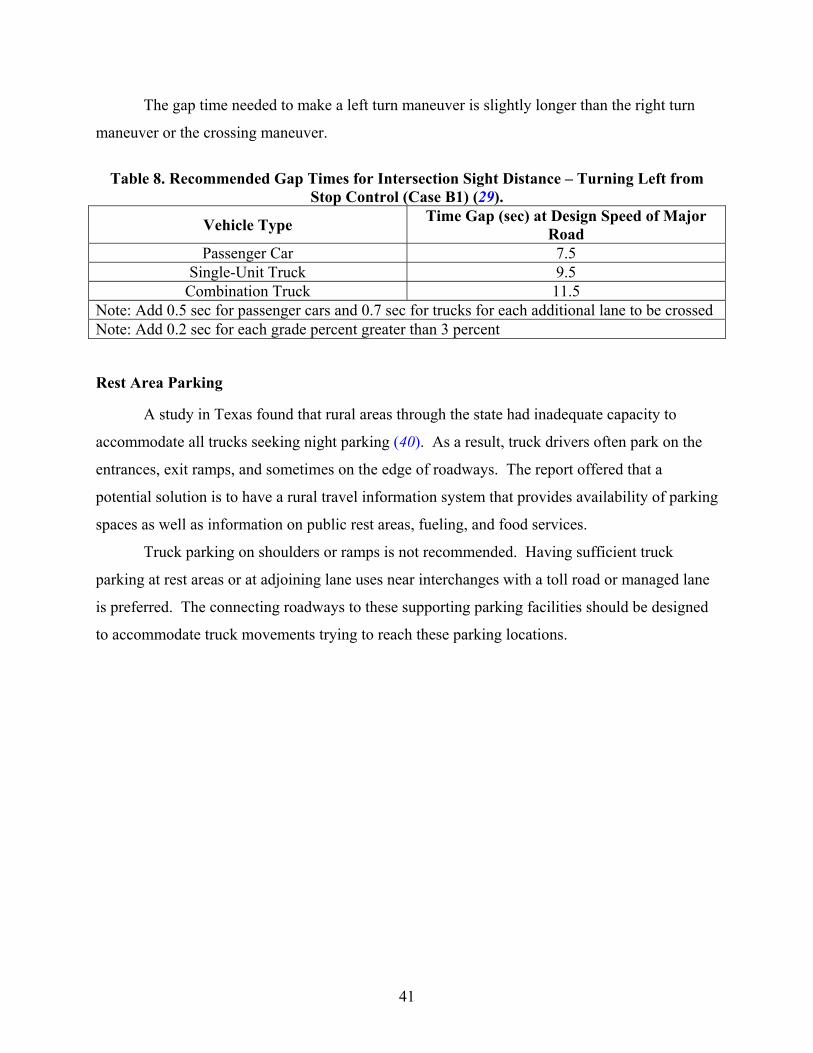
41
The gap time needed to make a left turn maneuver is slightly longer than the right turn
maneuver or the crossing maneuver.
Table 8. Recommended Gap Times for Intersection Sight Distance – Turning Left from
Stop Control (Case B1) (29).
Vehicle Type Time Gap (sec) at Design Speed of Major Road
Passenger Car 7.5 Single-Unit Truck 9.5
Combination Truck 11.5 Note: Add 0.5 sec for passenger cars and 0.7 sec for trucks for each additional lane to be crossed Note: Add 0.2 sec for each grade percent greater than 3 percent
Rest Area Parking
A study in Texas found that rural areas through the state had inadequate capacity to
accommodate all trucks seeking night parking (40). As a result, truck drivers often park on the
entrances, exit ramps, and sometimes on the edge of roadways. The report offered that a
potential solution is to have a rural travel information system that provides availability of parking
spaces as well as information on public rest areas, fueling, and food services.
Truck parking on shoulders or ramps is not recommended. Having sufficient truck
parking at rest areas or at adjoining lane uses near interchanges with a toll road or managed lane
is preferred. The connecting roadways to these supporting parking facilities should be designed
to accommodate truck movements trying to reach these parking locations.


43
CHAPTER 5: TRAFFIC OPERATIONS/ENGINEERING FACTORS
Traffic operations and traffic engineering techniques that can improve traffic flow and
safety are potential factors that can increase the attractiveness of toll roads or managed lanes to
truck drivers. This chapter highlights some of the current design practice and some emerging
practices that will improve truck operations on toll roads and managed lanes.
DESIGN FOR OPERATIONAL ANALYSIS
For operational analysis of uninterrupted flow on highways, toll roads, and managed
lanes, vehicles are classified as passenger cars and trucks. Trucks are commonly defined as all
buses, single-unit trucks, combination trucks, and recreational vehicles. For traffic-classification
purposes, trucks are normally defined as those vehicles having manufacturer’s gross vehicle
weight ratings of 9000 lb or more and having dual tires on at least one rear axle. Designing for
trucks should not be oversimplified to one truck classification. With increased truck volumes and
larger combination vehicles, it is important to examine the full range of vehicle characteristics
for the trucks expected on a facility.
For the purpose of design, the percentage of trucks in the traffic stream during the peak
hours should be used in the operational analysis. The percentage of trucks may vary considerably
during a particular hour of the day (29). It is advisable, therefore, to count trucks for several
peak hours that are considered representative of the design hour. At intersections, the truck
percentage during the morning peak period may be considerably different than the truck
percentage during the evening peak period (29).
SIGNING
Truck drivers repeatedly mentioned the importance of signing and sign condition in good
highway design. In addition to proper guide and regulatory signing, proper warning signing is
recommended to alert truck drivers of situations needing their attention. Because of the issues
raised with truck difficulty in negotiating curves and ramp systems, dual curve warning signing
may be a positive treatment. Examples of dual speed warning signs for trucks are shown in
Figures 7 and 8. Figure 7 provides an example of a gantry mounted sign with good visibility
from all lanes of traffic. Figure 8 shows an example of a ground mounted sign on the edge of an
elevated section of roadway.
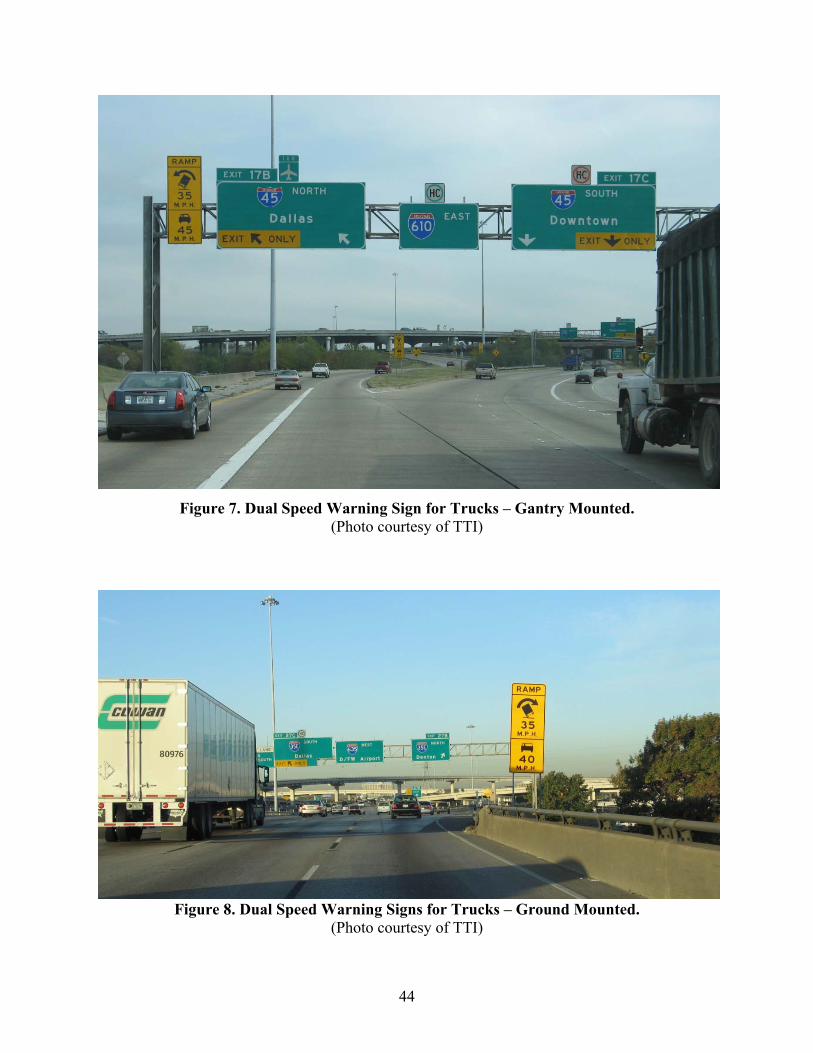
44
Figure 7. Dual Speed Warning Sign for Trucks – Gantry Mounted.
(Photo courtesy of TTI)
Figure 8. Dual Speed Warning Signs for Trucks – Ground Mounted.
(Photo courtesy of TTI)
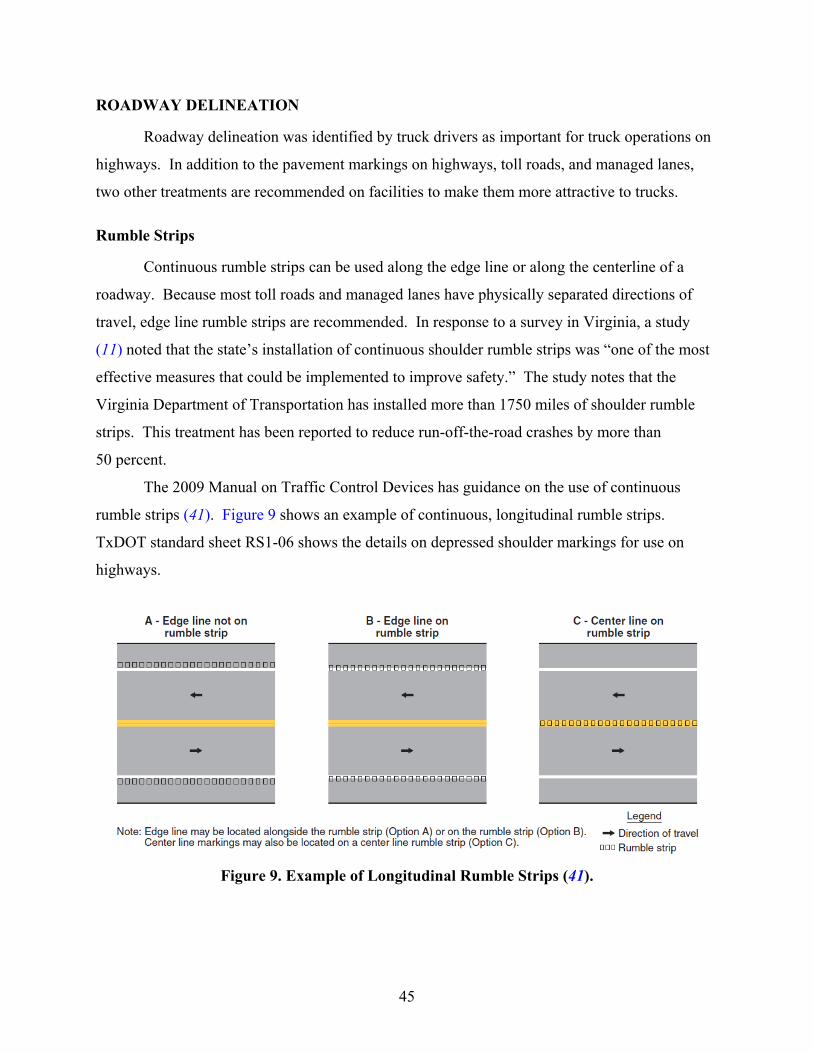
45
ROADWAY DELINEATION
Roadway delineation was identified by truck drivers as important for truck operations on
highways. In addition to the pavement markings on highways, toll roads, and managed lanes,
two other treatments are recommended on facilities to make them more attractive to trucks.
Rumble Strips
Continuous rumble strips can be used along the edge line or along the centerline of a
roadway. Because most toll roads and managed lanes have physically separated directions of
travel, edge line rumble strips are recommended. In response to a survey in Virginia, a study
(11) noted that the state’s installation of continuous shoulder rumble strips was “one of the most
effective measures that could be implemented to improve safety.” The study notes that the
Virginia Department of Transportation has installed more than 1750 miles of shoulder rumble
strips. This treatment has been reported to reduce run-off-the-road crashes by more than
50 percent.
The 2009 Manual on Traffic Control Devices has guidance on the use of continuous
rumble strips (41). Figure 9 shows an example of continuous, longitudinal rumble strips.
TxDOT standard sheet RS1-06 shows the details on depressed shoulder markings for use on
highways.
Figure 9. Example of Longitudinal Rumble Strips (41).
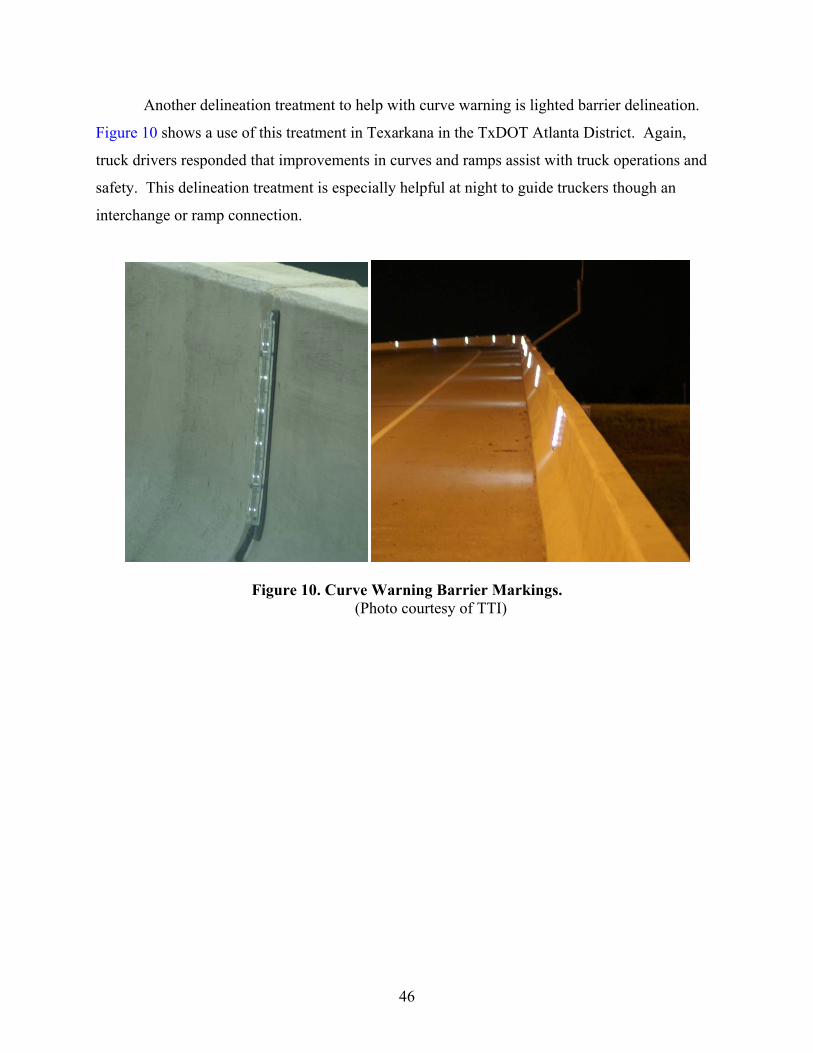
46
Another delineation treatment to help with curve warning is lighted barrier delineation.
Figure 10 shows a use of this treatment in Texarkana in the TxDOT Atlanta District. Again,
truck drivers responded that improvements in curves and ramps assist with truck operations and
safety. This delineation treatment is especially helpful at night to guide truckers though an
interchange or ramp connection.
Figure 10. Curve Warning Barrier Markings. (Photo courtesy of TTI)
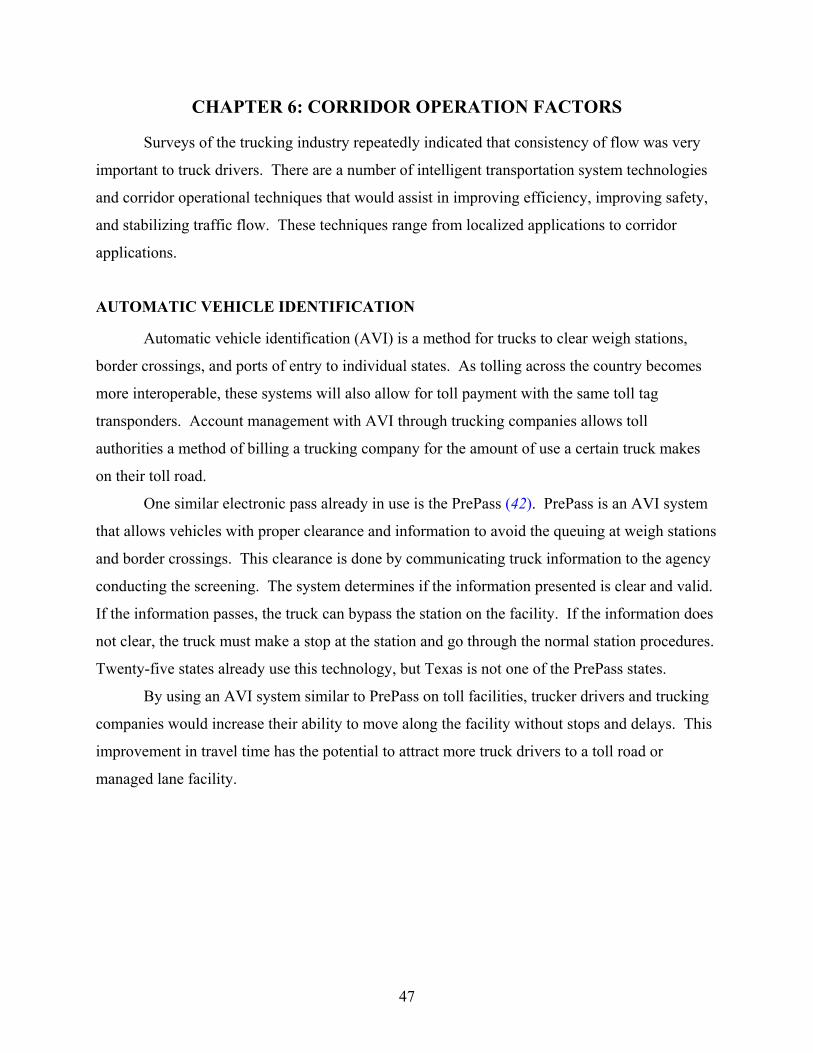
47
CHAPTER 6: CORRIDOR OPERATION FACTORS
Surveys of the trucking industry repeatedly indicated that consistency of flow was very
important to truck drivers. There are a number of intelligent transportation system technologies
and corridor operational techniques that would assist in improving efficiency, improving safety,
and stabilizing traffic flow. These techniques range from localized applications to corridor
applications.
AUTOMATIC VEHICLE IDENTIFICATION
Automatic vehicle identification (AVI) is a method for trucks to clear weigh stations,
border crossings, and ports of entry to individual states. As tolling across the country becomes
more interoperable, these systems will also allow for toll payment with the same toll tag
transponders. Account management with AVI through trucking companies allows toll
authorities a method of billing a trucking company for the amount of use a certain truck makes
on their toll road.
One similar electronic pass already in use is the PrePass (42). PrePass is an AVI system
that allows vehicles with proper clearance and information to avoid the queuing at weigh stations
and border crossings. This clearance is done by communicating truck information to the agency
conducting the screening. The system determines if the information presented is clear and valid.
If the information passes, the truck can bypass the station on the facility. If the information does
not clear, the truck must make a stop at the station and go through the normal station procedures.
Twenty-five states already use this technology, but Texas is not one of the PrePass states.
By using an AVI system similar to PrePass on toll facilities, trucker drivers and trucking
companies would increase their ability to move along the facility without stops and delays. This
improvement in travel time has the potential to attract more truck drivers to a toll road or
managed lane facility.

48
Figure 11. Example of Automatic Vehicle Identification (42).
INTELLIGENT TRANSPORTATION SYSTEMS
Intelligent transportation systems offer improved truck operation through transportation
management strategies. ITS offers the collection of real-time data and communication of that
information to operating agencies and users of the system.
Active Curve Warning System for Trucks
An example of an application applied to trucks at interchanges and ramp junctions is
active curve warning signs. The active aspect of this application is the use of real-time speed and
vehicle classification data approaching a curve. The safe speed for different vehicles is known
by the system. If the system detects a vehicle, for example a truck, approach the curve too fast, it
can set off the warning lights to alert the driver. This type of application is more effective
because the warning is targeted at only the drivers that are entering a potentially hazardous
situation. Figure 12 shows an example of this type of system in Houston, Texas.
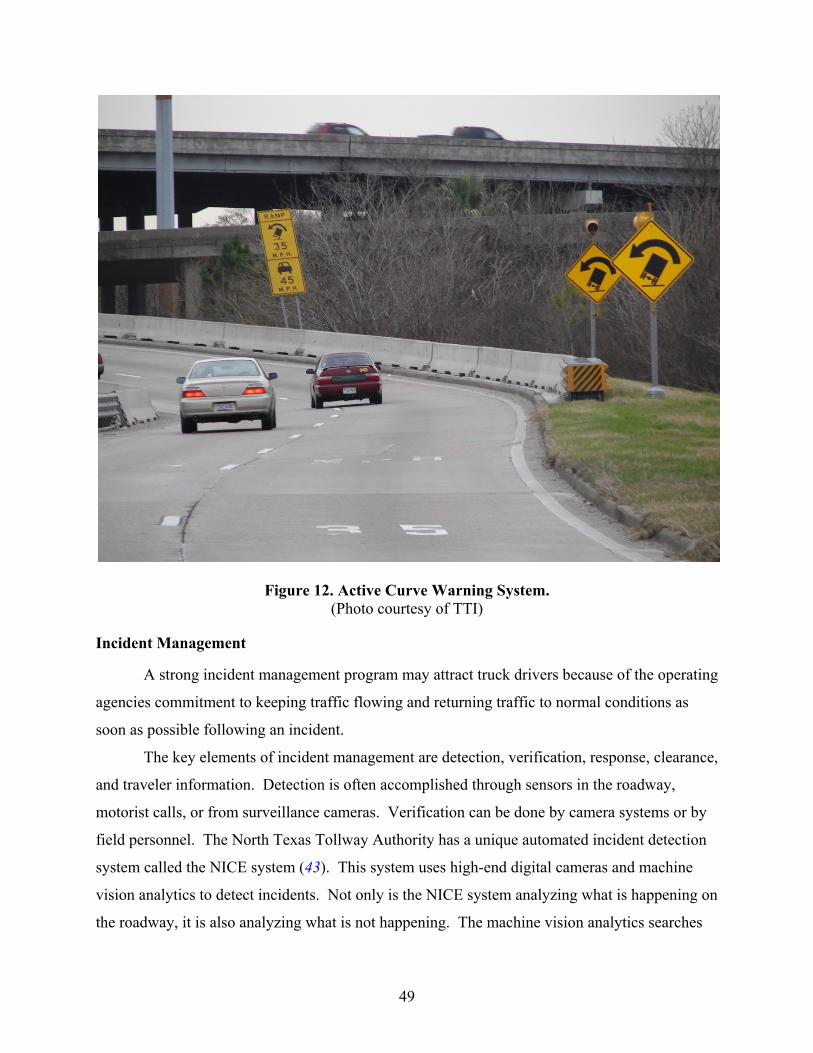
49
Figure 12. Active Curve Warning System. (Photo courtesy of TTI)
Incident Management
A strong incident management program may attract truck drivers because of the operating
agencies commitment to keeping traffic flowing and returning traffic to normal conditions as
soon as possible following an incident.
The key elements of incident management are detection, verification, response, clearance,
and traveler information. Detection is often accomplished through sensors in the roadway,
motorist calls, or from surveillance cameras. Verification can be done by camera systems or by
field personnel. The North Texas Tollway Authority has a unique automated incident detection
system called the NICE system (43). This system uses high-end digital cameras and machine
vision analytics to detect incidents. Not only is the NICE system analyzing what is happening on
the roadway, it is also analyzing what is not happening. The machine vision analytics searches
50
for elements in the field of view that do not move. In a high-speed roadway environment, this
identified stalled vehicles, debris in the roadway, and other potential incidents.
Ballard (44) researched incident management for managed lanes under a previous
TxDOT research project. Many of the recommendations from that study are applicable for
developing an incident management program to support toll roads. The key recommendations to
establishing an effective incident management program are as follows:
• Use well coordinated, multi-response teams that combine traffic management, fire,
emergency response, and police enforcement;
• Stage proper equipment for responding to truck incidents; this includes proper tow trucks
on-site or nearby that can handle the truck size and combinations using the toll road or
managed lane;
• Create a safe work area at the incident scene;
• Provide response vehicle access, including median openings and breaks in barriers
separating toll roads or managed lanes from general purpose facilities;
• Plan for diversions to connection facilities, including crossovers or truck turnarounds if
trucks need to be routed onto opposing lanes to return an interchange to access the
highway network; and
• Provide good traveler information, including adequate advance notification to prevent
drivers from encountering unexpected congestion as well as timely information on when
an incident is cleared and roadway conditions have returned to normal.
ACTIVE TRAFFIC MANAGEMENT
Active traffic management is the latest evolution of managing corridors to improve
operational efficiency and safety. While the exact definition of active traffic management is
evolving, the fundamental concept is to use technology and transportation operational tools to
pro-actively manage a corridor. Some early active traffic management systems have been
deployed in Europe, but there are several pilot projects being developed in the United States.
Some of the key elements of active traffic management are described in the following sections.
Speed Harmonization/Speed Management
Speed harmonization or management has been in use in Germany since the 1970s and is
geared toward improving traffic flow based on prevailing conditions. Similar installations are in

51
operation in The Netherlands and England on various roadway sections with high traffic
volumes. A typical installation of speed harmonization monitors traffic volumes and weather
conditions along the roadway. If sudden disturbances occur in the traffic flow—such as with an
incident or building congestion—the system modifies the speed limits accordingly, providing
users with the quickest possible warning that roadway conditions are changing (45). The
deployment of the speed harmonization is automatic and begins immediately upstream of the
congestion point. The system incrementally decreases speeds upstream in a cascading manner to
smooth the deceleration of the traffic and help ensure more uniform behavior. Potential benefits
of speed harmonization include:
• an increase in throughput,
• a decrease in primary incidents,
• a decrease in incident severity,
• more uniform speeds,
• a decrease in headways,
• more uniform driver behavior,
• an increase in trip reliability,
• a delay in the onset of freeway breakdown,
• a reduction in traffic noise,
• a reduction in emissions, and
• a reduction in fuel consumption (46).
Queue Warning
A major addition to the speed harmonization system is the queue warning system, which
is in operation in Germany and The Netherlands. Integrated with the speed harmonization
gantries, this system involves displaying a congestion pictograph on each side of the speed
harmonization gantry indicating congestion ahead. In other installations, this congestion
pictograph may be displayed on an overhead dynamic message sign or drivers may be alerted
with flashing lights displayed with the speed limit signs. This warning system is intended to help
reduce the occurrence of secondary incidents caused by either recurrent or nonrecurring
congestion. It is typically deployed to indicate lane closures near incidents and work zones and
to provide queue tail warning and protection in known bottleneck locations (47). The system
52
typically begins reducing speeds between three and four gantries before an incident (48).
Potential benefits of a queue warning system include:
• a decrease in primary incidents,
• a decrease in secondary incidents,
• a decrease in incident severity,
• more uniform speeds,
• a decrease in headways,
• more uniform driver behavior,
• an increase in trip reliability,
• a reduction in traffic noise,
• a reduction in emissions, and
• a reduction in fuel consumption (46).
Temporary Shoulder Use and Speed Harmonization
Temporary shoulder use is a congestion management strategy typically deployed in
conjunction with speed harmonization to address capacity bottlenecks on the freeway network.
The strategy—known in Germany as temporary hard shoulder use and known in The
Netherlands as hard shoulder running or the rush hour lane—provides additional capacity during
times of congestion and reduced travel speeds. The use of the right shoulder during peak travel
periods has been used in Germany since the 1990s (49). When travel speeds are reduced, signs
indicate that travel on the shoulder is permitted. A complete series of traffic signs indicates
operations related to temporary shoulder use, including one with a supplemental speed limit
indication (used when overhead gantries are not present). These signs and the overhead lane
messages are blank when travel on the shoulder is not permitted. Temporary shoulder use is
permitted only when speed harmonization is active and speed limits are reduced. In addition to
allowing temporary use of the right shoulder, the Dutch also deploy the use of traveling on a
dynamic lane on the median side of the roadway. Also known as the plus lane, a narrow extra
lane provided by reconstructing the existing roadway while keeping the hard shoulder open for
travel use when traffic volumes reach levels that indicate congestion is growing (47).
Generally, implementation of temporary shoulder use is at the discretion of the traffic
management center operator, although traffic volumes help determine the need for the strategy.

53
A typical installation in Europe incorporates a number of unique roadway features, which can
include:
• lightweight gantries,
• lane control signals,
• dynamic speed limit signals,
• dynamic message signs,
• digital enforcement technology,
• closed-circuit television cameras,
• enhanced lighting,
• roadway sensors,
• emergency roadside telephones,
• hard shoulder running, and
• emergency refuge (50).
Operation of the system is handled by the regional control center, with operators on hand
to monitor the system and initiate the modified operations as necessary. Specifically, operators
use closed-circuit televisions (CCTVs) mounted on light sign gantries or separately to check for
incidents and stalled vehicles in the shoulder before activating the system. Potential benefits of a
queue warning system include:
• an increase in throughput,
• an increase in capacity,
• an increase in trip reliability, and
• a delay in the onset of freeway breakdown (46).
Dynamic Lane Assignment
A variation of the temporary shoulder use—known as junction control in Germany—is a
form of dynamic lane assignment (51). Typically, the concept is applied at entrance ramps or
merge points where the number of downstream lanes is fewer than upstream lanes. The typical
U.S. application to this geometric condition would be a lane drop for one of the outside lanes or a
merge of two inside lanes, both of which are static treatments (52). The German dynamic
solution is to install lane control signals over both upstream approaches before the merge,
provide priority to the facility with the higher volume, and give a lane drop to the lesser volume

54
roadway or approach (52). This is particularly effective when implemented with temporary
shoulder use at on-ramp locations where bottlenecks frequently form. Potential benefits of
dynamic lane assignment as it relates to merge points include:
• an increase in throughput,
• an increase in capacity,
• a decrease in primary incidents,
• more uniform speeds,
• more uniform driver behavior,
• an increase in trip reliability,
• a delay in the onset of freeway breakdown,
• a reduction in traffic noise,
• a reduction in emissions, and
• a reduction in fuel consumption (46).
55
CHAPTER 7: CONCLUSIONS AND RECOMMENDATIONS
Truck use of toll roads and managed lanes may be important in many transportation
networks to separate vehicle movements and increase the overall mobility of a corridor. If toll
roads and managed lanes can be constructed to better serve truck operations and increase safety
for truck drivers, then these facilities will be more attractive to the trucking industry. Truck use
of toll roads or managed lanes could also result in a number of benefits for both the trucking
industry and the motoring public. Some of the benefits that may be realized are:
• a reduction in truck travel times, improving freight movement efficiency;
• more predictable travel times, allowing expansion of just-in-time delivery options;
• an improvement in domestic and international competitiveness;
• maintenance of consumer goods pricing;
• a reduction in truck idle time due to congestion, which would reduce fuel consumption
and improve air quality;
• an improvement in facility capacity by removing many trucks from the general purpose
lanes and making better use of toll or managed lanes;
• a reduction in incident impacts (fewer lanes blocked, easier to access and clear) by
concentrating trucks to a designated lane;
• a reduction in pavement rehabilitation costs by concentrating heavy loads in a single lane
(i.e., only a single lane would have to be rehabilitated and this lane could eventually be
reconstructed for additional strength); and
• a more comfortable driving environment for those intimidated by driving near trucks.
Based on a review of existing research and project implementations, there are several
design, operation, and technology improvements that can be incorporated into the design of toll
roads and managed lanes that would improve truck operation and safety. The following
recommendations are made for consideration by engineers designing toll road or managed lane
facilities.

56
GEOMETRIC DESIGN RECOMMENDATIONS
The following geometric design recommendations are made for consideration by
highway designers focused on the design of toll roads and managed lanes to accommodate
trucks:
• Thoughtfully select design speed for mainlane roadways, ramps, and interchanges;
• Use low maximum grades on vertical alignment;
• Include climbing lanes to minimize truck loss of speed and potential speed differentials;
• Avoid use of long downgrades;
• Increase the lengths of vertical curves to increase sight distance for truck drivers;
• Lengthen acceleration lanes from entrance ramps to provide trucks adequate space to
reach mainline design speeds;
• Lengthen deceleration lanes to exit ramps to allow trucks to fully exit before decrease
speeds from mainline design speeds;
• Use larger radii on curves in ramp systems to better account for vehicle dynamics of
trucks negotiating multi-curve ramp systems;
• Consistently provide full 12-ft travel lanes;
• Use adequate lane widening in horizontal curves;
• Consistently provide full 12-ft shoulders for truck use;
• Provide adequate parking at rest areas and connecting facilities; and
• Provide adequate curve radii, curb return radii, and storage for left-turn and right-turn
lanes at intersections at the end of ramps from toll roads or managed lanes.
TRAFFIC OPERATION RECOMMENDATIONS
The following traffic engineering and transportation operational recommendations are
made for consideration by highway designers focused on the design of toll roads and managed
lanes:
• Give proper consideration of the truck demand and truck classes expected to use a toll
road or managed lane;
• Use static dual speed curve warning signs to alert truck drivers to the appropriate speed in
negotiating ramps and direction connections;

57
• Provide informational signing and variable message signing in proper placement for
better visibility for large trucks;
• Use continuous, longitudinal rumble strips to assist in alerting truck drivers to the edge
lines of traveled ways; and
• Use barrier curve delineation systems on curves needing special attention from truck
drivers to negotiating ramps and direct connections.
SYSTEM AND ITS RECOMMENDATIONS
The following corridor management and intelligent transportation system
recommendations are made for consideration by highway designers focused on the design of toll
roads and managed lanes:
• Explore automatic vehicle identification technology for trucks in Texas to be
interoperable with other systems in North America;
• Install active curve warning systems for truck drivers to warn of approach speeds
exceeding the design speed of ramps and direct connections;
• Provide a comprehensive, coordinated incident management program that can respond to
truck incidents and can minimize the impact of incidents on traffic flow;
• Consider active traffic management techniques to proactively manage traffic flow on
corridors for more stable and reliable operation; and
• Use ITS technologies to manage traffic flow and communicate unexpected delays to all
users of a facility.
FURTHER RESEARCH NEEDS
This project has identified a number of research studies that have examined geometric
design and traffic operations related to truck characteristics. A valuable effort going forward
would be a synthesis of which research findings have been incorporated into the national and
Texas geometric design guides. Some of the research dating back 10 to 20 years can now be
found in the 2004 edition of the AASHTO Green Book and the 2006 edition of the Texas
Roadway Design Guide. However, some research findings have not been incorporated and
newer research is now emerging that should be considered in future editions.

58
This project did not administer the survey included in the appendix. There would be
value in specifically asking truck drivers and truck company owners and operators about the
geometric design and traffic engineering factors that impact their operation. Few past studies set
out to measure the trucking industry’s attitudes on geometric design and traffic operations.

59
CHAPTER 8: REFERENCES
REPORT REFERENCES
1. Strategies for Managing Increasing Truck Traffic, NCHRP Synthesis 314, Transportation Research Board, Washington, D.C., 2003.
2. Poole, R.W., It’s Time for a Goods-Movement Interstate System, The Reason Foundation, Los Angeles, CA, 2006.
3. Federal Motor Carrier Safety Administration, Large Truck and Bus Crash Facts 2007, U.S. Department of Transportation, January 2009.
4. Harkey, D.L., F.M. Council, and C.V. Zegeer, “Operational Characteristics of Longer Combination Vehicles and Related Geometric Design Issues,” Transportation Research Record 1523, Transportation Research Board, Washington, D.C., 1996.
5. Harwood, D.W., W.D. Glauz, and L. Elefteriadou, “Roadway Widening Costs for Geometric Design Improvements to Accommodate Potential Larger Trucks,” Transportation Research Record 1658. Transportation Research Board, Washington, D.C., 1999.
6. Glines, C., Ed., “Rollovers & Jackknives: Study Reveals Ramp Design Often the Cause,” Commercial Carrier Journal, Vol. 143, No. 12, December 1986, pp. 50–52. Chilton Company, Radnor, PA, 1986.
7. Tom, G.K.J., and H.K. Fong, A Case Study of Truck Merging Operations at Selected Freeway On-Ramp Locations in California. Report FHWA/CA/TO-96/15. Federal Highway Administration, Washington, D.C., 1997.
8. Ervin, R.D., “Effects of Expressway Ramps on Control of Tractor-Semitrailers.” UMTRI Research Review, Vol. 16, No. 4, January 1986, pp. 1–15. University of Michigan Transportation Research Institute, Ann Arbor, MI, 1986.
9. Perera, H.S., H.E. Ross, and G.T. Humes, “Methodology for Estimating Safe Operating Speeds for Heavy Trucks and Combination Vehicles on Interchange Ramps.” Transportation Research Record 1280. Transportation Research Board, Washington, D.C., 1990.
10. Yarbrough, T.M., Accommodating Truck Traffic on Texas Highways: Survey Results, Research and Technology Implementation Office, Texas Department of Transportation, 2001.
11. Fontaine, M.D., Engineering and Technology Measures to Improve Large Truck Safety: State of the Practice in Virginia, Technical Assistance Report, Virginia Transportation Research Council, Charlottesville, Virginia, 2003.
12. Agent, K.R., and J.G. Pigman, Investigation of the Impact of Large Trucks on Interstate Highway Safety, KTC-02-5/SPR248-02-1F, Kentucky Transportation Center, University of Kentucky, 2002.
13. Federal Highway Administration. Feasibility of Exclusive Facilities for Cars and Trucks, Final Report. Washington, D.C. 1990.
14. Samuel, P., R.W. Poole, Jr., and J. Holguin-Veras, Toll Truckways: A New Path Toward Safer and More Efficient Freight Transportation, Policy Study 294. Reason Public Policy Institute. Los Angeles, California. 2002.
60
15. Holguin-Veras, J., D. Sackey, S. Hussain, and V. Ochieng, “Economic and Financial Feasibility of Truck Toll Lanes,” Transportation Research Record No. 1833. Transportation Research Board, Washington, D.C. 2003.
16. Middleton, D., and S. Venglar, “Operational Aspects of Exclusive Truck Roadways,” 85th Annual Transportation Research Board Meeting Conference Proceedings, Washington, D.C., 2006.
17. Trowbridge, A., D.H. Nam, F.L. Mannering, and J. Carson, The Potential for Freight Productivity Improvements along Urban Corridors. Research Report WA-RD-415.1. Washington State Transportation Center. Seattle, Washington. 1996.
18. Taylor, P., California State Route 60 Truck Lane Study. Southern California Association of Governments. Sacramento, California. 2001.
19. Reich, S.L., J.L. Davis, A.J. Ferraro, and M. Catala, “Exclusive Facilities for Trucks in Florida: An Investigation of the Potential for Reserved Truck Lanes and Truckways on the State Highway System,” Proceedings of the Mid-continent Transportation Research Symposium. Ames, Iowa. 2003.
20. HOT and TOT Feasibility Studies for the Atlanta Region, Parsons, Brinkerhoff, Quade, and Douglas, Georgia Department of Transportation. Atlanta, Georgia, 2005.
21. Meeting minutes from Bill Webb’s Presentation to Texas Motor Transportation Association, Texas Transportation, Institute, September 28, 2005.
22. Zhou, L., M.W. Burris, and R.T. Baker, “The Impact of Incentives on Toll Road Use by Trucks,” Compendium of Papers, Transportation Research Board, Washington, D.C., 2009.
23. Roth, D., Presentation at the International Symposium on Road Pricing, Transportation Research Board, Key Biscayne, Florida, 2003.
24. Wolshon, B., and A. Ciprian, “Trucker Perceptions and Opinions of Lane Restrict and Differential Speed Limit Polices on Freeways,” Compendium of Papers, Transportation Research Board, Washington, D.C., 2009.
25. Ko, B., S.S. Washburn, and D.S. McLeod, “Performance Measures for Truck Level-of-Service: An Exploratory Survey Analysis,” Compendium of Papers, Transportation Research Board, Washington, D.C., 2009.
26. Adelakun, A., and C. Cherry, “Exploring Truck Driver Perceptions and Preferences: Congestion and Conflict, Managed Lane, and Tolls,” Compendium of Papers, Transportation Research Board, Washington, D.C., 2009.
27. Critical Issues in the Trucking Industry – 2007, American Transportation Research Institute, Arlington, VA, 2007.
28. Roadway Design Manual, Texas Department of Transportation, Austin, Texas, 2009. 29. American Association of State Highway and Transportation Officials (AASHTO) A
Policy on Geometric Design of Highways and Streets, Fifth Edition, Washington, D.C., 2004.
30. Fuhs, C., presentation from the 89th Annual Transportation Research Board Meeting, Washington, D.C., 2010.
31. Harwood, D.W., and J.M. Mason, “Horizontal Curve Design for Passenger Cars and Trucks,” Transportation Research Record 1385, Transportation Research Board, Washington, D.C., 1994.
61
32. Fambro, D.B., K. Fitzpatrick, and R.J. Koppa, Determination of Stopping Sight Distances, NCHRP 400, Transportation Research Board, National Research Council, Washington, D.C., 2000.
33. Donnell, E.T., M.L. Adolini, D.T. Torbic, J.M. Mason, and L. Elefteriadou, “Truck Safety Considerations for Geometric Design and Traffic Operations,” Proceedings from ITE Annual Meeting, Institute of Transportation Engineers, 2001.
34. Van Order, D., D. Skorupski, R. Stinebiser, and R. Kreeb, Fleet Study of Brake Performance and Tire Pressure, Federal Motor Carrier Safety Administration, Washington, D.C., 2009.
35. Easa, S., and A. Abd El Halim, “Radius Requirements for Trucks on Three-Dimensional Reverse Horizontal Curves with Intermediate Tangents,” 85th Annual Transportation Research Board Meeting Conference Proceedings, Washington, D.C., 2006.
36. Harwood, D.W., J.M. Mason, W.D. Glauz, B.T. Kulakowski, and K. Fitzpatrick, Truck Characteristics for Use in Highway Design and Operation, Reports FHWA-RD-89-226 and FHWA-RD-89-227, FHWA, U.S. Department of Transportation, 1990.
37. Mason, J.M., L. Griffin, N. Straub, and C. Molina, Annotated Bibliography of Research on Operational Characteristics and Geometric Implication of Longer and Wider Trucks, Research Report 397-1, Texas Transportation Institute, College Station, TX, 1986.
38. Wooldridge, M.D., C.J. Messer, B.D. Heard, S. Raghupathy, A.H. Parham, M.A. Brewer, and S. Lee, Design Guidelines for Passing Lanes on Two-Lane Roadways (Super 2), Report 4064-1, Texas Transportation Institute, College Station, TX, 2001.
39. Mason, J.M., K. Fitzpatrick, D.W. Harwood, and J. True, “Intersection Design Considerations to Accommodate Large Trucks,” Transportation Research Record 1385, Transportation Research Board, Washington, D.C., 1993.
40. Prozzi, J., R. Harrison, and J.A. Prozzi, Defining and Measuring Rural Truck Traffic Needs in Texas, Report Number 0-4169-2, Center for Transportation Research, University of Texas, Austin, Texas, 2006.
41. Manual on Uniform Traffic Control Devices, Federal Highway Administration, U.S. Department of Transportation, 2009.
42. PrePass Web site. http://www.prepass.com/services/prepass/Pages/WhatIsPrepass.aspx. Page accessed January 28, 2010.
43. Giles, T., “Under Observation,” Traffic Technology International, Surrey, United Kingdom, 2006.
44. Ballard, A., Incident Management for Managed Lanes, Report Number 0-4160-17, Texas Transportation Institute, College Station, TX, 2004.
45. Traffic Control Hessen. Hessen Road and Traffic Authority, Weisbaden, Germany, 2006. 46. Mirshahi, M., J. Obenberger, C. Fuhs, C. Howard, R. Krammes, B. Kuhn, R. Mayhew,
M. Moore, K. Sahebjam, C. Stone, and J. Yung, Active Traffic Management: The Next Step in Congestion Management. Report No. FHWA-PL-07-012, American Trade Initiatives, Washington, D.C., July 2007.
47. Middelham, F., Dynamic Traffic Management. Ministry of Transport, Public Works, and Water Management, Directorate-General of Public Works and Water Management, AVV Transport Research Centre, Rotterdam, Netherlands, Presentation to PCM Scan Team, June 2006.
48. Pilz, A., “Presentation of the Traffic Centre Hessen.” Hessian Ministry of Economy and Transport, Frankfurt, Germany, Presentation to PCM Scan Team, June 2006.

62
49. “Creative Ways to Beat Congestion.” BBC News World Edition, November 2004, BBC News Web site, http://news.bbc.co.uk/2/hi/uk_news/magazine/4044803.stm.
50. “Active Traffic Management (ATM) Project M42 Junctions 3A-7.” Highways Agency website, Highways Agency, Department of Transport, United Kingdom, http://www.highways.gov.uk/knowledge/tcc/atm/index.htm.
51. Differt, D., W. Berman, K. Aufschneider, P. DeCorla-Souza, A. Flemer, L. Hoang, R. Hull, E. Schreffler, and G. Zammit, Managing Travel Demand: Applying European Perspectives to U.S. Practice. Federal Highway Administration, U.S. Department of Transportation, May 2006.
52. Tignor, S., L. Brown, J. Butner, R. Cunard, S. Davis, H. Hawkins, E. Fischer, M. Kehrli, P. Rusche, and W. Wainwright, Innovative Traffic Control Technology and Practice in Europe. Federal Highway Administration, U.S. Department of Transportation, Washington, D.C., August 1999.
BIBLIOGRAPHY OF ADDITIONAL REFERENCES
1. Poole, R.W., Jr., and P. Samuel, Corridors for Toll Truckways: Suggested Locations for Pilot Projects. Policy Study 316. Reason Public Policy Institute. Los Angeles, CA. February 2004.
2. Harwood, D.W., W.D. Glauz, L. Elefteriadou, D.J. Torbic, and J. McFadden, “Distribution of Roadway Geometric Design Features Critical to Accommodation of Large Trucks,” Transportation Research Record 1658, Transportation Research Board, Washington, D.C., 1999.
3. Rodier, C.J., and R.A. Johnston, A Comparison of High Occupancy Vehicle, High Occupancy Toll, and Truck Only Lanes in the Sacramento Region. The University of California Transportation Center, University of California, Berkeley, CA, March 1999.
4. Preusser, D.F., and H.S. Stein, “Comparison of Passenger Vehicle and Truck Crash Rates on Toll Roads.” ITE Journal, Washington, D.C., 1987.
5. Freight Analysis Framework Highway Capacity Analysis, for Office of Freight Management and Operations, U.S. DOT, Washington, D.C., Battelle, April 2002.
6. Lockridge, D., “Toll Roads.” Heavy Duty Trucking, April 2005. 7. Forkenbrock, D.J., and J. March, “Issues in the Financing of Truck-Only Lanes.” Public
Roads, Volume 69, No. 2, U.S. DOT, Washington D.C., Sept/Oct 2005. 8. Kawamura, K., “Perceived Benefits of Congestion Pricing for Trucks.” Transportation
Research Record 1833, Transportation Research Board, Washington D.C., p. 59, 2003. (E)
9. Kawamura, K., “Perceived Value of Time for Truck Operators.” Transportation Research Record 1725, Transportation Research Board, Washington D.C., p. 31, January 2000.
10. McNally, S., “Ohio Hopes to Lure Trucks Back to Pike.” Transport Topics, October 2004.
11. Poole, R.W., and R. Mullett, “Road Pricing and Trucking: Framing the Issues.” Tollways, p. 29, Winter 2006.
12. Schulz, J., “Trucks Only.” Traffic World, June 24, 2002. 13. Cox, W., “Shift Freight from Trucks to Trains.” Seattle Post-Intelligencer, Seattle,
Washington, July 20, 2006.
63
14. Orski, K., “Toll Truckways: Toward a Model 21st Century Freight Highway System.” Innovation Briefs, Volume 13, No. 5, Potomac, MD, Sep/Oct 2002.
15. Parentela, E.M., “Risk Modeling for Commercial Goods Transport.” METrans, California State University, Long Beach, CA, June 2002.
16. Fischer, M.J., D.N. Ahanotu, and J.M. Waliszewski, “Planning Truck-Only Lanes: Emerging Lessons from the Southern California Experience.” Transportation Research Record 1833, Transportation Research Board, Washington D.C., p. 73, January 2003.
17. Knorring, J.H., “Analysis of Route Choice Decisions by Long-Haul Truck Drivers.” Transportation Research Record 1923, Transportation Research Board, Washington D.C., pp. 46–60, 2005.
18. Wislocki, J., “California Truckers Examine Toll Lanes.” Transport Topics 3480, April 2002.
19. Gains from Congestion Pricing: Will They Be Captured by Truckers and Passed On to Freight Customers? U.S. DOT/Volpe Center, June 26, 2006.
20. Braver, E.R., C.W. Preusser, and R.G. Ulmer, “How Long-Haul Motor Carriers Determine Truck Driver Work Schedules: The Role of Shipper Demands.” Journal of Safety Research, Vol. 30, No. 3, pp. 193–204, 1999.
21. Meyer, M.D., L. Saben, W. Shephard, and E. Steavens, “Feasibility of a Truck-Only Toll (TOT) Lane Network in Atlanta, GA.” Proceedings from TRB 2006 Annual Meeting, Washington D.C.
22. Karkee, G., and S. Venglar. “An Evaluation of Safety Improvements to I35 Northbound Approaching Riverside Drive in Austin Texas.” Technical Memorandum prepared for TxDOT, Austin District, July 2006.
23. Johnson, J., “New Jersey Pike Discounts Fuel to Draw Truckers.” Transport Topics, January 4, 1999.
24. Podgorski, V., and K. Kockelman, “Public Perception of Toll Roads: A Survey of the Texas Perspective.” Transportation Research Part A 40, March 14, 2006 pp. 888-902.
25. Barrett, C., “Routing Restrictions for Motor Carriers.” Traffic World, September 4, 2006, p. 38.
26. AECOM, Issues and Options for Increasing the Use of Tolling and Pricing to Finance Transportation Improvements. Final Report for Office of Transportation Policy Studies. June 9, 2006.
27. Alver, Y., J. Hashiuchi, and S. Mizokami, “A Study on Expressway Toll Pricing Based on the Results of Social Experiments.” TRB 2006 Annual Meeting CD-ROM.
28. Nustats, Georgia Department of Transportation: Interstate 75 Truck Operator Survey. Final Report. April 2006.
29. “Crash Rate for Trucks Higher on Toll Roads.” Transafety Reporter, September 1987. Vol. 5, Number 9, pp. 6–7.
30. Holguin-Veras, J., M. Cetin, and S. Xiz, “A Comparative Analysis of US Toll Policy.” Transportation Research Part A 40, March 23, 2006, pp. 852–571.
31. Burke, N., “Dedicated Truck Lanes as a Solution to Capacity and Safety Issues on Interstate Highway Corridors.” Midwest Transportation Consortium, Iowa State University.
32. Cass, M.P., “Case Study in Delivery Route Cost Comparisons.” National Association of Cost Accountants – Bulletin, Vol. 30, Issue 23, 1949, pp. 1371–1377.

64
33. Clower, T., and B. Weinstein, Impacts of Toll Roads on the Regional Economy: Suggested Measures. Center for Economic Development and Research, University of North Texas, December 2005.
34. Venglar, S., M. Martello, J. Wikander, and T. Charoenchai, I-35 Truck Lane Restriction Investigation. Texas Department of Transportation, Austin Division, December 2002.
35. “Price Rise is Set to Take Its Toll,” Commercial Motor, 0010-3063, June 9, 2005, Vol. 201, Issue 5132.
36. Nustats, Georgia Department of Transportation: Interstate 75 Passenger Car Stated Preference Survey. Final Report. May 2006.
37. Jasek, D., M. Ojah, and B. Hoover, A Summary of Truck Registration in Texas. TTI - Project Summary Report.
38. Prozzi, J., R. Harrison, J. Prozzi, and P. Nash, Rural Traffic Needs in Texas. CTR - Project Summary Report, March 2006.
39. Roop, S., C. Roco, C. Morgan, L. Olson, J. Warner, and D. Kang, Technical and Economic Feasibility of a Freight Pipeline System in Texas. TTI – Project Summary Report.
40. Southern California Association of Governments. “User-Supported Regional Truckways in Southern California.” Briefing Paper, January 5, 2004.
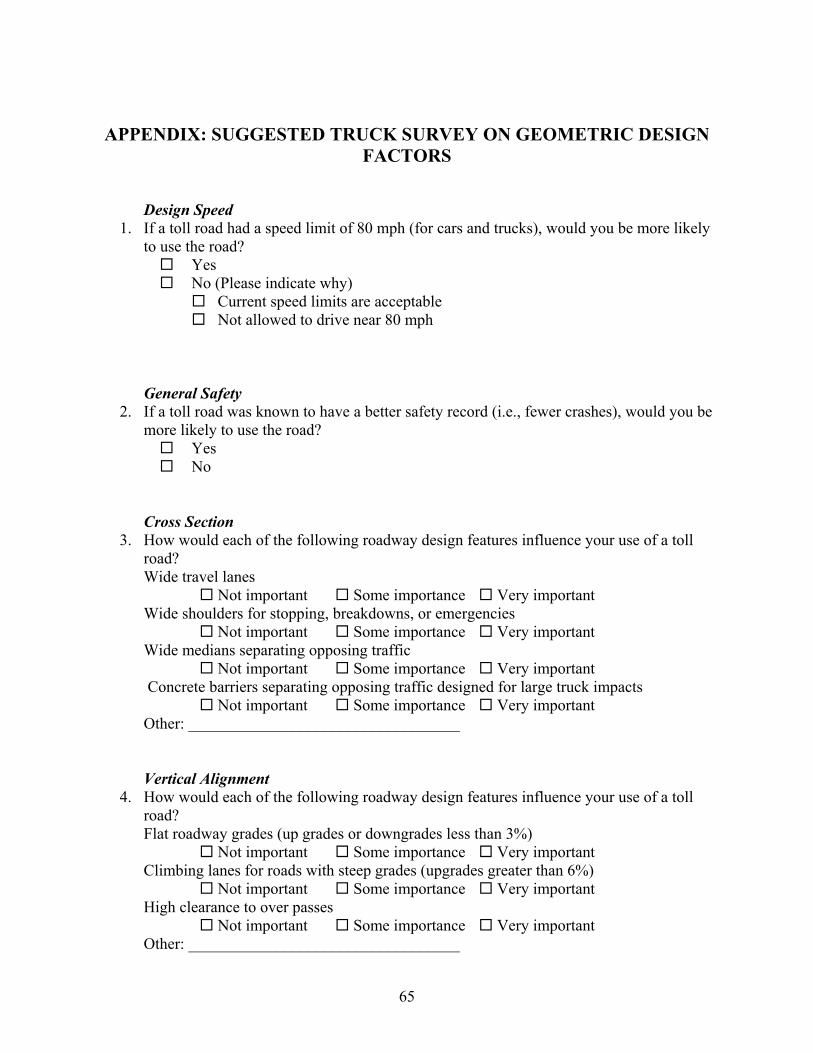
65
APPENDIX: SUGGESTED TRUCK SURVEY ON GEOMETRIC DESIGN FACTORS
Design Speed
1. If a toll road had a speed limit of 80 mph (for cars and trucks), would you be more likely to use the road? Yes No (Please indicate why)
Current speed limits are acceptable Not allowed to drive near 80 mph
General Safety
2. If a toll road was known to have a better safety record (i.e., fewer crashes), would you be more likely to use the road? Yes No
Cross Section
3. How would each of the following roadway design features influence your use of a toll road? Wide travel lanes
Not important Some importance Very important Wide shoulders for stopping, breakdowns, or emergencies
Not important Some importance Very important Wide medians separating opposing traffic
Not important Some importance Very important Concrete barriers separating opposing traffic designed for large truck impacts
Not important Some importance Very important Other: __________________________________ Vertical Alignment
4. How would each of the following roadway design features influence your use of a toll road? Flat roadway grades (up grades or downgrades less than 3%)
Not important Some importance Very important Climbing lanes for roads with steep grades (upgrades greater than 6%)
Not important Some importance Very important High clearance to over passes
Not important Some importance Very important Other: __________________________________
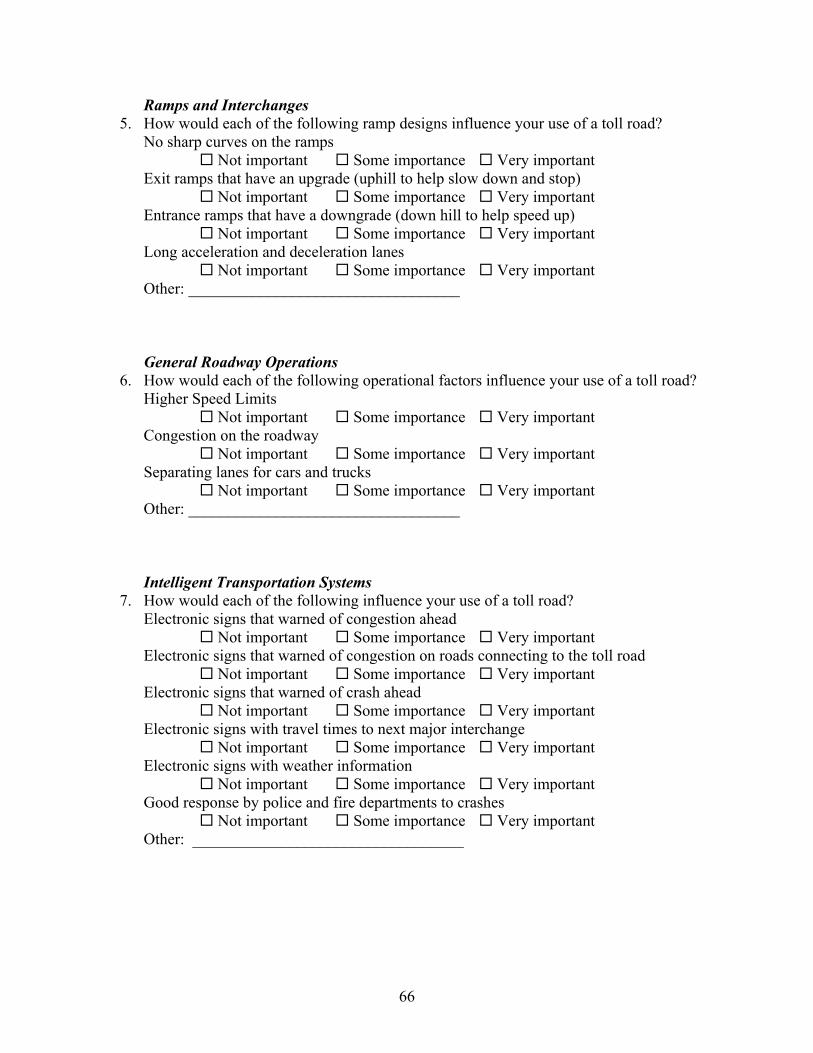
66
Ramps and Interchanges 5. How would each of the following ramp designs influence your use of a toll road?
No sharp curves on the ramps Not important Some importance Very important
Exit ramps that have an upgrade (uphill to help slow down and stop) Not important Some importance Very important
Entrance ramps that have a downgrade (down hill to help speed up) Not important Some importance Very important
Long acceleration and deceleration lanes Not important Some importance Very important
Other: __________________________________ General Roadway Operations
6. How would each of the following operational factors influence your use of a toll road? Higher Speed Limits
Not important Some importance Very important Congestion on the roadway
Not important Some importance Very important Separating lanes for cars and trucks
Not important Some importance Very important Other: __________________________________ Intelligent Transportation Systems 7. How would each of the following influence your use of a toll road?
Electronic signs that warned of congestion ahead Not important Some importance Very important
Electronic signs that warned of congestion on roads connecting to the toll road Not important Some importance Very important
Electronic signs that warned of crash ahead Not important Some importance Very important
Electronic signs with travel times to next major interchange Not important Some importance Very important
Electronic signs with weather information Not important Some importance Very important
Good response by police and fire departments to crashes Not important Some importance Very important
Other: __________________________________
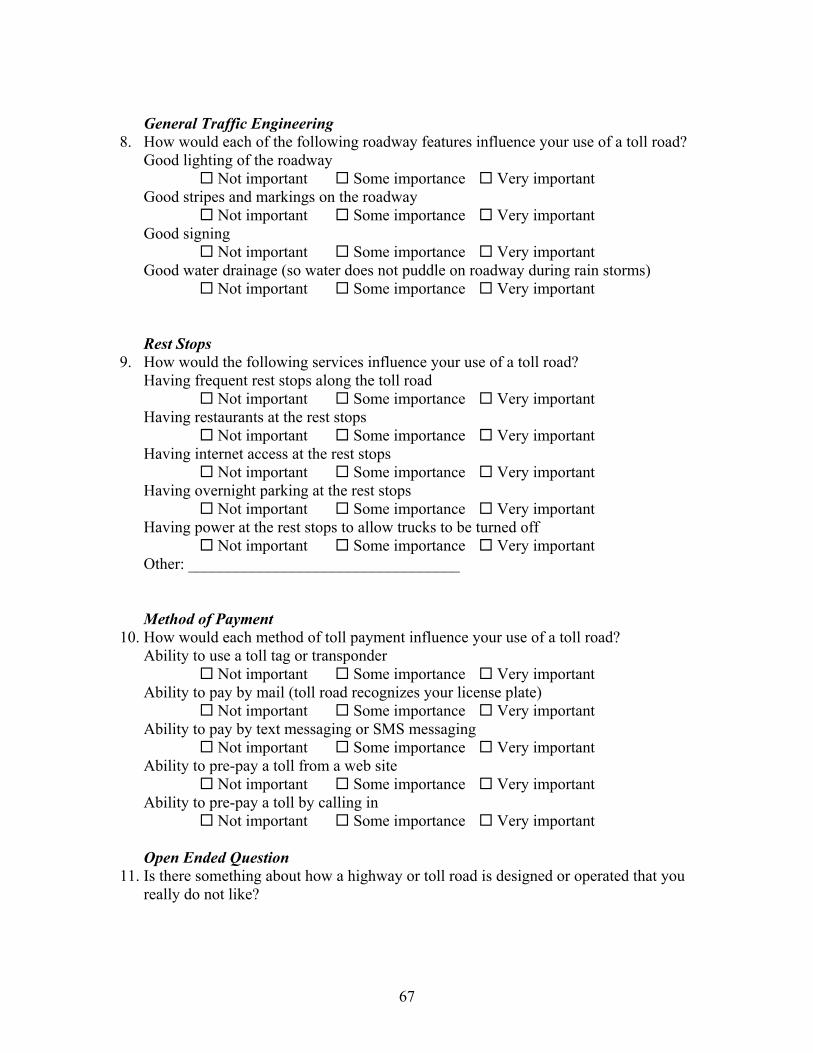
67
General Traffic Engineering
8. How would each of the following roadway features influence your use of a toll road? Good lighting of the roadway
Not important Some importance Very important Good stripes and markings on the roadway
Not important Some importance Very important Good signing
Not important Some importance Very important Good water drainage (so water does not puddle on roadway during rain storms)
Not important Some importance Very important Rest Stops 9. How would the following services influence your use of a toll road?
Having frequent rest stops along the toll road Not important Some importance Very important
Having restaurants at the rest stops Not important Some importance Very important
Having internet access at the rest stops Not important Some importance Very important
Having overnight parking at the rest stops Not important Some importance Very important
Having power at the rest stops to allow trucks to be turned off Not important Some importance Very important
Other: __________________________________ Method of Payment 10. How would each method of toll payment influence your use of a toll road?
Ability to use a toll tag or transponder Not important Some importance Very important
Ability to pay by mail (toll road recognizes your license plate) Not important Some importance Very important
Ability to pay by text messaging or SMS messaging Not important Some importance Very important
Ability to pre-pay a toll from a web site Not important Some importance Very important
Ability to pre-pay a toll by calling in Not important Some importance Very important
Open Ended Question 11. Is there something about how a highway or toll road is designed or operated that you
really do not like?