Embed Size (px)
Citation preview
Geometry-Based Propagation Modeling andSimulation of Vehicle-to-Infrastructure Links
Bengi Aygun∗, Mate Boban†, Joao P. Vilela?, and Alexander M. Wyglinski∗∗Department of Electrical and Computer Engineering, Worcester Polytechnic Institute, Worcester, MA, USA
†Huawei European Research Center, Munich, Germany?CISUC, Department of Informatics Engineering, University of Coimbra, PortugalEmail: {baygun, alexw}@wpi.edu, [email protected], [email protected]
Abstract—Due to the differences in terms of antenna height,scatterer density, and relative speed, V2I links exhibit differentpropagation characteristics compared to V2V links. We developa geometry-based path loss and shadow fading model for V2Ilinks. We separately model the following types of V2I links: line-of-sight, non-line-of-sight due to vehicles, non-line-of-sight due tofoliage, and non-line-of-sight due to buildings. We validate theproposed model using V2I field measurements. We implementthe model in the GEMV2 simulator, and make the source codepublicly available.
I. INTRODUCTION
The National Highway Traffic Safety Administration(NHTSA) announced that connected vehicles will be mandatedby 2019, and that these vehicles will support both vehicle-to-vehicle (V2V) and vehicle-to-infrastructure (V2I) commu-nications [1]. Furthermore, Federal Highway Administration(FHWA) released “2015 FHWA Vehicle to InfrastructureDeployment Guidance and Products", a document assistingoperators in adapting traffic signals and other roadside devicesso they are capable to communicate with the new connectedvehicles [2]. V2I communication is envisioned as a key build-ing block for enabling safety and traffic efficiency applicationsin Europe as well [3], [4].
V2I links differ from V2V links, in terms of antenna height,relative speed, and the scatterer density at the infrastructureend of the link, resulting in significantly different communi-cation performance [5]. The infrastructure component of thelink will be located near the roads (e.g., at intersections incities or on gantries on highways) with antennas configuredfor Dedicated Short Range Communications (DSRC). Thesecharacteristics distinguish V2I communication from refersmobile-to-base station (“cellular”) communication, where thebase station is located farther away from the road, typicallymounted on top of buildings or hills. As such, V2I links donot have the same characteristics as the well studied mobile-to-base station links used in cellular networks, for which modelsare readily available (e.g., [6]).
Field tests are crucial for the study and evaluation of V2Icommunications. Gozalvez et al. [7] performed comprehensivemeasurements for different antenna heights, vehicle drivingdirections, and locations in Bologna, Italy. Measurement re-sults on highways involving an infrastructure near the roadsuch as Roadside Units (RSUs) and an onboard units (OBUs)
inside of cars with omni-directional antennas show that en-vironment conditions significantly affect communication per-formance [8]. Shivaldova [9] et al. evaluate the performanceof omnidirectional and different types of directional antennasand show that directional antennas possess better performancethan omnidirectional antennas if the RSUs with directionalantennas are deployed properly so as to not cause interfer-ence. The propagation behavior of V2I communications in ahighway scenario was measured by Maier et al. [10] for multi-antenna systems whereas Shivaldova et al. [11] analyzed theperformance of single-antenna systems in tunnels.
While field tests provide realistic insights for specific sce-narios, simulations are better suited for repeatable, low costevaluations of protocols and applications for vehicular com-munications. Current state-of-the-art simulators focus mainlyon V2V communications or V2I communications operating inthe cellular sense (e.g., LTE communication between mobileterminal and base station). Existing V2I studies either utilizesimplified OBU-RSU link behavior (e.g., Paulin et al. [12] useNS-3 [13] to regulate the data flow and collection betweenthe OBU and RSUs) or focus on LTE communication (e.g.,Altintas et al. [14] explored the use of cellular communicationto enable “cars as an ICT resource” in the context of futuresmart cities). Although the literature includes many propaga-tion models and channel simulators for V2V systems [15],[16], there is a noticeable lack of models focused on V2Ipropagation.
Designing accurate propagation models is critical for real-istic evaluation of V2I-enabled applications. Specific consid-erations for V2I communication include the following:
• V2I systems have unique characteristics in terms ofantenna heights, placement of the RSUs, relative speedand locations and statistics of scatterers;
• Various environments (e.g., urban, suburban, highway)causing different attenuation levels at same distances (i.e.,affecting path loss and shadowing);
• Specific considerations for small scale fading, due toparticular location of antennas on both side of the links.
Following the modeling methodology developed in theGEMV2 simulator [17], in this paper we characterize thepath loss and shadowing for V2I communications and developmodel that encompasses different V2I link types; these include
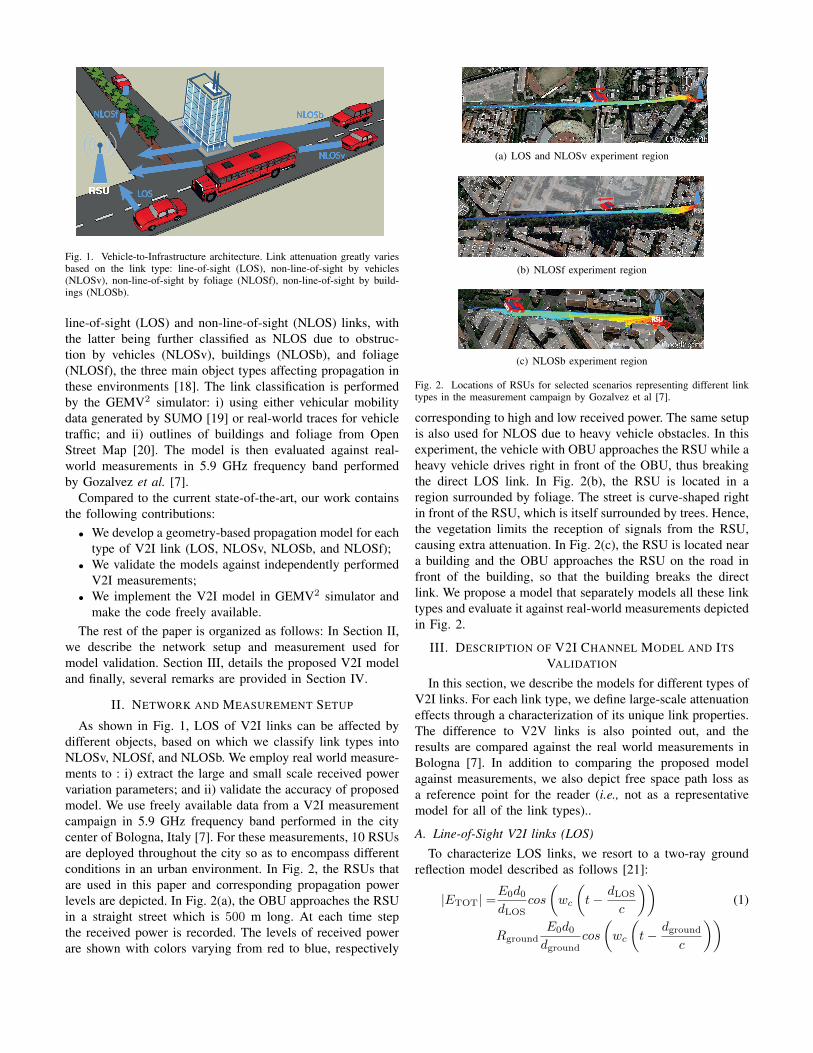
Fig. 1. Vehicle-to-Infrastructure architecture. Link attenuation greatly variesbased on the link type: line-of-sight (LOS), non-line-of-sight by vehicles(NLOSv), non-line-of-sight by foliage (NLOSf), non-line-of-sight by build-ings (NLOSb).
line-of-sight (LOS) and non-line-of-sight (NLOS) links, withthe latter being further classified as NLOS due to obstruc-tion by vehicles (NLOSv), buildings (NLOSb), and foliage(NLOSf), the three main object types affecting propagation inthese environments [18]. The link classification is performedby the GEMV2 simulator: i) using either vehicular mobilitydata generated by SUMO [19] or real-world traces for vehicletraffic; and ii) outlines of buildings and foliage from OpenStreet Map [20]. The model is then evaluated against real-world measurements in 5.9 GHz frequency band performedby Gozalvez et al. [7].
Compared to the current state-of-the-art, our work containsthe following contributions:• We develop a geometry-based propagation model for each
type of V2I link (LOS, NLOSv, NLOSb, and NLOSf);• We validate the models against independently performed
V2I measurements;• We implement the V2I model in GEMV2 simulator and
make the code freely available.The rest of the paper is organized as follows: In Section II,
we describe the network setup and measurement used formodel validation. Section III, details the proposed V2I modeland finally, several remarks are provided in Section IV.
II. NETWORK AND MEASUREMENT SETUP
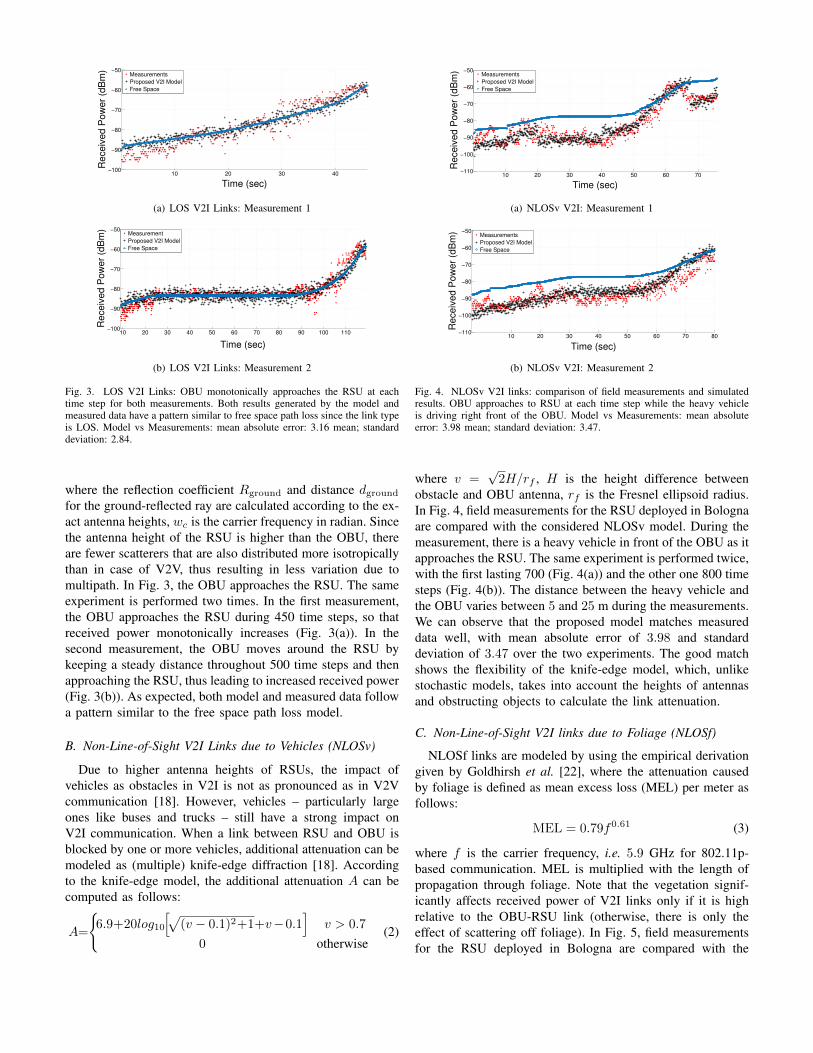
As shown in Fig. 1, LOS of V2I links can be affected bydifferent objects, based on which we classify link types intoNLOSv, NLOSf, and NLOSb. We employ real world measure-ments to : i) extract the large and small scale received powervariation parameters; and ii) validate the accuracy of proposedmodel. We use freely available data from a V2I measurementcampaign in 5.9 GHz frequency band performed in the citycenter of Bologna, Italy [7]. For these measurements, 10 RSUsare deployed throughout the city so as to encompass differentconditions in an urban environment. In Fig. 2, the RSUs thatare used in this paper and corresponding propagation powerlevels are depicted. In Fig. 2(a), the OBU approaches the RSUin a straight street which is 500 m long. At each time stepthe received power is recorded. The levels of received powerare shown with colors varying from red to blue, respectively
RSU
(a) LOS and NLOSv experiment region
RSU
(b) NLOSf experiment region
RSU
(c) NLOSb experiment region
Fig. 2. Locations of RSUs for selected scenarios representing different linktypes in the measurement campaign by Gozalvez et al [7].
corresponding to high and low received power. The same setupis also used for NLOS due to heavy vehicle obstacles. In thisexperiment, the vehicle with OBU approaches the RSU while aheavy vehicle drives right in front of the OBU, thus breakingthe direct LOS link. In Fig. 2(b), the RSU is located in aregion surrounded by foliage. The street is curve-shaped rightin front of the RSU, which is itself surrounded by trees. Hence,the vegetation limits the reception of signals from the RSU,causing extra attenuation. In Fig. 2(c), the RSU is located neara building and the OBU approaches the RSU on the road infront of the building, so that the building breaks the directlink. We propose a model that separately models all these linktypes and evaluate it against real-world measurements depictedin Fig. 2.
III. DESCRIPTION OF V2I CHANNEL MODEL AND ITSVALIDATION
In this section, we describe the models for different types ofV2I links. For each link type, we define large-scale attenuationeffects through a characterization of its unique link properties.The difference to V2V links is also pointed out, and theresults are compared against the real world measurements inBologna [7]. In addition to comparing the proposed modelagainst measurements, we also depict free space path loss asa reference point for the reader (i.e., not as a representativemodel for all of the link types)..
A. Line-of-Sight V2I links (LOS)
To characterize LOS links, we resort to a two-ray groundreflection model described as follows [21]:
|ETOT| =E0d0dLOS
cos
(wc
(t− dLOS
c
))(1)
RgroundE0d0dground
cos
(wc
(t− dground
c
))
10 20 30 40−100
−90
−80
−70
−60
−50
Time (sec)
Receiv
ed P
ow
er
(dB
m)
Measurements
Proposed V2I Model
Free Space
(a) LOS V2I Links: Measurement 1
10 20 30 40 50 60 70 80 90 100 110−100
−90
−80
−70
−60
−50
Time (sec)
Receiv
ed P
ow
er
(dB
m)
Measurement
Proposed V2I Model
Free Space
(b) LOS V2I Links: Measurement 2
Fig. 3. LOS V2I Links: OBU monotonically approaches the RSU at eachtime step for both measurements. Both results generated by the model andmeasured data have a pattern similar to free space path loss since the link typeis LOS. Model vs Measurements: mean absolute error: 3.16 mean; standarddeviation: 2.84.
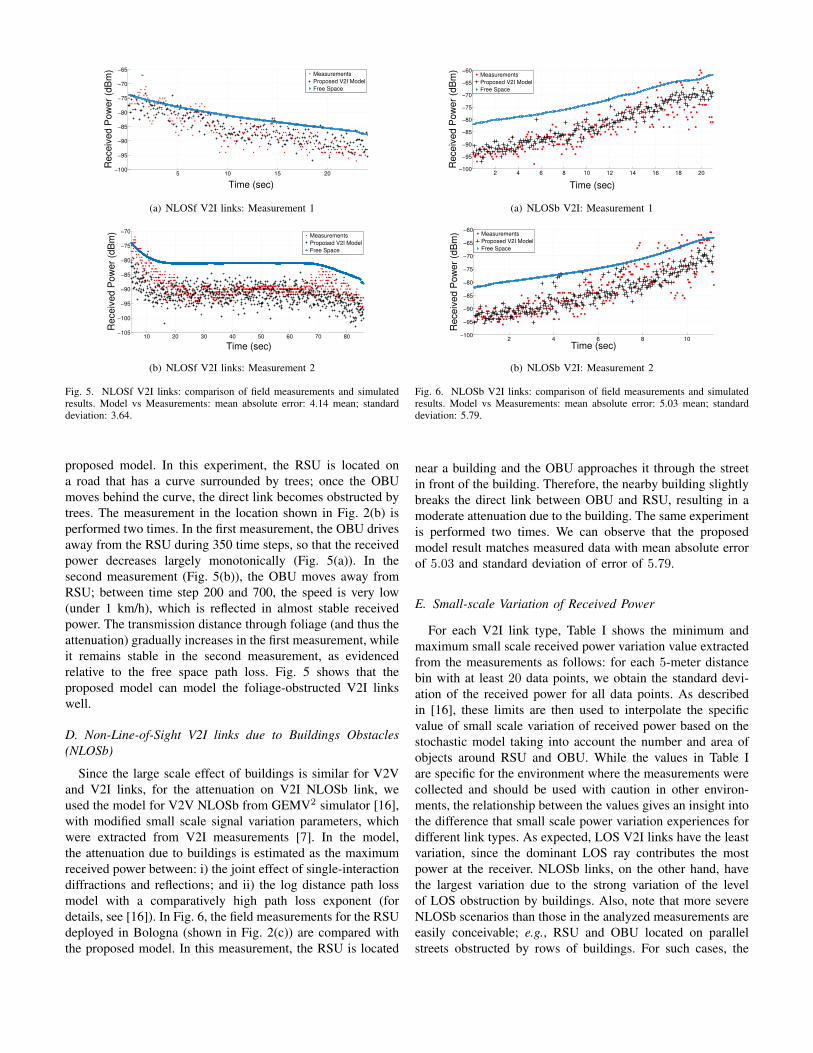
where the reflection coefficient Rground and distance dgroundfor the ground-reflected ray are calculated according to the ex-act antenna heights, wc is the carrier frequency in radian. Sincethe antenna height of the RSU is higher than the OBU, thereare fewer scatterers that are also distributed more isotropicallythan in case of V2V, thus resulting in less variation due tomultipath. In Fig. 3, the OBU approaches the RSU. The sameexperiment is performed two times. In the first measurement,the OBU approaches the RSU during 450 time steps, so thatreceived power monotonically increases (Fig. 3(a)). In thesecond measurement, the OBU moves around the RSU bykeeping a steady distance throughout 500 time steps and thenapproaching the RSU, thus leading to increased received power(Fig. 3(b)). As expected, both model and measured data followa pattern similar to the free space path loss model.
B. Non-Line-of-Sight V2I Links due to Vehicles (NLOSv)
Due to higher antenna heights of RSUs, the impact ofvehicles as obstacles in V2I is not as pronounced as in V2Vcommunication [18]. However, vehicles – particularly largeones like buses and trucks – still have a strong impact onV2I communication. When a link between RSU and OBU isblocked by one or more vehicles, additional attenuation can bemodeled as (multiple) knife-edge diffraction [18]. Accordingto the knife-edge model, the additional attenuation A can becomputed as follows:
A=
{6.9+20log10
[√(v − 0.1)2+1+v−0.1
]v > 0.7
0 otherwise(2)
10 20 30 40 50 60 70−110
−100
−90
−80
−70
−60
−50
Time (sec)
Receiv
ed P
ow
er
(dB
m)
Measurements
Proposed V2I Model
Free Space
(a) NLOSv V2I: Measurement 1
10 20 30 40 50 60 70 80−110
−100
−90
−80
−70
−60
−50
Time (sec)
Receiv
ed P
ow
er
(dB
m)
Measurements
Proposed V2I Model
Free Space
(b) NLOSv V2I: Measurement 2
Fig. 4. NLOSv V2I links: comparison of field measurements and simulatedresults. OBU approaches to RSU at each time step while the heavy vehicleis driving right front of the OBU. Model vs Measurements: mean absoluteerror: 3.98 mean; standard deviation: 3.47.
where v =√2H/rf , H is the height difference between
obstacle and OBU antenna, rf is the Fresnel ellipsoid radius.In Fig. 4, field measurements for the RSU deployed in Bolognaare compared with the considered NLOSv model. During themeasurement, there is a heavy vehicle in front of the OBU as itapproaches the RSU. The same experiment is performed twice,with the first lasting 700 (Fig. 4(a)) and the other one 800 timesteps (Fig. 4(b)). The distance between the heavy vehicle andthe OBU varies between 5 and 25 m during the measurements.We can observe that the proposed model matches measureddata well, with mean absolute error of 3.98 and standarddeviation of 3.47 over the two experiments. The good matchshows the flexibility of the knife-edge model, which, unlikestochastic models, takes into account the heights of antennasand obstructing objects to calculate the link attenuation.
C. Non-Line-of-Sight V2I links due to Foliage (NLOSf)
NLOSf links are modeled by using the empirical derivationgiven by Goldhirsh et al. [22], where the attenuation causedby foliage is defined as mean excess loss (MEL) per meter asfollows:
MEL = 0.79f0.61 (3)
where f is the carrier frequency, i.e. 5.9 GHz for 802.11p-based communication. MEL is multiplied with the length ofpropagation through foliage. Note that the vegetation signif-icantly affects received power of V2I links only if it is highrelative to the OBU-RSU link (otherwise, there is only theeffect of scattering off foliage). In Fig. 5, field measurementsfor the RSU deployed in Bologna are compared with the
5 10 15 20−100
−95
−90
−85
−80
−75
−70
−65
Time (sec)
Receiv
ed P
ow
er
(dB
m)
Measurements
Proposed V2I Model
Free Space
(a) NLOSf V2I links: Measurement 1
10 20 30 40 50 60 70 80−105
−100
−95
−90
−85
−80
−75
−70
Time (sec)
Receiv
ed P
ow
er
(dB
m)
Measurements
Proposed V2I Model
Free Space
(b) NLOSf V2I links: Measurement 2
Fig. 5. NLOSf V2I links: comparison of field measurements and simulatedresults. Model vs Measurements: mean absolute error: 4.14 mean; standarddeviation: 3.64.
proposed model. In this experiment, the RSU is located ona road that has a curve surrounded by trees; once the OBUmoves behind the curve, the direct link becomes obstructed bytrees. The measurement in the location shown in Fig. 2(b) isperformed two times. In the first measurement, the OBU drivesaway from the RSU during 350 time steps, so that the receivedpower decreases largely monotonically (Fig. 5(a)). In thesecond measurement (Fig. 5(b)), the OBU moves away fromRSU; between time step 200 and 700, the speed is very low(under 1 km/h), which is reflected in almost stable receivedpower. The transmission distance through foliage (and thus theattenuation) gradually increases in the first measurement, whileit remains stable in the second measurement, as evidencedrelative to the free space path loss. Fig. 5 shows that theproposed model can model the foliage-obstructed V2I linkswell.
D. Non-Line-of-Sight V2I links due to Buildings Obstacles(NLOSb)
Since the large scale effect of buildings is similar for V2Vand V2I links, for the attenuation on V2I NLOSb link, weused the model for V2V NLOSb from GEMV2 simulator [16],with modified small scale signal variation parameters, whichwere extracted from V2I measurements [7]. In the model,the attenuation due to buildings is estimated as the maximumreceived power between: i) the joint effect of single-interactiondiffractions and reflections; and ii) the log distance path lossmodel with a comparatively high path loss exponent (fordetails, see [16]). In Fig. 6, the field measurements for the RSUdeployed in Bologna (shown in Fig. 2(c)) are compared withthe proposed model. In this measurement, the RSU is located
2 4 6 8 10 12 14 16 18 20−100
−95
−90
−85
−80
−75
−70
−65
−60
Time (sec)
Receiv
ed P
ow
er
(dB
m)
Measurements
Proposed V2I Model
Free Space
(a) NLOSb V2I: Measurement 1
2 4 6 8 10−100
−95
−90
−85
−80
−75
−70
−65
−60
Time (sec)
Receiv
ed P
ow
er
(dB
m)
Measurements
Proposed V2I Model
Free Space
(b) NLOSb V2I: Measurement 2
Fig. 6. NLOSb V2I links: comparison of field measurements and simulatedresults. Model vs Measurements: mean absolute error: 5.03 mean; standarddeviation: 5.79.
near a building and the OBU approaches it through the streetin front of the building. Therefore, the nearby building slightlybreaks the direct link between OBU and RSU, resulting in amoderate attenuation due to the building. The same experimentis performed two times. We can observe that the proposedmodel result matches measured data with mean absolute errorof 5.03 and standard deviation of error of 5.79.
E. Small-scale Variation of Received Power
For each V2I link type, Table I shows the minimum andmaximum small scale received power variation value extractedfrom the measurements as follows: for each 5-meter distancebin with at least 20 data points, we obtain the standard devi-ation of the received power for all data points. As describedin [16], these limits are then used to interpolate the specificvalue of small scale variation of received power based on thestochastic model taking into account the number and area ofobjects around RSU and OBU. While the values in Table Iare specific for the environment where the measurements werecollected and should be used with caution in other environ-ments, the relationship between the values gives an insight intothe difference that small scale power variation experiences fordifferent link types. As expected, LOS V2I links have the leastvariation, since the dominant LOS ray contributes the mostpower at the receiver. NLOSb links, on the other hand, havethe largest variation due to the strong variation of the levelof LOS obstruction by buildings. Also, note that more severeNLOSb scenarios than those in the analyzed measurements areeasily conceivable; e.g., RSU and OBU located on parallelstreets obstructed by rows of buildings. For such cases, the
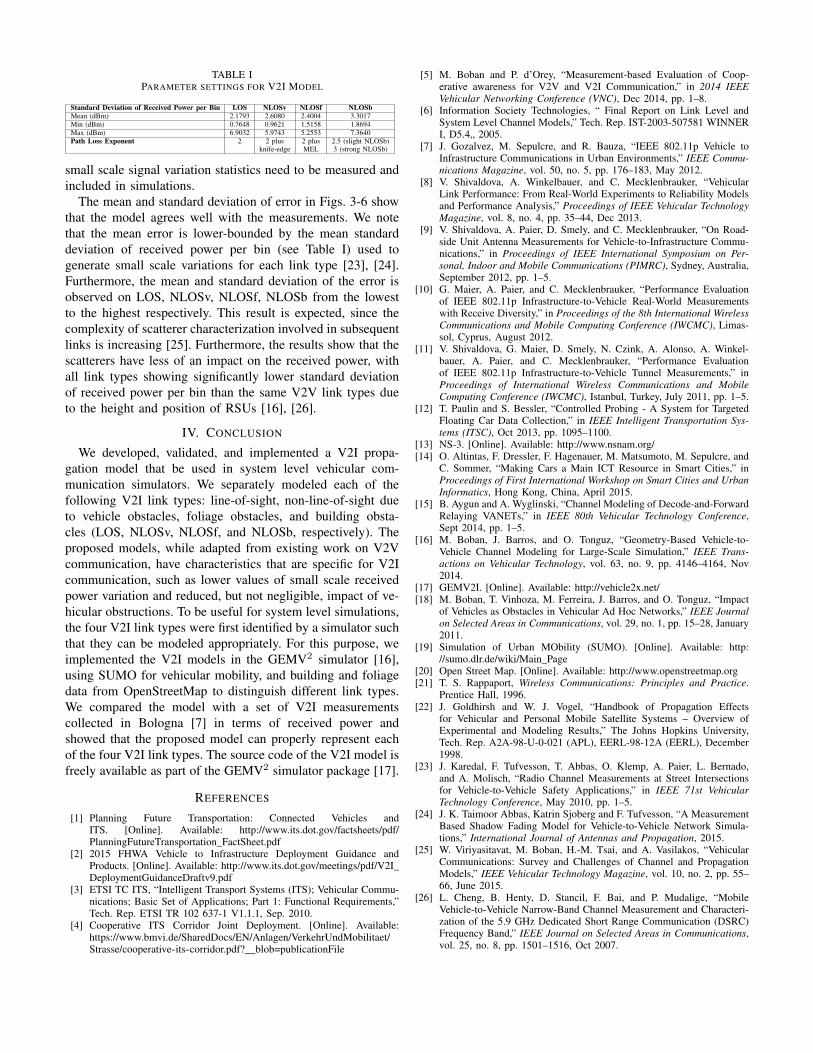
TABLE IPARAMETER SETTINGS FOR V2I MODEL
Standard Deviation of Received Power per Bin LOS NLOSv NLOSf NLOSbMean (dBm) 2.1793 2.6080 2.4004 3.3017Min (dBm) 0.7648 0.9621 1.5158 1.8694Max (dBm) 6.9032 5.9743 5.2553 7.3640Path Loss Exponent 2 2 plus 2 plus 2.5 (slight NLOSb)
knife-edge MEL 3 (strong NLOSb)
small scale signal variation statistics need to be measured andincluded in simulations.
The mean and standard deviation of error in Figs. 3-6 showthat the model agrees well with the measurements. We notethat the mean error is lower-bounded by the mean standarddeviation of received power per bin (see Table I) used togenerate small scale variations for each link type [23], [24].Furthermore, the mean and standard deviation of the error isobserved on LOS, NLOSv, NLOSf, NLOSb from the lowestto the highest respectively. This result is expected, since thecomplexity of scatterer characterization involved in subsequentlinks is increasing [25]. Furthermore, the results show that thescatterers have less of an impact on the received power, withall link types showing significantly lower standard deviationof received power per bin than the same V2V link types dueto the height and position of RSUs [16], [26].
IV. CONCLUSION
We developed, validated, and implemented a V2I propa-gation model that be used in system level vehicular com-munication simulators. We separately modeled each of thefollowing V2I link types: line-of-sight, non-line-of-sight dueto vehicle obstacles, foliage obstacles, and building obsta-cles (LOS, NLOSv, NLOSf, and NLOSb, respectively). Theproposed models, while adapted from existing work on V2Vcommunication, have characteristics that are specific for V2Icommunication, such as lower values of small scale receivedpower variation and reduced, but not negligible, impact of ve-hicular obstructions. To be useful for system level simulations,the four V2I link types were first identified by a simulator suchthat they can be modeled appropriately. For this purpose, weimplemented the V2I models in the GEMV2 simulator [16],using SUMO for vehicular mobility, and building and foliagedata from OpenStreetMap to distinguish different link types.We compared the model with a set of V2I measurementscollected in Bologna [7] in terms of received power andshowed that the proposed model can properly represent eachof the four V2I link types. The source code of the V2I model isfreely available as part of the GEMV2 simulator package [17].
REFERENCES
[1] Planning Future Transportation: Connected Vehicles andITS. [Online]. Available: http://www.its.dot.gov/factsheets/pdf/PlanningFutureTransportation_FactSheet.pdf
[2] 2015 FHWA Vehicle to Infrastructure Deployment Guidance andProducts. [Online]. Available: http://www.its.dot.gov/meetings/pdf/V2I_DeploymentGuidanceDraftv9.pdf
[3] ETSI TC ITS, “Intelligent Transport Systems (ITS); Vehicular Commu-nications; Basic Set of Applications; Part 1: Functional Requirements,”Tech. Rep. ETSI TR 102 637-1 V1.1.1, Sep. 2010.
[4] Cooperative ITS Corridor Joint Deployment. [Online]. Available:https://www.bmvi.de/SharedDocs/EN/Anlagen/VerkehrUndMobilitaet/Strasse/cooperative-its-corridor.pdf?__blob=publicationFile
[5] M. Boban and P. d’Orey, “Measurement-based Evaluation of Coop-erative awareness for V2V and V2I Communication,” in 2014 IEEEVehicular Networking Conference (VNC), Dec 2014, pp. 1–8.
[6] Information Society Technologies, “ Final Report on Link Level andSystem Level Channel Models,” Tech. Rep. IST-2003-507581 WINNERI, D5.4„ 2005.
[7] J. Gozalvez, M. Sepulcre, and R. Bauza, “IEEE 802.11p Vehicle toInfrastructure Communications in Urban Environments,” IEEE Commu-nications Magazine, vol. 50, no. 5, pp. 176–183, May 2012.
[8] V. Shivaldova, A. Winkelbauer, and C. Mecklenbrauker, “VehicularLink Performance: From Real-World Experiments to Reliability Modelsand Performance Analysis,” Proceedings of IEEE Vehicular TechnologyMagazine, vol. 8, no. 4, pp. 35–44, Dec 2013.
[9] V. Shivaldova, A. Paier, D. Smely, and C. Mecklenbrauker, “On Road-side Unit Antenna Measurements for Vehicle-to-Infrastructure Commu-nications,” in Proceedings of IEEE International Symposium on Per-sonal, Indoor and Mobile Communications (PIMRC), Sydney, Australia,September 2012, pp. 1–5.
[10] G. Maier, A. Paier, and C. Mecklenbrauker, “Performance Evaluationof IEEE 802.11p Infrastructure-to-Vehicle Real-World Measurementswith Receive Diversity,” in Proceedings of the 8th International WirelessCommunications and Mobile Computing Conference (IWCMC), Limas-sol, Cyprus, August 2012.
[11] V. Shivaldova, G. Maier, D. Smely, N. Czink, A. Alonso, A. Winkel-bauer, A. Paier, and C. Mecklenbrauker, “Performance Evaluationof IEEE 802.11p Infrastructure-to-Vehicle Tunnel Measurements,” inProceedings of International Wireless Communications and MobileComputing Conference (IWCMC), Istanbul, Turkey, July 2011, pp. 1–5.
[12] T. Paulin and S. Bessler, “Controlled Probing - A System for TargetedFloating Car Data Collection,” in IEEE Intelligent Transportation Sys-tems (ITSC), Oct 2013, pp. 1095–1100.
[13] NS-3. [Online]. Available: http://www.nsnam.org/[14] O. Altintas, F. Dressler, F. Hagenauer, M. Matsumoto, M. Sepulcre, and
C. Sommer, “Making Cars a Main ICT Resource in Smart Cities,” inProceedings of First International Workshop on Smart Cities and UrbanInformatics, Hong Kong, China, April 2015.
[15] B. Aygun and A. Wyglinski, “Channel Modeling of Decode-and-ForwardRelaying VANETs,” in IEEE 80th Vehicular Technology Conference,Sept 2014, pp. 1–5.
[16] M. Boban, J. Barros, and O. Tonguz, “Geometry-Based Vehicle-to-Vehicle Channel Modeling for Large-Scale Simulation,” IEEE Trans-actions on Vehicular Technology, vol. 63, no. 9, pp. 4146–4164, Nov2014.
[17] GEMV2I. [Online]. Available: http://vehicle2x.net/[18] M. Boban, T. Vinhoza, M. Ferreira, J. Barros, and O. Tonguz, “Impact
of Vehicles as Obstacles in Vehicular Ad Hoc Networks,” IEEE Journalon Selected Areas in Communications, vol. 29, no. 1, pp. 15–28, January2011.
[19] Simulation of Urban MObility (SUMO). [Online]. Available: http://sumo.dlr.de/wiki/Main_Page
[20] Open Street Map. [Online]. Available: http://www.openstreetmap.org[21] T. S. Rappaport, Wireless Communications: Principles and Practice.
Prentice Hall, 1996.[22] J. Goldhirsh and W. J. Vogel, “Handbook of Propagation Effects
for Vehicular and Personal Mobile Satellite Systems – Overview ofExperimental and Modeling Results,” The Johns Hopkins University,Tech. Rep. A2A-98-U-0-021 (APL), EERL-98-12A (EERL), December1998.
[23] J. Karedal, F. Tufvesson, T. Abbas, O. Klemp, A. Paier, L. Bernado,and A. Molisch, “Radio Channel Measurements at Street Intersectionsfor Vehicle-to-Vehicle Safety Applications,” in IEEE 71st VehicularTechnology Conference, May 2010, pp. 1–5.
[24] J. K. Taimoor Abbas, Katrin Sjoberg and F. Tufvesson, “A MeasurementBased Shadow Fading Model for Vehicle-to-Vehicle Network Simula-tions,” International Journal of Antennas and Propagation, 2015.
[25] W. Viriyasitavat, M. Boban, H.-M. Tsai, and A. Vasilakos, “VehicularCommunications: Survey and Challenges of Channel and PropagationModels,” IEEE Vehicular Technology Magazine, vol. 10, no. 2, pp. 55–66, June 2015.
[26] L. Cheng, B. Henty, D. Stancil, F. Bai, and P. Mudalige, “MobileVehicle-to-Vehicle Narrow-Band Channel Measurement and Characteri-zation of the 5.9 GHz Dedicated Short Range Communication (DSRC)Frequency Band,” IEEE Journal on Selected Areas in Communications,vol. 25, no. 8, pp. 1501–1516, Oct 2007.