Embed Size (px)
Citation preview
Geomorphological evidences of post-LGM glacialadvancements in the Himalaya: A study fromChorabari Glacier, Garhwal Himalaya, India
Manish Mehta, Zahid Majeed, D P Dobhal and Pradeep Srivastava∗
Wadia Institute of Himalayan Geology, 33 GMS Road, Dehra Dun 249 001, India.∗Corresponding author. e-mail: [email protected]
Field geomorphology and remote sensing data, supported by Optical Stimulated Luminescence (OSL)dating from the Mandakini river valley of the Garhwal Himalaya enabled identification of four majorglacial events; Rambara Glacial Stage (RGS) (13 ± 2 ka), Ghindurpani Glacial Stage (GhGS) (9 ± 1 ka),Garuriya Glacial Stage (GGS) (7 ± 1 ka) and Kedarnath Glacial Stage (KGS) (5 ± 1 ka). RGS was themost extensive glaciation extending for ∼6 km down the valley from the present day snout and loweredto an altitude of 2800 m asl at Rambara covering around ∼31 km2 area of the Mandakini river valley.Compared to this, the other three glaciations (viz., GhGS, GGS and KGS) were of lower magnitudesterminating around ∼3000, ∼3300 and ∼3500 m asl, respectively. It was also observed that the meanequilibrium line altitude (ELA) during RGS was lowered to 4747 m asl compared to the present levelof 5120 m asl. This implies an ELA depression of ∼373 m during the RGS which would correspondto a lowering of ∼2◦C summer temperature during the RGS. The results are comparable to that ofthe adjacent western and central Himalaya implying a common forcing factor that we attribute to theinsolation-driven monsoon precipitation in the western and central Himalaya.
1. Introduction
The Himalayan climate is largely controlled by themid-latitude westerlies and Indian summer mon-soon (ISM). Based on relative dominance of thesetwo weather systems, the Himalaya can be dividedinto three zones, viz., western, central and easternzones. Eastern Himalaya is predominantly influ-enced by the ISM implying that it receives snowfallmainly during the summers. The western Himalayais dominated by the mid-latitude westerlies andreceives snowfall during winter (Benn and Owen1998). Compared to this, the central Himalayareceives snowfall both due to the ISM and the mid-latitude westerlies. Therefore, during the north-ern hemisphere winter when the Inter Tropical
Convergence Zone (ITCZ) descends south of theequator, most glaciers in the western Himalayashow maximum advancement and those in the Cen-tral and eastern Himalaya (ISM-dominated) showlittle or no advancement (Owen et al 1996). Thusthe history of glacial advancement and retreatmimics the movement of ITCZ and strength ofISM. In the Himalaya, the glacial history is rela-tively well-known from several glaciers dominatedby westerlies, e.g., Hunza valley, Nanga Parbat(Phillips et al 2000; Owen et al 2002); Tibet (Owenet al 2003a, b, c) and Nepal. In the Indian context,from the reaches that are affected by ISM, a com-paratively lower number of chronological studiesare published. Optically stimulated luminescence(OSL) and cosmogenic radionuclide dating has
Keywords. Glacial advancements; NW Himalaya; Chorabari Glacier; equilibrium line altitude; luminescence dating.
J. Earth Syst. Sci. 121, No. 1, February 2012, pp. 149–163c© Indian Academy of Sciences 149
150 Manish Mehta et al
been applied to glacial deposits in the high moun-tains of the Himalaya and Karakoram (Richardset al 2000a, 2000b; Owen et al 2002; Tsukamotoet al 2002), the Nanga parvat Himalaya (Shroderet al 1989, 1993; Scott 1992), Kashmir Himalaya(Holmes and Street-Perrott 1989), Ladakh(Burbank and Fort 1985; Osmaston et al 1994).However, such records from the ISM-dominatedzones are rare from the Garhwal Himalaya(Sharma and Owen 1996; Barnard et al 2004a;Nainwal et al 2007; Scherler et al 2010). However,to develop better understanding of the glacialresponses to climate variation the dating of severalISM dominated glacier records is sympathetic.This paper reports the result of OSL dating ofpreserved generations of moraines from ChorabariGlacier. Further, the extent of moraine has beenused to compute the past variations in equilib-rium line altitude (ELA) and finally an attempthas been made to compare the records with pastmonsoon fluctuations.
2. Area profile
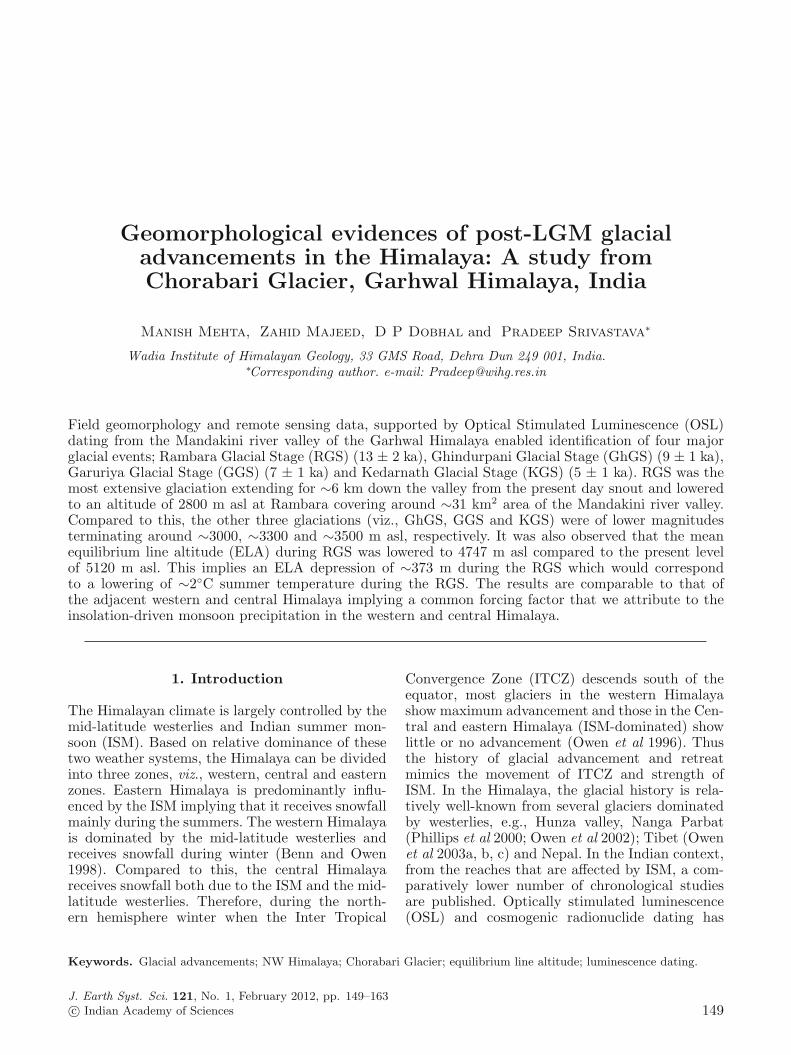
The Chorabari Glacier is located in the westernextremity of the central Himalaya (30◦41′–30◦48′Nand 79◦1′–79◦6′E; figure 1a) having the southernaspect of Mandakini valley and an average gra-dient of ∼16◦ with total glaciated area around15 km2. The head of the glacier lies at an eleva-tion of 6500 m asl whereas the snout is locatedat 3865 m asl (figure 1b). This glacier is thesource of the Mandakini River which eventuallyjoins the Alaknanda River near Rudraprayag. Geo-logically, the area situated north of the PindariThrust comprises of calc silicate, biotite gneisses,and schist, and granite pegmatite apatite veinsbelonging to the Pindari Formation (Valdiya et al1999). Above 3865 m glacier processes dominate,whereas between 3865 and 2800 m asl is dominatedby glacio-fluvial processes (figure 1b).
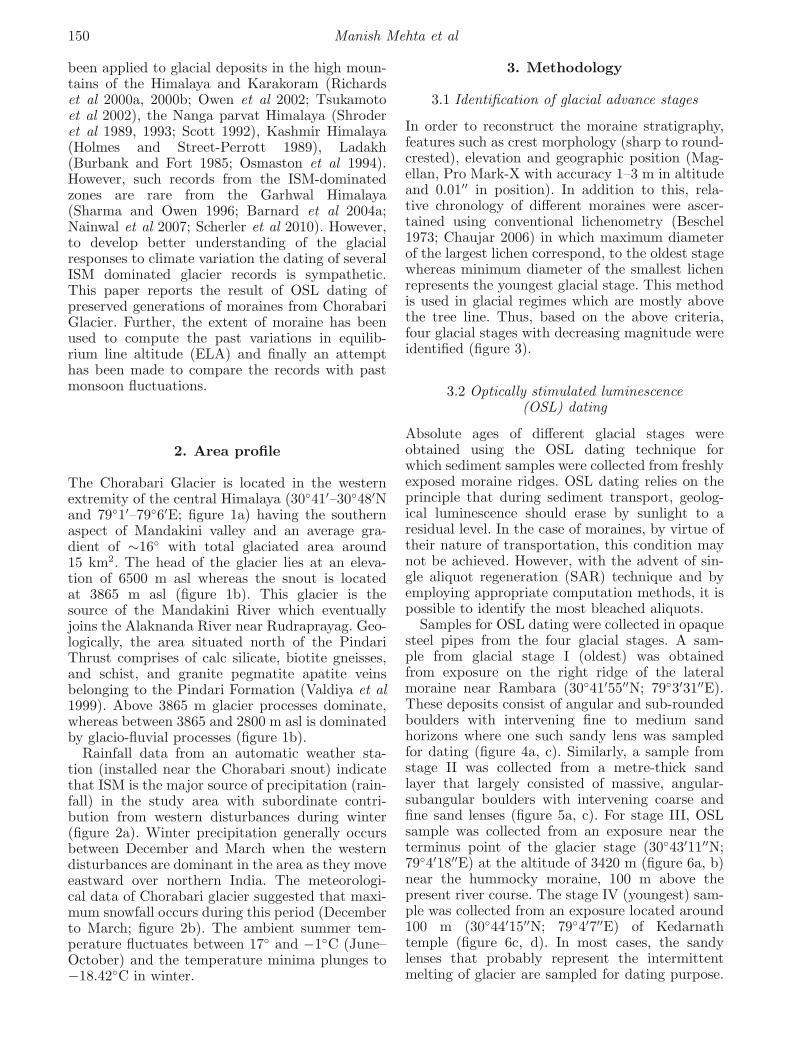
Rainfall data from an automatic weather sta-tion (installed near the Chorabari snout) indicatethat ISM is the major source of precipitation (rain-fall) in the study area with subordinate contri-bution from western disturbances during winter(figure 2a). Winter precipitation generally occursbetween December and March when the westerndisturbances are dominant in the area as they moveeastward over northern India. The meteorologi-cal data of Chorabari glacier suggested that maxi-mum snowfall occurs during this period (Decemberto March; figure 2b). The ambient summer tem-perature fluctuates between 17◦ and −1◦C (June–October) and the temperature minima plunges to−18.42◦C in winter.
3. Methodology
3.1 Identification of glacial advance stages
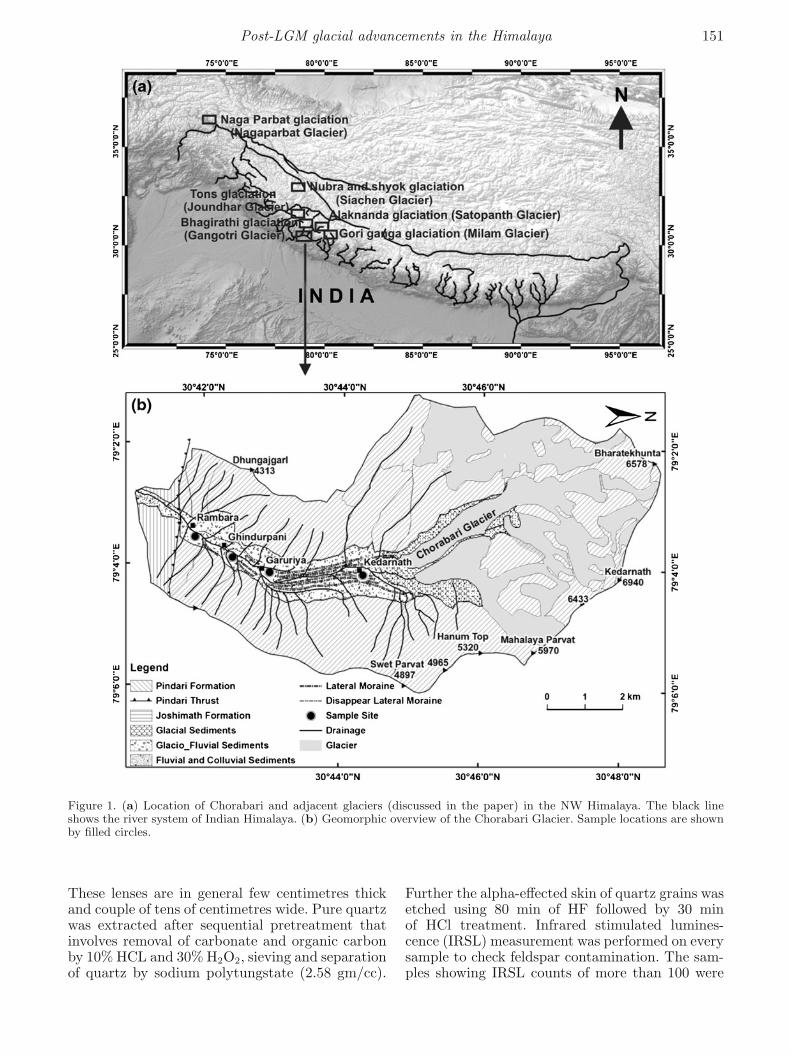
In order to reconstruct the moraine stratigraphy,features such as crest morphology (sharp to round-crested), elevation and geographic position (Mag-ellan, Pro Mark-X with accuracy 1–3 m in altitudeand 0.01′′ in position). In addition to this, rela-tive chronology of different moraines were ascer-tained using conventional lichenometry (Beschel1973; Chaujar 2006) in which maximum diameterof the largest lichen correspond, to the oldest stagewhereas minimum diameter of the smallest lichenrepresents the youngest glacial stage. This methodis used in glacial regimes which are mostly abovethe tree line. Thus, based on the above criteria,four glacial stages with decreasing magnitude wereidentified (figure 3).
3.2 Optically stimulated luminescence(OSL) dating
Absolute ages of different glacial stages wereobtained using the OSL dating technique forwhich sediment samples were collected from freshlyexposed moraine ridges. OSL dating relies on theprinciple that during sediment transport, geolog-ical luminescence should erase by sunlight to aresidual level. In the case of moraines, by virtue oftheir nature of transportation, this condition maynot be achieved. However, with the advent of sin-gle aliquot regeneration (SAR) technique and byemploying appropriate computation methods, it ispossible to identify the most bleached aliquots.
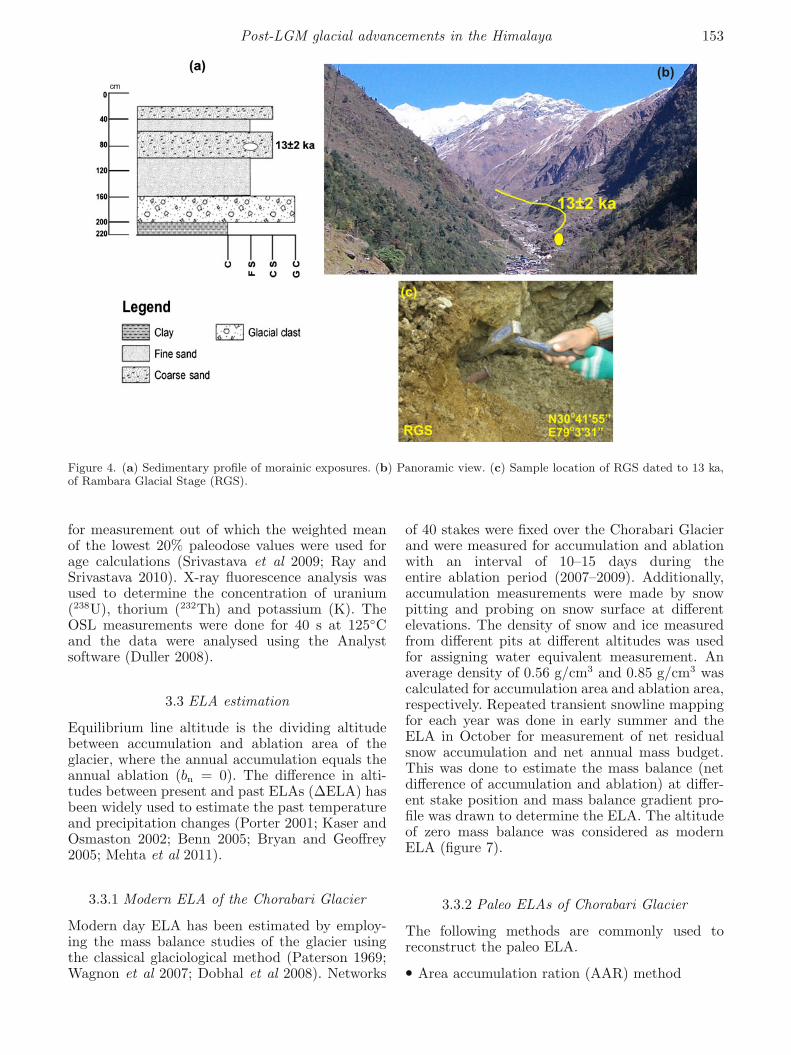
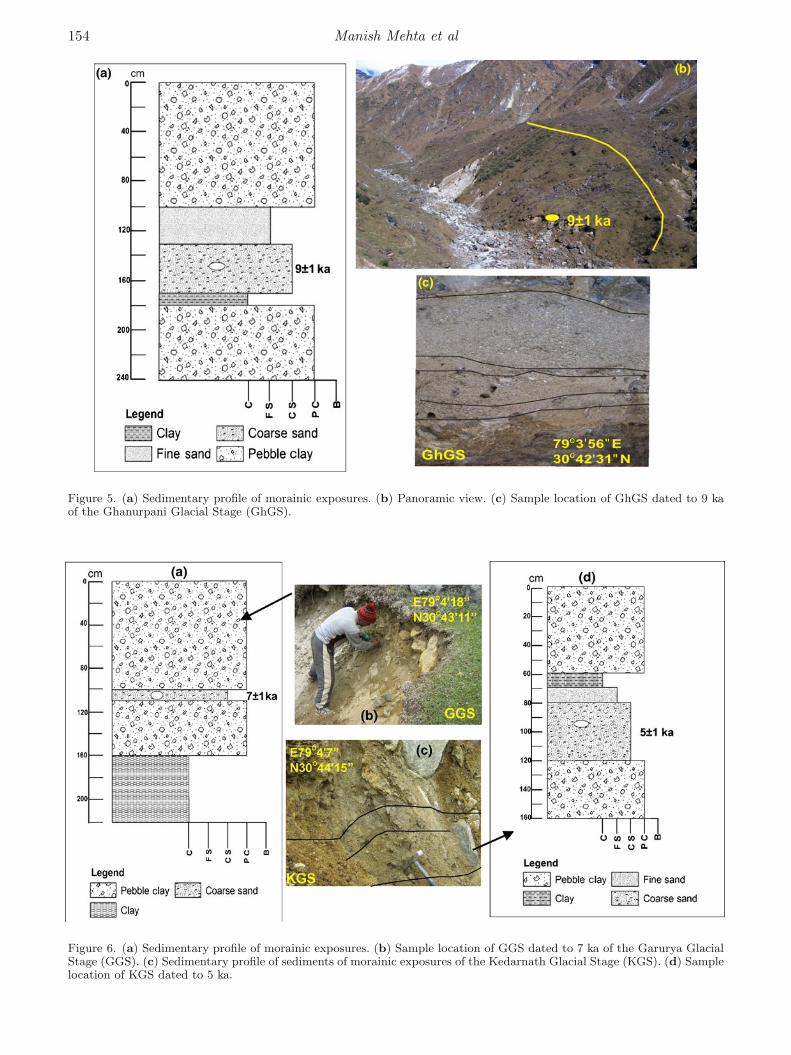
Samples for OSL dating were collected in opaquesteel pipes from the four glacial stages. A sam-ple from glacial stage I (oldest) was obtainedfrom exposure on the right ridge of the lateralmoraine near Rambara (30◦41′55′′N; 79◦3′31′′E).These deposits consist of angular and sub-roundedboulders with intervening fine to medium sandhorizons where one such sandy lens was sampledfor dating (figure 4a, c). Similarly, a sample fromstage II was collected from a metre-thick sandlayer that largely consisted of massive, angular-subangular boulders with intervening coarse andfine sand lenses (figure 5a, c). For stage III, OSLsample was collected from an exposure near theterminus point of the glacier stage (30◦43′11′′N;79◦4′18′′E) at the altitude of 3420 m (figure 6a, b)near the hummocky moraine, 100 m above thepresent river course. The stage IV (youngest) sam-ple was collected from an exposure located around100 m (30◦44′15′′N; 79◦4′7′′E) of Kedarnathtemple (figure 6c, d). In most cases, the sandylenses that probably represent the intermittentmelting of glacier are sampled for dating purpose.
Post-LGM glacial advancements in the Himalaya 151
Figure 1. (a) Location of Chorabari and adjacent glaciers (discussed in the paper) in the NW Himalaya. The black lineshows the river system of Indian Himalaya. (b) Geomorphic overview of the Chorabari Glacier. Sample locations are shownby filled circles.
These lenses are in general few centimetres thickand couple of tens of centimetres wide. Pure quartzwas extracted after sequential pretreatment thatinvolves removal of carbonate and organic carbonby 10% HCL and 30% H2O2, sieving and separationof quartz by sodium polytungstate (2.58 gm/cc).
Further the alpha-effected skin of quartz grains wasetched using 80 min of HF followed by 30 minof HCl treatment. Infrared stimulated lumines-cence (IRSL) measurement was performed on everysample to check feldspar contamination. The sam-ples showing IRSL counts of more than 100 were
152 Manish Mehta et al
Figure 2. Precipitation pattern of Chorabari Glacier taken by Automatic Weather Station 9AWS) at 3800 m asl. (a) Winterprecipitation (snowfall), (b) summer monsoon precipitation (rainfall).
subjected to the additional step of density separa-tion and HF etching for 20 min. Finally, 9.65 mmstainless-steel discs were used to mount the cleanquartz grains by using Silko-Spray silicone oil.
The equivalent dose was determined using SARprotocol based on Murray and Wintle (2000). Allanalyses were performed using a RISØ TL-OSL DA12 automated luminescence reader system equipped
with an Sr-90 beta irradiator (6.7 Gy/min). TheOSL emission was stimulated by blue LEDs with90% optical power and was detected by EMI9235 QA photomultiplier for photon detectionwith attached Schott BG-39 and Hoya U-340optical filters. The preheat temperature was setto 220◦C/10 s, and the cut-heat temperature to160◦C. For every sample, 30–35 discs were used
Figure 3. Photograph showing the different stages of glacier moraine in Chorabari Glacier region of Mandakini valley. Notethe positions of lateral moraines of different glacial stages.
Post-LGM glacial advancements in the Himalaya 153
Figure 4. (a) Sedimentary profile of morainic exposures. (b) Panoramic view. (c) Sample location of RGS dated to 13 ka,of Rambara Glacial Stage (RGS).
for measurement out of which the weighted meanof the lowest 20% paleodose values were used forage calculations (Srivastava et al 2009; Ray andSrivastava 2010). X-ray fluorescence analysis wasused to determine the concentration of uranium(238U), thorium (232Th) and potassium (K). TheOSL measurements were done for 40 s at 125◦Cand the data were analysed using the Analystsoftware (Duller 2008).
3.3 ELA estimation
Equilibrium line altitude is the dividing altitudebetween accumulation and ablation area of theglacier, where the annual accumulation equals theannual ablation (bn = 0). The difference in alti-tudes between present and past ELAs (ΔELA) hasbeen widely used to estimate the past temperatureand precipitation changes (Porter 2001; Kaser andOsmaston 2002; Benn 2005; Bryan and Geoffrey2005; Mehta et al 2011).
3.3.1 Modern ELA of the Chorabari Glacier
Modern day ELA has been estimated by employ-ing the mass balance studies of the glacier usingthe classical glaciological method (Paterson 1969;Wagnon et al 2007; Dobhal et al 2008). Networks
of 40 stakes were fixed over the Chorabari Glacierand were measured for accumulation and ablationwith an interval of 10–15 days during theentire ablation period (2007–2009). Additionally,accumulation measurements were made by snowpitting and probing on snow surface at differentelevations. The density of snow and ice measuredfrom different pits at different altitudes was usedfor assigning water equivalent measurement. Anaverage density of 0.56 g/cm3 and 0.85 g/cm3 wascalculated for accumulation area and ablation area,respectively. Repeated transient snowline mappingfor each year was done in early summer and theELA in October for measurement of net residualsnow accumulation and net annual mass budget.This was done to estimate the mass balance (netdifference of accumulation and ablation) at differ-ent stake position and mass balance gradient pro-file was drawn to determine the ELA. The altitudeof zero mass balance was considered as modernELA (figure 7).
3.3.2 Paleo ELAs of Chorabari Glacier
The following methods are commonly used toreconstruct the paleo ELA.
• Area accumulation ration (AAR) method
154 Manish Mehta et al
Figure 5. (a) Sedimentary profile of morainic exposures. (b) Panoramic view. (c) Sample location of GhGS dated to 9 kaof the Ghanurpani Glacial Stage (GhGS).
Figure 6. (a) Sedimentary profile of morainic exposures. (b) Sample location of GGS dated to 7 ka of the Garurya GlacialStage (GGS). (c) Sedimentary profile of sediments of morainic exposures of the Kedarnath Glacial Stage (KGS). (d) Samplelocation of KGS dated to 5 ka.
Post-LGM glacial advancements in the Himalaya 155
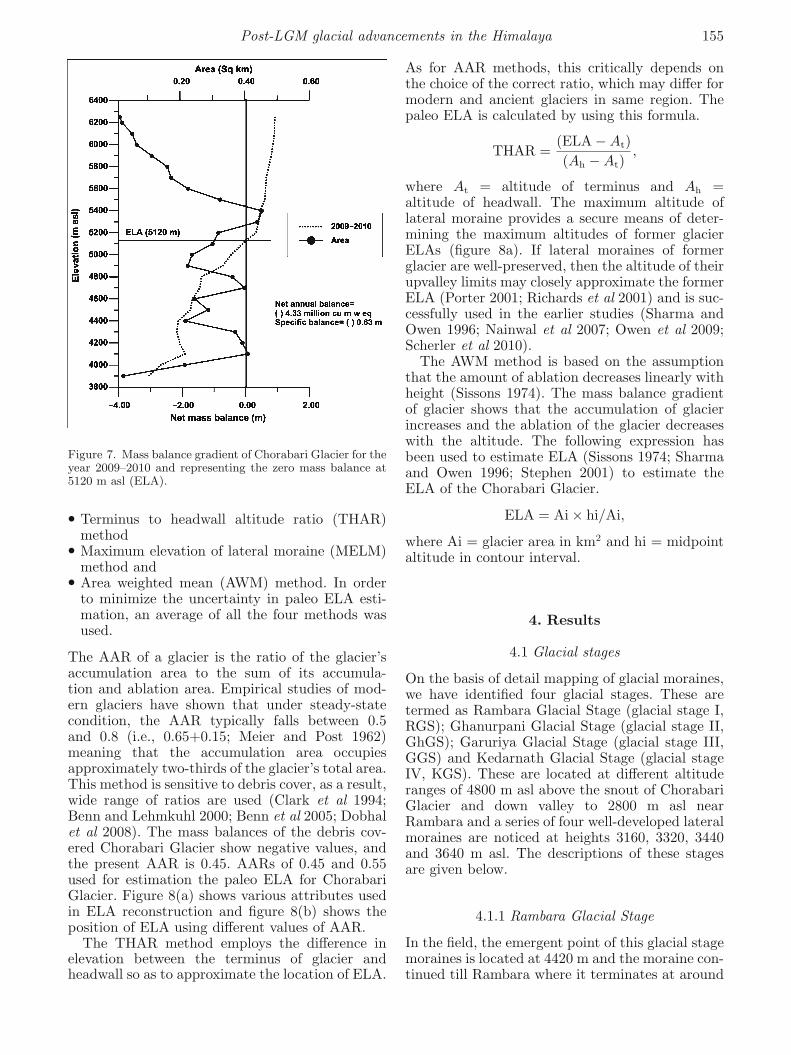
Figure 7. Mass balance gradient of Chorabari Glacier for theyear 2009–2010 and representing the zero mass balance at5120 m asl (ELA).
• Terminus to headwall altitude ratio (THAR)method
• Maximum elevation of lateral moraine (MELM)method and
• Area weighted mean (AWM) method. In orderto minimize the uncertainty in paleo ELA esti-mation, an average of all the four methods wasused.
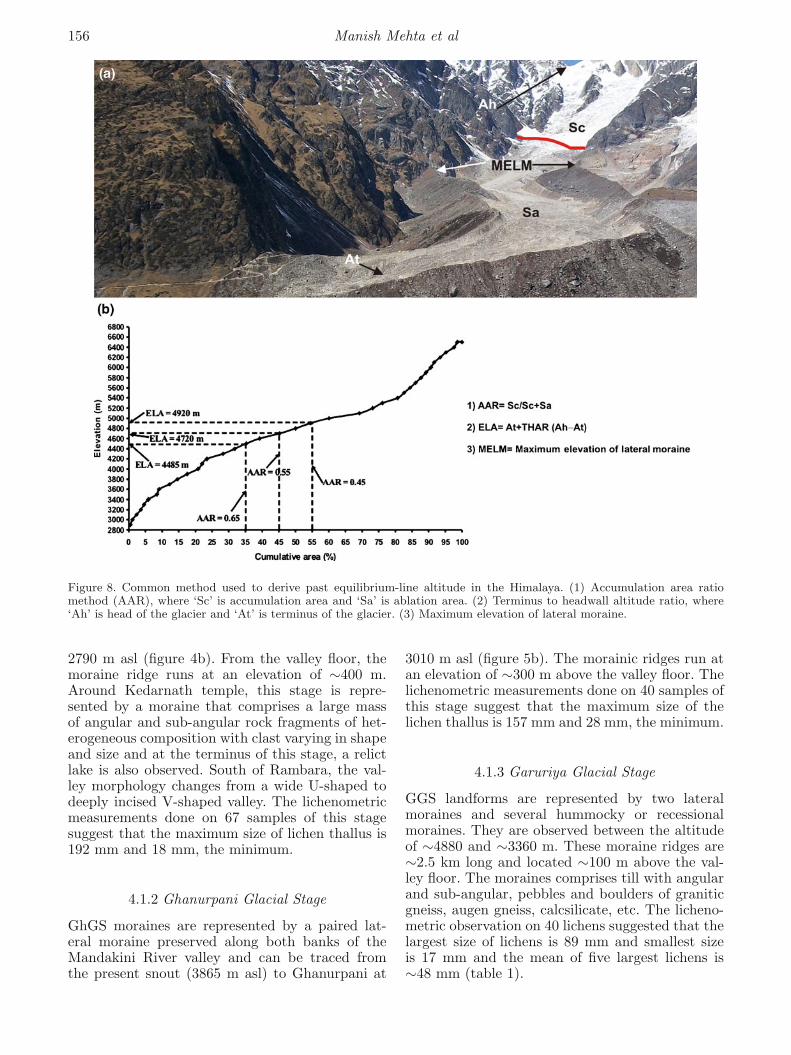
The AAR of a glacier is the ratio of the glacier’saccumulation area to the sum of its accumula-tion and ablation area. Empirical studies of mod-ern glaciers have shown that under steady-statecondition, the AAR typically falls between 0.5and 0.8 (i.e., 0.65+0.15; Meier and Post 1962)meaning that the accumulation area occupiesapproximately two-thirds of the glacier’s total area.This method is sensitive to debris cover, as a result,wide range of ratios are used (Clark et al 1994;Benn and Lehmkuhl 2000; Benn et al 2005; Dobhalet al 2008). The mass balances of the debris cov-ered Chorabari Glacier show negative values, andthe present AAR is 0.45. AARs of 0.45 and 0.55used for estimation the paleo ELA for ChorabariGlacier. Figure 8(a) shows various attributes usedin ELA reconstruction and figure 8(b) shows theposition of ELA using different values of AAR.
The THAR method employs the difference inelevation between the terminus of glacier andheadwall so as to approximate the location of ELA.
As for AAR methods, this critically depends onthe choice of the correct ratio, which may differ formodern and ancient glaciers in same region. Thepaleo ELA is calculated by using this formula.
THAR =(ELA − At)(Ah − At)
,
where At = altitude of terminus and Ah =altitude of headwall. The maximum altitude oflateral moraine provides a secure means of deter-mining the maximum altitudes of former glacierELAs (figure 8a). If lateral moraines of formerglacier are well-preserved, then the altitude of theirupvalley limits may closely approximate the formerELA (Porter 2001; Richards et al 2001) and is suc-cessfully used in the earlier studies (Sharma andOwen 1996; Nainwal et al 2007; Owen et al 2009;Scherler et al 2010).
The AWM method is based on the assumptionthat the amount of ablation decreases linearly withheight (Sissons 1974). The mass balance gradientof glacier shows that the accumulation of glacierincreases and the ablation of the glacier decreaseswith the altitude. The following expression hasbeen used to estimate ELA (Sissons 1974; Sharmaand Owen 1996; Stephen 2001) to estimate theELA of the Chorabari Glacier.
ELA = Ai × hi/Ai,
where Ai = glacier area in km2 and hi = midpointaltitude in contour interval.
4. Results
4.1 Glacial stages
On the basis of detail mapping of glacial moraines,we have identified four glacial stages. These aretermed as Rambara Glacial Stage (glacial stage I,RGS); Ghanurpani Glacial Stage (glacial stage II,GhGS); Garuriya Glacial Stage (glacial stage III,GGS) and Kedarnath Glacial Stage (glacial stageIV, KGS). These are located at different altituderanges of 4800 m asl above the snout of ChorabariGlacier and down valley to 2800 m asl nearRambara and a series of four well-developed lateralmoraines are noticed at heights 3160, 3320, 3440and 3640 m asl. The descriptions of these stagesare given below.
4.1.1 Rambara Glacial Stage
In the field, the emergent point of this glacial stagemoraines is located at 4420 m and the moraine con-tinued till Rambara where it terminates at around
156 Manish Mehta et al
Figure 8. Common method used to derive past equilibrium-line altitude in the Himalaya. (1) Accumulation area ratiomethod (AAR), where ‘Sc’ is accumulation area and ‘Sa’ is ablation area. (2) Terminus to headwall altitude ratio, where‘Ah’ is head of the glacier and ‘At’ is terminus of the glacier. (3) Maximum elevation of lateral moraine.
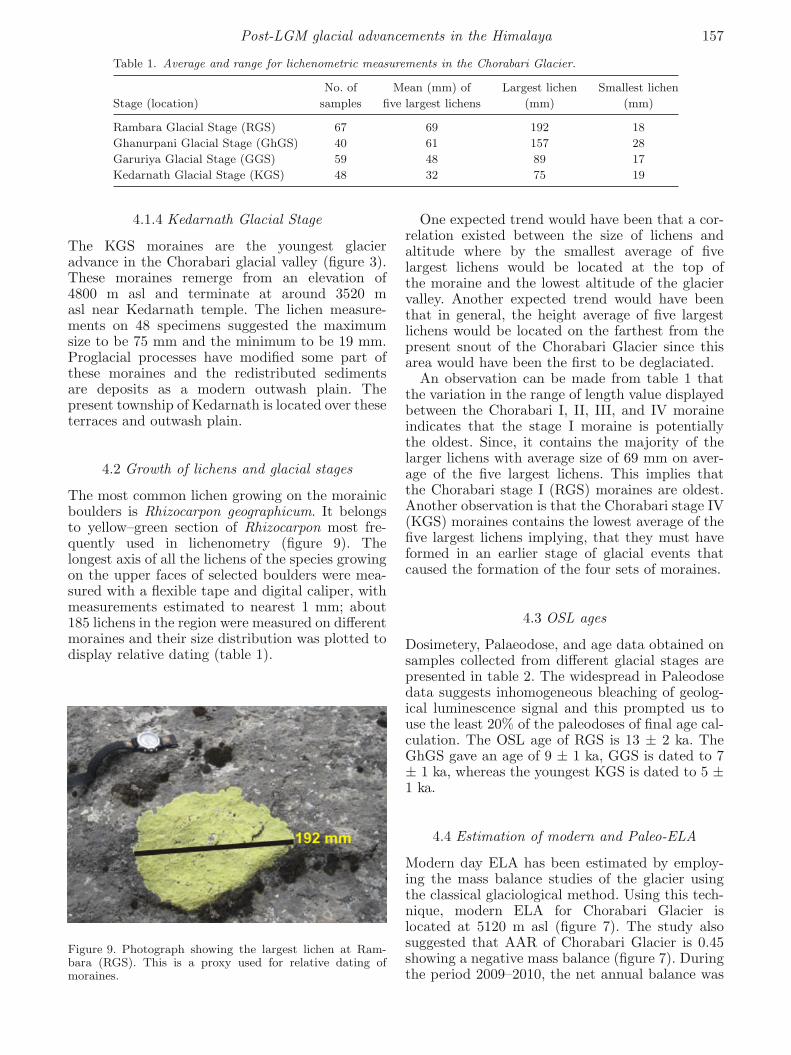
2790 m asl (figure 4b). From the valley floor, themoraine ridge runs at an elevation of ∼400 m.Around Kedarnath temple, this stage is repre-sented by a moraine that comprises a large massof angular and sub-angular rock fragments of het-erogeneous composition with clast varying in shapeand size and at the terminus of this stage, a relictlake is also observed. South of Rambara, the val-ley morphology changes from a wide U-shaped todeeply incised V-shaped valley. The lichenometricmeasurements done on 67 samples of this stagesuggest that the maximum size of lichen thallus is192 mm and 18 mm, the minimum.
4.1.2 Ghanurpani Glacial Stage
GhGS moraines are represented by a paired lat-eral moraine preserved along both banks of theMandakini River valley and can be traced fromthe present snout (3865 m asl) to Ghanurpani at
3010 m asl (figure 5b). The morainic ridges run atan elevation of ∼300 m above the valley floor. Thelichenometric measurements done on 40 samples ofthis stage suggest that the maximum size of thelichen thallus is 157 mm and 28 mm, the minimum.
4.1.3 Garuriya Glacial Stage
GGS landforms are represented by two lateralmoraines and several hummocky or recessionalmoraines. They are observed between the altitudeof ∼4880 and ∼3360 m. These moraine ridges are∼2.5 km long and located ∼100 m above the val-ley floor. The moraines comprises till with angularand sub-angular, pebbles and boulders of graniticgneiss, augen gneiss, calcsilicate, etc. The licheno-metric observation on 40 lichens suggested that thelargest size of lichens is 89 mm and smallest sizeis 17 mm and the mean of five largest lichens is∼48 mm (table 1).
Post-LGM glacial advancements in the Himalaya 157
Table 1. Average and range for lichenometric measurements in the Chorabari Glacier.
No. of Mean (mm) of Largest lichen Smallest lichen
Stage (location) samples five largest lichens (mm) (mm)
Rambara Glacial Stage (RGS) 67 69 192 18
Ghanurpani Glacial Stage (GhGS) 40 61 157 28
Garuriya Glacial Stage (GGS) 59 48 89 17
Kedarnath Glacial Stage (KGS) 48 32 75 19
4.1.4 Kedarnath Glacial Stage
The KGS moraines are the youngest glacieradvance in the Chorabari glacial valley (figure 3).These moraines remerge from an elevation of4800 m asl and terminate at around 3520 masl near Kedarnath temple. The lichen measure-ments on 48 specimens suggested the maximumsize to be 75 mm and the minimum to be 19 mm.Proglacial processes have modified some part ofthese moraines and the redistributed sedimentsare deposits as a modern outwash plain. Thepresent township of Kedarnath is located over theseterraces and outwash plain.
4.2 Growth of lichens and glacial stages
The most common lichen growing on the morainicboulders is Rhizocarpon geographicum. It belongsto yellow–green section of Rhizocarpon most fre-quently used in lichenometry (figure 9). Thelongest axis of all the lichens of the species growingon the upper faces of selected boulders were mea-sured with a flexible tape and digital caliper, withmeasurements estimated to nearest 1 mm; about185 lichens in the region were measured on differentmoraines and their size distribution was plotted todisplay relative dating (table 1).
Figure 9. Photograph showing the largest lichen at Ram-bara (RGS). This is a proxy used for relative dating ofmoraines.
One expected trend would have been that a cor-relation existed between the size of lichens andaltitude where by the smallest average of fivelargest lichens would be located at the top ofthe moraine and the lowest altitude of the glaciervalley. Another expected trend would have beenthat in general, the height average of five largestlichens would be located on the farthest from thepresent snout of the Chorabari Glacier since thisarea would have been the first to be deglaciated.
An observation can be made from table 1 thatthe variation in the range of length value displayedbetween the Chorabari I, II, III, and IV moraineindicates that the stage I moraine is potentiallythe oldest. Since, it contains the majority of thelarger lichens with average size of 69 mm on aver-age of the five largest lichens. This implies thatthe Chorabari stage I (RGS) moraines are oldest.Another observation is that the Chorabari stage IV(KGS) moraines contains the lowest average of thefive largest lichens implying, that they must haveformed in an earlier stage of glacial events thatcaused the formation of the four sets of moraines.
4.3 OSL ages
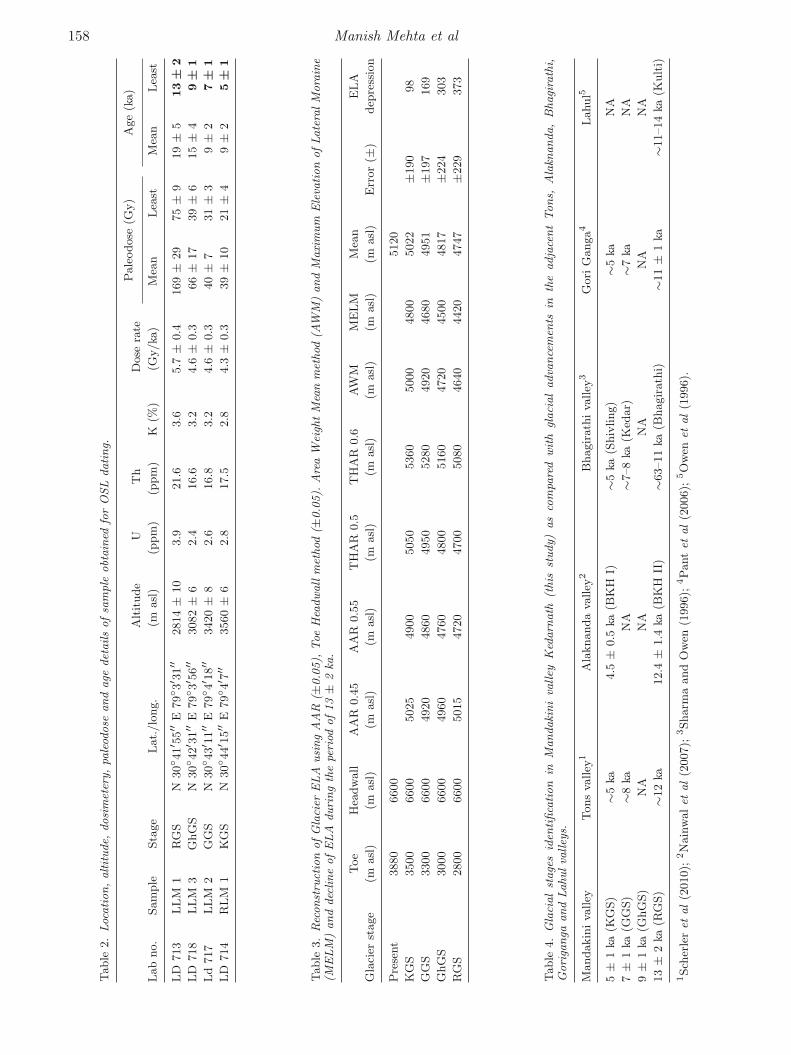
Dosimetery, Palaeodose, and age data obtained onsamples collected from different glacial stages arepresented in table 2. The widespread in Paleodosedata suggests inhomogeneous bleaching of geolog-ical luminescence signal and this prompted us touse the least 20% of the paleodoses of final age cal-culation. The OSL age of RGS is 13 ± 2 ka. TheGhGS gave an age of 9 ± 1 ka, GGS is dated to 7± 1 ka, whereas the youngest KGS is dated to 5 ±1 ka.
4.4 Estimation of modern and Paleo-ELA
Modern day ELA has been estimated by employ-ing the mass balance studies of the glacier usingthe classical glaciological method. Using this tech-nique, modern ELA for Chorabari Glacier islocated at 5120 m asl (figure 7). The study alsosuggested that AAR of Chorabari Glacier is 0.45showing a negative mass balance (figure 7). Duringthe period 2009–2010, the net annual balance was
158 Manish Mehta et al
Table
2.
Loc
ation,altitude,
dosi
met
ery,
paleod
ose
and
age
det
ails
ofsa
mple
obt
ain
edfo
rO
SL
dating.
Alt
itude
UT
hD
ose
rate
Pale
odose
(Gy)
Age
(ka)
Lab
no.
Sam
ple
Sta
ge
Lat.
/lo
ng.
(masl
)(p
pm
)(p
pm
)K
(%)
(Gy/ka
)M
ean
Lea
stM
ean
Lea
st
LD
713
LLM
1R
GS
N30◦ 4
1′ 5
5′′
E79◦ 3
′ 31′′
2814±
10
3.9
21.6
3.6
5.7
±0.4
169±
29
75±
919±
513
±2
LD
718
LLM
3G
hG
SN
30◦ 4
2′ 3
1′′
E79◦ 3
′ 56′′
3082±
62.4
16.6
3.2
4.6
±0.3
66±
17
39±
615±
49
±1
Ld
717
LLM
2G
GS
N30◦ 4
3′ 1
1′′
E79◦ 4
′ 18′′
3420±
82.6
16.8
3.2
4.6
±0.3
40±
731±
39±
27
±1
LD
714
RLM
1K
GS
N30◦ 4
4′ 1
5′′
E79◦ 4
′ 7′′
3560±
62.8
17.5
2.8
4.3
±0.3
39±
10
21±
49±
25
±1
Table
3.
Rec
onst
ruct
ion
ofG
laci
erELA
usi
ng
AA
R(±
0.0
5),
Toe
Hea
dwall
met
hod
(±0.0
5).
Are
aW
eigh
tM
ean
met
hod
(AW
M)
and
Maxi
mum
Ele
vation
ofLate
ralM
ora
ine
(MELM
)and
dec
line
ofELA
duri
ng
the
peri
odof13±
2ka
.
Toe
Hea
dw
all
AA
R0.4
5A
AR
0.5
5T
HA
R0.5
TH
AR
0.6
AW
MM
ELM
Mea
nE
LA
Gla
cier
stage
(masl
)(m
asl
)(m
asl
)(m
asl
)(m
asl
)(m
asl
)(m
asl
)(m
asl
)(m
asl
)E
rror
(±)
dep
ress
ion
Pre
sent
3880
6600
5120
KG
S3500
6600
5025
4900
5050
5360
5000
4800
5022
±190
98
GG
S3300
6600
4920
4860
4950
5280
4920
4680
4951
±197
169
GhG
S3000
6600
4960
4760
4800
5160
4720
4500
4817
±224
303
RG
S2800
6600
5015
4720
4700
5080
4640
4420
4747
±229
373
Table
4.
Gla
cial
stage
sid
entifica
tion
inM
andaki
ni
valley
Ked
arn
ath
(this
study)
as
com
pare
dwith
glaci
al
adva
nce
men
tsin
the
adja
cent
Tons,
Ala
knanda,
Bhagi
rath
i,G
ori
ganga
and
Lahulva
lley
s.
Mandakin
iva
lley
Tons
valley
1A
laknanda
valley
2B
hagir
ath
iva
lley
3G
ori
Ganga4
Lahul5
5±
1ka
(KG
S)
∼5
ka4.5
±0.5
ka(B
KH
I)∼
5ka
(Shiv
ling)
∼5
kaN
A
7±
1ka
(GG
S)
∼8
kaN
A∼
7–8
ka(K
edar)
∼7
kaN
A
9±
1ka
(GhG
S)
NA
NA
NA
NA
NA
13±
2ka
(RG
S)
∼12
ka12.4
±1.4
ka(B
KH
II)
∼63–11
ka(B
hagir
ath
i)∼
11±
1ka
∼11–14
ka(K
ult
i)
1Sch
erle
ret
al
(2010);
2N
ain
walet
al
(2007);
3Sharm
aand
Ow
en(1
996);
4Pant
etal
(2006);
5O
wen
etal
(1996).
Post-LGM glacial advancements in the Himalaya 159
calculated as (−) 4.33 × 10⁶ m3 w.eq. with specificbalance of (−) 0.63 m.
Comparisons between the former and modernELAs provides information on the magnitude andextent of climate change in the mountains (Porter1977; Bradley 1985; Sharma and Owen 1996; Pantet al 2006). Reconstruction based on AAR (±0.05),THAR method (±0.05), AWM method and MELMmethod are presented in the table 3. In the follow-ing discussion, mean of all four reconstructed ELAswith standard deviation is used. Thus, steady stateformer ELAs of RGS, GhGS, GGS and KGS are4747 ± 229 m asl, 4187 ± 224 m amsl, 4951 ±197 m asl, and 5022 ± 190 m asl, respectively(table 3).
5. Discussion
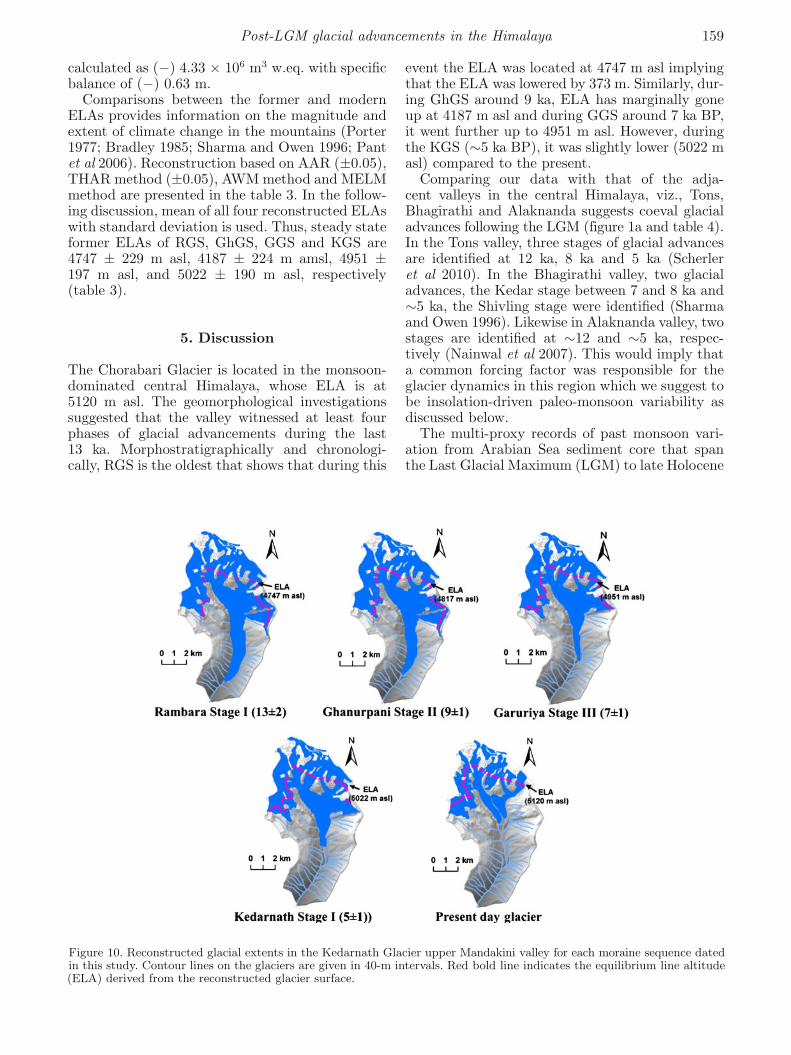
The Chorabari Glacier is located in the monsoon-dominated central Himalaya, whose ELA is at5120 m asl. The geomorphological investigationssuggested that the valley witnessed at least fourphases of glacial advancements during the last13 ka. Morphostratigraphically and chronologi-cally, RGS is the oldest that shows that during this
event the ELA was located at 4747 m asl implyingthat the ELA was lowered by 373 m. Similarly, dur-ing GhGS around 9 ka, ELA has marginally goneup at 4187 m asl and during GGS around 7 ka BP,it went further up to 4951 m asl. However, duringthe KGS (∼5 ka BP), it was slightly lower (5022 masl) compared to the present.
Comparing our data with that of the adja-cent valleys in the central Himalaya, viz., Tons,Bhagirathi and Alaknanda suggests coeval glacialadvances following the LGM (figure 1a and table 4).In the Tons valley, three stages of glacial advancesare identified at 12 ka, 8 ka and 5 ka (Scherleret al 2010). In the Bhagirathi valley, two glacialadvances, the Kedar stage between 7 and 8 ka and∼5 ka, the Shivling stage were identified (Sharmaand Owen 1996). Likewise in Alaknanda valley, twostages are identified at ∼12 and ∼5 ka, respec-tively (Nainwal et al 2007). This would imply thata common forcing factor was responsible for theglacier dynamics in this region which we suggest tobe insolation-driven paleo-monsoon variability asdiscussed below.
The multi-proxy records of past monsoon vari-ation from Arabian Sea sediment core that spanthe Last Glacial Maximum (LGM) to late Holocene
Figure 10. Reconstructed glacial extents in the Kedarnath Glacier upper Mandakini valley for each moraine sequence datedin this study. Contour lines on the glaciers are given in 40-m intervals. Red bold line indicates the equilibrium line altitude(ELA) derived from the reconstructed glacier surface.
160 Manish Mehta et al
(Overpeck 1996; Gupta et al 2003) suggested thatthe monsoon strengthened in a series of abruptevents over the last deglaciation. They suggest thetwo episodes of increases in monsoon intensity tookplace between 13 and 12.5 ka and, between 10 and9.5 ka. In the downstream, in the Alaknanda val-ley, the deglaciation is documented in the form ofincreasing discharge, sediment load leading to val-ley aggradation up to ∼11 ka and the peak of warmand wet conditions is seen after 11 ka in the formof river incision (Ray and Srivastava 2010). Peatbog data from Bhagirathi valley suggest a strength-ened monsoon in the central Himalaya around 7 kaand 5 ka (Phadtare 2000). In the Ganga Plain,Sanai lake data indicate a strengthened monsoonbetween 7 and 5 ka (Sharma et al 2006). Consid-ering the above, we hypothesized that ChorabariGlacier responded to the periods of enhanced ISM.
5.1 Ice extent, ELA and climate change
Chorabari is a compound valley glacier having atotal catchment area of ∼67 km2 (up to Ram-bara). In the Mandakini river valley, four glacia-tions can be observed, the oldest stage (RGS) tookplace around 13 ka BP during which the glaciercovered about 46% (∼31 km2) area and snout waslocated at ∼2800 m asl (figure 10). The mean ELAof the RSG was estimated to be 4747 ± 229 m asl.The adiabatic lapse rate used is an intermediatebetween a moist (5◦C/km) and dry (10◦C/km), orby taking actual field measurements (Seltzer 1994;Osipov and Khlystov 2010). We have assumed avalue of 6◦C/km (neglecting precipitation change)based on a 3-year (1998–2000) meteorological dataavailable from the Dokriani Glacier in the centralHimalaya (Thayyen et al 2005). This value rep-resents the average lapse rate for the accumula-tion and ablation period in the Dokrani glacier.The reconstructed model suggests a temperaturedecline of ∼2◦C during the RSG advancement(table 5).
It is difficult to calculate the extent of glacia-tion around 9 ka (GhGS) due to absence of termi-nal moraines associated with this advance. How-ever, based on moraine elevation data, it can besuggested that the thickness of GhGS was about200 m and snout was located ∼3000 m asl, about5 km down from the present day snout. Dur-ing this stage, the glacier had covered ∼30 km2
(∼44%) of the total catchment area. The ELA ofthe glacier was declined ∼303 m from the presentday ELA and the mean ELA was at ∼4817 ± 224 masl, achieved by reduction in summer temperature∼1.8◦C.
The glacier during 7 ka BP (GGS) and KGS 5 kais identified by well-preserved terminal moraine at3300 and 3500 m asl, respectively. We suggest that
Table
5.
Past
sum
mer
tem
pera
ture
and
rela
tive
are
alo
sses
tim
ation
ofC
hora
bari
Gla
cier
(mea
nsu
mm
erte
mpe
ratu
reofC
hora
bari
Gla
cier
at3800
is8◦ C
).
Sum
mer
air
Gla
cier
are
a
ELA
ELA
dec
line
tem
per
atu
rela
ps
Tem
per
atu
rein
Ked
arn
ath
Are
ain
crea
seTem
per
atu
reat
Gla
cier
stage
(masl
)(m
)ra
te(◦
Ckm
−1)
dec
line
(◦C
)(k
m2)
(km
2)
3800
masl
Pre
sent
Gla
cier
(at
0.5
6◦ C
)5120
6∼
15
8
KG
S5022
98
6∼
0.6
∼22
∼7
7.3
GG
S4951
169
6∼
1∼
23
∼8
7
GhG
S4817
303
6∼
1.8
∼30
∼15
6.2
RG
S4747
373
6∼
2∼
31
∼16
6
Post-LGM glacial advancements in the Himalaya 161
the glacier re-advanced after the post-glacial cool-ing event corresponding to the Younger Drayas asdocumented by earlier workers in western and cen-tral Himalaya (Sharma and Owen 1996; Nainwalet al 2007; Scherler et al 2010). During these stages,glacier covered 23 and 22 km2 and the ELAs wereat around 4951 ± 197 and 5022 ± 190 m asl, respec-tively that correspond to a lowering of ∼1◦C and0.6◦C temperatures respectively (table 5).
These data analysed using GIS, indicate thatin the Mandakini river valley, an area of approx-imately 16 km2 (52%) was vacated by the glacierbetween 13 ± 2 ka and present day (figure 10).During these periods, the ELA shifted ∼373 m andtemperature rise was about 2◦C. Thus, the shiftingof ELA as reconstructed for various places alongthe Himalaya seems to be a consequence of climatesensitivity of the respective glacier. The deglacia-tion started in Mandakini river valley after 5 ± 1 kaBP and there is no evidence for re-advancementafter KGS (5 ± 1 ka). The famous Kedarnath tem-ple (Lord Shiva) was constructed before ∼3000years (Chaujar 2009). The temple, constructed onthe outwash plain, is a strong structure made upof blocks of granite and high-grade metamorphicgneiss rock slab pillars and bricks. Thus, it impliesthat the little ice age glacial advance did not affectthe Chorabari Glacial region.
6. Conclusion
Geomorphology, field stratigraphy and OSL datingof moraines in the Mandakini river valley allow usto draw the following inferences.
• Chorabari glacial valley preserves four stages ofpast glacial advances that are post-LGM.
• Chronology of these glacial expansion show closecorrespondence with existing events reportedfrom the western and central Himalaya, suggestsa common forcing factor that we attribute to theinsolation-driven monsoon variability.
• Maximum ELA depression was observed during13 ka (RGS), which caused an increase of 52%glaciated area compared to the present. This isattributed to cooler summer temperatures andincrease in monsoon precipitation.
• Since the monsoon dominated glaciers aretemperature-sensitive, we attribute continuousdecrease in ice volume since 13 ka to the increasein temperature.
Acknowledgements
The authors gratefully acknowledge Prof. Anil KGupta, Director, Wadia Institute of Himalayan
Geology (WIHG), Dehra Dun, for providing facili-ties to carry out this work. They also thank Dr A KDubey, Scientist WIHG, Dehradun, Shri DeepakSrivastava (Rtd. D.G. GSI) Consultant, Centre forGlaciology, WIHG, Dehradun and Dr Navin Juyal,PRL Ahmedabad India for their valuable sugges-tions. They also thank Sri V P Gupta who helpedwith sample preparation for OSL dating.
References
Barnard P L, Owen L A and Finkel R C 2004a Style andtiming of glacial and paraglacial sedimentation in a mon-soonal influenced high Himalayan environment, the upperBhagirathi Valley, Garhwal Himalaya; Sedim. Geol. 165199–221.
Benn D I and Lehmkuhl F 2000 Mass balance andequilibrium-line altitudes of glaciers in high mountainenvironments; Quat. Int. 65/66 15–29.
Benn D I and Owen L A 1998 The role of the Indian summermonsoon and the mid-latitude westerlies in Himalayanglaciation: Review and speculative discussion; J. Geol.Soc. London 155 353–363.
Benn D I, Owen L A, Osmaston H A, Seltzer G O, PorterC S and Mark B 2005 Reconstruction of equilibrium-linealtitudes for tropical and sub-tropical glaciers; Quat. Int.138–139 8–21.
Beschel R E 1973 Lichens as a measure of age of recentmoraine; Arctic Alpine Res. 5(4) 303–309.
Bradley R S 1985 Quaternary Paleoclimatology: Methodsof Paleoclimatic reconstruction (London: Chapman andHall), 472p.
Bryan G M and Geoffrey O S 2005 Evolution of recent glacierrecession in the Cordillera Blanca, Peru (AD1962–1999),spatial distribution of mass loss and climatic forcing;Quat. Sci. Rev. 24 2265–2280.
Burbank D W and Fort M B 1985 Bedrock control onglacial limits: Examples from the Ladakh and ZanskarRanges, north-western Himalaya, India; J. Glaciol. 31143–149.
Chaujar R K 2006 Lichenometry of yellow Rhizocarpon geo-graphicum as database for the recent geological activitiesin Himachal Pradesh; Curr. Sci. 90 1552–1555.
Chaujar R K 2009 Climate change and its impact on theHimalayan glaciers – a case study on the Chorabariglacier, Garhwal Himalaya, India; Curr. Sci. 96 703–708.
Clark D H, Clark M M and Gillespie A R 1994 Debris-covered glaciers in the Sierra Nevada, California, and theirimplications for snowline reconstructions; Quat. Res. 41139–153.
Dobhal D P, Gergan J T and Thayyen R J 2008Mass balance studies of Dokriani glacier from 1992 to2000, Garhwal Himalaya, India; Bulletin of GlaciologicalResearch, Japanese Soc. Snow Ice 25 9–17.
Duller G A T 2008 Single-grain optical dating of Quater-nary sediments: Why aliquot size matters in luminescencedating; Boreas 37 589–612.
Gupta A K, Anderson D M and Overpeck J T 2003 Abruptchanges in the Asian southwest monsoon during theHolocene and their links to the North Atlantic Ocean;Nature 421 354–357.
Holmes J A and Street-Perrott F A 1989 The Quaternaryglacial history of Kashmir, North-West Himalaya: A revi-sion of the Terra and Paterson’s Sequence; ZeitschriftfurGeomorphologie 76 195–212.
162 Manish Mehta et al
Kaser G and Osmaston H 2002 Tropical glaciers(Cambridge: Cambridge University Press), 207p.
Matthews J A and Shakesby R A 1884 The status of the‘Little Ice Age’ in southern Norway: Relative age dat-ing of Neoglaciation moraines with Schmidt hammer andlichenometry; Boreas 13 333–346.
Mehta M, Dobhal D P and Bhist M P S 2011 Change ofTipra Glacier in the Garhwal Himalaya, India, between1962 and 2008; Prog. Phys. Geogr. 35(6) 721–738.
Meier M F and Post A S 1962 Recent variations inmass net budgets of glacier in western North America;Symposium of Obergurgl, IASH–AISH Publication 5863–77.
Murray A S and Wintle A G 2000 Luminescence dating ofquartz using an improved single aliquot regenerative-doseprotocol; Radiat. Measure. 32 57–73.
Nainwal H C, Chaudhary M, Rana N, Negi B D S, Negi R S,Juyal N and Singhvi A K 2007 Chronology of the LateQuaternary glaciation around Badrinath (upper Alak-nanda Basin): Preliminary observations; Curr. Sci. 9390–96.
Osipov E Y and Khlystov O M 2010 Glaciers and meltwaterflux to Lake Baikal during the Last Glacial Maximum;Palaeogeogr. Palaeoclimatol. Palaeoecol. 294 4–15.
Osmaston H A, Frazer J and Crook S 1994 Human adap-tation to environment in Zanskar; In: Himalayan Bud-dhist Villages (eds) Crook J H and Osmaston H A (Delhi:Jainendra Prakash Jain at Shri Jainendra Press), pp.37–110.
Overpeck J 1996 The southwest Indian monsoon over thelast 18,000 years; Climate Dyn. 12 213–225.
Owen L A, Benn D I, Derbyshire E, Evans D J A, MitchellW A and Richardson S 1996 Quaternary glacial historyof the Lahul Himalaya, Northern India; J. Quat. Sci. 1125–42.
Owen L A, Kamp U, Spencer J Q and Haserodt K 2002 Tim-ing and style of Late Quaternary glaciation in the east-ern Hindu Kush, Chitral, northern Pakistan: A reviewand revision of the glacial chronology based on new opti-cally stimulated luminescence dating; Quat. Int. 97/9841–55.
Owen L A, Finkel R C, Caffee M W and Gualtieri L 2003aTiming of multiple glaciations during the Late Quater-nary in the Hunza Valley, Karakoram Mountains, North-ern Pakistan: Defined by cosmogenic radionuclide datingof moraines; Geol. Soc. Am. Bull. 114 593–604.
Owen L A, Gualtieri L, Finkel R C, Caffee M W, Benn D Iand Sharma M C 2003b Reply – Cosmogenic radionu-clide dating of glacial landforms in the Lahul Himalaya,northern India: Defining the timing of Late Quaternaryglaciation; J. Quat. Sci. 17 279–281.
Owen L A, Finkel R C and Caffee M W 2003c A note onthe extent of glaciation throughout the Himalaya duringthe global Last Glacial Maximum; Quat. Sci. Rev. 21147–157.
Owen L A, Robinson R, Benn D I, Finkel R C, Davis NK, Yi C, Putkonen J, Li D and Murray A S 2009 Qua-ternary glaciation of Mount Everest; Quat. Sci. Rev. 281412–1433.
Pant R K, Juyal N, Basavaiah N and Singhvi A K 2006 LateQuaternary glaciation and seismicity in the higher cen-tral Himalaya: Evidence from Shalong basin (Goriganga)Uttaranchal; Curr. Sci. 90 1500–1505.
Paterson W S B 1969 The physics of Glaciers (OxfordLondon: Pergamon Press), 249p.
Phadtare N R 2000 Sharp decrease in summer monsoonstrength 4000–3500 cal yr BP in Central Higher Himalayaof India based on pollen evidence from alpine peat; Quat.Res. 53 122–129.
Phillips B M, Sloan V F, Shroder J F, Sharma P, ClarkeM L and Rendell H M 2000 Asynchronous glaciationat Nanga Parbat, northwestern Himalaya Mountains,Pakistan; Geology 28 431–434.
Porter S C 1977 Present and past glaciation threshold in theCascade Range, Washington, USA: Topographic and cli-matic controls, and paleoclimatic implications; J. Glaciol.18 101–116.
Porter S C 2001 Snowline depression in the tropics duringthe last glaciation; Quat. Sci. Rev. 20 1067–1091.
Ray Y and Srivastava P 2010 Widespread aggrada-tion in the mountainous catchment of the Alaknanda–Ganga River System: Timescales and implications toHinterland–foreland relationships; Quat. Sci. Rev. 292238–2260.
Richards B W M, Owen L A and Rhodes E J 2000a Timing ofLate Quaternary glaciations in the Himalayas of northernPakistan; J. Quat. Sci. 15 283–297.
Richards B W M, Benn D, Owen L A, Rhodes E J andSpencer J Q 2000b Timing of Late Quaternary glaciationssouth of Mount Everest in the Khumbu Himal, Nepal;Geol. Soc. Am. Bull. 112 1621–1632.
Richards B W M, Owen L A and Rhodes E J 2001 Asynchro-nous glaciation at Naga Parbat, northwesternHimalaya Mountains, Pakistan: Comment; Geology 29287.
Scherler D, Bookhagen B, Strecker M R, Blanckenburg F Vand Rood D 2010 Timing and extent of late Quaternaryglaciation in the western Himalaya constrained by 10Bemoraine dating in Garhwal, India; Quat. Sci. Rev. 29815–831.
Scott C H 1992 Contemporary sediment transfer inHimalayan glacial systems; Unpublished Ph.D. Thesis,University of Leicester, 352p.
Seltzer G O 1994 Climatic interpretation of alpine snowlinevariations on millennial time scales; Quat. Res. 41 154–159.
Sharma M C and Owen L A 1996 Quaternary glacial historyof the NW Garhwal, central Himalayas, India; Quat. Sci.Rev. 15 335–365.
Sharma S, Joachimski M M, Tobschall H J, Singh I B,Sharma C and Chauhan S C 2006 Correlative evidences ofmonsoon variability, vegetation change and human inhab-itation in Sanai lake deposit: Ganga plain, India; Curr.Sci. 90 973–978.
Shroder J F, Khan M S, Lawrence R D, Madin I P andHiggins S M 1989 Quaternary glacial chronology and neo-tectonics in the Himalaya of northern Pakistan; Geol. Soc.Am. Spec. Paper 232 275–294.
Shroder J F, Owen L A and Derbyshire E 1993 Quaternaryglaciation of the Karakoram and Nanga Parbat Himalaya;In: Himalaya to the Sea (ed.) Shroder J F; Routledge,London, pp. 132–158.
Sissons J B 1974 A Late-glacial ice cap in the centralGrampians, Scotland; Trans. Inst. British Geographers62 95–113.
Srivastava P, Bhakuni S S, Luirei K and Misra D K2009 Morpho-sedimentary records from the Brahmapu-tra River exit, NE Himalaya: Climate-tectonic inter-play during Late Pleistocene–Holocene; J. Quat. Sci. 24175–188.
Srivastava P, Tripathi J K, Islam R and Jaiswal M K 2008Fashion and phases of Late Pleistocene aggradation andincision in Alaknanda River, western Himalaya, India;Quat. Res. 70 68–80.
Stephen C P 2001 Snowline depression in the tropics duringlast glaciation; Quat. Sci. Rev. 20 1067–1091.
Thayyen R J, Gergan J T and Dobhal D P 2005Lapse rate of slope air temperature in a Himalayan
Post-LGM glacial advancements in the Himalaya 163
catchment – A study from Din Gad (Dokriani Glacier)basin, Garhwal Himalaya, India; Bull. Glaciol. Res. 2219–25.
Tsukamoto S, Asahi K, Watanabe T, Kondo R and Rink W J2002 Timing of past glaciation in Kanchenjunga Himal,Nepal by optically stimulated luminescence dating of tills;Quat. Int. 97/98 57–68.
Valdiya K S, Paul S K, Chandra Tara, Bhakuni S Sand Upadhyay R C 1999 Tectonic and lithological
characterization of Himadri (Great Himalaya) betweenKali and Yamuna rivers, Central Himalaya; HimalayanGeol. 20 1–17.
Wagnon P, Linda A, Arnaud Y, Kumar R, Sharma P,Vincent C, Pottakkal J G, Berthier E, Ramanathan A,Hasnain S I and Chevallier P 2007 Four years of massbalance on Chhota Shigri Glacier, Himachal Pradesh,India, a new benchmark glacier in the western Himalaya;J. Glaciol. 53 603–611.
MS received 30 March 2011; revised 12 August 2011; accepted 13 August 2011


![INDEX [c498469.r69.cf2.rackcdn.com]c498469.r69.cf2.rackcdn.com/1985/385_index_aaj1985.pdf · INDEX Baudha (Nepal Himalaya), 125 ... Bhrigu Parbat (Garhwal Himalaya), ... Bindu GUI](https://img.pdfslide.net/doc/110x75/5b076c5d7f8b9a93418e2b96/index-c498469r69cf2-c498469r69cf2-baudha-nepal-himalaya-125-bhrigu.jpg)