Embed Size (px)
Citation preview
Kansas Interdisciplinary Carbonates Consortium Prospectus – July 2017 147
Geophysical Signatures of Porosity, Fractures, and Facies in Conventional and Unconventional Rocks and Reservoirs
Outcrop and Holocene studies are invaluable for “ground truthed” data, but commonly are limited in the third dimension. Geophysics provides a means to indirectly explore variations in depositional and diagenetic character of carbonate systems in three dimensions. Employed in time-lapse mode, geophysical monitoring offers insights to the heterogeneous fluid-flow in carbonate systems. 3D reservoir models are placed into an exploration mode through synthetic seismic modeling and reservoir flow simulation. Examples of some current and pending projects include:
Kansas Interdisciplinary Carbonates Consortium Prospectus – July 2017
148
Contrasts in Seismic Sequence Architecture and Seismic Geomorphology of Heterozoan and Photozoan Carbonate Systems
Gene Rankey
SUBSURFACE APPLICATION: Understanding the 3D architecture of isolated carbonate platforms and shelves, most directly related to Cenozoic systems, including southeast Asia and parts of the Middle East. STATUS: Long-term project in progress TIMING: Results currently available to membership; Phase 2 starting FUNDING: Seeking additional funding and data Objective and Relevance to Sponsors Carbonate sediment can be grouped into one of three factories: tropical (dominated by photozoans), cool water (mostly heterozoans), and mud mounds. In addition to differences in dominant organisms, these factories commonly also include distinct stratigraphic patterns, related to the prevalence of reef-building organisms and the impact of early diagenesis. These differences have been recognized in general terms in outcrop studies, but seismic data provide an additional means to examine and quantify the 3D differences in sequence geometries and facies architecture. In this context, the objectives of this study are to characterize the seismic sequence architecture, seismic facies, and seismic geomorphology of heterozoan unrimmed carbonate shelves and photozoan isolated platforms and use these insights to develop a conceptual model for quantitative contrasts in 3D depositional heterogeneity and stratal architecture between heterozoan and photozoan systems.
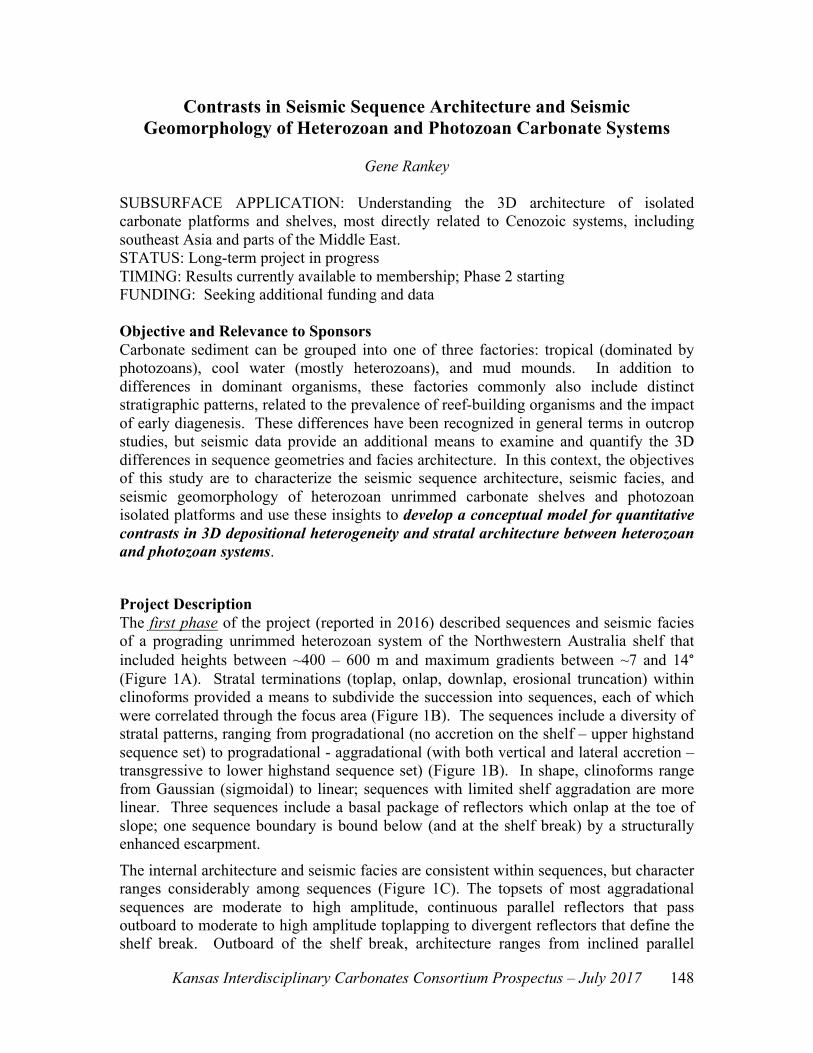
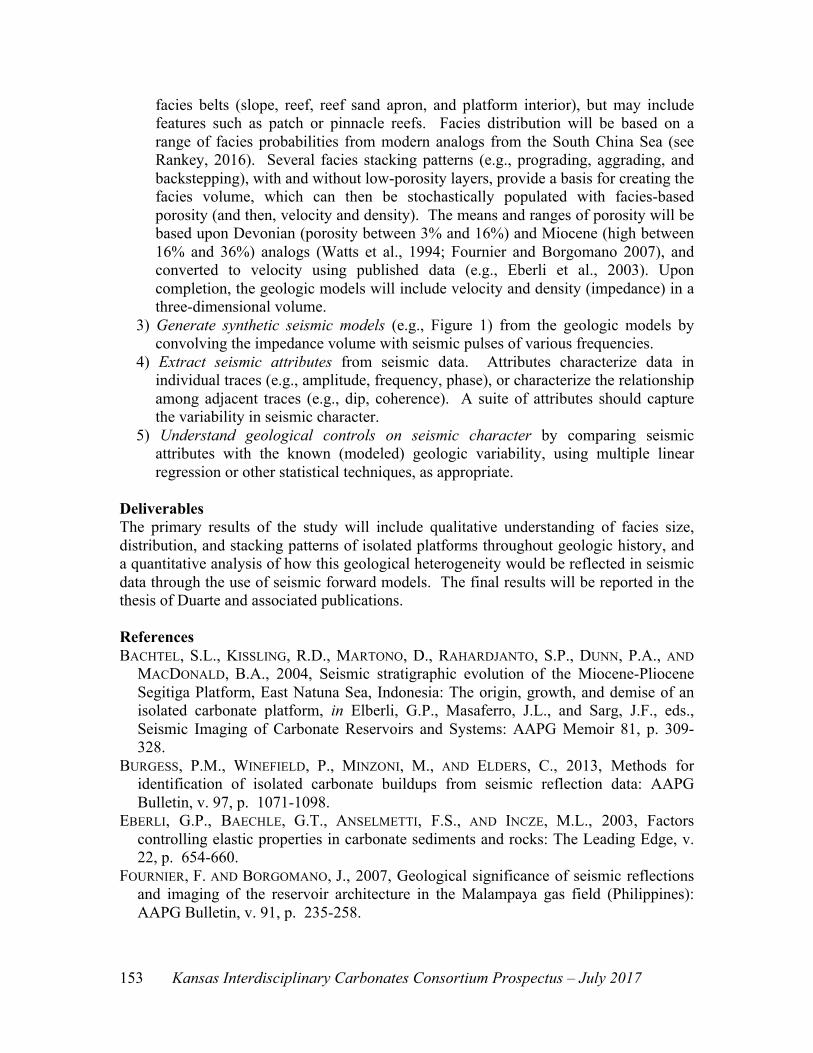
Project Description The first phase of the project (reported in 2016) described sequences and seismic facies of a prograding unrimmed heterozoan system of the Northwestern Australia shelf that included heights between ~400 – 600 m and maximum gradients between ~7 and 14° (Figure 1A). Stratal terminations (toplap, onlap, downlap, erosional truncation) within clinoforms provided a means to subdivide the succession into sequences, each of which were correlated through the focus area (Figure 1B). The sequences include a diversity of stratal patterns, ranging from progradational (no accretion on the shelf – upper highstand sequence set) to progradational - aggradational (with both vertical and lateral accretion – transgressive to lower highstand sequence set) (Figure 1B). In shape, clinoforms range from Gaussian (sigmoidal) to linear; sequences with limited shelf aggradation are more linear. Three sequences include a basal package of reflectors which onlap at the toe of slope; one sequence boundary is bound below (and at the shelf break) by a structurally enhanced escarpment.
The internal architecture and seismic facies are consistent within sequences, but character ranges considerably among sequences (Figure 1C). The topsets of most aggradational sequences are moderate to high amplitude, continuous parallel reflectors that pass outboard to moderate to high amplitude toplapping to divergent reflectors that define the shelf break. Outboard of the shelf break, architecture ranges from inclined parallel
Kansas Interdisciplinary Carbonates Consortium Prospectus – July 2017 149
reflectors (some with isolated truncations, common in progradational sequences) to more complex geometries (Figure 2). A prominent seismic facies of the slope is low to moderate amplitude, parallel to wavy, discontinuous to semi-continuous reflectors, some of which define channel forms of various widths (ranging up to 2.4 km across) and depths (up to 150 m). Some channels have truncated flanks, and internally have updip-onlapping reflectors. Clinoform bottomsets are parallel continuous reflectors. Collectively, the data reveal empirical quantitative relations among sequence stratigraphic setting, slope gradient, clinoform height, and facies architecture for this heterozoan shelf system, and perhaps illustrate themes. Phase 2 of the project will examine isolated platform system(s), comparing and contrasting the geometric and facies patterns with the photozoan system. In 2018, we expect to report on case studies from southeast Asia, pending release of information. Expected Results and Deliverables This study will characterize and quantify depositional architecture in several seismic data sets. Results will include maps and images and databases on quantitative seismic geomorphometric attributes, presented at the annual meeting and in reports for sponsors. The qualitative and quantitative pattern analysis represent a means to explore “first order” stratigraphic principles governing the accumulation of contrasting styles of depositional sequences and their internal heterogeneity.
Kansas Interdisciplinary Carbonates Consortium Prospectus – July 2017
150
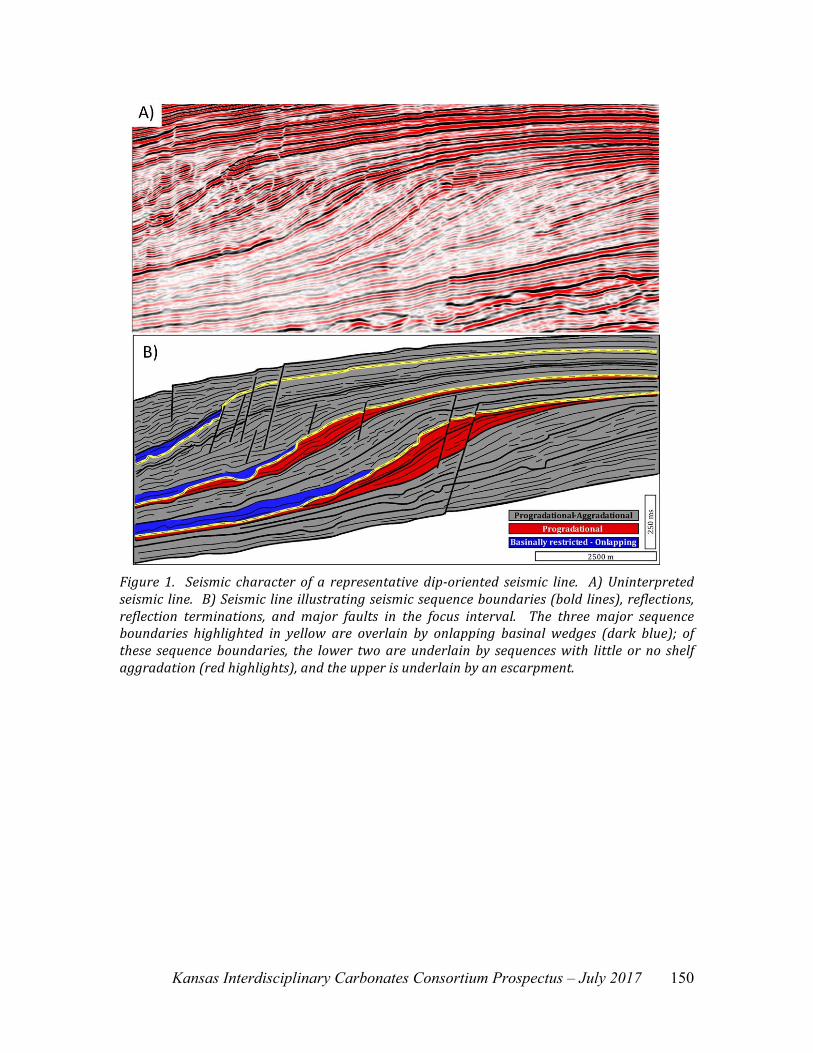
Figure 1. Seismic character of a representative dip-oriented seismic line. A)Uninterpretedseismicline. B)Seismiclineillustratingseismicsequenceboundaries(boldlines),reflections,reflection terminations, and major faults in the focus interval. The three major sequenceboundaries highlighted in yellow are overlain by onlapping basinal wedges (dark blue); ofthese sequence boundaries, the lower two are underlain by sequenceswith little or no shelfaggradation(redhighlights),andtheupperisunderlainbyanescarpment.
Kansas Interdisciplinary Carbonates Consortium Prospectus – July 2017 151
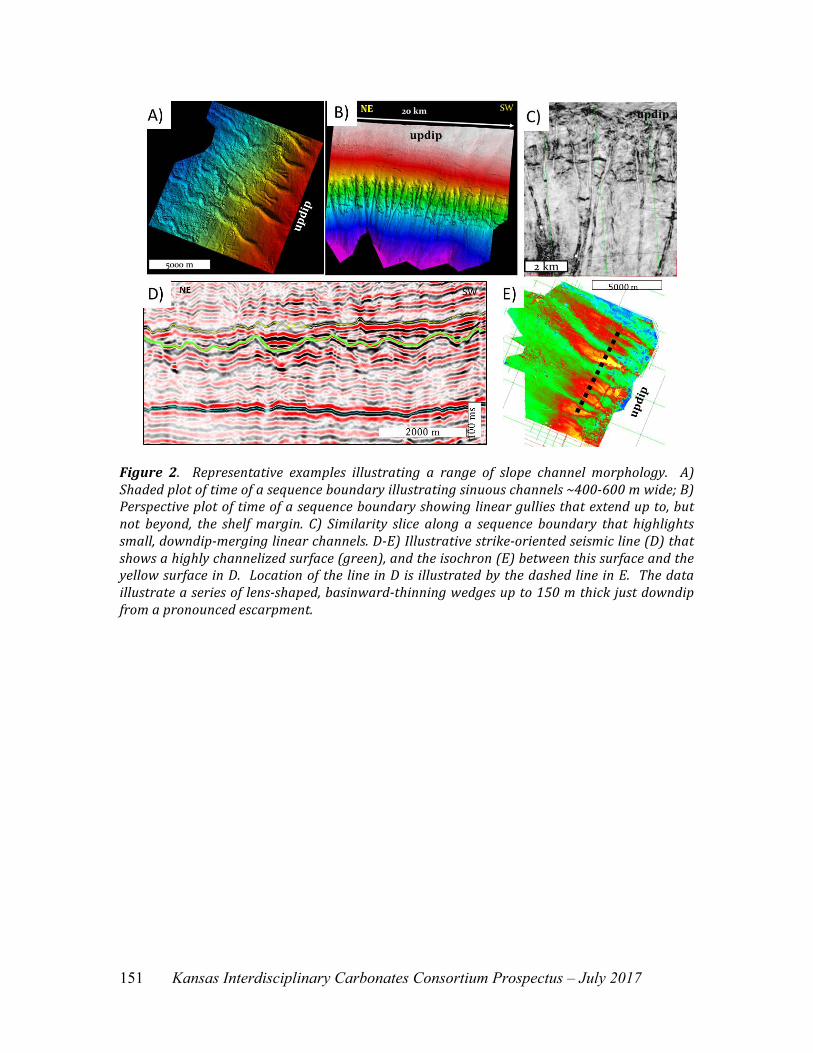
Figure 2. Representative examples illustrating a range of slope channel morphology. A)Shadedplotoftimeofasequenceboundaryillustratingsinuouschannels~400-600mwide;B)Perspectiveplotoftimeofasequenceboundaryshowinglineargulliesthatextendupto,butnot beyond, the shelfmargin. C) Similarity slice along a sequence boundary that highlightssmall,downdip-merginglinearchannels.D-E)Illustrativestrike-orientedseismicline(D)thatshowsahighlychannelizedsurface(green),andtheisochron(E)betweenthissurfaceandtheyellowsurfaceinD. LocationofthelineinDis illustratedbythedashedlineinE. Thedataillustrateaseriesoflens-shaped,basinward-thinningwedgesupto150mthickjustdowndipfromapronouncedescarpment.
Kansas Interdisciplinary Carbonates Consortium Prospectus – July 2017
152
Geological Heterogeneity and Seismic Expression of Isolated Platforms
Adrienne Duarte and Gene Rankey SUBSURFACE APPLICATION: This project explores how geologic heterogeneity impacts the seismic character of isolated platforms. Insights will be applicable to both exploration and development settings for more refined and accurate interpretation of seismic data of isolated platform reservoirs STATUS: Focused-term project nearing completion TIMING: Significant, final results to be reported before 2018 sponsors meeting FUNDING: Funded, seeking additional data for seismic models Purpose Isolated carbonate platforms, the iconic carbonate geomorphic setting, include many important hydrocarbon reservoirs (e.g., Devonian, Western Canadian Basin and Cenozoic, Southeast Asia) (Bachtel et al., 2004; Burgess et al., 2013). Variability in facies (size, distribution, and stacking patterns) and diagenesis (and therefore porosity) across isolated platforms pose a challenge for predicting geologic heterogeneity from seismic data (Masaferro et al., 2004; Burgess et al., 2013). To test the hypothesis that geologic heterogeneity creates a statistically discernable impact on seismic character of isolated carbonate platforms, this project will develop quantitative understanding of this relationship by generating synthetic seismic models of isolated carbonate platforms where geologic heterogeneity can be systematically isolated and varied – and its impact evaluated. Unlike other studies that model one specific outcrop or reservoir, however, this project will systematically and numerically model a range of geologic variables that impact platforms throughout the geologic record. Project Description The project will explore how comparable variability in subsurface analogs might be recognized from seismic data. The data of variability in Holocene facies morphometrics (spatial patterns; see Rankey, 2016; Rankey and Wilson proposal) coupled with stratigraphic (vertical patterns) and petrophysical (rock property) information from subsurface systems provide fundamental input for construction of a suite of seismic forward models. These models will be queried qualitatively (seismic geometries) and quantitatively (seismic attributes) and compared with the controlled inputs to explore fundamental geologic controls on seismic expression of isolated carbonate platforms. To explore the role of geologic variability on seismic character of isolated carbonate platforms, this project focuses on several objectives:
1) Understand “end-member” geologic analogs by describing geologic variability in core from Devonian Nisku pinnacles (low porosity, greenhouse) and a Miocene South China Sea platform (high porosity, icehouse). This step will use published and new data to provide geologic perspectives on important parameters such as vertical stratigraphic heterogeneities within isolated carbonate platforms.
2) Construct a suite of idealized geologic models in Petrel to analytically capture an array of geologic variability. These simplified platforms are constrained to four
Kansas Interdisciplinary Carbonates Consortium Prospectus – July 2017 153
facies belts (slope, reef, reef sand apron, and platform interior), but may include features such as patch or pinnacle reefs. Facies distribution will be based on a range of facies probabilities from modern analogs from the South China Sea (see Rankey, 2016). Several facies stacking patterns (e.g., prograding, aggrading, and backstepping), with and without low-porosity layers, provide a basis for creating the facies volume, which can then be stochastically populated with facies-based porosity (and then, velocity and density). The means and ranges of porosity will be based upon Devonian (porosity between 3% and 16%) and Miocene (high between 16% and 36%) analogs (Watts et al., 1994; Fournier and Borgomano 2007), and converted to velocity using published data (e.g., Eberli et al., 2003). Upon completion, the geologic models will include velocity and density (impedance) in a three-dimensional volume.
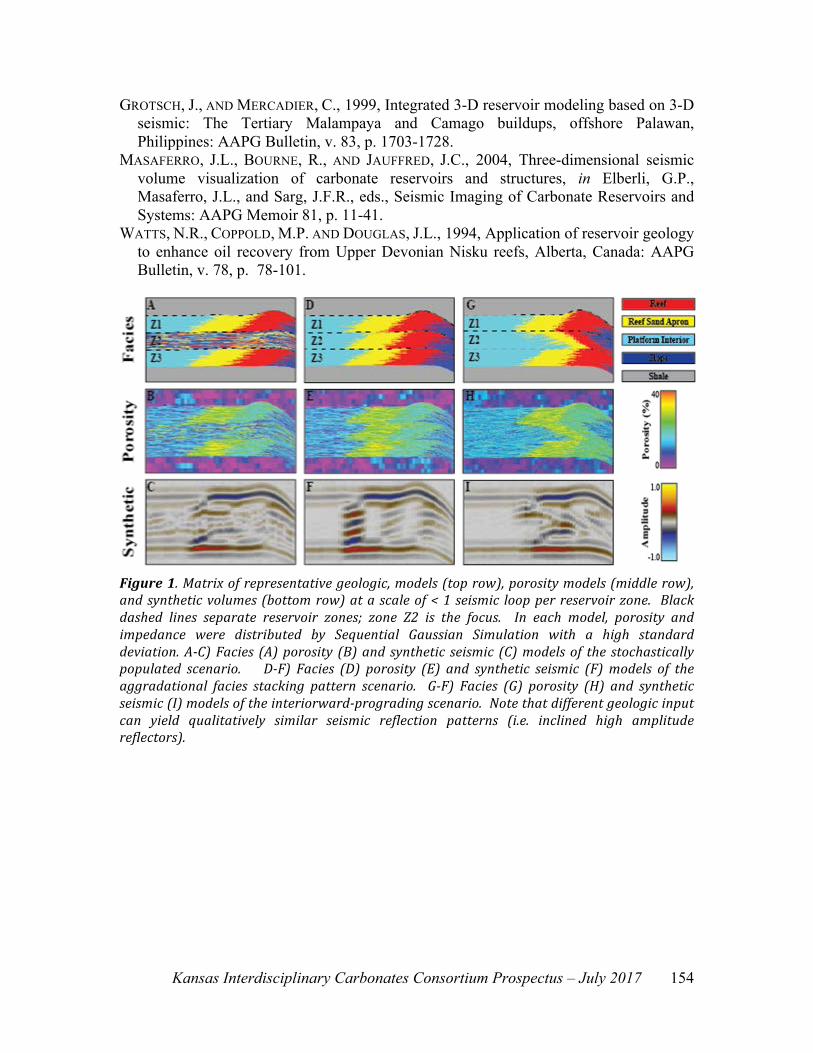
3) Generate synthetic seismic models (e.g., Figure 1) from the geologic models by convolving the impedance volume with seismic pulses of various frequencies.
4) Extract seismic attributes from seismic data. Attributes characterize data in individual traces (e.g., amplitude, frequency, phase), or characterize the relationship among adjacent traces (e.g., dip, coherence). A suite of attributes should capture the variability in seismic character.
5) Understand geological controls on seismic character by comparing seismic attributes with the known (modeled) geologic variability, using multiple linear regression or other statistical techniques, as appropriate.
Deliverables The primary results of the study will include qualitative understanding of facies size, distribution, and stacking patterns of isolated platforms throughout geologic history, and a quantitative analysis of how this geological heterogeneity would be reflected in seismic data through the use of seismic forward models. The final results will be reported in the thesis of Duarte and associated publications. References BACHTEL, S.L., KISSLING, R.D., MARTONO, D., RAHARDJANTO, S.P., DUNN, P.A., AND
MACDONALD, B.A., 2004, Seismic stratigraphic evolution of the Miocene-Pliocene Segitiga Platform, East Natuna Sea, Indonesia: The origin, growth, and demise of an isolated carbonate platform, in Elberli, G.P., Masaferro, J.L., and Sarg, J.F., eds., Seismic Imaging of Carbonate Reservoirs and Systems: AAPG Memoir 81, p. 309-328.
BURGESS, P.M., WINEFIELD, P., MINZONI, M., AND ELDERS, C., 2013, Methods for identification of isolated carbonate buildups from seismic reflection data: AAPG Bulletin, v. 97, p. 1071-1098.
EBERLI, G.P., BAECHLE, G.T., ANSELMETTI, F.S., AND INCZE, M.L., 2003, Factors controlling elastic properties in carbonate sediments and rocks: The Leading Edge, v. 22, p. 654-660.
FOURNIER, F. AND BORGOMANO, J., 2007, Geological significance of seismic reflections and imaging of the reservoir architecture in the Malampaya gas field (Philippines): AAPG Bulletin, v. 91, p. 235-258.
Kansas Interdisciplinary Carbonates Consortium Prospectus – July 2017
154
GROTSCH, J., AND MERCADIER, C., 1999, Integrated 3-D reservoir modeling based on 3-D seismic: The Tertiary Malampaya and Camago buildups, offshore Palawan, Philippines: AAPG Bulletin, v. 83, p. 1703-1728.
MASAFERRO, J.L., BOURNE, R., AND JAUFFRED, J.C., 2004, Three-dimensional seismic volume visualization of carbonate reservoirs and structures, in Elberli, G.P., Masaferro, J.L., and Sarg, J.F.R., eds., Seismic Imaging of Carbonate Reservoirs and Systems: AAPG Memoir 81, p. 11-41.
WATTS, N.R., COPPOLD, M.P. AND DOUGLAS, J.L., 1994, Application of reservoir geology to enhance oil recovery from Upper Devonian Nisku reefs, Alberta, Canada: AAPG Bulletin, v. 78, p. 78-101.
Figure1.Matrixofrepresentativegeologic,models(toprow),porositymodels(middlerow),andsyntheticvolumes(bottomrow)atascaleof<1seismic loopperreservoirzone. Blackdashed lines separate reservoir zones; zone Z2 is the focus. In each model, porosity andimpedance were distributed by Sequential Gaussian Simulation with a high standarddeviation.A-C)Facies (A)porosity (B)and synthetic seismic (C)modelsof the stochasticallypopulated scenario. D-F) Facies (D) porosity (E) and synthetic seismic (F) models of theaggradational facies stacking pattern scenario. G-F) Facies (G) porosity (H) and syntheticseismic(I)modelsoftheinteriorward-progradingscenario.Notethatdifferentgeologicinputcan yield qualitatively similar seismic reflection patterns (i.e. inclined high amplitudereflectors).
Kansas Interdisciplinary Carbonates Consortium Prospectus – July 2017 155
Post-Stack Seismic Attribute Analysis and Impedance Inversion for Characterization of the Mississippian Reservoir, South-Central Kansas
George Tsoflias, Lynn Watney, Ayrat Sirazhiev
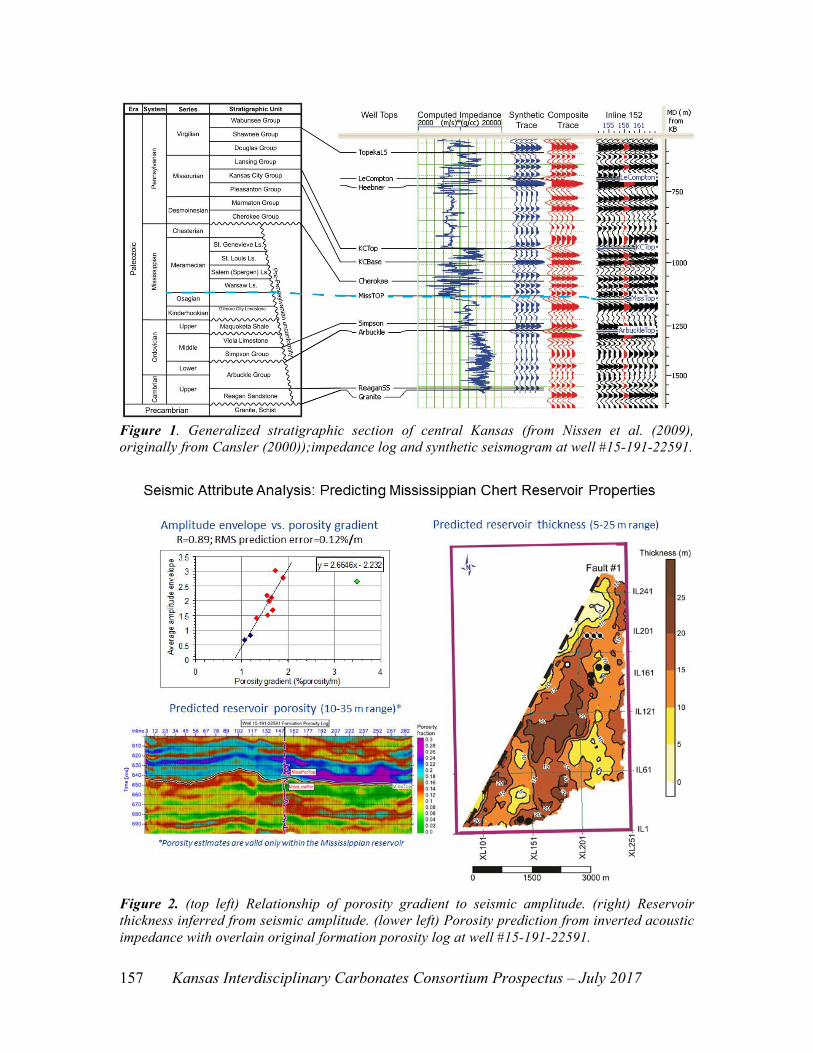
SUBSURFACE APPLICATION: Seismic characterization of Mississippian carbonate reservoirs. Assessment of post-stack seismic analysis methods for prediction of carbonate reservoir heterogeneous properties. STATUS: Project completed and not yet published TIMING: Significant results to be reported – Results currently available to membership FUNDING: Partial from United States Department of Energy Purpose Mississippian chert reservoirs are important hydrocarbon resources in North America. These reservoirs are highly heterogeneous, typically below seismic resolution and, therefore, challenging to characterize using seismic data (e.g. Mazzullo et al., 2009; Montgomery et al., 1998; Rogers and Longman, 2001; Watney et al., 2001). In this study we conducted a seismic attribute analysis of the Mississippian chert reservoir at the Wellington Field, south-central Kansas using well-log and 3D (PSTM) seismic data. The microporous cherty dolomite reservoir exhibits a characteristic vertical gradational porosity reduction and associated increase in acoustic velocity, known as a ramp-transition velocity function. The primary objective of this study was to investigate possible relationships of the reservoir thickness and porosity with post-stack seismic attributes, including inverted acoustic impedance. Project Description We examined the seismic response of a ramp-transition velocity function in order to predict the thickness of the Mississippian chert reservoir. The Mississippian top is characterized by a vertical gradational porosity decrease and a corresponding ramp velocity increase that results in a gradational impedance increase (Figure 1). We employed seismic wedge modeling using both synthetic and original sonic logs to aid the interpretation and investigate the resolution limits of the seismic data. A characteristic amplitude decrease, wavelength increase (frequency decrease) and 90-degree phase change are observed at the top of the Mississippian as reservoir thickness increases. Seismic amplitude is shown to predict reliably reservoir thickness in the range of 5-25 m when a well-defined porosity reduction is present (Figure 2).
Post-stack model-based inversion of the seismic data was used to derive the acoustic impedance model of the subsurface. The resolution of the model-based inversion was evaluated for the case of the gradational impedance increase within the Mississippian reservoir interval using synthetic wedge models. Multilinear regression analysis is used to transform the inverted acoustic impedance to porosity distribution within the Mississippian reservoir (Figure 2). The reliability of the predicted porosity model is tested by cross-validation during the multilinear regression analysis. Results of this research could benefit the characterization of similar chert as well as clastic and carbonate reservoirs characterized by downward porosity reduction. In
Kansas Interdisciplinary Carbonates Consortium Prospectus – July 2017
156
addition to predicting the reservoir porosity and thickness, the seismic response of a ramp-transitional velocity function related to downward porosity reduction might be useful in understanding depositional and diagenetic histories of such reservoirs. Key Findings • A gradational porosity decrease at the top of the Mississippian reservoir corresponds
to a gradational P-wave velocity increase • A gradational or “ramp” velocity function results in the integral of the seismic
wavelet with lower amplitude, lower frequency content and waveform phase change • The characteristic seismic amplitude response of the top of the Mississippian is used
to predict reservoir thickness when true thickness is 1/16λ-5/16λ (5–25 m) • Post-stack model-based acoustic impedance inversion provides reliable porosity
predictions for reservoir thickness range of 1/8λ-7/16λ (10-35 m) Deliverables i) Seismic attribute analysis methods of gradational (ramp) velocity profiles such as
the Mississippian Chert at Wellington Field. ii) Calibration of seismic amplitude and acoustic impedance inversion to reservoir
thickness and porosity distribution respectively. iii) Mississippian reservoir thickness map over the extent of the 3D seismic data. iv) Acoustic impedance volume and derived Mississippian reservoir porosity
distribution at Wellington field. v) MS Thesis, Sirazhiev A. (2012), “Seismic Attribute Analysis of the Mississippian
Chert at the Wellington Field, South-Central Kansas”. References MAZZULLO, S. J., WILHITE, B. W., AND WOOLSEY, I. W., 2009, Petroleum reservoirs
within a spiculite-dominated depositional sequence: Cowley Formation (Mississippian: Lower Carboniferous), south-central Kansas: AAPG Bulletin, v. 93, no.12, p.1649-1689.
MONTGOMERY, S. L., 1998, Thirtyone formation, Permian Basin, Texas: structural and lithologic heterogeneity in a lower Devonian chert reservoir: AAPG Bulletin, v. 82, no. 1, p. 1-24.
NISSEN, S. E., CARR, T. R., MARFURT, K. J., AND SULLIVAN, E. C., 2009, Using 3-D seismic volumetric curvature attributes to identify fracture trends in a depleted Mississippian carbonate reservoir: implications for assessing candidates for CO2 sequestration, in M. Grobe, J. C. Pashin, and R. L. Dodge, eds., Carbon dioxide sequestration in geological media—State of the science: AAPG Studies in Geology 59, p. 297–319.
ROGERS, J. P., AND LONGMAN, M. W., 2001, An introduction to chert reservoirs of North America, 2001, AAPG Bulletin, v. 85, no.1, p. 1-5.
WATNEY, W. L., GUY, W. J., AND BYRNES, A. P., 2001, Characterization of the Mississippian chat in south-central Kansas: AAPG Bulletin, v. 85, no.1, p. 85-113.
Kansas Interdisciplinary Carbonates Consortium Prospectus – July 2017 157
Figure 1. Generalized stratigraphic section of central Kansas (from Nissen et al. (2009), originally from Cansler (2000));impedance log and synthetic seismogram at well #15-191-22591.
Figure 2. (top left) Relationship of porosity gradient to seismic amplitude. (right) Reservoir thickness inferred from seismic amplitude. (lower left) Porosity prediction from inverted acoustic impedance with overlain original formation porosity log at well #15-191-22591.
Kansas Interdisciplinary Carbonates Consortium Prospectus – July 2017
158
Porosity Prediction and Flow Unit Identification at the Mississippian and Arbuckle Reservoirs Using Seismic AVO Analysis and Pre-Stack
Seismic Simultaneous Inversion
George Tsoflias, Lynn Watney, Yousuf Fadolalkarem SUBSURFACE APPLICATION: Determination of Mississippian and Arbuckle carbonate reservoir porosity and distribution of flow units. Assessment of pre-stack seismic analysis methods (AVO, simultaneous inversion, multiattribute regression) for prediction of carbonate reservoir heterogeneous properties. STATUS: Project completed and not yet published TIMING: Significant results to be reported – Results currently available to membership FUNDING: Partial from United States Department of Energy Purpose The Mississippian and Arbuckle reservoirs in the US mid-continent have been major hydrocarbon producers and are targets for enhanced oil recovery operations as well as CO2 sequestration projects (Franseen et al., 2004; Mazzullo et al., 2009; Rogers and Longman, 2001; Watney et al., 2001). Furthermore, resurgent industry interest in the Mississippi Lime play is resulting in increased interest in carbonate reservoirs. Seismic imaging is the primary industry method for exploration and development of hydrocarbon resources. However, carbonate reservoirs are heterogeneous and the distribution of properties controlling the flow of fluids is often below seismic resolution. Identifying characteristic relationships between reservoir properties (i.e. thickness, porosity, density, fracture sets, flow baffles/conduits) and seismic response (amplitude, frequency, phase, offset, azimuth) is critical to assessing hydrocarbon resources.
The objectives of this research are to: a) Assess the capability of pre-stack seismic analysis methods (Amplitude Variation with Offset –AVO; simultaneous inversion of AVO data for P- & S-impedance and density) to quantitatively predict Mississippian and Arbuckle Reservoir properties in South-Central Kansas, and b) Develop seismic data interpretation workflows applicable to the region for carbonate reservoir characterization. Project Description This project expanded previous work of predicting Mississippian Chert reservoir thickness and porosity distribution using 3D P-wave post-stack seismic amplitude and acoustic impedance at the Wellington field in South-Central Kansas. This research focused on the Mississippian and Arbuckle reservoirs. It investigated 3D P-wave pre-stack seismic data analysis, Amplitude Variation with Offset (AVO) for elastic impedance inversion (e.g. Aki and Richards, 1980; Li et al., 2003; Ruger, 1997). Figures 1 and 2 show results of AVO analysis and simultaneous inversion at the Mississippian and Arbuckle reservoirs. This research provides a comprehensive assessment of seismic attribute analysis for characterization of two important mid-continent carbonate reservoirs which are of primary interest to KICC membership.
Kansas Interdisciplinary Carbonates Consortium Prospectus – July 2017 159
Key Findings • High porosity zones in the Mississippian and the Arbuckle Group exhibit
characteristic AVO response • AVO classification can be employed to identify the porous zones at Wellington Field
3D volume using the intercept-gradient cross plotting technique • Simultaneous AVO impedance inversion results in improved estimation of
Mississippian reservoir and the Arbuckle Group properties than model-based inversion of post-stack data
• Flow units in the Arbuckle can be mapped using AVO analysis and Simultaneous AVO impedance inversion
Deliverables i) Comprehensive assessment of pre-stack seismic attribute analysis for
Mississippian and Arbuckle reservoir characterization ii) Evaluation of AVO pre-stack seismic gather analysis methods for mid-continent
carbonate reservoir property prediction iii) Acoustic and elastic impedance inversion volumes and predicted reservoir
porosity and density maps iv) Evaluation of seismic methods for identification of flow units in carbonate
reservoirs v) Post- and pre-stack seismic analysis workflows for Mississippian and Arbuckle
reservoirs vi) MS Thesis, Fadolalkarem Y. (2015), Pre-stack Seismic Attribute Analysis of the
Mississippian Chert and the Arbuckle Group at the Wellington Field, South-Central Kansas
References AKI, K., AND RICHARDS, P.G., 1980, Quantitative seismology: Theory and methods: W.H.
Freeman and Co. FRANSEEN, E. K., BYRNES, A. P., CANSLER, J. R., STEINHAUFF, D. M., AND CARR, T. R.,
2004, The Geology of Kansas--Arbuckle Group; in, Current Research in Earth Sciences: Kansas Geological Survey, Bulletin 250, part 2, http://www.kgs.ku.edu/Current/2004/franseen/index.html.
LI, Y., DOWNTON, J., AND GOODWAY, W., Recent applications of AVO to carbonate reservoirs in the Western Canadian Sedimentary Basin: The Leading Edge, 22, no. 7, 670-674.
MAZZULLO, S. J., WILHITE, B. W., AND WOOLSEY, I. W., 2009, Petroleum reservoirs within a spiculite-dominated depositional sequence: Cowley Formation (Mississippian: Lower Carboniferous), south-central Kansas: AAPG Bulletin, v. 93, no.12, p.1649-1689.
ROGERS, J. P., AND LONGMAN, M. W., 2001, An introduction to chert reservoirs of North America, 2001, AAPG Bulletin, v. 85, no.1, p. 1-5.
RUGER, A., 1997, P-wave reflection coefficients for transversely isotropic models with vertical and horizontal axis of symmetry: Geophysics, 62, 713-722
WATNEY, W. L., GUY, W. J., AND BYRNES, A. P., 2001, Characterization of the Mississippian chat in south-central Kansas: AAPG Bulletin, v. 85, no.1, p. 85-113.
Kansas Interdisciplinary Carbonates Consortium Prospectus – July 2017
160
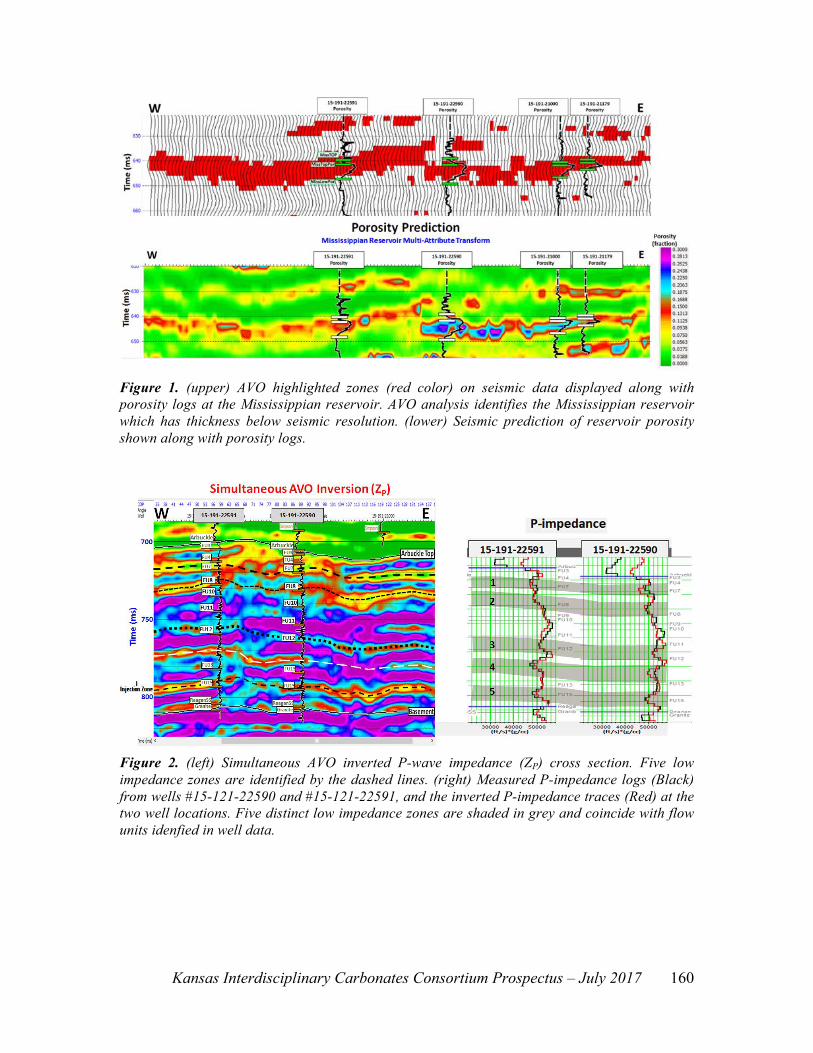
Figure 1. (upper) AVO highlighted zones (red color) on seismic data displayed along with porosity logs at the Mississippian reservoir. AVO analysis identifies the Mississippian reservoir which has thickness below seismic resolution. (lower) Seismic prediction of reservoir porosity shown along with porosity logs.
Figure 2. (left) Simultaneous AVO inverted P-wave impedance (ZP) cross section. Five low impedance zones are identified by the dashed lines. (right) Measured P-impedance logs (Black) from wells #15-121-22590 and #15-121-22591, and the inverted P-impedance traces (Red) at the two well locations. Five distinct low impedance zones are shaded in grey and coincide with flow units idenfied in well data.
Kansas Interdisciplinary Carbonates Consortium Prospectus – July 2017 161
Seismic Attribute Analysis of the Arbuckle Group from 3D-3C Data at Cutter Field, Southwest Kansas
George Tsoflias, Lynn Watney, Clyde Redger
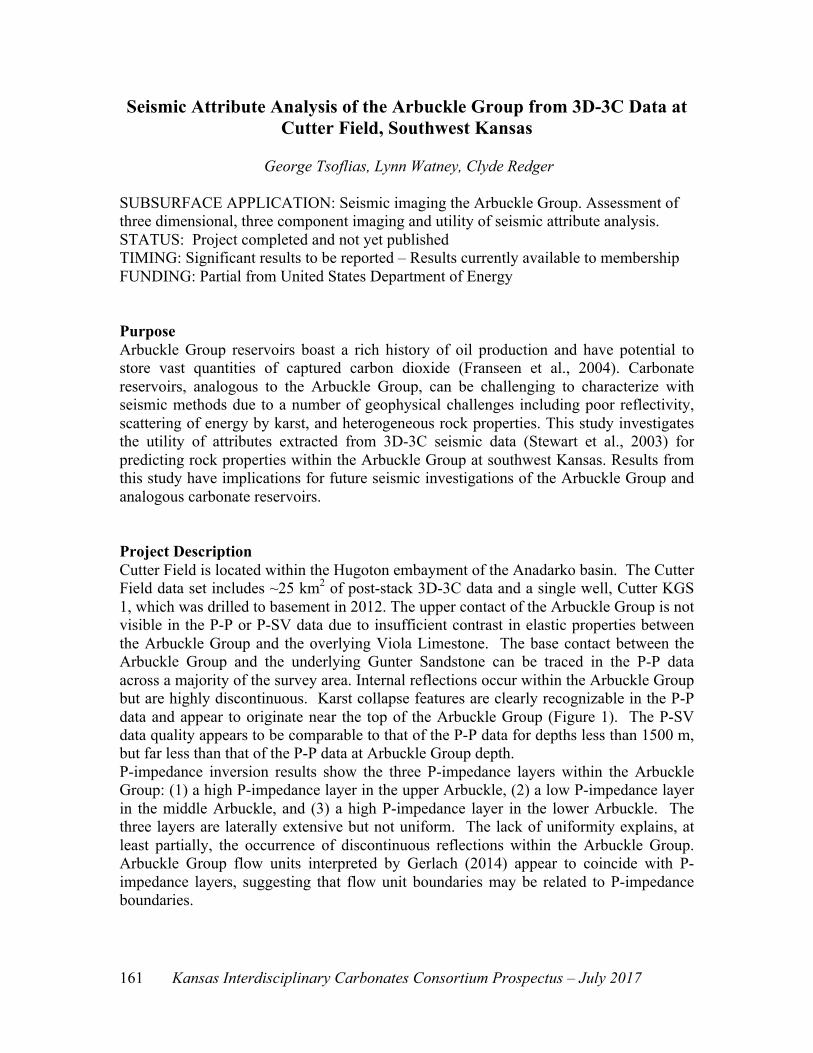
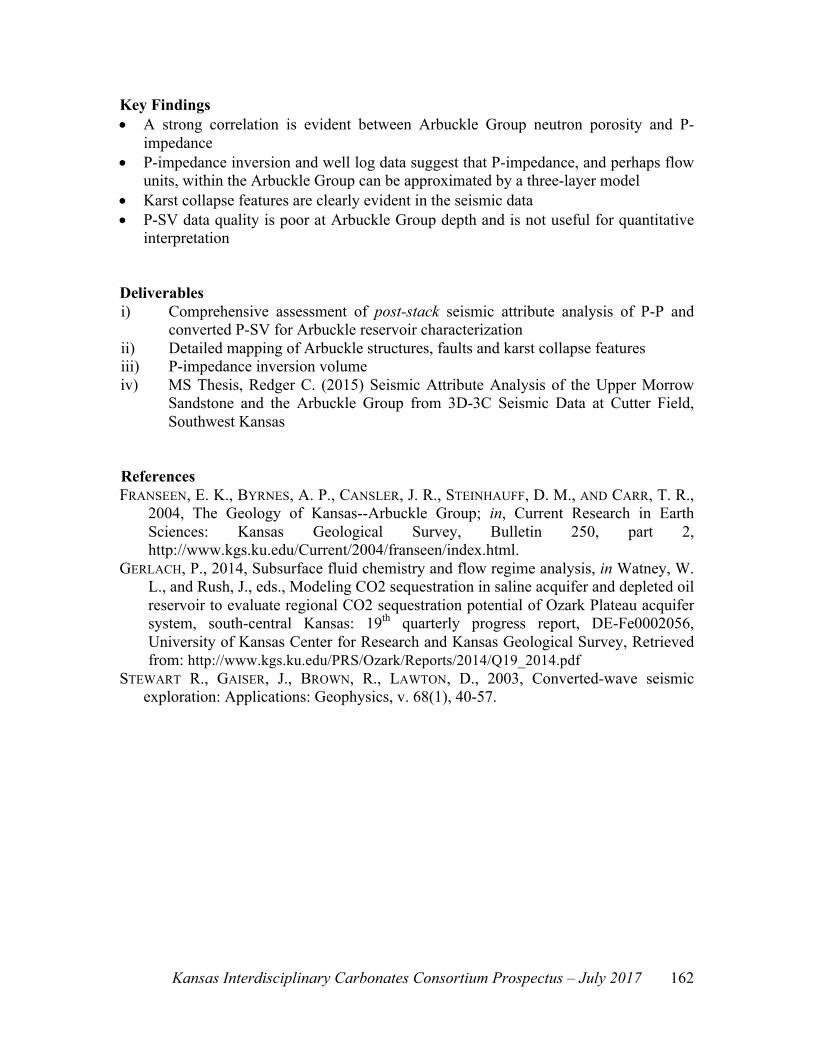
SUBSURFACE APPLICATION: Seismic imaging the Arbuckle Group. Assessment of three dimensional, three component imaging and utility of seismic attribute analysis. STATUS: Project completed and not yet published TIMING: Significant results to be reported – Results currently available to membership FUNDING: Partial from United States Department of Energy Purpose Arbuckle Group reservoirs boast a rich history of oil production and have potential to store vast quantities of captured carbon dioxide (Franseen et al., 2004). Carbonate reservoirs, analogous to the Arbuckle Group, can be challenging to characterize with seismic methods due to a number of geophysical challenges including poor reflectivity, scattering of energy by karst, and heterogeneous rock properties. This study investigates the utility of attributes extracted from 3D-3C seismic data (Stewart et al., 2003) for predicting rock properties within the Arbuckle Group at southwest Kansas. Results from this study have implications for future seismic investigations of the Arbuckle Group and analogous carbonate reservoirs. Project Description Cutter Field is located within the Hugoton embayment of the Anadarko basin. The Cutter Field data set includes ~25 km2 of post-stack 3D-3C data and a single well, Cutter KGS 1, which was drilled to basement in 2012. The upper contact of the Arbuckle Group is not visible in the P-P or P-SV data due to insufficient contrast in elastic properties between the Arbuckle Group and the overlying Viola Limestone. The base contact between the Arbuckle Group and the underlying Gunter Sandstone can be traced in the P-P data across a majority of the survey area. Internal reflections occur within the Arbuckle Group but are highly discontinuous. Karst collapse features are clearly recognizable in the P-P data and appear to originate near the top of the Arbuckle Group (Figure 1). The P-SV data quality appears to be comparable to that of the P-P data for depths less than 1500 m, but far less than that of the P-P data at Arbuckle Group depth. P-impedance inversion results show the three P-impedance layers within the Arbuckle Group: (1) a high P-impedance layer in the upper Arbuckle, (2) a low P-impedance layer in the middle Arbuckle, and (3) a high P-impedance layer in the lower Arbuckle. The three layers are laterally extensive but not uniform. The lack of uniformity explains, at least partially, the occurrence of discontinuous reflections within the Arbuckle Group. Arbuckle Group flow units interpreted by Gerlach (2014) appear to coincide with P-impedance layers, suggesting that flow unit boundaries may be related to P-impedance boundaries.
Kansas Interdisciplinary Carbonates Consortium Prospectus – July 2017
162
Key Findings • A strong correlation is evident between Arbuckle Group neutron porosity and P-
impedance • P-impedance inversion and well log data suggest that P-impedance, and perhaps flow
units, within the Arbuckle Group can be approximated by a three-layer model • Karst collapse features are clearly evident in the seismic data • P-SV data quality is poor at Arbuckle Group depth and is not useful for quantitative
interpretation Deliverables i) Comprehensive assessment of post-stack seismic attribute analysis of P-P and
converted P-SV for Arbuckle reservoir characterization ii) Detailed mapping of Arbuckle structures, faults and karst collapse features iii) P-impedance inversion volume iv) MS Thesis, Redger C. (2015) Seismic Attribute Analysis of the Upper Morrow
Sandstone and the Arbuckle Group from 3D-3C Seismic Data at Cutter Field, Southwest Kansas
References FRANSEEN, E. K., BYRNES, A. P., CANSLER, J. R., STEINHAUFF, D. M., AND CARR, T. R.,
2004, The Geology of Kansas--Arbuckle Group; in, Current Research in Earth Sciences: Kansas Geological Survey, Bulletin 250, part 2, http://www.kgs.ku.edu/Current/2004/franseen/index.html.
GERLACH, P., 2014, Subsurface fluid chemistry and flow regime analysis, in Watney, W. L., and Rush, J., eds., Modeling CO2 sequestration in saline acquifer and depleted oil reservoir to evaluate regional CO2 sequestration potential of Ozark Plateau acquifer system, south-central Kansas: 19th quarterly progress report, DE-Fe0002056, University of Kansas Center for Research and Kansas Geological Survey, Retrieved from: http://www.kgs.ku.edu/PRS/Ozark/Reports/2014/Q19_2014.pdf
STEWART R., GAISER, J., BROWN, R., LAWTON, D., 2003, Converted-wave seismic exploration: Applications: Geophysics, v. 68(1), 40-57.
Kansas Interdisciplinary Carbonates Consortium Prospectus – July 2017 163
Figure 1. Seismic profile showing karst collapse features in the Cutter 3D-3C survey. The karst collapse features appear to originate near the top of the Arbuckle Group, which is located directly beneath the Viola horizon.
Figure 2. Inverted P-impedance profile with inserted P-impedance log from well Cutter KGS 1 (API: 15-189-22781). The inverted volume lacks the resolution of the well log, but provides an accurate low-frequency approximation of P-impedance. Three P-impedance layers are evident within the Arbuckle Group.
Kansas Interdisciplinary Carbonates Consortium Prospectus – July 2017
164
Seismic Anisotropy Investigation and Fracture Characterization in the Mississippian and Arbuckle Reservoirs, South-Central Kansas
George Tsoflias, Brandon Graham, Lynn Watney
SUBSURFACE APPLICATION: Determination of Mississippian and Arbuckle reservoir seismic anisotropy and characterization of fractures using 3D seismic reflection data STATUS: Long-term project in progress TIMING: Significant results to be reported to membership (year 3 of 4) FUNDING: Partial from United States Department of Energy Purpose The Mississippian Lime play in the US mid-continent has been a major hydrocarbon producer and is a target for enhanced oil recovery operations. The Lower Ordovician Arbuckle Group dolomite is a saline aquifer with significant potential for CO2 storage. However, carbonate reservoirs are heterogeneous and the distribution of properties controlling the flow of fluids is often below seismic resolution. Ongoing KICC seismic analysis research identified characteristic relationships between Mississippian and Arbuckle properties (thickness, porosity) and seismic attributes (Amplitude Variation with Offset – AVO, P- and S-Impedance), and developed seismic inverse workflows that predict accurately porosity distribution and flow units at Wellington field. This research expands this newly acquired understanding of carbonate rock elastic properties at Wellington field to quantify stress distribution, fracture orientation and density, and help understand subsurface geomechanical properties with implications in rock fracturing, CO2 EOR and sequestration, and water injection. Project Description This study focuses on azimuthal seismic anisotropy to visualize reservoir stress and fractures. Seismic anisotropy is observed as the variation in seismic velocity and amplitude with orientation of wave propagation (Aki and Richards, 1980). We use 3D seismic data in the pre-stack azimuth domain (AVAZ) to quantify Mississippian and Arbuckle seismic anisotropy and infer fracture properties (orientation and density) at the Wellington Field in South-Central Kansas. We consider vertical planes of isotropy due to stress and vertical fractures referred as Horizontal Transverse Isotropy (HTI) or Azimuthal Anisotropy (Ruger, 1998; Thomsen, 2002; Lynn, 2016). Key Findings • Mississippian and Arbuckle anisotropic fabric is along and orthogonal to regional
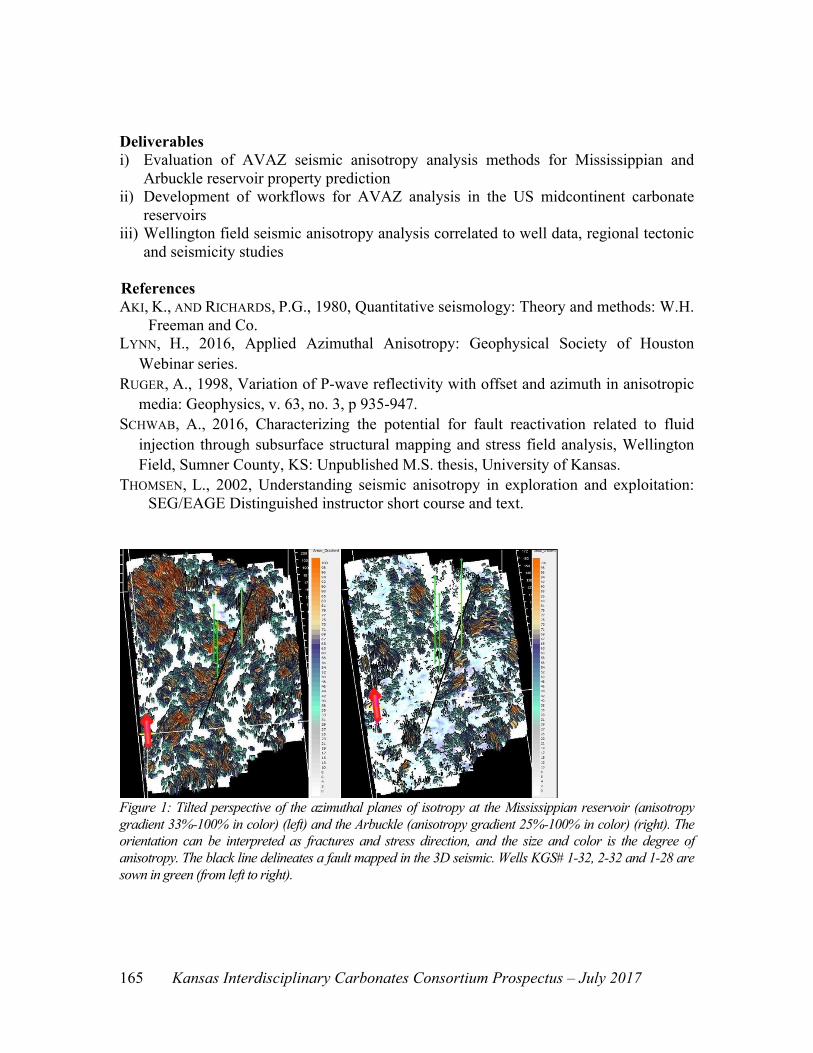
maximum horizontal stress (~70-80 degrees) and with the main structural feature in the field, a NE trending fault mapped in 3D seismic (figure 1)
• Seismic anisotropy observations are in agreement with natural fracture sets observed in borehole Formation Micro Imaging (FMI) logs, dipole-dipole sonic logs, regional fault maps, and regional earthquake focal mechanism analysis (Schwab, 2016)
• Anisotropy analysis using 3D surface seismic data is shown to be a suitable method for predicting stress field orientation and estimating fracture geometries in the Mississippian and Arbuckle reservoirs
Kansas Interdisciplinary Carbonates Consortium Prospectus – July 2017 165
Deliverables i) Evaluation of AVAZ seismic anisotropy analysis methods for Mississippian and
Arbuckle reservoir property prediction ii) Development of workflows for AVAZ analysis in the US midcontinent carbonate
reservoirs iii) Wellington field seismic anisotropy analysis correlated to well data, regional tectonic
and seismicity studies References AKI, K., AND RICHARDS, P.G., 1980, Quantitative seismology: Theory and methods: W.H.
Freeman and Co. LYNN, H., 2016, Applied Azimuthal Anisotropy: Geophysical Society of Houston
Webinar series. RUGER, A., 1998, Variation of P-wave reflectivity with offset and azimuth in anisotropic
media: Geophysics, v. 63, no. 3, p 935-947. SCHWAB, A., 2016, Characterizing the potential for fault reactivation related to fluid
injection through subsurface structural mapping and stress field analysis, Wellington Field, Sumner County, KS: Unpublished M.S. thesis, University of Kansas.
THOMSEN, L., 2002, Understanding seismic anisotropy in exploration and exploitation: SEG/EAGE Distinguished instructor short course and text.
Figure 1: Tilted perspective of the azimuthal planes of isotropy at the Mississippian reservoir (anisotropy gradient 33%-100% in color) (left) and the Arbuckle (anisotropy gradient 25%-100% in color) (right). The orientation can be interpreted as fractures and stress direction, and the size and color is the degree of anisotropy. The black line delineates a fault mapped in the 3D seismic. Wells KGS# 1-32, 2-32 and 1-28 are sown in green (from left to right).
Kansas Interdisciplinary Carbonates Consortium Prospectus – July 2017
166
Three-Dimensional Heterogeneity in a Complex Ooid Grainstone: Integrated Stratigraphic and Geophysical Study of the Drum
Limestone, Kansas
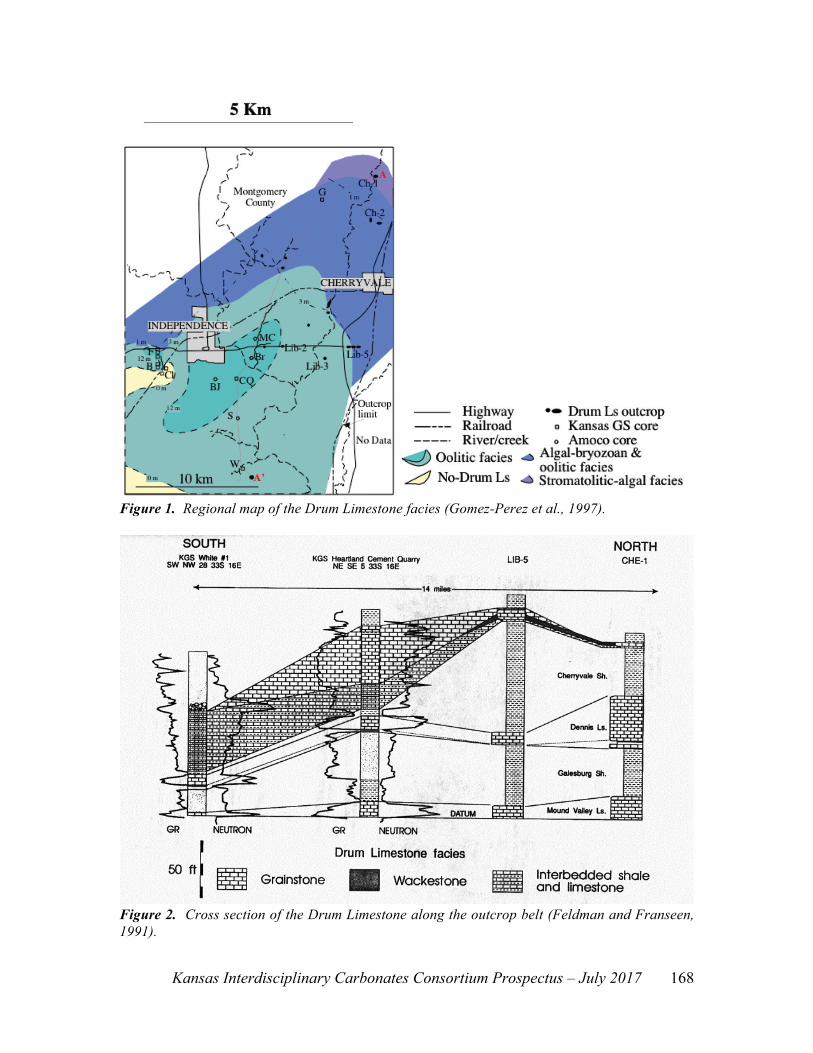
George Tsoflias, Evan Franseen, Gene Rankey, students SUBSURFACE APPLICATION: Oolitic reservoirs (Cretaceous of Texas, Mexico, Middle East, North Africa; Permian of Texas, New Mexico; Carboniferous of Midcontinent U.S.A.) STATUS: Proposed project TIMING: To be completed in the future if recommended by membership FUNDING: None Purpose The Drum Formation (Pennsylvanian, Missourian) in Kansas includes an oolitic body that is an analog to many producing hydrocarbon reservoirs. The characteristics of this limestone unit - its extension, geometry, volume and connection between different bodies, as well as its porosity and permeability - are closely related to depositional and diagenetic factors. The purpose of this project is to integrate detailed outcrop studies with high-resolution geophysical methods (LIDAR, reflection seismic, ground-penetrating radar - GPR) to image internal architectures and porosity distribution in three dimensions (3-D). The factors controlling porosity and permeability in the Drum Limestone may be applicable to other oolitic reservoirs in Kansas, the Midcontinent and other carbonate reservoir producing provinces. Project Description The Drum Limestone and associated strata crop out in SE Kansas, near the town of Independence in Montgomery County (Figure 1). The Drum Limestone forms a belt up to 40 km long and 30 km wide characterized by a high degree of variability in facies and thickness. It includes an oolitic body that changes laterally to the northeast (shelfward) to algal and bryozoan mounds (Feldman and Franseen, 1991). The thickness of the Drum Limestone varies from less than a meter to 24 m. It is wedge shaped and pinches out in both shelfward and basinward directions (Figure 2). The skeletal oolitic grainstone facies (reservoir analog) is thickest and best exposed in the Heartland Cement quarry (site of this study; stratigraphic log shown in figure 2) where it is approximately 15 m thick. It consists of a range of facies from nearly pure, well-sorted oolite to poorly sorted oolitic fossiliferous grainstone and a small amount of packstone (Feldman et al., 1993). The main body of the oolite is well exposed in the mile-long (1.6 km) highwall of the Heartland Cement quarry and consists of thick (1-1.3 m) tabular, planar cross beds at the base that grade upwards to thinner, trough cross beds at the top (Feldman et al., 1993). Current orientations are predominantly to the southwest with a minor mode to the northeast (Hamblin, 1969). Troughs are separated by shale drapes that grade upward into isolated troughs surrounded by shale. The Drum Limestone shows a distribution of cement and porosity closely related to sedimentary facies. The lower part of the oolitic body (oolitic grainstone) is characterized
Kansas Interdisciplinary Carbonates Consortium Prospectus – July 2017 167
by early cementation and recrystalization of marine cements, high oomoldic porosity, and little compaction. The upper part of the oolitic body (skeletal oolitic grainstone) shows a higher percent of spar and dolomitic cements, less common moldic porosity and more compaction. Subtle subaerial features (e.g., autobrecciation, circumgranular cracking, root traces) are locally recorded in the oolitic body and linked to an intra-Drum subaerial exposure surface.
This project will integrate stratigraphic studies of the extensively exposed Drum Limestone at the Heartland Cement quarry with geophysical imaging for high-resolution, 3-D imaging of this reservoir analogue unit. Prior studies of the stratigraphic and depositional history of the Drum Limestone (Feldman and Franseen, 1991; Feldman et al., 1993) provide the basic geologic framework for this project. High-resolution geophysical imaging consisting of LIDAR, seismic and GPR will offer insights about the internal facies and geometry architecture and porosity distribution. LIDAR scanning of the 1.6 km long, 15 m tall quarry wall will provide accurate and quantitative 2-D representation of facies thicknesses and internal geometries. High-resolution seismic and GPR will image multiple profiles parallel to the quarry wall which will be correlated to the LIDAR images and stratigraphy for generating 3-D reservoir analogue volumes of the Drum Limestone. Seismic and radar reflection volumes are expected to provide sub-meter scale imaging to a depth range of 0-10 m for GPR and 5-50 m for seismic. Seismic and radar signal attributes (e.g. interval velocity of propagation; interface reflectivity) will be correlated to lithology and porosity of the Drum Limestone in adjacent outcrops. If funded, cores behind the quarry wall will be taken to ground truth geophysical data away from the quarry exposure. Core plugs of all facies will be taken from the quarry wall and cores for porosity and permeability data. Deliverables This project will provide detailed 3-D reservoir-scale models of facies and porosity distribution of the Drum Limestone, which includes an oolitic body that is an analog to many producing hydrocarbon reservoirs in the Midcontinent and worldwide. Deliverables include integrated sedimentologic, petrographic, LIDAR, seismic and GPR data, as well as derived reservoir models in Petrel. References FELDMAN, H.R., AND FRANSEEN, E.K., 1991, Stratigraphy and depositional history of the
Drum Limestone and associated strata (Pennsylvanian) in the Independence, Kansas, Area - A field trip guidebook and road log: Kansas Geological Survey Open-File Report 91-45, 29 p.
FELDMAN, H.R., FRANSEEN, E.K., MILLER, R.A., AND ANDERSON, N.L., 1993, A model of Missourian oolitic petroleum reservoirs based on the Drum Limestone in southeastern Kansas: Kansas Geological Survey Open-File Report 93-28, 67 p.
GOMEZ-PEREZ, I., FELDMAN, H.R., FRANSEEN, E.K, AND, SIMO, A.J., 1997, Evolution and diagenesis of an oolitic limestone (Drum Formation), Missourian, Kansas, USA: Kansas Geological Survey Open-File Report 97-74, 12p.
HAMBLIN, W.K., 1969, Marine paleocurrent directions in limestones of the Kansas City Group (Upper Pennsylvanian) in eastern Kansas: Kansas Geological Survey Bulletin 194, pt. 2, 25 p.
Kansas Interdisciplinary Carbonates Consortium Prospectus – July 2017
168
Figure 1. Regional map of the Drum Limestone facies (Gomez-Perez et al., 1997).
Figure 2. Cross section of the Drum Limestone along the outcrop belt (Feldman and Franseen, 1991).
Kansas Interdisciplinary Carbonates Consortium Prospectus – July 2017 169
High-Resolution Shallow Seismic Imaging and Seismic Modeling of Upper Miocene Carbonates of the Agua Amarga Basin, SE Spain
George Tsoflias, Evan Franseen, Robert Goldstein, Hassan Eltom
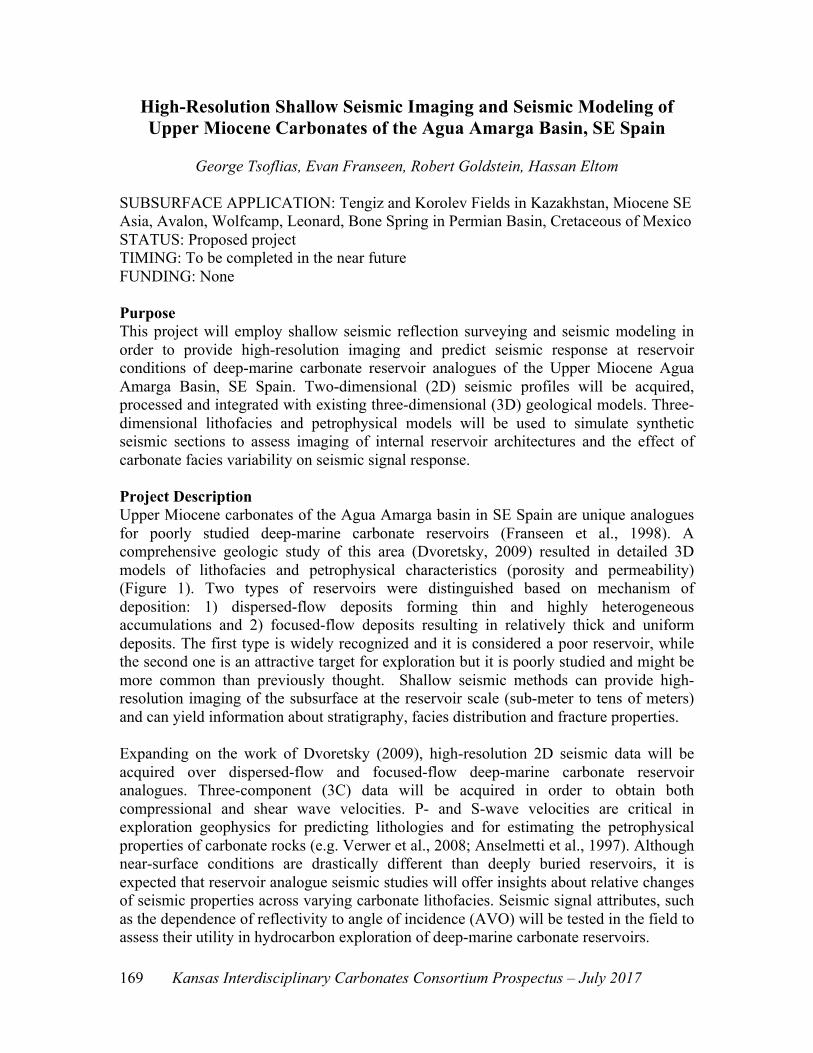
SUBSURFACE APPLICATION: Tengiz and Korolev Fields in Kazakhstan, Miocene SE Asia, Avalon, Wolfcamp, Leonard, Bone Spring in Permian Basin, Cretaceous of Mexico STATUS: Proposed project TIMING: To be completed in the near future FUNDING: None Purpose This project will employ shallow seismic reflection surveying and seismic modeling in order to provide high-resolution imaging and predict seismic response at reservoir conditions of deep-marine carbonate reservoir analogues of the Upper Miocene Agua Amarga Basin, SE Spain. Two-dimensional (2D) seismic profiles will be acquired, processed and integrated with existing three-dimensional (3D) geological models. Three-dimensional lithofacies and petrophysical models will be used to simulate synthetic seismic sections to assess imaging of internal reservoir architectures and the effect of carbonate facies variability on seismic signal response. Project Description Upper Miocene carbonates of the Agua Amarga basin in SE Spain are unique analogues for poorly studied deep-marine carbonate reservoirs (Franseen et al., 1998). A comprehensive geologic study of this area (Dvoretsky, 2009) resulted in detailed 3D models of lithofacies and petrophysical characteristics (porosity and permeability) (Figure 1). Two types of reservoirs were distinguished based on mechanism of deposition: 1) dispersed-flow deposits forming thin and highly heterogeneous accumulations and 2) focused-flow deposits resulting in relatively thick and uniform deposits. The first type is widely recognized and it is considered a poor reservoir, while the second one is an attractive target for exploration but it is poorly studied and might be more common than previously thought. Shallow seismic methods can provide high-resolution imaging of the subsurface at the reservoir scale (sub-meter to tens of meters) and can yield information about stratigraphy, facies distribution and fracture properties.
Expanding on the work of Dvoretsky (2009), high-resolution 2D seismic data will be acquired over dispersed-flow and focused-flow deep-marine carbonate reservoir analogues. Three-component (3C) data will be acquired in order to obtain both compressional and shear wave velocities. P- and S-wave velocities are critical in exploration geophysics for predicting lithologies and for estimating the petrophysical properties of carbonate rocks (e.g. Verwer et al., 2008; Anselmetti et al., 1997). Although near-surface conditions are drastically different than deeply buried reservoirs, it is expected that reservoir analogue seismic studies will offer insights about relative changes of seismic properties across varying carbonate lithofacies. Seismic signal attributes, such as the dependence of reflectivity to angle of incidence (AVO) will be tested in the field to assess their utility in hydrocarbon exploration of deep-marine carbonate reservoirs.
Kansas Interdisciplinary Carbonates Consortium Prospectus – July 2017
170
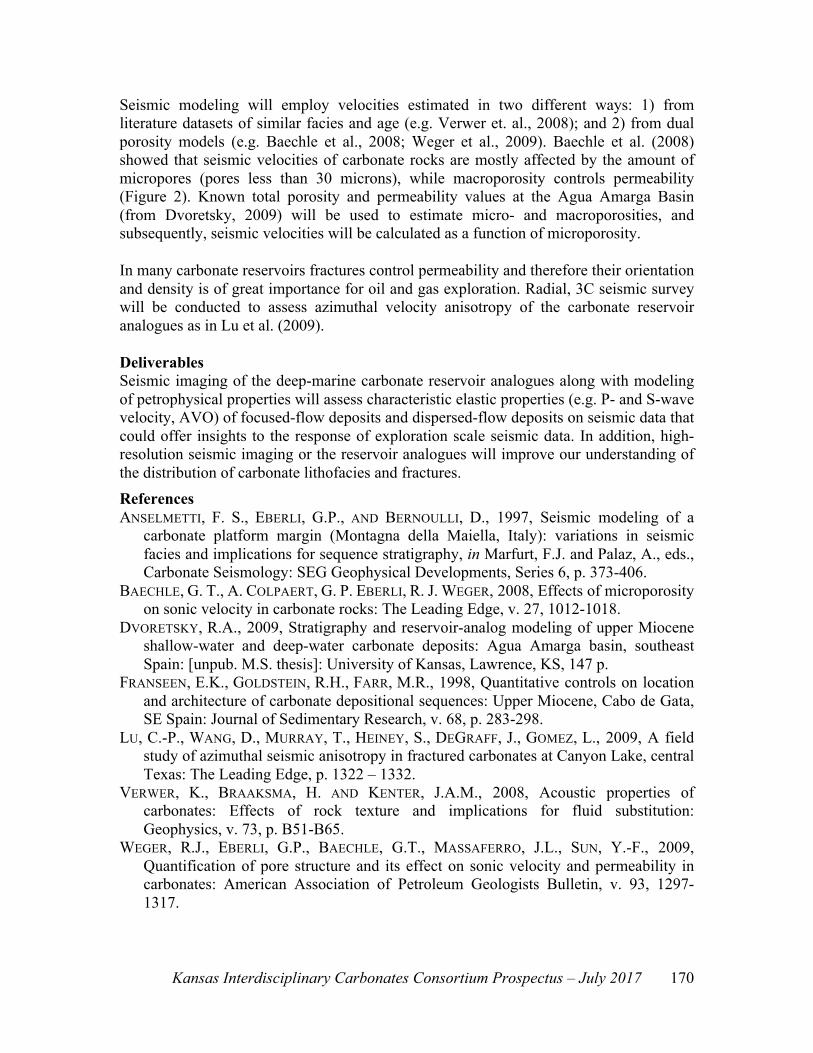
Seismic modeling will employ velocities estimated in two different ways: 1) from literature datasets of similar facies and age (e.g. Verwer et. al., 2008); and 2) from dual porosity models (e.g. Baechle et al., 2008; Weger et al., 2009). Baechle et al. (2008) showed that seismic velocities of carbonate rocks are mostly affected by the amount of micropores (pores less than 30 microns), while macroporosity controls permeability (Figure 2). Known total porosity and permeability values at the Agua Amarga Basin (from Dvoretsky, 2009) will be used to estimate micro- and macroporosities, and subsequently, seismic velocities will be calculated as a function of microporosity.
In many carbonate reservoirs fractures control permeability and therefore their orientation and density is of great importance for oil and gas exploration. Radial, 3C seismic survey will be conducted to assess azimuthal velocity anisotropy of the carbonate reservoir analogues as in Lu et al. (2009).
Deliverables Seismic imaging of the deep-marine carbonate reservoir analogues along with modeling of petrophysical properties will assess characteristic elastic properties (e.g. P- and S-wave velocity, AVO) of focused-flow deposits and dispersed-flow deposits on seismic data that could offer insights to the response of exploration scale seismic data. In addition, high-resolution seismic imaging or the reservoir analogues will improve our understanding of the distribution of carbonate lithofacies and fractures. References ANSELMETTI, F. S., EBERLI, G.P., AND BERNOULLI, D., 1997, Seismic modeling of a
carbonate platform margin (Montagna della Maiella, Italy): variations in seismic facies and implications for sequence stratigraphy, in Marfurt, F.J. and Palaz, A., eds., Carbonate Seismology: SEG Geophysical Developments, Series 6, p. 373-406.
BAECHLE, G. T., A. COLPAERT, G. P. EBERLI, R. J. WEGER, 2008, Effects of microporosity on sonic velocity in carbonate rocks: The Leading Edge, v. 27, 1012-1018.
DVORETSKY, R.A., 2009, Stratigraphy and reservoir-analog modeling of upper Miocene shallow-water and deep-water carbonate deposits: Agua Amarga basin, southeast Spain: [unpub. M.S. thesis]: University of Kansas, Lawrence, KS, 147 p.
FRANSEEN, E.K., GOLDSTEIN, R.H., FARR, M.R., 1998, Quantitative controls on location and architecture of carbonate depositional sequences: Upper Miocene, Cabo de Gata, SE Spain: Journal of Sedimentary Research, v. 68, p. 283-298.
LU, C.-P., WANG, D., MURRAY, T., HEINEY, S., DEGRAFF, J., GOMEZ, L., 2009, A field study of azimuthal seismic anisotropy in fractured carbonates at Canyon Lake, central Texas: The Leading Edge, p. 1322 – 1332.
VERWER, K., BRAAKSMA, H. AND KENTER, J.A.M., 2008, Acoustic properties of carbonates: Effects of rock texture and implications for fluid substitution: Geophysics, v. 73, p. B51-B65.
WEGER, R.J., EBERLI, G.P., BAECHLE, G.T., MASSAFERRO, J.L., SUN, Y.-F., 2009, Quantification of pore structure and its effect on sonic velocity and permeability in carbonates: American Association of Petroleum Geologists Bulletin, v. 93, 1297-1317.
Kansas Interdisciplinary Carbonates Consortium Prospectus – July 2017 171
Figure 1. Lithofacies fence diagram: large paleovalley is associated with focused-flow deposits; broad trough is associated with dispersed-flow deposits (from Dvoretsky, 2009).
Figure 2. a) Top: porosity versus p-wave velocity. Bottom = microporosity versus p-wave velocity. Black dots (samples with microporosity) have smaller scatter in the plots than red dots (samples with less microporosity). The porosity-velocity relationship is considerably improved by using microporosity instead of total porosity; b) Top: porosity versus permeability. Bottom: using macroporosity instead of total porosity improves a porosity-permeability correlation. (from Baechle et al., 2008).
%
mdi
%
mdi
Kansas Interdisciplinary Carbonates Consortium Prospectus – July 2017
172
Ground Penetrating Radar High-Resolution 3-D Imaging of Dual
Porosity - Permeability Systems: Imaging Carbonate Lithofacies, Flow Units and Flow Conduits
George Tsoflias, Student
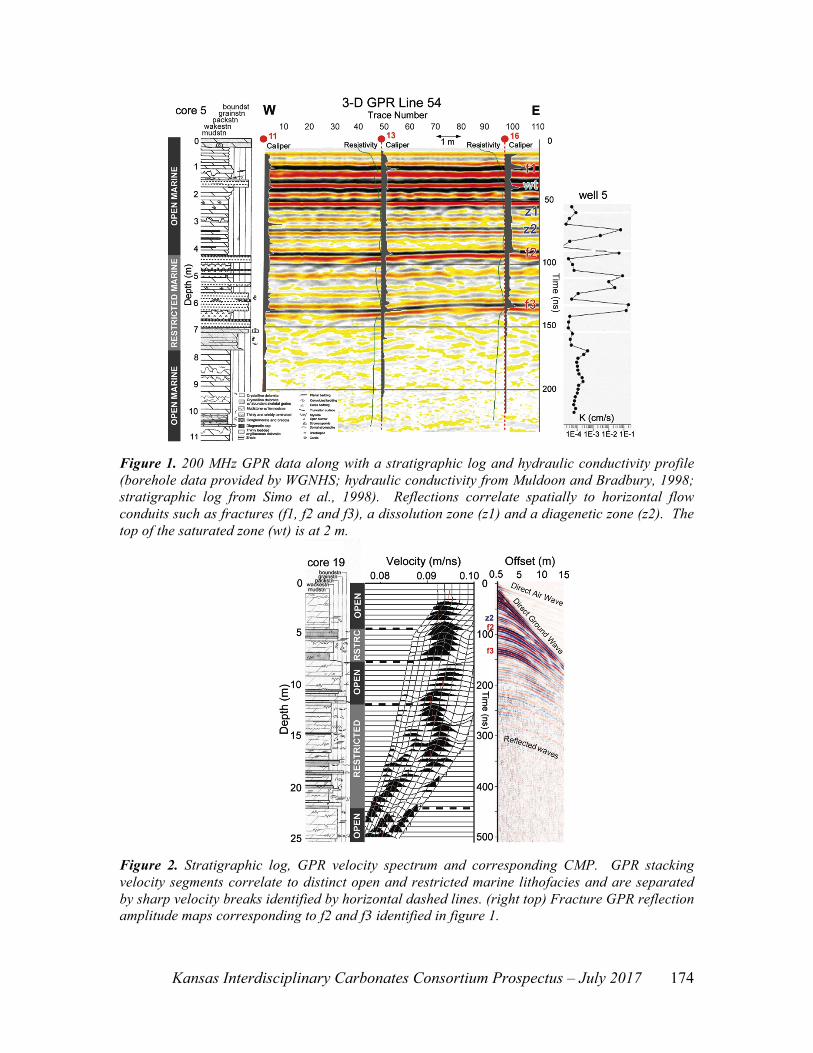
SUBSURFACE APPLICATION: Advancing GPR imaging methods will support the 3D study and quantification of carbonate reservoir analogue properties. STATUS: Long-term project in progress TIMING: Significant results to be reported – Results currently available to membership FUNDING: Partial from US DOE Purpose High-resolution geophysical imaging of the subsurface offers a means to assess heterogeneous properties of carbonate reservoir analogues in 3-D. This project aims at advancing ground penetrating radar methods for imaging internal architectures of carbonate systems, characterizing lithofacies, quantifying porosity distribution, and identifying flow units and flow conduits. Technological developments under this project are applied to KICC outcrop studies advancing the understanding of hydrocarbon reservoir properties. Project Description Ground penetrating radar is a high-resolution imaging method that has been used in numerous studies of carbonate outcrops (e.g. Franseen et al., 2007). GPR uses FM frequency radio waves to image the subsurface at decimeter-scale resolution (Davis and Annan, 1989). Radar waves respond to changes in formation porosity as well as pore-fluid type. Used in 3-D and time-lapse mode, GPR imaging can provide high-resolution images of internal architectures and monitor the flow of fluids (Tsoflias et al., 2001; Grasmueck and Weger, 2002). This project focuses on the development of quantitative GPR methods for the study of dual porosity – permeability rocks. Dual porosity rocks are highly heterogeneous and present a great challenge to fluid flow properties prediction. In those units, fracture and dissolution networks provide the flow conduits for rapid transport of fluids. A priori knowledge of fracture and dissolution conduit orientation, inter-connectivity and aperture variability, as well as matrix porosity and permeability heterogeneity, can significantly improve our understanding of carbonate system flow properties. Relating quantitative GPR signal response to formation porosity distribution and hydraulic properties can assist in the study of ground water aquifers and near-surface petroleum reservoir analogues. Our earlier work has exploited GPR methods to study carbonate rocks. Three-dimensional GPR reflection surveying has imaged varying carbonate lithofacies, lithologic discontinuities, dissolution zones, and horizontal fractures (Figure 1). Velocity analysis of common mid-point data identified velocity variations correlating to alternating open and restricted marine facies (Figure 2). Analysis of GPR reflection amplitude variation along prominent flow conduits revealed centimeter-scale fracture aperture variation and mapped flow conduits and flow barriers in three dimensions.
Kansas Interdisciplinary Carbonates Consortium Prospectus – July 2017 173
Employed along with hydrologic and stratigraphic information, 3-D GPR methods are shown to remotely characterize the flow properties of heterogeneous carbonate systems (Tsoflias, 2008). Deliverables The proposed work will develop quantitative methods of relating GPR signal attributes to carbonate system heterogeneous flow properties by investigating the relationships of electromagnetic (EM) signal response (i.e. amplitude, phase, velocity, frequency) to hydraulically important formation parameters (i.e. conduit aperture, matrix porosity, fluid type and electrical conductivity) (e.g. Tsoflias et al, 2004; Tsoflias and Becker 2008). The methods will be used in conjunction with KICC geologic outcrop studies for the development of 3-D carbonate flow system analogues. GPR determination of facies and porosity distribution, conduit aperture, interconnectivity, channeling, and conduit density will be integrated with reservoir simulation studies for prediction of carbonate reservoir performance. References DAVIS J.L. AND ANNAN, A.P., 1989, Ground penetrating radar for high-resolution
mapping of soil and rock stratigraphy: Geophysical Prospecting, v. 37, p. 531-551. FRANSEEN, E.K., BYRNES, A., XIA, J., AND MILLER, R., 2007, Improving resolution and
understanding controls of GPR response in carbonate Strata: Implications for attribute analysis: The Leading Edge, v. 26, p. 984-993.
GRASMUECK M. AND WEGER, R., 2002, 3D GPR reveals complex internal structure of Pleistocene oolitic sandbar: The Leading Edge, v. 20, p. 634-639.
MULDOON, M.A., AND BRADBURY, K.R., 1998, Hydrogeology of the Silurian Dolomite Aquifer, Door County, Wisconsin, in Fluid Flow in Carbonates: Interdisciplinary Approaches: Field Trip Guidebook, SEPM Research Conference, p. 17-22.
SIMO, J.A., HARRIS, M.T., AND MULDOON, M.A., 1998, Stratigraphy and Sedimentology of the Silurian Dolostones, Door County, Wisconsin, in Fluid Flow in Carbonates: Interdisciplinary Approaches: Field Trip Guidebook, SEPM Research Conference, p. 3-15.
TSOFLIAS, G.P., HALIHAN, T., AND SHARP, J.M., JR., 2001, Monitoring pumping test response in a fractured aquifer using ground penetrating radar: Water Resources Research, v. 37, p. 1221–1229.
TSOFLIAS, G.P., 2008, GPR Imaging of dual-porosity rocks: insights to fluid flow: The Leading Edge, v. 27, p. 1436-1445.
TSOFLIAS, G.P., AND BECKER, M., 2008, Ground penetrating radar response to fracture fluid salinity: Why lower frequencies are favorable for resolving salinity changes: Geophysics, v. 73, p. J25-J30, doi:10.1190/1.2957893.
TSOFLIAS, G.P., VAN GESTEL, J.P., STOFFA, P., BLANKENSHIP, D. AND SEN, M., 2004, Vertical fracture detection by exploiting the polarization properties of GPR signal: Geophysics, v. 69, p. 803-810.
Kansas Interdisciplinary Carbonates Consortium Prospectus – July 2017
174
Figure 1. 200 MHz GPR data along with a stratigraphic log and hydraulic conductivity profile (borehole data provided by WGNHS; hydraulic conductivity from Muldoon and Bradbury, 1998; stratigraphic log from Simo et al., 1998). Reflections correlate spatially to horizontal flow conduits such as fractures (f1, f2 and f3), a dissolution zone (z1) and a diagenetic zone (z2). The top of the saturated zone (wt) is at 2 m.
Figure 2. Stratigraphic log, GPR velocity spectrum and corresponding CMP. GPR stacking velocity segments correlate to distinct open and restricted marine lithofacies and are separated by sharp velocity breaks identified by horizontal dashed lines. (right top) Fracture GPR reflection amplitude maps corresponding to f2 and f3 identified in figure 1.
Kansas Interdisciplinary Carbonates Consortium Prospectus – July 2017 175
Imaging Fluid Flow and Transport in Discrete Fractures Using Ground Penetrating Radar
George Tsoflias, Student
SUBSURFACE APPLICATION: Advancing the fundamental understanding of flow through fractured rocks. STATUS: Long-term project in progress TIMING: Significant results to be reported – Results currently available to membership FUNDING: Partial from US DOE
Purpose Accurate prediction of fracture flow properties is critical to the efficient development of reservoirs. Flow in fractured formations is highly heterogeneous and difficult to predict. The objective of this work is to study fractured near-surface reservoir analogues for remote determination of fracture hydraulic properties and time-lapse monitoring of flow of fluids using GPR. Recently developed GPR methods of monitoring ground water flow will be extended to imaging multi-phase flow through fractures and monitoring the efficiency of enhanced oil recovery methods. High-resolution field imaged fracture properties will be incorporated to reservoir flow model simulations.
Project Description Predicting flow and transport in fractured formations remains a challenging problem. Flow through this highly heterogeneous medium is controlled by fracture aperture, channeling along the fracture (i.e., aperture variability), and fracture connectivity. Our earlier work has developed GPR methods for imaging fractures and mapping aperture variability (Figure 1) (Tsoflias, 2008), differentiating between air filled (drained) and water filled (saturated) portion of a fracture plane during hydraulic testing (Figure 2) (Tsoflias et al., 2001), and identifying variations in fracture water salinity (Figure 3) (Tsoflias and Becker, 2008).
This research is developing GPR methods to obtain an independent measure of the spatial distribution of fracture aperture and fluid tracer concentration. We are investigating the GPR response of water saturated fractures of varying aperture containing native formation water or a saline tracer of varying concentration. For a fracture enclosed in a homogenous matrix, reflection amplitude is expected to increase from a value of zero for zero layer thickness to maximum reflection strength when layer thickness is approximately equal (depending on wavelet shape) to ¼ of signal wavelength (l) in the medium filling the fracture. EM theory also predicts that electrically conductive (lossy) media yield complex reflection and transmission coefficients that result in signal phase shift (Straton, 1941). The Fresnel equations describe the dependence of the complex reflection coefficient to layer thickness, electrical conductivity, permittivity, signal frequency, angle of incidence and wavefield polarization. Our work including field experiments, analytical solutions of the Fresnel equations and FDTD numerical simulations has shown that at a fractured geologic setting a saline tracer will cause a characteristic and predictable change to the reflected GPR signal amplitude and phase.
Kansas Interdisciplinary Carbonates Consortium Prospectus – July 2017
176
This new understanding of GPR response to fracture properties allows us to remotely measure fracture aperture, predict fluid content and measure tracer concentration.
The ongoing investigation is developing GPR methods for remote, quantitative characterization of fracture flow and transport properties (e.g. Becker and Tsoflias, 2010). The proposed work will further advance the GPR theoretical, modeling and reservoir analogue field work to study fracture flow of multiple phase fluids analogous to hydrocarbon reservoirs. Field investigations will monitor flow through discrete fractures of water, water-air, vegetable emulsions of varying viscosity to simulate oil, and fluids of varying salinity to quantify fracture transport properties and monitor flow through formation matrix. Field GPR experiments will also monitor the efficiency of reservoir analogue simulated enhanced oil recovery methods, such as gelled polymers developed by KICC’s TORP to control flow through fractures in oil reservoirs. Furthermore, the GPR methods will be applicable to radar observations that could be made in boreholes, allowing fracture imaging of a region extending 10 to 30 m away from the borehole and down to borehole depths of actual hydrocarbon reservoirs. Such methods could prove useful to the development of new electromagnetic based downhole technologies for hydrocarbon exploration.
Deliverables The proposed work will advance GPR methods for remote, quantitative characterization of flow and transport properties of fractured hydrocarbon reservoir analogues. The new GPR methods will allow the study of flow in well understood near surface reservoir analogues by simulating multiphase flow and fluid types found in hydrocarbon reservoirs. Quantitative observations of flow and transport through fractures and matrix will be integrated with reservoir simulation studies for prediction of hydrocarbon reservoir performance.
References STRATTON, J. A., 1941, Electromagnetic theory: McGraw-Hill Book Company. BECKER, M. AND TSOFLIAS, G.P., 2010, Comparing Flux-Averaged and Resident
Concentration in a Fractured Bedrock Using GPR, Water Resour. Res., 46, W09518, doi:10.1029/2009WR008260.
TSOFLIAS, G.P., HALIHAN, T., AND SHARP JR., J.M., 2001, Monitoring pumping test response in a fractured aquifer using ground penetrating radar: Water Resources Research, v. 37, p. 1221–1229.
TSOFLIAS, G.P., 2008, GPR imaging of dual-porosity rocks: insights to fluid flow: The Leading Edge, November 2008 Special Issue on Near-Surface Geophysics, v. 27, p. 1436-1445.
TSOFLIAS, G.P. AND BECKER, M., 2008, Ground penetrating radar response to fracture fluid salinity: Why lower frequencies are favorable for resolving salinity changes: Geophysics, v. 73, 5, p. J25-J30, doi:10.1190/1.2957893.
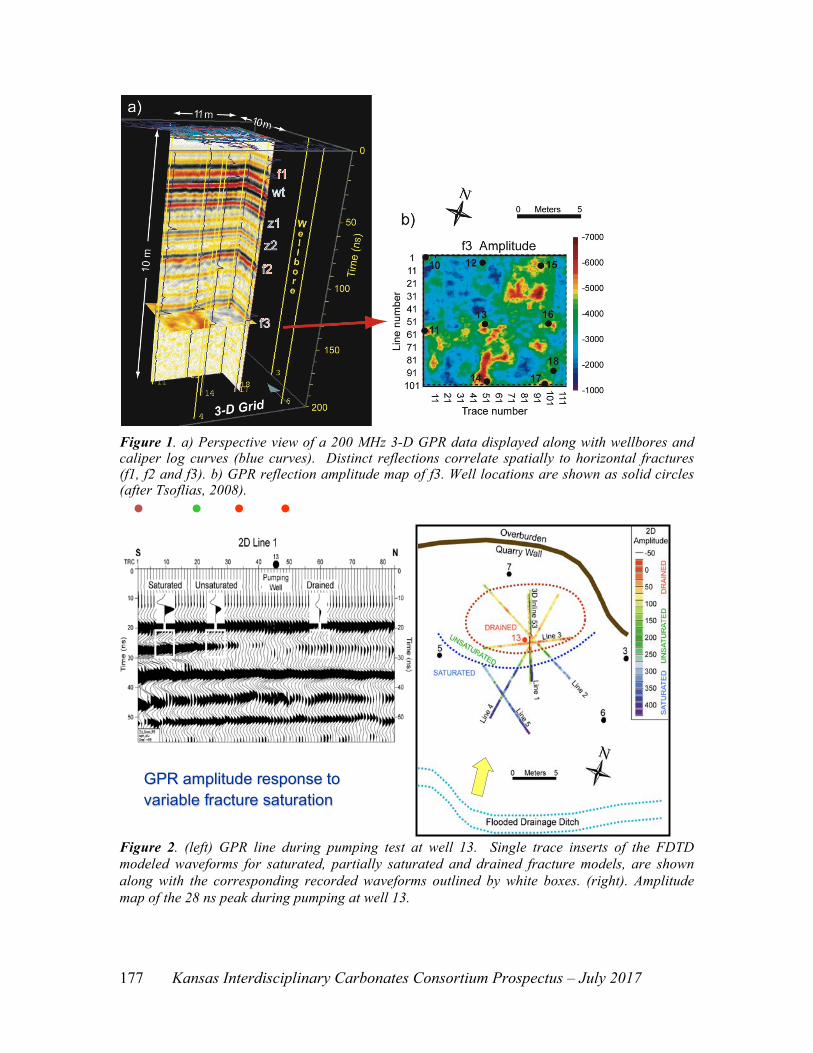
Kansas Interdisciplinary Carbonates Consortium Prospectus – July 2017 177
Figure 1. a) Perspective view of a 200 MHz 3-D GPR data displayed along with wellbores and caliper log curves (blue curves). Distinct reflections correlate spatially to horizontal fractures (f1, f2 and f3). b) GPR reflection amplitude map of f3. Well locations are shown as solid circles (after Tsoflias, 2008).
Figure 2. (left) GPR line during pumping test at well 13. Single trace inserts of the FDTD modeled waveforms for saturated, partially saturated and drained fracture models, are shown along with the corresponding recorded waveforms outlined by white boxes. (right). Amplitude map of the 28 ns peak during pumping at well 13.
GPR amplitude response to variable fracture saturation
Kansas Interdisciplinary Carbonates Consortium Prospectus – July 2017
178
3-D Imaging of Facies and Porosity in Microbial Carbonates of the Messinian of Spain Using GPR
Robert H. Goldstein, Evan K. Franseen, George Tsoflias, and Katharine Knoph
SUBSURFACE APPLICATION: Useful analog for 3-D modeling of porosity in microbialite reservoirs such as pre-salt Brazil, offshore Angola, Jurassic Smackover, Arbuckle/Ellenburger STATUS: Long-term project in progress TIMING: Significant results to be reported – Results currently available to membership FUNDING: Partial funding Purpose Understanding how facies and porosity are generated in thin topography-draping sequences can have significant impact to refining carbonate sequence stratigraphic models. This study will resolve 3-D geometries of oolite-microbialite-reef sequences and porosity by combining geologic and high-resolution GPR data from well-exposed parts of the Terminal Carbonate Complex (TCC) in SE Spain. Comprehensive 3-D models created in Petrel from the integration of GPR data with 3-D stratigraphic models will contribute to process-response models of facies and porosity within thin, topography-draping carbonate sequences.
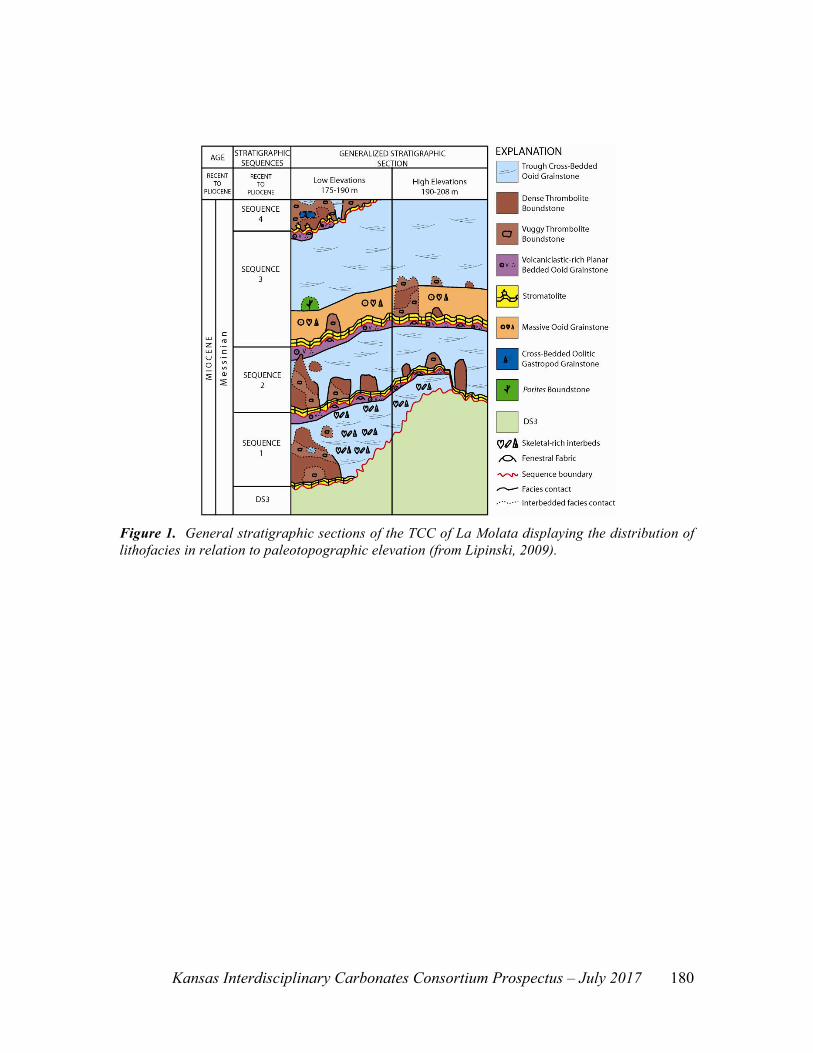
Project Description Outcrop studies complemented by geophysical imaging can explore variations in depositional and diagenetic character of carbonate systems in three dimensions. The Terminal Carbonate Complex (TCC) of the Miocene of SE Spain is one succession where paleotopography and sea-level history are well documented (Franseen et al., 1998). Exposures contain four carbonate sequences that drape preserved paleotopography, deposited in association with high-amplitude, high-frequency glacioeustatic change (Figure 1) (Lipinski, 2009). The surface onto which the TCC was deposited at La Molata has been documented to lie at an intermediate elevation between regional sea-level highstand and lowstand positions (Lipinski, 2009). Evaluation of stratal geometry, facies, and porosity distribution within this 3-D framework facilitates understanding the response of these systems to sea-level change. Additionally, the stratigraphic patterns of the oolite-microbialite-reef sequences of the TCC are of great interest because many highly productive reservoirs are composed of microbialites and oolites deposited in similar settings (Franseen et al., 2007).
GPR imaging has been used for determining facies architecture and porosity distribution in carbonate systems (Grasmueck and Weger, 2002; Franseen et al., 2007; Neal et al., 2008; Tsoflias, 2008). GPR data coupled with 3-D stratigraphic modeling, has potential to enhance understanding of patterns of sedimentation and porosity as they relate to changes in sea level and paleotopography. A preliminary survey in the area (Figure 2) showed that GPR reflections correspond to geometries associated with sedimentologic and stratigraphic features that can be calibrated to well-documented outcrops. It is expected that areas and patterns of elevated porosity will be discernable from the GPR
Kansas Interdisciplinary Carbonates Consortium Prospectus – July 2017 179
data based on associated dielectric constant contrasts creating reflective interfaces and changes in radar wave velocity of propagation. To determine the 3-D facies architecture, high-resolution GPR data will be integrated with detailed stratigraphic data to create 3-D models that portray the distribution of stratigraphic variability within the TCC. Densely-spaced 3-D grids of GPR data will be acquired at locations of differing paleotopographies. The integration of 3-D GPR and outcrop data has potential to illustrate facies and porosity of thrombolite and oolite facies in the context of their paleotopography and sea-level history. Relating distribution of these attributes to paleotopography can refine process-response models for the timing and paleotopographic controls on thrombolite and oolite deposition and diagenesis.
Deliverables This study will enhance process-response models of facies and porosity of thin topography-draping sequences, as well as provide insights for the controls on thrombolitic and oolitic deposits. Furthermore, the 3-D models of facies geometries and distributions and their response to changes in sea level and paleotopography will provide conceptual and quantitative models that could be applied to improve exploration and exploitation in analogous carbonate reservoirs. References FRANSEEN, E.K., GOLDSTEIN, R.H. AND FARR, M. R., 1998, Quantitative controls on
location and architecture of carbonate depositional sequences: Upper Miocene, Cabo de Gata, SE Spain: Journal of Sedimentary Research, v. 68, p. 283-298.
FRANSEEN, E.K., BYRNES, A., XIA, J. AND MILLER, R., 2007, Improving resolution and understanding controls of GPR response in carbonate strata: Implications for attribute analysis: The Leading Edge, p. 984-993.
GRASMUECK, M. AND WEGER, R., 2002, 3D GPR Reveals complex internal structure of Pleistocene oolitic sandbar: The Leading Edge, v. 21, p. 634-639.
LIPINSKI, C.J., 2009, Stratigraphy of Upper Miocene oolite-microbialite-coralgal reef sequences of the Terminal Carbonate Complex: southeast Spain: [unpublished M.S. thesis] University of Kansas, 116 p.
NEAL, A. GRASMUECK, M., MCNEILL, D.F., VIGGIANO, D.A., AND EBERLI, G.P., 2007, Full-resolution 3D radar stratigraphy of complex oolitic sedimentary architecture: Miami Limestone, Florida, U.S.A.: Journal of Sedimentary Research, v. 78, p.638-653.
TSOFLIAS, G.P., 2008, GPR Imaging of dual-porosity rocks: insights to fluid flow: The Leading Edge, v. 27, p. 1436-1445.
Kansas Interdisciplinary Carbonates Consortium Prospectus – July 2017
180
Figure 1. General stratigraphic sections of the TCC of La Molata displaying the distribution of lithofacies in relation to paleotopographic elevation (from Lipinski, 2009).
Kansas Interdisciplinary Carbonates Consortium Prospectus – July 2017 181
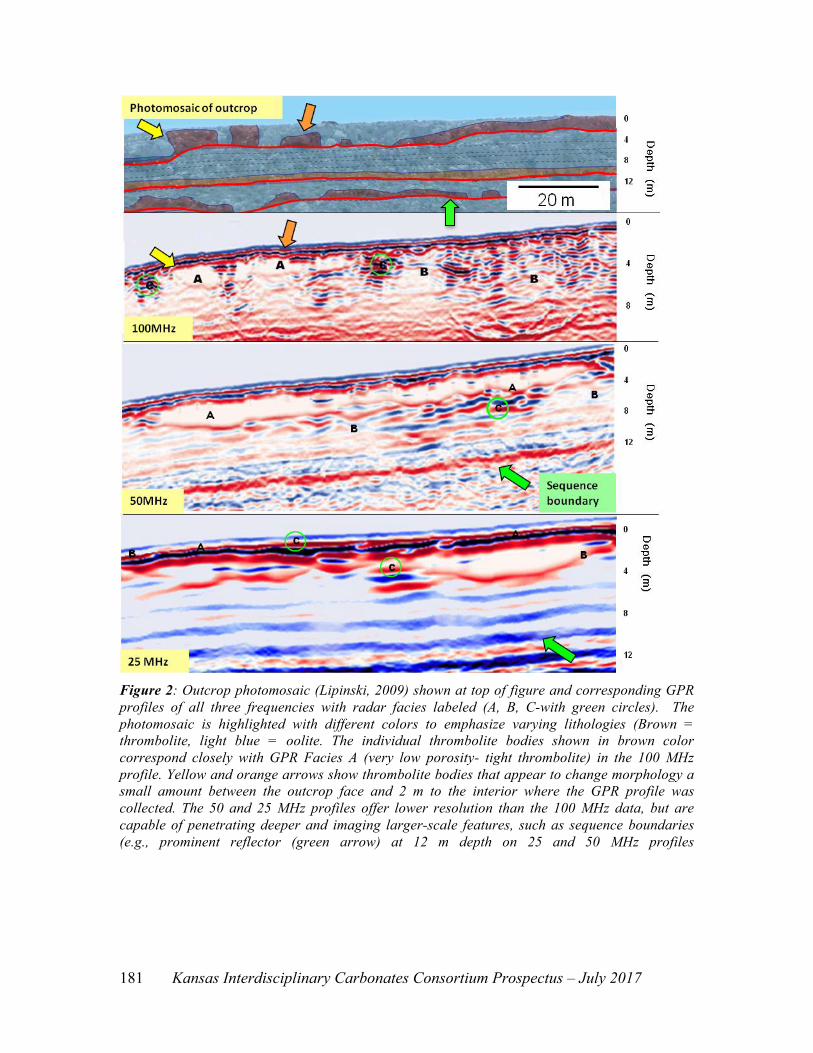
Figure 2: Outcrop photomosaic (Lipinski, 2009) shown at top of figure and corresponding GPR profiles of all three frequencies with radar facies labeled (A, B, C-with green circles). The photomosaic is highlighted with different colors to emphasize varying lithologies (Brown = thrombolite, light blue = oolite. The individual thrombolite bodies shown in brown color correspond closely with GPR Facies A (very low porosity- tight thrombolite) in the 100 MHz profile. Yellow and orange arrows show thrombolite bodies that appear to change morphology a small amount between the outcrop face and 2 m to the interior where the GPR profile was collected. The 50 and 25 MHz profiles offer lower resolution than the 100 MHz data, but are capable of penetrating deeper and imaging larger-scale features, such as sequence boundaries (e.g., prominent reflector (green arrow) at 12 m depth on 25 and 50 MHz profiles