Embed Size (px)
Citation preview
Geoscientific Characterization of Shaft Investigation Boreholes DGR-7 and DGR-8 February 2012 Prepared by: Geofirma Engineering Ltd. NWMO DGR-TR-2012-01

Geoscientific Characterization of Shaft Investigation Boreholes DGR-7 and DGR-8 February 2012 Prepared by: Geofirma Engineering Ltd. NWMO DGR-TR-2012-01

DGR-7 and DGR-8 Investigations - ii - February 2012
THIS PAGE HAS BEEN LEFT BLANK INTENTIONALLY
DGR-7 and DGR-8 Investigations - iii - February 2012
Document History
Title: Geoscientific Characterization of Shaft Investigation Boreholes DGR-7 and DGR-8
Report Number: NWMO DGR-TR-2012-01
Revision: R000 Date: February 2012
Geofirma Engineering Ltd.
Prepared by: K. Raven, D. Heagle, S. Sterling, M. Melaney, G. Briscoe
Reviewed by: J. Avis
Approved by: J. Avis
Nuclear Waste Management Organization
Reviewed by: Mark Jensen, Dylan Luhowy and Jim McLay
Accepted by: Derek Wilson

DGR-7 and DGR-8 Investigations - iv - February 2012
THIS PAGE HAS BEEN LEFT BLANK INTENTIONALLY
DGR-7 and DGR-8 Investigations - v - February 2012
EXECUTIVE SUMMARY
Ontario Power Generation (OPG) is proposing the development of a Deep Geologic Repository (DGR) at the Bruce nuclear site, situated in the Municipality of Kincardine, Ontario, for the long-term management of Low and Intermediate Level Radioactive Waste (L&ILW) generated at OPG owned or operated nuclear facilities. The proposed DGR will be constructed as an engineered facility comprising a series of underground emplacement rooms at a depth of about 680 m below ground surface within the Paleozoic argillaceous limestone of the Cobourg Formation.
This Project Report summarizes the results of the geoscientific characterization work completed as part of NWMO’s shaft investigation drilling program in the period April to October 2011. This work was completed as part of NWMO design and construction activity and was intended to provide data for shaft design and to test and confirm geoscientific information described in the Descriptive Geosphere Site Model (DGSM) Report released in April 2011. The DGSM for the Bruce nuclear site includes descriptive geological, hydrogeological and geomechanical site models based primarily on detailed drilling and testing of boreholes in the period August 2006 to June 2010.
As part of the geoscientific investigations, Geofirma Engineering Ltd. completed drilling and testing of two boreholes: DGR-7 near the proposed vent shaft location to a depth of 189.97 metres below ground surface (mBGS) and DGR-8 at the proposed main shaft location to a depth of 723.81 mBGS. This document provides a summary compilation, description, assessment and interpretation of geoscientific data collected as part of investigations which are described in a set of five supporting Technical Reports. All Technical Reports were completed in accordance with approved Test Plans. Technical Reports, Test Plans and Project Reports were prepared following the requirements of the Geofirma DGR Project Quality Plan (Geofirma Engineering Ltd. 2011a), which meets the requirements of NWMO’s DGR Project Quality Plan (NWMO 2009).
The scope of the DGR-7 and DGR-8 investigations included continuous PQ3 diamond coring to target depths, management and testing of drilling fluids during drilling, detailed photography and stratigraphic and structural logging of all recovered core, borehole geophysical logging of DGR-7 and DGR-8, continuous straddle-packer hydraulic testing of DGR-7, and collection and preservation of core samples for geomechanical and other laboratory testing. Monitoring of borehole orientation was undertaken throughout the drilling program to ensure borehole deviations were within NWMO drilling specifications.
The results of the geological investigations of DGR-7 and DGR-8 show that the bedrock stratigraphic and structural conditions present in DGR-7 and DGR-8 are consistent and comparable with those reported in the DGSM. Bedrock formation depths and thicknesses in DGR-7 and DGR-8 were typically found to be within 1-2 m of predicted occurrences outlined in the drilling prognoses prepared in advance of drilling as part of the drilling license application. Below the Salina B Unit, the differences in actual and predicted depths of formations were typically less than 1.3 m confirming the excellent predictability of the depth and thickness of these formations at the Bruce nuclear site as previously discussed in the DGSM. The logged stratigraphy of formations in DGR-7 and DGR-8 were identical to those reported in the DGSM and consistent with those of Carter and Armstrong (2006, 2010).
The remarkable uniformity in the depths, thicknesses and orientation of formations in DGR-7 and DGR-8, as evident from the similarity of predicted and actual formation occurrences suggests the absence of inclined faults in the vicinity of DGR-7 and DGR-8. Such inclined faults, if present near DGR-7 and DGR-8, would result in discernable offsets in formation contacts in boreholes DGR-7 and DGR-8 from predictions based on assumptions of simple formation planarity in surrounding boreholes DGR1/2, DGR-3 and DGR-4. Consequently, the inferred possible fault
DGR-7 and DGR-8 Investigations - vi - February 2012
identified from 2-D seismic reflection surveys near seismic lines 1 and 5 in the Ordovician rocks proximate to DGR-8 is unlikely to exist.
Core logging of DGR-7 and DGR-8 also shows similar occurrence of marker beds, evidence of hydrocarbon presence and fracture infilling, vein and other secondary mineralogy to those described in the DGSM. The characteristics of the Devonian-Silurian and Silurian-Ordovician unconformities in DGR-7 and DGR-8 are identical to those evident in the DGSM.
Core logging and borehole acoustic televiewer of DGR-7 and DGR-8 show the presence of both horizontal and inclined fractures in all bedrock formations as described in the DGSM, Halite-infilled horizontal and inclined fractures were logged primarily within the Ordovician shales in accordance with information presented in the DGSM. Updated assessment of orientation of inclined fractures intersecting DGR-7 and DGR-8 was made based on analysis of borehole acoustic televiewer logs. Orientation of inclined fractures in the Devonian formations of DGR-7 and DGR-8 are only weakly comparable to those mapped in nearby Inverhuron Park and southern Bruce peninsula, possibly due to the small borehole sample size. Orientations of inclined fractures of the Silurian and Ordovician formations in DGR-7 and DGR-8 are comparable to the results presented in the DGSM and results of local and regional mapping of fractures in outcrops.
Based on improved core recovery and overall core quality for the dolostones of the Lucas Formation to the Salina G Unit, new representative estimates of RQD and natural fracture frequency are evident based on DGR-7 and DGR-8 investigations. Separate representative estimates of RQD and natural fracture frequency for the Lucas and Amherstburg formations, and higher representative estimates of RQD for all of these formations or units are proposed. Revised lower natural fracture frequencies for the Lucas to Bois Blanc formations are indicated from the DGR-7 and DGR-8 investigations. Natural fracture frequencies for the Bass Islands Formation and Salina G Unit are higher than those given in the DGSM, based on the much improved core recoveries for these formations in DGR-7 and DGR-8, and hence more reliable quantification.
The results of the hydrogeological investigations of DGR-7 and DGR-8 have provided additional definition of the estimates of horizontal hydraulic conductivity (Kh) for the Devonian and upper Silurian dolostones. The new data allows for representative estimates of Kh for the Lucas and Amherstburg Formations and revised estimates for the Bass Islands Formation and the Salina G Unit based on detailed straddle-packer testing completed in DGR-7 and drilling fluid loss measurements in DGR-7 and DGR-8. The representative Kh value for the Bois Blanc Formation listed in the DGSM does not change based on DGR-7 testing. Drilling fluid loss measurements in DGR-8 below the Salina G Unit confirm the representativeness of the formation Kh values reported in the DGSM. Sampling and testing of DGR-8 drilling fluids shows that tritium and environmental isotopes (oxygen-18 and deuterium) signatures of the drilling fluid can be readily distinguished from those of formation fluids.
The geoscientific data from DGR-7 and DGR-8 investigations continue to support the descriptive geological and hydrogeological models for the Bruce nuclear site as consisting of bedrock formations with laterally extensive and uniform and predictable lithological, structural and hydrogeological properties. The DGR-7 and DGR-8 data continue to show that the Ordovician limestone and shale formations that will host, overlie and underlie the proposed DGR are of uniform and excellent rock quality and of inferred very low hydraulic conductivity.
DGR-7 and DGR-8 Investigations - vii - February 2012
Assessment of the hypothesised favourable geoscientific site attributes and/or characteristics of the Bruce nuclear site that are useful for demonstration of geoscientific site suitability for implementation of the DGR concept (NWMO 2011) was made based on review of geoscientific data obtained from drilling, testing and logging of DGR-7 and DGR-8. With the exception of seismic stability, which was not assessed in this Project Report, the available data from DGR-7 and DGR-8 confirm the hypotheses of favourable geoscientific site attributes of site predictability, multiple natural barriers, diffusion-dominated contaminant transport, geomechanical stability, low natural resource potential and isolated/protected shallow groundwater resources for the Bruce nuclear site.
DGR-7 and DGR-8 Investigations - viii - February 2012
ACKNOWLEDGEMENTS
This document, while authored by Geofirma Engineering Ltd. and remaining the responsibility of Geofirma, is based on major contributions provided by members of the NWMO and Geofirma Shaft Investigation Drilling Project Team. The authors would like to thank Derek Wilson (NWMO) for his important work in managing and directing the DGR-7 and DGR-8 drilling investigation program and Mark Jensen (NWMO) for his ongoing guidance and oversight in DGR geoscientific site characterization activities. Dylan Luhowy (NWMO) and Jim McLay (NWMO) are thanked for day-to-day project management and general logistical support at the Bruce nuclear site during the drilling investigations.
We are also grateful to the senior contributing authors of the supporting technical reports including Glen Briscoe (Geofirma Engineering Ltd.), Dru Heagle (Geofirma Engineering Ltd.), Randall Roberts (HydroResolutions LLP), Reid Smith (Geofirma Engineering Ltd.) and Sean Sterling (Geofirma Engineering Ltd.). These supporting technical reports are the foundation for this report.
The quality of this report has benefitted from careful reviews of earlier draft versions provided by NMWO staff including Mark Jensen, Dylan Luhowy and Jim McLay.

DGR-7 and DGR-8 Investigations - ix - February 2012
THIS PAGE HAS BEEN LEFT BLANK INTENTIONALLY
DGR-7 and DGR-8 Investigations - x - February 2012
TABLE OF CONTENTS
EXECUTIVE SUMMARY .............................................................................................................. V
ACKNOWLEDGEMENTS.......................................................................................................... VIII
1. INTRODUCTION ............................................................................................................... 1
1.1 REPORT ORGANIZATION ................................................................................... 1
1.2 DGR CONCEPT .................................................................................................... 2
1.3 PREVIOUS DGR DRILLING PROGRAMS ........................................................... 2
1.4 DESCRIPTIVE GEOSPHERE SITE MODEL ........................................................ 6
1.4.1 Descriptive Geological Site Model .................................................................... 6
1.4.2 Descriptive Hydrogeological Site Model ............................................................ 6
1.4.3 Descriptive Geomechanical Site Model ............................................................ 7
1.5 TECHNICAL REPORTS ........................................................................................ 8
1.6 PROJECT QUALITY PLAN .................................................................................. 8
2. DGR-7 AND DGR-8 DRILLING, LOGGING AND TESTING PROGRAMS .................... 10
2.1 DRILLING, CASING INSTALLATION, AND CORING ....................................... 10
2.1.1 Drilling Methods .............................................................................................. 11
2.1.1.1 Continuous PQ-3 Coring ........................................................................ 11
2.1.1.2 Borehole Orientation Correction Drilling ................................................ 11
2.1.1.3 Borehole Reaming ................................................................................. 13
2.2 BOREHOLE AND CASING SIZES ..................................................................... 13
2.3 DRILLING FLUID MANAGEMENT AND TESTING ............................................ 14
2.4 CORE PROCESSING, PHOTOGRAPHY AND LOGGING ................................. 15
2.4.1 Core Processing .............................................................................................. 15
2.4.2 Core Photography ........................................................................................... 15
2.4.3 Core Logging ................................................................................................... 16
2.4.3.1 Stratigraphic and Sedimentological Logging .......................................... 16
2.4.3.2 Structural Discontinuity Logging ............................................................ 17
2.5 CORE SAMPLING AND PRESERVATION FOR LABORATORY TESTING ..... 18
2.6 BOREHOLE ORIENTATION MONITORING AND CORRECTIONS .................. 20
DGR-7 and DGR-8 Investigations - xi - February 2012
2.7 BOREHOLE GEOPHYSICAL LOGGING ........................................................... 23
2.8 BOREHOLE HYDRAULIC TESTING .................................................................. 24
2.9 BOREHOLE SEALING........................................................................................ 26
3. GEOLOGICAL CHARACTERIZATION .......................................................................... 27
3.1 REGIONAL PALEOZOIC STRATIGRAPHY ....................................................... 27
3.2 FORMATION DEPTHS AND THICKNESSES .................................................... 29
3.3 FORMATION DEPTH PREDICTABILITY IN DGR-7 AND DGR-8 ..................... 32
3.4 FORMATION STRATIGRAPHIC DESCRIPTIONS ............................................. 33
3.4.1 Quaternary Deposits ....................................................................................... 34
3.4.2 Middle and Lower Devonian Formations ......................................................... 34
3.4.2.1 Lucas Formation Dolostone ................................................................... 34
3.4.2.2 Amherstburg Formation Dolostone ........................................................ 35
3.4.2.3 Bois Blanc Formation Cherty Dolostone ................................................ 36
3.4.3 Upper Silurian Formations .............................................................................. 37
3.4.3.1 Bass Islands Formation Dolostone ........................................................ 37
3.4.3.2 Salina Formation, G Unit Argillaceous Dolostone .................................. 38
3.4.3.3 Salina Formation, F Unit Dolomitic Shale .............................................. 39
3.4.3.4 Salina Formation, E Unit Brecciated Dolostone and Dolomitic Shale .... 40
3.4.3.5 Salina Formation, D Unit Anhydritic Dolostone and C Unit Dolomitic Shale and Shale ..................................................................................... 41
3.4.3.6 Salina Formation, B Unit Argillaceous Dolostone and Evaporite ........... 41
3.4.3.7 Salina Formation, A2 Unit Dolostone and Anhydritic Dolostone ............ 42
3.4.3.8 Salina Formation, A1 Unit Argillaceous Dolostone and Anhydritic Dolostone, A0 Unit Bituminous Dolostone ............................................. 43
3.4.4 Middle and Lower Silurian Formations ............................................................ 44
3.4.4.1 Guelph, Goat Island, Gasport, Lions Head and Fossil Hill Formation Dolostones ............................................................................................. 44
3.4.4.2 Cabot Head Formation Shale ................................................................ 46
3.4.4.3 Manitoulin Formation Cherty Dolostone and Minor Shale ..................... 47
3.4.4.4 Queenston Formation Red Shale .......................................................... 47
DGR-7 and DGR-8 Investigations - xii - February 2012
3.4.4.5 Georgian Bay Formation Grey Shale ..................................................... 49
3.4.4.6 Blue Mountain Formation Dark Grey Shale ........................................... 49
3.4.5 Middle Ordovician Formations ........................................................................ 50
3.4.5.1 Cobourg Formation Black Shale and Argillaceous Limestone ............... 51
3.4.5.2 Sherman Fall Formation Argillaceous Limestone .................................. 52
3.4.5.3 Kirkfield Formation Argillaceous Limestone ........................................... 53
3.5 CORE RECOVERY, ROCK QUALITY AND NATURAL FRACTURE FREQUENCY ...................................................................................................... 54
3.6 MARKER BEDS .................................................................................................. 62
3.7 HYDROCARBON OCCURRENCES ................................................................... 65
3.8 FRACTURE INFILL, VEINS AND OTHER SECONDARY MINERALOGY ........ 68
3.9 MAJOR STRUCTURAL AND STRATIGRAPHIC DISCONTINUITIES ............... 71
3.9.1 Devonian-Silurian Unconformity ...................................................................... 71
3.9.2 Silurian-Ordovician Unconformity .................................................................... 72
3.10 INCLINED FAULTS ............................................................................................. 72
3.11 MINOR STRUCTURAL DISCONTINUITIES ....................................................... 72
3.11.1 Mapping of Inclined Fractures ......................................................................... 73
3.11.2 Fracture Orientation in Devonian Formations ................................................. 74
3.11.3 Fracture Orientation in Silurian Formations..................................................... 76
3.11.4 Fracture Orientations in Ordovician Formations.............................................. 78
3.12 BOREHOLE QUALITY ........................................................................................ 79
4. HYDROGEOLOGICAL CHARACTERIZATION ............................................................. 80
4.1 STRADDLE-PACKER HYDRAULIC TESTING IN DGR-7 ................................. 80
4.1.1 Hydraulic Conductivity ..................................................................................... 80
4.1.2 Formation Pressure and Hydraulic Head ........................................................ 85
4.2 DRILLING FLUID LOSSES ................................................................................. 88
4.3 DRILL FLUID TRACING ..................................................................................... 90
4.3.1 Tritium ............................................................................................................. 90
4.3.2 Oxygen-18 and Deuterium .............................................................................. 92
DGR-7 and DGR-8 Investigations - xiii - February 2012
5. SUMMARY OF RESULTS AND CONCLUSIONS .......................................................... 94
5.1 DESCRIPTIVE GEOLOGICAL SITE MODEL ..................................................... 94
5.2 DESCRIPTIVE HYDROGEOLOGICAL SITE MODEL ........................................ 96
5.3 ASSESSMENT OF FAVOURABLE GEOSCIENTIFIC SITE ATTRIBUTES ...... 98
6. ABBREVIATIONS AND ACRONYMS .......................................................................... 100
7. REFERENCES .............................................................................................................. 102
DGR-7 and DGR-8 Investigations - xiv - February 2012
LIST OF FIGURES
Figure 1.1: Conceptual Layout of the Proposed DGR below the Bruce Nuclear Site .................. 3
Figure 1.2: Proposed DGR Layout and Borehole Locations at the Bruce Nuclear Site ............... 4
Figure 1.3: Reference Stratigraphic Column at the Bruce Nuclear Site Based on DGR-1 and DGR-2 Data ............................................................................................................... 5
Figure 2.1: Dashboard Drilling Parameter Logging System Data for Drilling of the Cobourg and Sherman Falls Formations, 678.81 to 699.81 mBGS in DGR-8 ............................... 12
Figure 2.2: Final Position of Borehole DGR-7 from Borehole Orientation Surveys. Left – Plan Bull’s Eye Deviation Plot, Right – Sectional Deviation Plot ...................................... 21
Figure 2.3: Final Position of Borehole DGR-8 from Borehole Orientation Surveys. Left – Plan Bull’s Eye Deviation Plot, Right – Sectional Deviation Plot ...................................... 22
Figure 3.1: Bedrock Geology of Southern Ontario (after Ontario Geological Survey 1991) showing Bruce Nuclear Site and Boundary of Regional Geological Framework Study Area ............................................................................................................... 28
Figure 3.2: Core of Brown Gravelly Silt Till in DGR-7 at 11.2 to 11.8 mBGS ............................. 34
Figure 3.3: Lucas Formation Dolostone at 26.4 - 26.9 mBGS in DGR-7 Showing Bituminous Stromatolitic Laminae ............................................................................................... 35
Figure 3.4: Amherstburg Formation Dolostone at 79.6 – 80.1 mBGS in DGR-7 Showing Chert Nodules and Rugose Coral ...................................................................................... 36
Figure 3.5: Upper Contact of Bois Blanc Formation Dolostone in DGR-8 at 85.5 mBGS Characterized by Occurrence of Black Bituminous Laminae (at End of Arrow) ....... 37
Figure 3.6: Thin Rubble Zone in Bass Islands Formation Dolostone at 166.3 – 166.7 mBGS in DGR-8 ...................................................................................................................... 38
Figure 3.7: Vertical and horizontal natural fracturing in Salina G Unit Dolostone at 185.3 – 185.8 mBGS in DGR-8 ............................................................................................. 39
Figure 3.8: Brecciated Salina Formation F Unit Shale at 199.7 – 199.9 mBGS in DGR-8 Showing Orange and White Gypsum and Anhydrite Fracture Infilling ..................... 40
Figure 3.9: Grey Brecciated Dolostone with Anhydrite of the Salina Formation E Unit at 243.8 mBGS in DGR-8 ....................................................................................................... 41
Figure 3.10: Brecciated Green/Green Dolomitic Shale and Argillaceous Dolostone of the Salina B Unit Carbonate at 287.3 – 287.8 mBGS in DGR-8 .................................... 42
Figure 3.11: Tan-Grey Argillaceous Dolostone with Bituminous Laminations of the Salina A2 Unit Carbonate at 323.3 – 323.8 mBGS in DGR-8 .................................................. 43
Figure 3.12: Porous Tan-Grey Dolostone of the Salina Upper A1 Unit at 331.3 - 331.7 mBGS in DGR-8. ................................................................................................................. 44
DGR-7 and DGR-8 Investigations - xv - February 2012
Figure 3.13: Vuggy Porosity of Guelph Formation Dolostone at 382.8 mBGS in DGR-8 .......... 45
Figure 3.14: Contact Between Grey Fossiliferous, Styolitic Dolostone of the Fossil Hill Formation and the Grey-Green Shale of the Cabot Head Formation at 417.2 mBGS in DGR-8 ....................................................................................................... 46
Figure 3.15: Contact Between Cherty Fossiliferous Grey-Green Argillaceous Dolostone of the Manitoulin Formation and the Green Shale of the Queenston Formation at 451.6 mBGS in DGR-8. ...................................................................................................... 48
Figure 3.16: Light Grey Fossiliferous Limestone Layers at 506.0 mBGS in Middle Part of Queenston Shale in DGR-8 ..................................................................................... 48
Figure 3.17: Massive Dark Grey-Green Shale of the Lower Georgian Bay Formation at 601.8 – 602.3 mBGS in DGR-8. ............................................................................................ 49
Figure 3.18: Contact Between Fossiliferous Grey-Brown Georgian Bay Shale and the Dark Grey Blue Mountain Shale at 613.7 mBGS in DGR-8 .............................................. 50
Figure 3.19: Irregular 0.5-1 cm thick Phosphatic Lag Defining the Top of the Collingwood Member in DGR-8 at depth of 657.9 mBGS ............................................................ 51
Figure 3.20: Light Grey Fossiliferous Argillaceous Limestone of the Lower Member of the Cobourg Formation at 679. 9 – 680.4 mBGS in DGR-8 ........................................... 52
Figure 3.21: Grey Fossiliferous Argillaceous Limestone with Grey Shale Interbeds of the Lower Sherman Fall Formation at 716.9 – 717.4 mBGS in DGR-8 .................................... 53
Figure 3.22: Grey Argillaceous Fossiliferous Limestone with Grey Shale Interbeds of the Kirkfield Formation at 723.2 – 723.7 mBGS in DGR-8 ............................................. 54
Figure 3.23: Depth Profile of Core Recovery, RQD and Natural Fracture Frequency in DGR-7 ...................................................................................................................... 56
Figure 3.24: Depth Profile of Core Recovery, RQD and Natural Fracture Frequency in DGR-8 ...................................................................................................................... 57
Figure 3.25: Comparative Depth Profiles of RQD in Borehole DGR-1 to DGR-8 Core .............. 58
Figure 3.26: Comparative Depth Profiles of Natural Fracture Frequency in Borehole DGR-1 to DGR-8 Core ............................................................................................................. 59
Figure 3.27: Top of Grey Limestone Marker Bed within the Queenston Formation Shale in DGR Boreholes ........................................................................................................ 63
Figure 3.28: Top of Grey Fossiliferous Limestone Marker Bed within the Georgian Bay Formation Shale in DGR Boreholes ......................................................................... 64
Figure 3.29: Tan Dolostone Marker Bed in Salina F Unit Shale in DGR Boreholes .................. 65
Figure 3.30: Oil within Open Anhydrite-Lined Vug in Argillaceous Dolostone of Salina A1 Unit at 348.7 mBGS in DGR-8 ......................................................................................... 67
Figure 3.31: Oil Seeping from Pores and Styolites in a Fossiliferous Limestone Bed of Collingwood Member of Cobourg Formation at 660.9 – 661.0 mBGS in DGR-8 ..... 67
DGR-7 and DGR-8 Investigations - xvi - February 2012
Figure 3.32: Halite Infilled Fracture at 461.7 mBGS in Upper Part of the Queenston Shale in DGR-8 ...................................................................................................................... 69
Figure 3.33: Halite Infilling on Inclined Fracture in the Middle of the Georgian Bay Shale at 566.0 mBGS in DGR-8 ............................................................................................. 70
Figure 3.34: Halite Infilling on Inclined Fracture in Middle of the Blue Mountain Shale at 642.1 m BGS in DGR-8 ............................................................................................ 70
Figure 3.35: Devonian-Silurian Unconformity (left side of Core Photo) at the depth of 135.6 MBGS in DGR-8 ....................................................................................................... 71
Figure 3.36: Inclined Halite-Infilled Fracture at 563.4 – 563.9 mBGS in the Georgian Bay Formation Shale in DGR-8 ....................................................................................... 73
Figure 3.37: Contoured Equal-Area Polar Plot of all Fractures in Devonian Formations (and Bass Islands Formation) from ATV Logging in DGR-7 and DGR-8 ......................... 75
Figure 3.38: Contoured Equal-Area Polar Plot of Inclined Fractures in Devonian Formations (and Bass Islands Formation) from ATV Logging in DGR-7 and DGR-8 ................. 76
Figure 3.39: Contoured Equal-Area Polar Plot of all Fractures in Silurian Formations (excluding Bass Islands Formation) from ATV Logging in all DGR Boreholes ......... 77
Figure 3.40: Contoured Equal-Area Polar Plot of Inclined Fractures in Silurian Formations (excluding Bass Islands Formation) from ATV Logging in all DGR Boreholes ......... 77
Figure 3.41: Contoured Equal-Area Polar Plot of all Fractures in Ordovician Formations from ATV Logging in all DGR Boreholes .......................................................................... 78
Figure 3.42: Contoured Equal-Area Polar Plot of Inclined Fractures in Ordovician Formations from ATV Logging in all DGR Boreholes .................................................................. 79
Figure 4.1: Hydraulic Test Results for Test Interval 99.92 – 102.87 mBGS in the Bois Blanc Formation in DGR-7 ................................................................................................. 81
Figure 4.2: Hydraulic Test Results for Test Interval 178.22 – 181.17 mBGS in the Bass Islands Formation and the Salina G Unit .............................................................................. 81
Figure 4.3: Depth Profile of Estimated Test Interval Horizontal Hydraulic Conductivity Determined from Straddle-Packer Hydraulic Testing in DGR-7 ............................... 84
Figure 4.4: Depth Profile of Estimated Test Interval Freshwater Head and Measured Formation Pressure Determined from Straddle-Packer Hydraulic Testing in DGR-7 ................ 87
Figure 4.5: Drilling Fluid Losses in DGR-7 ................................................................................. 88
Figure 4.6: Drilling Fluid Losses in DGR-8 ................................................................................. 89
Figure 4.7: Tritium Content in DGR Borehole Drilling Fluids Accessing Silurian Aquifers ......... 91
Figure 4.8: Oxygen-18 and Deuterium Content of DGR Drilling Fluids Accessing the Silurian Aquifers and the Groundwater in the Silurian Aquifers ............................................ 92
DGR-7 and DGR-8 Investigations - xvii - February 2012
LIST OF TABLES
Table 1.1: Summary of DGR-7 and DGR-8 Technical Reports on Geoscientific Characterization ......................................................................................................... 8
Table 2.1: Summary of Borehole and Casing Sizes for DGR-7 and DGR-8 .............................. 14
Table 2.2: Summary of Rock Quality Descriptions and Fracture Frequency ............................. 18
Table 2.3: Summary of Core Samples Collected for Laboratory Testing in DGR-8 ................... 19
Table 2.4: Summary of Borehole Geophysical Logging Completed in DGR-7 and DGR-8 ...... 24
Table 3.1: Summary of Top of Formation, Member and Unit Depths and Elevations in DGR-7 and DGR-8 ............................................................................................................... 29
Table 3.2: Summary of Thickness of Bedrock Formations, Member and Units in DGR Boreholes ................................................................................................................. 31
Table 3.3: Summary of Formation Predictions and Occurrences in DGR-7 and DGR-8 ........... 32
Table 3.4: Formation Summary of Minimum, Maximum, and Arithmetic Mean Core Recovery, RQD and Natural Fracture Frequency in DGR-7 ..................................................... 54
Table 3.5: Formation Summary of Minimum, Maximum, Arithmetic Mean Core Recovery, RQD and Natural Fracture Frequency in DGR-8 .............................................................. 55
Table 3.6: Summary of Arithmetic Mean RQD in Cored DGR Boreholes in Percent ................. 60
Table 3.7: Summary of Arithmetic Mean Natural Fracture Frequency in Cored DGR Boreholes in Fractures/m .......................................................................................................... 61
Table 3.8: Stratigraphic Marker Beds in Boreholes DGR-1 through DGR-8 .............................. 62
Table 3.9: Summary of Observations of Hydrocarbon Occurrences in DGR-7 and DGR-8 Core ......................................................................................................................... 66
Table 3.10: Summary of Occurrences of Fracture Infill, Vein and Secondary Mineralogy in DGR-7 and DGR-8 from Core Logging .................................................................... 68
Table 3.11 Summary of the Number of Inclined Fractures Identified in DGR Boreholes ........... 74
Table 4.1: Summary of Best Estimates of Horizontal Hydraulic Conductivity from Straddle-Packer Testing of DGR-7 ......................................................................................... 82
Table 4.2: Comparison of Horizontal Hydraulic Conductivities in Lucas, Amherstburg, Bois Blanc, Bass Islands and Salina G Unit Formations from DGR-7 Testing and Data Reported in the DGSM ............................................................................................. 85
Table 4.3: Estimated Fluid Density, Formation Pressure and Equivalent Freshwater Head from Fully Recovered Hydraulic Tests ..................................................................... 86
Table 4.4: Tritium Content of Drilling Fluids Accessing Silurian Aquifers .................................. 91
Table 4.5: Oxygen-18 and Deuterium Content of Drilling Fluids Accessing Silurian Aquifers ... 93
DGR-7 and DGR-8 Investigations - xviii - February 2012
Table 5.1: Summary of Representative Estimates of RQD and Natural Fracture Frequency from DGSM and Including DGR-7 and DGR-8 Data ................................................ 94
Table 5.2: Summary of Representative Estimates of Horizontal Hydraulic Conductivity from DGSM and Including DGR-7 and DGR-8 Data ........................................................ 96
APPENDIX A: COMPOSITE BOREHOLE GEOPHYSICAL LOGS
DGR-7 and DGR-8 Investigations - 1 - February 2012
1. INTRODUCTION
Geofirma Engineering Ltd. (formerly Intera Engineering Ltd.) was contracted by the Nuclear Waste Management Organization (NWMO), on behalf of Ontario Power Generation, to implement geoscientific investigations of shaft locations of the proposed Deep Geologic Repository at the Bruce nuclear site located near Tiverton, Ontario. The Deep Geologic Repository (DGR) is proposed for long-term management of low-level and intermediate-level radioactive waste at a depth of about 680 metres below ground surface (mBGS) within the Paleozoic argillaceous limestone of the Cobourg Formation.
As part of these geoscientific investigations, Geofirma completed drilling and testing of two boreholes: DGR-7 near the proposed vent shaft location to a depth of 189.97 mBGS and DGR-8 at the proposed main shaft location to a depth of 723.81 mBGS. The results of previous DGR borehole drilling, sampling and testing programs are described by Intera Engineering Ltd. (2011) as part of the development of a Descriptive Geosphere Site Model (DGSM) of the Bruce nuclear site.
This report summarizes the results of the geoscientific characterization work completed as part of NWMO’s shaft investigation drilling program in the period April to October 2011. This work was completed as part of NWMO design and construction phase and was intended to provide data for shaft design and to test and confirm geoscientific information described in the DGSM released in April 2011. The DGSM for the Bruce nuclear site includes descriptive geological, hydrogeological and geomechanical site models.
This Project Report provides a summary compilation, description, assessment and interpretation of geoscientific data collected as part of a series of shaft drilling investigations, which are described in a set of Technical Reports. Technical Reports generally provide limited interpretation and are intended as summaries of collected data. All Technical Reports were completed in accordance with approved Test Plans. Technical Reports, Test Plans and Project Reports were prepared following the requirements of the Geofirma DGR Project Quality Plan (Geofirma Engineering Ltd. 2011a), which meets the requirements of NWMO’s DGR Project Quality Plan. Work described in this Project Report was also completed in accordance with the Geofirma DGR Environment, Health and Safety Plan (Geofirma Engineering Ltd., 2011b).
1.1 Report Organization
This document consists of the following sections.
• Section 1: Introduction – the remaining parts of Section 1 describe organization of this report, the DGR concept, previous DGR drilling programs, the Descriptive Geosphere Site Model, Technical Reports, and project quality planning.
• Section 2: DGR-7 and DGR-8 Drilling, Logging and Testing Programs: - a summary of the scope and methodology of drilling, casing installation, coring, drilling fluid management, borehole orientation monitoring, core sampling/logging/photography, borehole geophysical logging, borehole hydraulic testing and borehole sealing programs completed in DGR-7 and DGR-8.
• Section 3: Geological Characterization – a summary of the geological characterization information obtained from DGR-7 and DGR-8.
DGR-7 and DGR-8 Investigations - 2 - February 2012
• Section 4: Hydrogeological Characterization – a summary of the hydrogeological characterization information obtained from DGR-7 and DGR-8.
• Section 5: Summary of Results and Conclusions– provides an assessment of geological and hydrogeological site conditions found at DGR-7 and DGR-8 relative to the conditions given in the descriptive geological and hydrogeological site models of the DGSM.
• Section 6: Abbreviations and Acronyms
• Section 7: References.
• Appendix A: Composite Borehole Geophysical Logs for DGR-7 and DGR-8
1.2 DGR Concept
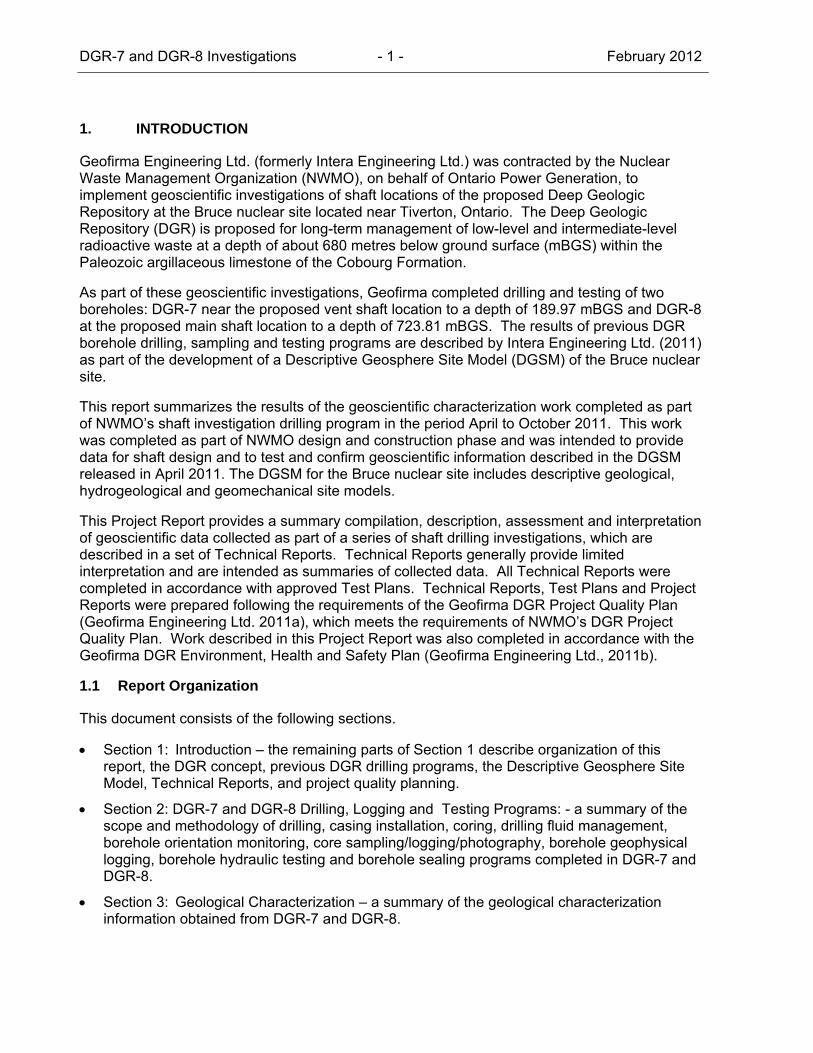
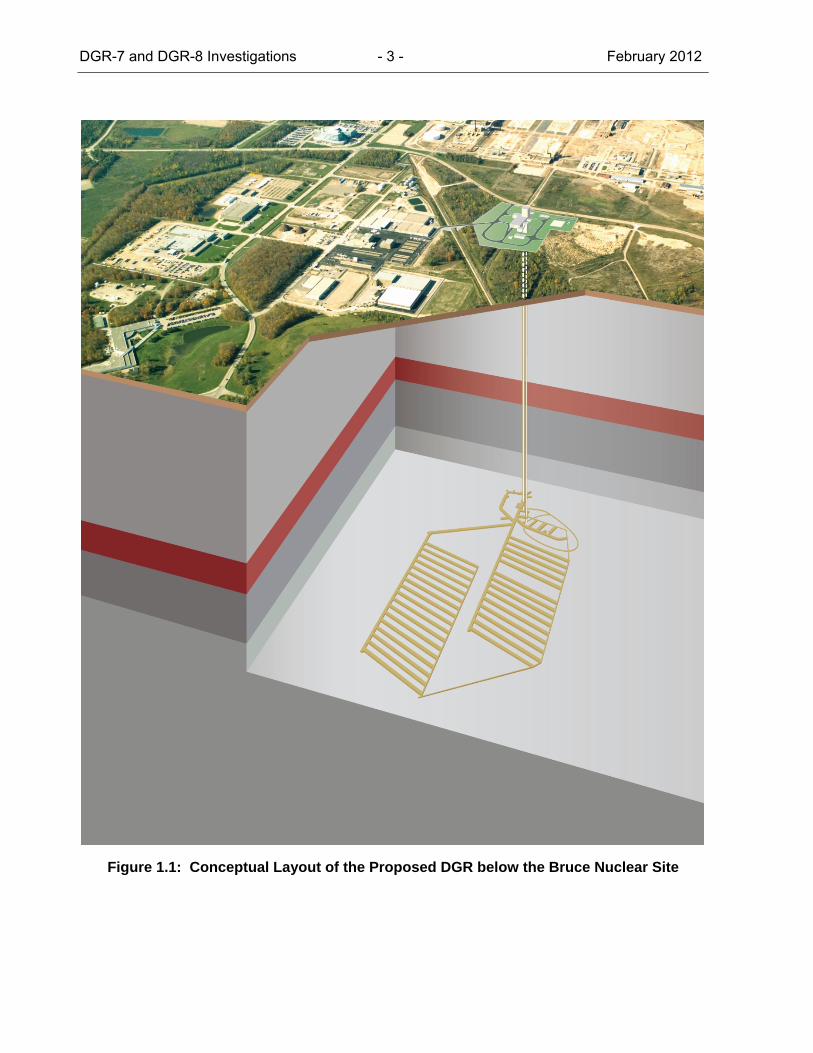
The DGR is proposed to be constructed at a depth of about 680 m below ground surface within the argillaceous limestone of the Cobourg Formation. Figure 1.1 shows the proposed layout of the DGR below the Bruce nuclear site. The approximate plan location and extent of the proposed DGR is shown on Figure 1.2. The DGR will require construction of a main shaft and a ventilation shaft.
The DGR will be designed to receive low- and intermediate-level wastes currently in interim storage at the Bruce nuclear site and similar wastes produced at OPG-owned or operated nuclear generating stations. Wilson et al. (2011) provides a detailed description of the DGR project, including the anticipated volumes, types and activities of the wastes to be placed in the DGR.
1.3 Previous DGR Drilling Programs
In the period 2006 to 2010 bedrock drilling programs at the Bruce nuclear site were completed as part of a comprehensive Geoscientific Site Characterization Plan (GSCP) at the site in three drilling phases. The GSCP is described by Intera Engineering Ltd. (2006, 2008). The GSCP activities included drilling borehole US-8 to a depth of 200.4 metres below ground surface (mBGS) to augment the existing US-series boreholes that create a shallow groundwater monitoring network on site and drilling of six deep DGR-series boreholes to geoscientifically characterize the site. Figure 1.2 shows the locations of borehole DGR-1 through DGR-6, US-3, US-7 and US-8. DGR-1 was drilled to a depth of 462.9 mBGS and DGR-2 was drilled to a depth of 862.1 mBGS as part of Phase 1 drilling activity. DGR-3 and DGR-4 were drilled to depths of 869.2 and 857.0 mBGS, respectively as part of Phase 2A drilling activity. These four DGR boreholes (DGR-1 through DGR-4) were vertical.
DGR-5 and DGR-6 were drilled at inclinations of approximately 65º and 60°, respectively, from horizontal as part of Phase 2B drilling activity. DGR-5 was drilled to a total vertical depth of 752.2 mBGS (into the Kirkfield Formation) and DGR-6 was completed at a total vertical depth of 785.5 mBGS (into the Gull River Formation). DGR-5 and DGR-6 were drilled to investigate the general characteristics of potential sub-vertical structure in the bedrock.
Figure 1.3 shows the reference subsurface bedrock formation contact depths for the Bruce nuclear site based on the descriptions outlined in Armstrong and Carter (2010, 2006) and data from DGR-1 and DGR-2 (Intera Engineering Ltd. 2011). Reference stratigraphy is defined in this report as the stratigraphy present at boreholes DGR-1 and DGR-2 and is required for data presentation purposes due to the slight dip of the bedrock formations at the site The stratigraphic units shown in Figure 1.3 are used throughout this Project Report.
DGR-7 and DGR-8 Investigations - 3 - February 2012
Figure 1.1: Conceptual Layout of the Proposed DGR below the Bruce Nuclear Site

DGR-7 and DGR-8 Investigations - 4 - February 2012
Figure 1.2: Proposed DGR Layout and Borehole Locations at the Bruce Nuclear Site

DGR-7 and DGR-8 Investigations - 5 - February 2012
Figure 1.3: Reference Stratigraphic Column at the Bruce Nuclear Site Based on DGR-1 and DGR-2 Data
DGR-7 and DGR-8 Investigations - 6 - February 2012
1.4 Descriptive Geosphere Site Model
The DGSM described by Intera Engineering Ltd (2011) summarizes the current understanding of underground geological, hydrogeological and geomechanical conditions of the Bruce nuclear site relevant to DGR repository engineering and safety assessment functions, up to and including drilling and testing of DGR-6. The geological, hydrogeological and geomechanical site conditions are presented through the development of individual descriptive geological, hydrogeological and geomechanical models of the Bruce nuclear site. Since the shaft drilling investigations were intended to test and confirm the results of the DGSM at the shaft locations, summary description of the individual site models is provided below.
1.4.1 Descriptive Geological Site Model
The results of the 2006-2010 geological investigations, including completion of 19.7 km of 2-D seismic reflection surveys are summarized in the descriptive geological model of the Bruce nuclear site (Intera Engineering Ltd. 2011). The geological site model describes the occurrence and the lithological and structural characteristics of 34 distinct sedimentary bedrock formations, members or units (excluding the overburden and Precambrian basement), extending from near ground surface to a depth of about 860 metres below ground surface (see Figure 1.3). In general, the thickness and orientation of these 34 sedimentary strata are remarkably uniform between the DGR boreholes separated by up to 1318 m. The thickness and orientation of formations are somewhat more variable above the Salina B Unit due to collapse and minor rotation of the overlying bedrock following paleo-dissolution of the Salina B and D Unit salt beds. Below the B Unit the average strike and dip of the deeper Silurian and the Ordovician formations at the Bruce nuclear site (N20°W/0.6°SW) are consistent with regional geological mapping of Armstrong and Carter (2006) and with site predictions developed based on the drilling and logging records of the Texaco No. 6 oil and gas exploration well located 2.9 km southeast of the Bruce nuclear site.
Detailed core logging and borehole geophysical logging of DGR-series and US-series boreholes show that that Devonian and Upper Silurian dolostones are moderately to highly fractured and of poor to fair rock quality designation (RQD), whereas the deeper Silurian formations below the Salina G Unit, the Ordovician shales that overlie the DGR host formation (Cobourg Formation), the host Cobourg Formation and the argillaceous limestones below the host formation are very sparsely fractured to unfractured with excellent RQD. The descriptive geological site model shows that the bedrock formations at the Bruce site are laterally extensive and of uniform and predictable lithological and structural properties. The Ordovician limestone and shale formations that will host, overlie and underlie the proposed DGR are of uniform and excellent rock quality.
1.4.2 Descriptive Hydrogeological Site Model
The results of the 2006-2010 hydrogeological investigations are summarized in the descriptive hydrogeological model of the Bruce nuclear site (Intera Engineering Ltd., 2011). The descriptive hydrogeological site model provides representative values of key hydrogeological properties of the 39 layers that represent the Bruce nuclear site, and then groups these model layers into nine hydrostratigraphic (HS) units that have similar hydrogeological properties, and into three hydrogeological systems. Estimates of vertical and horizontal hydraulic conductivity, specific storage, total porosity, hydraulic gradients, vertical and horizontal effective diffusion coefficients, diffusion porosity and groundwater/porewater major ion and isotope chemistry for model layers and hydrostratigraphic units are summarized in the DGSM report.
DGR-7 and DGR-8 Investigations - 7 - February 2012
The results of hydrogeological investigations are conveniently summarized in the DGSM through description of the three major hydrogeologic systems at the Bruce nuclear site – shallow, intermediate and deep. The shallow hydrogeological system consists mostly of permeable Devonian dolostones, extends from ground surface to reference depths of 169.3 mBGS in DGR-1, and contains fresh to brackish water with evidence of glacial meltwater. Solute migration within this permeable groundwater system is principally by advection. The intermediate system consists of Silurian dolostones, shales and anhydrites and extends to reference depths of 447.7 mBGS in DGR-1. Groundwater and porewater within this predominately low-permeability system, transitions from saline Ca-SO4 water near the top of the system to a Na-Cl brine at the bottom of the system. Tracer profiles indicate solute transport within most of the intermediate system is by diffusion with advective transport likely occurring laterally within the two thin permeable Salina Upper A1 Unit and Guelph Formation non-potable aquifers. The deep system occurs at reference depths of 447.7 to 860.7 mBGS and includes Ordovician shale and limestone and Cambrian sandstone. It comprises an exceptionally low permeability Ordovician shale and Trenton Group limestone aquiclude (Kh = 10-15 to 10-14 m/s), a low permeability Black River Group aquitard (Kh = 10-12 to 10-11 m/s) and a non-potable Cambrian aquifer (Kh = 10-9 to 10-6 m/s). Groundwater and porewater within the deep system is Na-Cl to Na:Ca-Cl brine. Tracer profiles suggest diffusion-controlled solute transport within the bulk of the deep system.
1.4.3 Descriptive Geomechanical Site Model
The results of the 2006-2010 geomechanical investigations are summarized in the descriptive geomechanical model of the Bruce nuclear site (Intera Engineering Ltd. 2011). The geomechanical site model describes and summarizes the current understanding of the principal geomechanical properties of the rock materials and rock mass beneath the Bruce nuclear site, and also summarizes local seismicity and estimates of in situ stress. The geomechanical site model focuses on presentation of quantitative estimated physical properties that will control the geomechanical behaviour of the rock mass beneath the site during and after construction of the subsurface infrastructure required for development of the DGR. The descriptive geomechanical site model provides representative values of key geomechanical properties of the 34 sedimentary rock layers that represent the Bruce site, and then groups these model layers into five mechano-stratigraphic units that have similar geomechanical properties. Representative values are based on combining the specific quantitative values of various parameters derived from field and laboratory testing with expert judgement, where appropriate.
The geomechanical site model describes both the rock material geomechanical characteristics and the rock mass geomechanical characteristics for each of the five mechanostratigraphic (MS) units based on and testing of DGR-1 to DGR-6. Rock material geomechanical characteristics include, where available, information on short and long-term uniaxial compression strengths, triaxial compression strength, indirect tensile strength, direct shear strength, slake durability, free swell behaviour, abrasiveness, and dynamic properties (elastic and shear moduli, Poisson’s ratio) based on the testing of intact cores. Rock mass geomechanical characteristics include, where available, information on rock quality designation (RQD), natural fracture frequency, and bulk properties from borehole geophysical logging (dynamic elastic and shear moduli). The available data on rock material and rock mass geomechanical characteristics generated from Phase 1, 2A and 2B site characterization work demonstrate that the geomechanical properties of the proposed DGR rocks are better than expected based on precedent projects and regional data summaries.
DGR-7 and DGR-8 Investigations - 8 - February 2012
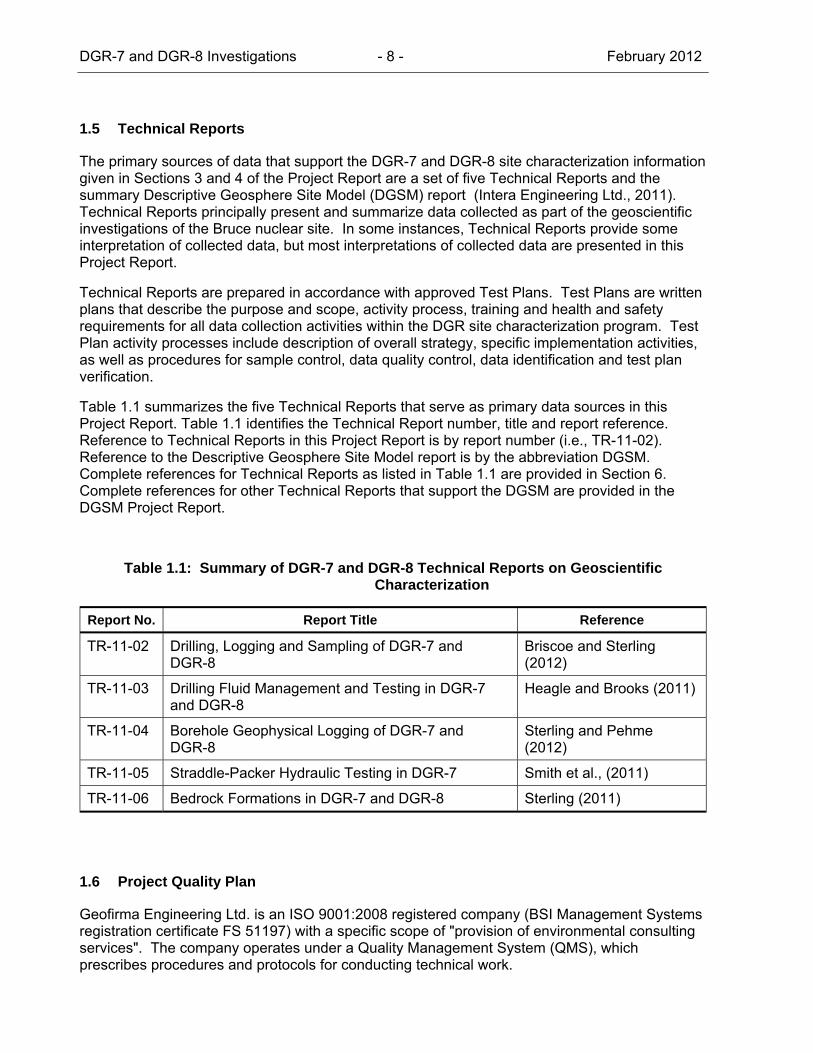
1.5 Technical Reports
The primary sources of data that support the DGR-7 and DGR-8 site characterization information given in Sections 3 and 4 of the Project Report are a set of five Technical Reports and the summary Descriptive Geosphere Site Model (DGSM) report (Intera Engineering Ltd., 2011). Technical Reports principally present and summarize data collected as part of the geoscientific investigations of the Bruce nuclear site. In some instances, Technical Reports provide some interpretation of collected data, but most interpretations of collected data are presented in this Project Report.
Technical Reports are prepared in accordance with approved Test Plans. Test Plans are written plans that describe the purpose and scope, activity process, training and health and safety requirements for all data collection activities within the DGR site characterization program. Test Plan activity processes include description of overall strategy, specific implementation activities, as well as procedures for sample control, data quality control, data identification and test plan verification.
Table 1.1 summarizes the five Technical Reports that serve as primary data sources in this Project Report. Table 1.1 identifies the Technical Report number, title and report reference. Reference to Technical Reports in this Project Report is by report number (i.e., TR-11-02). Reference to the Descriptive Geosphere Site Model report is by the abbreviation DGSM. Complete references for Technical Reports as listed in Table 1.1 are provided in Section 6. Complete references for other Technical Reports that support the DGSM are provided in the DGSM Project Report.
Table 1.1: Summary of DGR-7 and DGR-8 Technical Reports on Geoscientific Characterization
Report No. Report Title Reference
TR-11-02 Drilling, Logging and Sampling of DGR-7 and DGR-8
Briscoe and Sterling (2012)
TR-11-03 Drilling Fluid Management and Testing in DGR-7 and DGR-8
Heagle and Brooks (2011)
TR-11-04 Borehole Geophysical Logging of DGR-7 and DGR-8
Sterling and Pehme (2012)
TR-11-05 Straddle-Packer Hydraulic Testing in DGR-7 Smith et al., (2011)
TR-11-06 Bedrock Formations in DGR-7 and DGR-8 Sterling (2011)
1.6 Project Quality Plan
Geofirma Engineering Ltd. is an ISO 9001:2008 registered company (BSI Management Systems registration certificate FS 51197) with a specific scope of "provision of environmental consulting services". The company operates under a Quality Management System (QMS), which prescribes procedures and protocols for conducting technical work.
DGR-7 and DGR-8 Investigations - 9 - February 2012
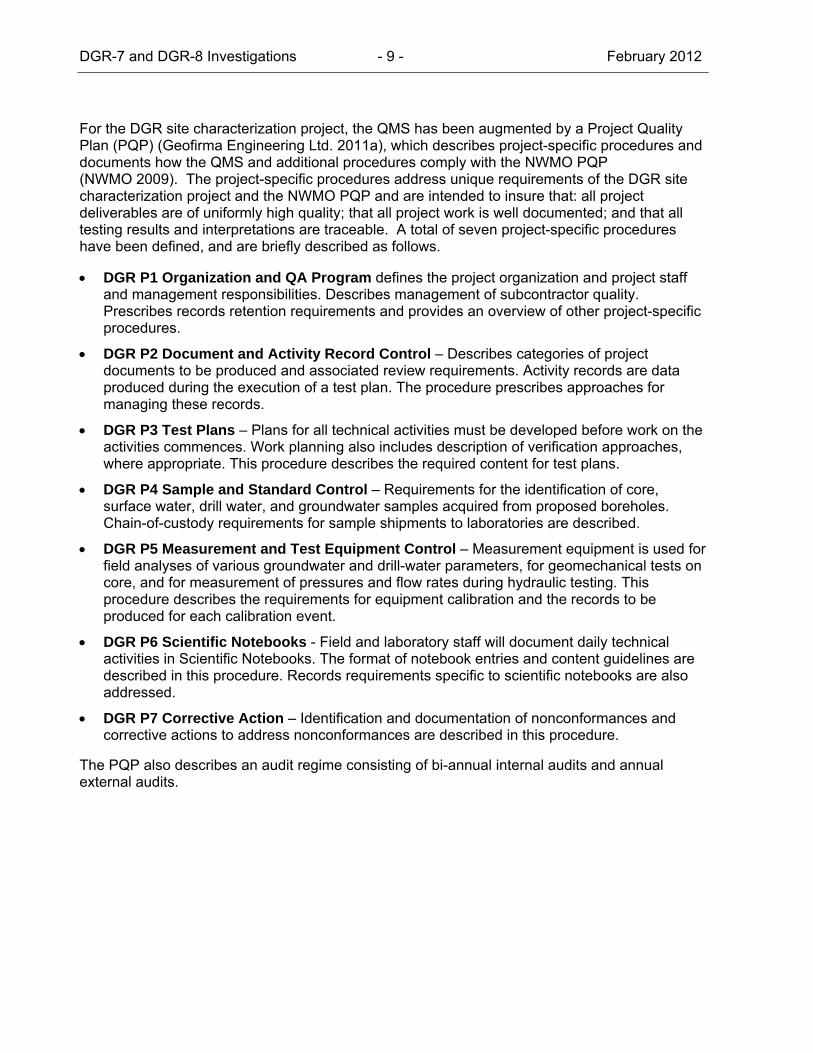
For the DGR site characterization project, the QMS has been augmented by a Project Quality Plan (PQP) (Geofirma Engineering Ltd. 2011a), which describes project-specific procedures and documents how the QMS and additional procedures comply with the NWMO PQP (NWMO 2009). The project-specific procedures address unique requirements of the DGR site characterization project and the NWMO PQP and are intended to insure that: all project deliverables are of uniformly high quality; that all project work is well documented; and that all testing results and interpretations are traceable. A total of seven project-specific procedures have been defined, and are briefly described as follows.
• DGR P1 Organization and QA Program defines the project organization and project staff and management responsibilities. Describes management of subcontractor quality. Prescribes records retention requirements and provides an overview of other project-specific procedures.
• DGR P2 Document and Activity Record Control – Describes categories of project documents to be produced and associated review requirements. Activity records are data produced during the execution of a test plan. The procedure prescribes approaches for managing these records.
• DGR P3 Test Plans – Plans for all technical activities must be developed before work on the activities commences. Work planning also includes description of verification approaches, where appropriate. This procedure describes the required content for test plans.
• DGR P4 Sample and Standard Control – Requirements for the identification of core, surface water, drill water, and groundwater samples acquired from proposed boreholes. Chain-of-custody requirements for sample shipments to laboratories are described.
• DGR P5 Measurement and Test Equipment Control – Measurement equipment is used for field analyses of various groundwater and drill-water parameters, for geomechanical tests on core, and for measurement of pressures and flow rates during hydraulic testing. This procedure describes the requirements for equipment calibration and the records to be produced for each calibration event.
• DGR P6 Scientific Notebooks - Field and laboratory staff will document daily technical activities in Scientific Notebooks. The format of notebook entries and content guidelines are described in this procedure. Records requirements specific to scientific notebooks are also addressed.
• DGR P7 Corrective Action – Identification and documentation of nonconformances and corrective actions to address nonconformances are described in this procedure.
The PQP also describes an audit regime consisting of bi-annual internal audits and annual external audits.
DGR-7 and DGR-8 Investigations - 10 - February 2012
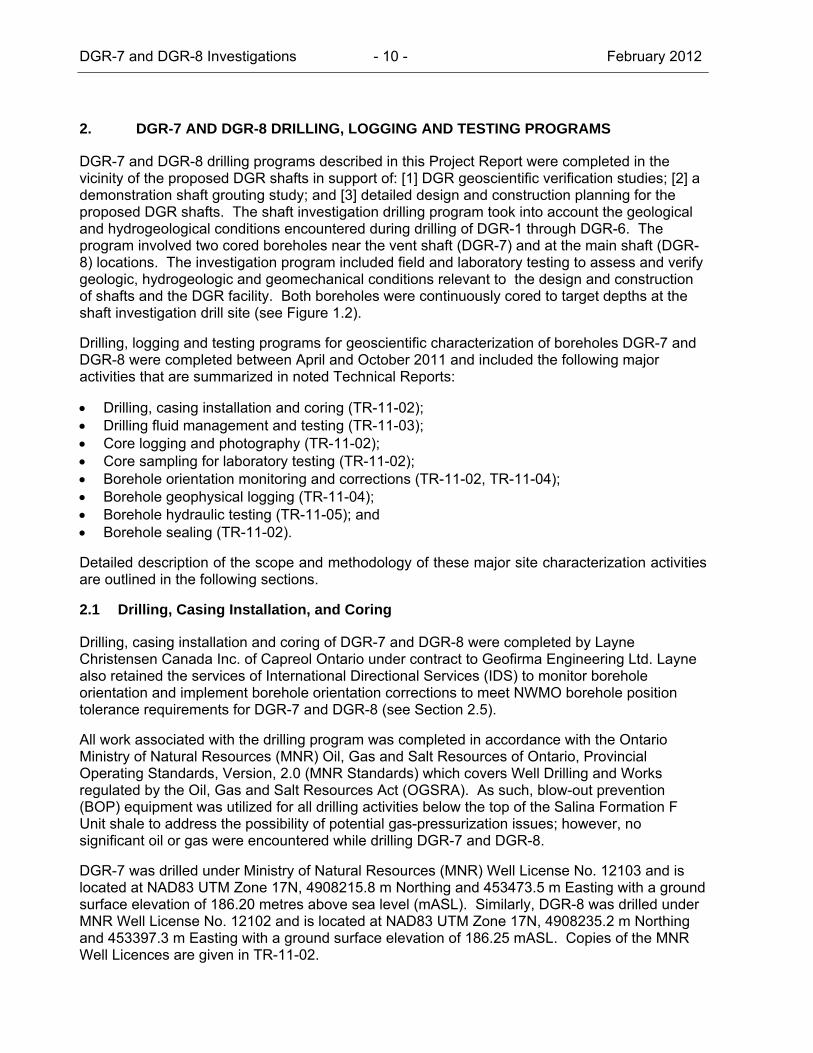
2. DGR-7 AND DGR-8 DRILLING, LOGGING AND TESTING PROGRAMS
DGR-7 and DGR-8 drilling programs described in this Project Report were completed in the vicinity of the proposed DGR shafts in support of: [1] DGR geoscientific verification studies; [2] a demonstration shaft grouting study; and [3] detailed design and construction planning for the proposed DGR shafts. The shaft investigation drilling program took into account the geological and hydrogeological conditions encountered during drilling of DGR-1 through DGR-6. The program involved two cored boreholes near the vent shaft (DGR-7) and at the main shaft (DGR-8) locations. The investigation program included field and laboratory testing to assess and verify geologic, hydrogeologic and geomechanical conditions relevant to the design and construction of shafts and the DGR facility. Both boreholes were continuously cored to target depths at the shaft investigation drill site (see Figure 1.2).
Drilling, logging and testing programs for geoscientific characterization of boreholes DGR-7 and DGR-8 were completed between April and October 2011 and included the following major activities that are summarized in noted Technical Reports:
• Drilling, casing installation and coring (TR-11-02); • Drilling fluid management and testing (TR-11-03); • Core logging and photography (TR-11-02); • Core sampling for laboratory testing (TR-11-02); • Borehole orientation monitoring and corrections (TR-11-02, TR-11-04); • Borehole geophysical logging (TR-11-04); • Borehole hydraulic testing (TR-11-05); and • Borehole sealing (TR-11-02).
Detailed description of the scope and methodology of these major site characterization activities are outlined in the following sections.
2.1 Drilling, Casing Installation, and Coring
Drilling, casing installation and coring of DGR-7 and DGR-8 were completed by Layne Christensen Canada Inc. of Capreol Ontario under contract to Geofirma Engineering Ltd. Layne also retained the services of International Directional Services (IDS) to monitor borehole orientation and implement borehole orientation corrections to meet NWMO borehole position tolerance requirements for DGR-7 and DGR-8 (see Section 2.5).
All work associated with the drilling program was completed in accordance with the Ontario Ministry of Natural Resources (MNR) Oil, Gas and Salt Resources of Ontario, Provincial Operating Standards, Version, 2.0 (MNR Standards) which covers Well Drilling and Works regulated by the Oil, Gas and Salt Resources Act (OGSRA). As such, blow-out prevention (BOP) equipment was utilized for all drilling activities below the top of the Salina Formation F Unit shale to address the possibility of potential gas-pressurization issues; however, no significant oil or gas were encountered while drilling DGR-7 and DGR-8.
DGR-7 was drilled under Ministry of Natural Resources (MNR) Well License No. 12103 and is located at NAD83 UTM Zone 17N, 4908215.8 m Northing and 453473.5 m Easting with a ground surface elevation of 186.20 metres above sea level (mASL). Similarly, DGR-8 was drilled under MNR Well License No. 12102 and is located at NAD83 UTM Zone 17N, 4908235.2 m Northing and 453397.3 m Easting with a ground surface elevation of 186.25 mASL. Copies of the MNR Well Licences are given in TR-11-02.
DGR-7 and DGR-8 Investigations - 11 - February 2012
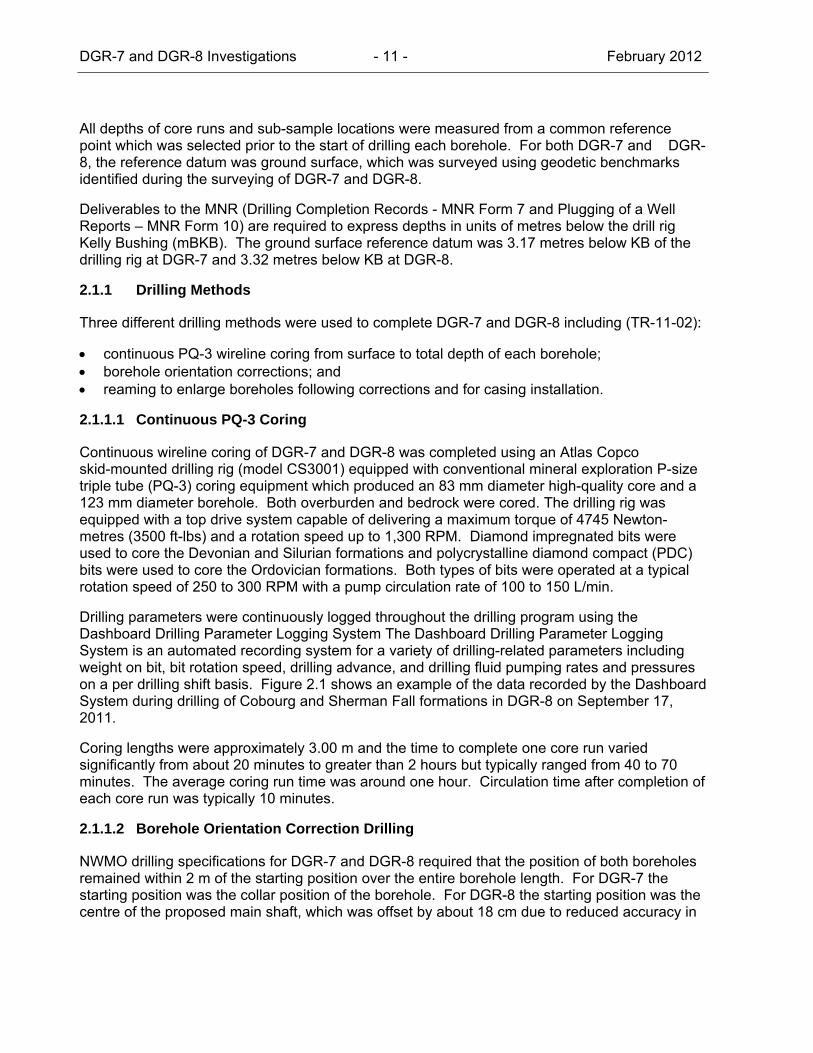
All depths of core runs and sub-sample locations were measured from a common reference point which was selected prior to the start of drilling each borehole. For both DGR-7 and DGR-8, the reference datum was ground surface, which was surveyed using geodetic benchmarks identified during the surveying of DGR-7 and DGR-8.
Deliverables to the MNR (Drilling Completion Records - MNR Form 7 and Plugging of a Well Reports – MNR Form 10) are required to express depths in units of metres below the drill rig Kelly Bushing (mBKB). The ground surface reference datum was 3.17 metres below KB of the drilling rig at DGR-7 and 3.32 metres below KB at DGR-8.
2.1.1 Drilling Methods
Three different drilling methods were used to complete DGR-7 and DGR-8 including (TR-11-02):
• continuous PQ-3 wireline coring from surface to total depth of each borehole; • borehole orientation corrections; and • reaming to enlarge boreholes following corrections and for casing installation.
2.1.1.1 Continuous PQ-3 Coring
Continuous wireline coring of DGR-7 and DGR-8 was completed using an Atlas Copco skid-mounted drilling rig (model CS3001) equipped with conventional mineral exploration P-size triple tube (PQ-3) coring equipment which produced an 83 mm diameter high-quality core and a 123 mm diameter borehole. Both overburden and bedrock were cored. The drilling rig was equipped with a top drive system capable of delivering a maximum torque of 4745 Newton-metres (3500 ft-lbs) and a rotation speed up to 1,300 RPM. Diamond impregnated bits were used to core the Devonian and Silurian formations and polycrystalline diamond compact (PDC) bits were used to core the Ordovician formations. Both types of bits were operated at a typical rotation speed of 250 to 300 RPM with a pump circulation rate of 100 to 150 L/min.
Drilling parameters were continuously logged throughout the drilling program using the Dashboard Drilling Parameter Logging System The Dashboard Drilling Parameter Logging System is an automated recording system for a variety of drilling-related parameters including weight on bit, bit rotation speed, drilling advance, and drilling fluid pumping rates and pressures on a per drilling shift basis. Figure 2.1 shows an example of the data recorded by the Dashboard System during drilling of Cobourg and Sherman Fall formations in DGR-8 on September 17, 2011.
Coring lengths were approximately 3.00 m and the time to complete one core run varied significantly from about 20 minutes to greater than 2 hours but typically ranged from 40 to 70 minutes. The average coring run time was around one hour. Circulation time after completion of each core run was typically 10 minutes.
2.1.1.2 Borehole Orientation Correction Drilling
NWMO drilling specifications for DGR-7 and DGR-8 required that the position of both boreholes remained within 2 m of the starting position over the entire borehole length. For DGR-7 the starting position was the collar position of the borehole. For DGR-8 the starting position was the centre of the proposed main shaft, which was offset by about 18 cm due to reduced accuracy in

DGR-7 and DGR-8 Investigations - 12 - February 2012
Figure 2.1: Dashboard Drilling Parameter Logging System Data for Drilling of the Cobourg and Sherman Falls Formations, 678.81 to 699.81 mBGS in DGR-8
DGR-7 and DGR-8 Investigations - 13 - February 2012
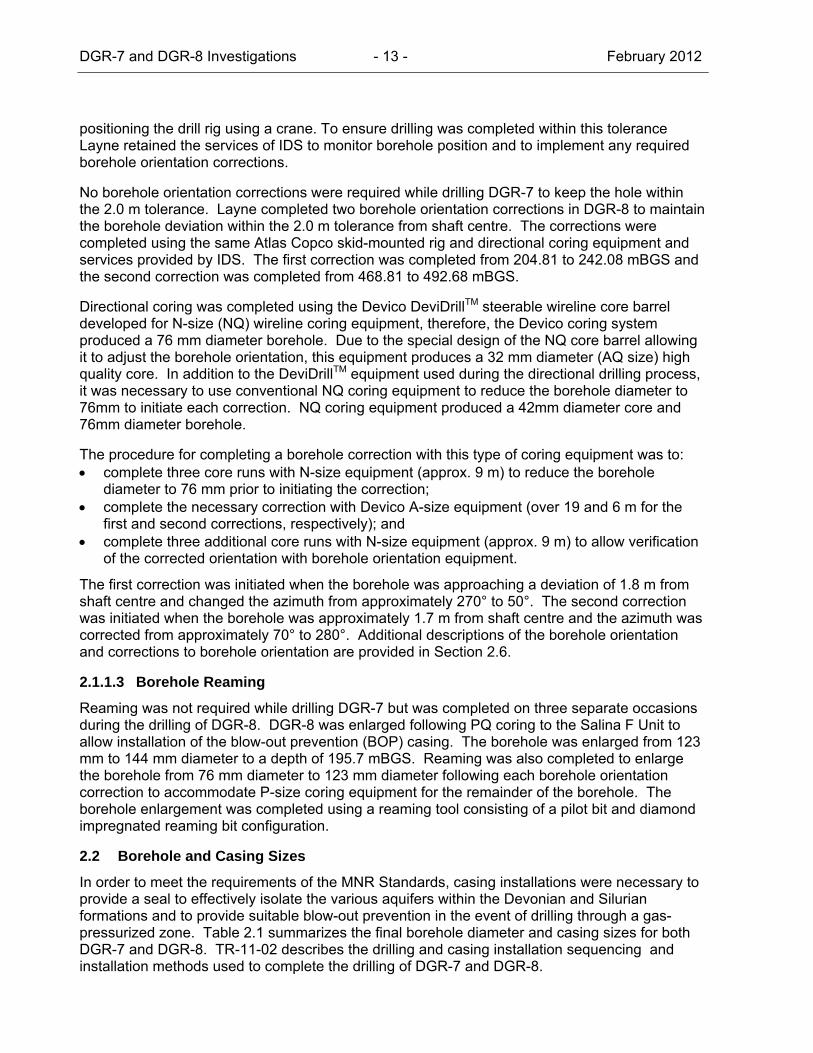
positioning the drill rig using a crane. To ensure drilling was completed within this tolerance Layne retained the services of IDS to monitor borehole position and to implement any required borehole orientation corrections.
No borehole orientation corrections were required while drilling DGR-7 to keep the hole within the 2.0 m tolerance. Layne completed two borehole orientation corrections in DGR-8 to maintain the borehole deviation within the 2.0 m tolerance from shaft centre. The corrections were completed using the same Atlas Copco skid-mounted rig and directional coring equipment and services provided by IDS. The first correction was completed from 204.81 to 242.08 mBGS and the second correction was completed from 468.81 to 492.68 mBGS.
Directional coring was completed using the Devico DeviDrillTM steerable wireline core barrel developed for N-size (NQ) wireline coring equipment, therefore, the Devico coring system produced a 76 mm diameter borehole. Due to the special design of the NQ core barrel allowing it to adjust the borehole orientation, this equipment produces a 32 mm diameter (AQ size) high quality core. In addition to the DeviDrillTM equipment used during the directional drilling process, it was necessary to use conventional NQ coring equipment to reduce the borehole diameter to 76mm to initiate each correction. NQ coring equipment produced a 42mm diameter core and 76mm diameter borehole.
The procedure for completing a borehole correction with this type of coring equipment was to: • complete three core runs with N-size equipment (approx. 9 m) to reduce the borehole
diameter to 76 mm prior to initiating the correction; • complete the necessary correction with Devico A-size equipment (over 19 and 6 m for the
first and second corrections, respectively); and • complete three additional core runs with N-size equipment (approx. 9 m) to allow verification
of the corrected orientation with borehole orientation equipment.
The first correction was initiated when the borehole was approaching a deviation of 1.8 m from shaft centre and changed the azimuth from approximately 270° to 50°. The second correction was initiated when the borehole was approximately 1.7 m from shaft centre and the azimuth was corrected from approximately 70° to 280°. Additional descriptions of the borehole orientation and corrections to borehole orientation are provided in Section 2.6.
2.1.1.3 Borehole Reaming
Reaming was not required while drilling DGR-7 but was completed on three separate occasions during the drilling of DGR-8. DGR-8 was enlarged following PQ coring to the Salina F Unit to allow installation of the blow-out prevention (BOP) casing. The borehole was enlarged from 123 mm to 144 mm diameter to a depth of 195.7 mBGS. Reaming was also completed to enlarge the borehole from 76 mm diameter to 123 mm diameter following each borehole orientation correction to accommodate P-size coring equipment for the remainder of the borehole. The borehole enlargement was completed using a reaming tool consisting of a pilot bit and diamond impregnated reaming bit configuration.
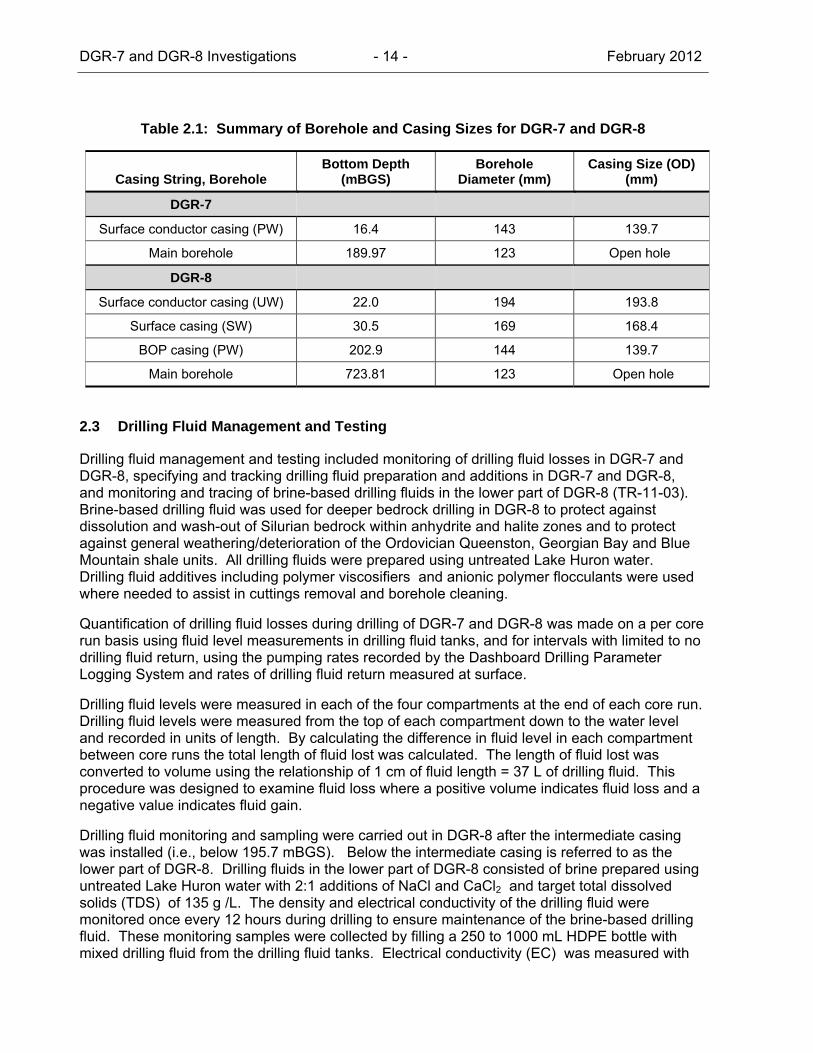
2.2 Borehole and Casing Sizes
In order to meet the requirements of the MNR Standards, casing installations were necessary to provide a seal to effectively isolate the various aquifers within the Devonian and Silurian formations and to provide suitable blow-out prevention in the event of drilling through a gas-pressurized zone. Table 2.1 summarizes the final borehole diameter and casing sizes for both DGR-7 and DGR-8. TR-11-02 describes the drilling and casing installation sequencing and installation methods used to complete the drilling of DGR-7 and DGR-8.
DGR-7 and DGR-8 Investigations - 14 - February 2012
Table 2.1: Summary of Borehole and Casing Sizes for DGR-7 and DGR-8
Casing String, Borehole Bottom Depth
(mBGS) Borehole
Diameter (mm) Casing Size (OD)
(mm)
DGR-7
Surface conductor casing (PW) 16.4 143 139.7
Main borehole 189.97 123 Open hole
DGR-8
Surface conductor casing (UW) 22.0 194 193.8
Surface casing (SW) 30.5 169 168.4
BOP casing (PW) 202.9 144 139.7
Main borehole 723.81 123 Open hole
2.3 Drilling Fluid Management and Testing
Drilling fluid management and testing included monitoring of drilling fluid losses in DGR-7 and DGR-8, specifying and tracking drilling fluid preparation and additions in DGR-7 and DGR-8, and monitoring and tracing of brine-based drilling fluids in the lower part of DGR-8 (TR-11-03). Brine-based drilling fluid was used for deeper bedrock drilling in DGR-8 to protect against dissolution and wash-out of Silurian bedrock within anhydrite and halite zones and to protect against general weathering/deterioration of the Ordovician Queenston, Georgian Bay and Blue Mountain shale units. All drilling fluids were prepared using untreated Lake Huron water. Drilling fluid additives including polymer viscosifiers and anionic polymer flocculants were used where needed to assist in cuttings removal and borehole cleaning.
Quantification of drilling fluid losses during drilling of DGR-7 and DGR-8 was made on a per core run basis using fluid level measurements in drilling fluid tanks, and for intervals with limited to no drilling fluid return, using the pumping rates recorded by the Dashboard Drilling Parameter Logging System and rates of drilling fluid return measured at surface.
Drilling fluid levels were measured in each of the four compartments at the end of each core run. Drilling fluid levels were measured from the top of each compartment down to the water level and recorded in units of length. By calculating the difference in fluid level in each compartment between core runs the total length of fluid lost was calculated. The length of fluid lost was converted to volume using the relationship of 1 cm of fluid length = 37 L of drilling fluid. This procedure was designed to examine fluid loss where a positive volume indicates fluid loss and a negative value indicates fluid gain.
Drilling fluid monitoring and sampling were carried out in DGR-8 after the intermediate casing was installed (i.e., below 195.7 mBGS). Below the intermediate casing is referred to as the lower part of DGR-8. Drilling fluids in the lower part of DGR-8 consisted of brine prepared using untreated Lake Huron water with 2:1 additions of NaCl and CaCl2 and target total dissolved solids (TDS) of 135 g /L. The density and electrical conductivity of the drilling fluid were monitored once every 12 hours during drilling to ensure maintenance of the brine-based drilling fluid. These monitoring samples were collected by filling a 250 to 1000 mL HDPE bottle with mixed drilling fluid from the drilling fluid tanks. Electrical conductivity (EC) was measured with

DGR-7 and DGR-8 Investigations - 15 - February 2012
an Orion conductivity cell that was calibrated with a standard solution. Drilling fluid density was determined by measuring the weight of a known volume of fluid. Electrical conductivity results were reported as mS/cm and density values as kg/m3 (TR-11-03).
Drilling fluids were also traced using naturally-present water isotope tracers including tritium (3H), and the environmental isotopes of deuterium (D), and oxygen-18 (18O) to allow future quantification of drilling fluid contamination levels in any groundwater or porewater samples collected from the boreholes during and following completion of drilling.
2.4 Core Processing, Photography and Logging
2.4.1 Core Processing
Immediately following core retrieval to surface, the core was transported to the Core Receiving Trailer (CRT) where it was photographed, logged, sampled and transferred to a wooden core box for long-term storage. To minimize the potential for alteration of rock porewater chemistry from in-situ conditions or the creation of stress relief and weathering induced fractures, recovered core was processed as quickly as possible following core retrieval to surface. Generally, the cumulative elapsed times from core retrieval at surface (i.e. core barrel opened) until the completion of each sequential stage of core logging and sampling was: core photography (5 minutes), initial core logging and sample identification (5 to 10 minutes), sample preservation (10 to 30 minutes), detailed core logging (30 to 45 minutes), and core transfer into wooden core boxes (35 to 50 minutes).
Core runs were identified in sequential order from the first core run from ground surface and include the borehole identifier and start and finish depths (e.g. DGR-7, Core Run 070, Depth 183.97 to 186.97 mBGS). All depths were referenced to ground surface. In total, 71 core runs were completed in DGR-7 and 262 core runs were completed in DGR-8.
2.4.2 Core Photography
Prior to core logging and sampling, each core run was photographed using a high resolution digital SLR camera (Canon Rebel XT: 8.0 megapixel images) mounted on a specialized core photography table with dedicated lighting to minimize shadows and glare.
A series of six photographs were taken at consistent, pre-set locations along each core run, each of which was designed to capture approximately 1/5 (0.6 m) of the full length core run (3.00 m) resulting in approximately 15 cm of overlap between adjacent pictures. Prior to core photography, the core was cleaned using a damp cloth moistened with drilling fluid to remove excess drill cuttings and mud. The cleaned core provided a damp surface that enabled high quality photos of the core features to be captured in detail.
Each core photograph includes:
• a core identification card providing the project number, borehole identification, date, depth below ground surface to the top of the core run in metres, and the core run number;
• a metric/imperial scale; • a Kodak color control patch card; • a number identifying the sequence of the picture in the core run (e.g. the first picture at the
top of the core will be picture 1, the last picture at the bottom of the core will be picture 6); and,
• an arrow pointing downwards.
DGR-7 and DGR-8 Investigations - 16 - February 2012
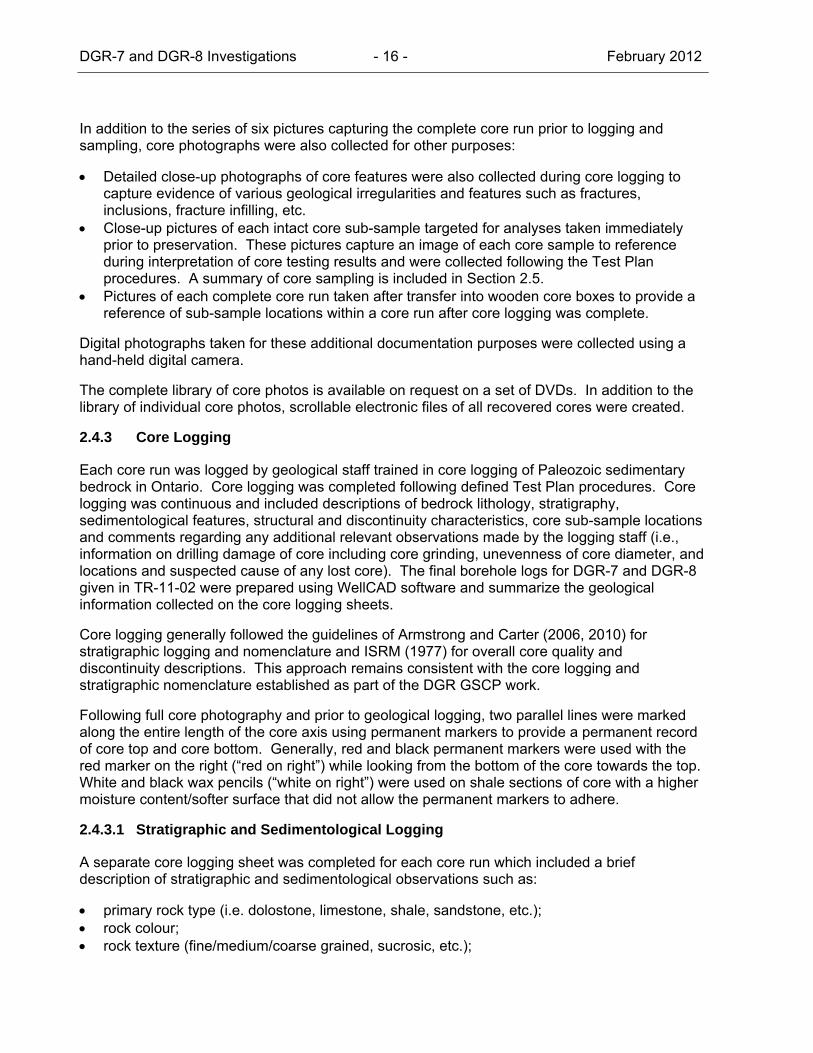
In addition to the series of six pictures capturing the complete core run prior to logging and sampling, core photographs were also collected for other purposes:
• Detailed close-up photographs of core features were also collected during core logging to capture evidence of various geological irregularities and features such as fractures, inclusions, fracture infilling, etc.
• Close-up pictures of each intact core sub-sample targeted for analyses taken immediately prior to preservation. These pictures capture an image of each core sample to reference during interpretation of core testing results and were collected following the Test Plan procedures. A summary of core sampling is included in Section 2.5.
• Pictures of each complete core run taken after transfer into wooden core boxes to provide a reference of sub-sample locations within a core run after core logging was complete.
Digital photographs taken for these additional documentation purposes were collected using a hand-held digital camera.
The complete library of core photos is available on request on a set of DVDs. In addition to the library of individual core photos, scrollable electronic files of all recovered cores were created.
2.4.3 Core Logging
Each core run was logged by geological staff trained in core logging of Paleozoic sedimentary bedrock in Ontario. Core logging was completed following defined Test Plan procedures. Core logging was continuous and included descriptions of bedrock lithology, stratigraphy, sedimentological features, structural and discontinuity characteristics, core sub-sample locations and comments regarding any additional relevant observations made by the logging staff (i.e., information on drilling damage of core including core grinding, unevenness of core diameter, and locations and suspected cause of any lost core). The final borehole logs for DGR-7 and DGR-8 given in TR-11-02 were prepared using WellCAD software and summarize the geological information collected on the core logging sheets.
Core logging generally followed the guidelines of Armstrong and Carter (2006, 2010) for stratigraphic logging and nomenclature and ISRM (1977) for overall core quality and discontinuity descriptions. This approach remains consistent with the core logging and stratigraphic nomenclature established as part of the DGR GSCP work.
Following full core photography and prior to geological logging, two parallel lines were marked along the entire length of the core axis using permanent markers to provide a permanent record of core top and core bottom. Generally, red and black permanent markers were used with the red marker on the right (“red on right”) while looking from the bottom of the core towards the top. White and black wax pencils (“white on right”) were used on shale sections of core with a higher moisture content/softer surface that did not allow the permanent markers to adhere.
2.4.3.1 Stratigraphic and Sedimentological Logging
A separate core logging sheet was completed for each core run which included a brief description of stratigraphic and sedimentological observations such as:
• primary rock type (i.e. dolostone, limestone, shale, sandstone, etc.); • rock colour; • rock texture (fine/medium/coarse grained, sucrosic, etc.);
DGR-7 and DGR-8 Investigations - 17 - February 2012
• sedimentological features (crystalline, lamination and bedding, mottling, styolites, fossils, etc.);
• secondary alterations (halite/gypsum/anhydrite/chert), nodules/casts/bituminous/staining/ precipitate, etc.);
• porosity (burrowed, mouldic, karstic, reefal, mineral infillings, etc.); and, • evidence of rock weathering or dolomitization.
2.4.3.2 Structural Discontinuity Logging
In addition, each core run was logged for discontinuity characteristics in accordance with ISRM suggested methods (ISRM, 1977), including:
• Identification of individual natural fractures and artificial breaks (during drilling or handling). As per ISRM guidance natural fractures were identified as having a generally smooth or somewhat weathered surface with soft coating or infilling materials such as clay, gypsum, calcite, anhydrite, iron oxide. Rough brittle surfaces with fresh cleavage planes in individual rock minerals were considered artificial (mechanical) breaks. To be conservative, questionable breaks along weakness planes such as bedding planes were logged as natural fractures as long as there was no evidence of rough drilling conditions.
• Core recovery (%); • Natural fracture frequency (#/m); • Rock Quality Designation (RQD, %) = total length of intact rock greater than approximately
twice the core diameter (ignoring artificial breaks) divided by the total length of core run (i.e. not recovery). As such, the calculations for RQD required attention to the various core diameters produced using different equipment in DGR-8 during borehole orientation correction;
• Fracture apparent dip angle (alpha angle with core axis, 0-90°); • Fracture roughness (rough, smooth, slickensided, stepped, undulating, planar, etc.); and, • Fracture Infilling or staining (colour, thickness and other relevant properties).
Table 2.2 lists the rock quality descriptions for core and bedrock formations, including RQD (Rock Quality Designation), used in this report that are determined from core logging data based on International Society for Rock Mechanics (1977) guidance. RQD values determined for the 83-mm-diameter core from DGR-7 and DGR-8 boreholes were calculated as the sum of lengths of core greater than 15 cm length (i.e., approximately twice the core diameter) excluding artificial breaks (i.e. drilling-induced breaks), divided by length of hole drilled per core run. RQD values for the NQ- and AQ-diameter core from DGR-8 borehole corrections were calculated as the sum of lengths of core greater than 10 cm length. Core recovery was calculated as the length of core recovered per length of hole drilled per core run. Core runs were typically 3.00 m in length. Natural fracture frequency was calculated as the total number of identified natural fractures divided by the length of recovered core.
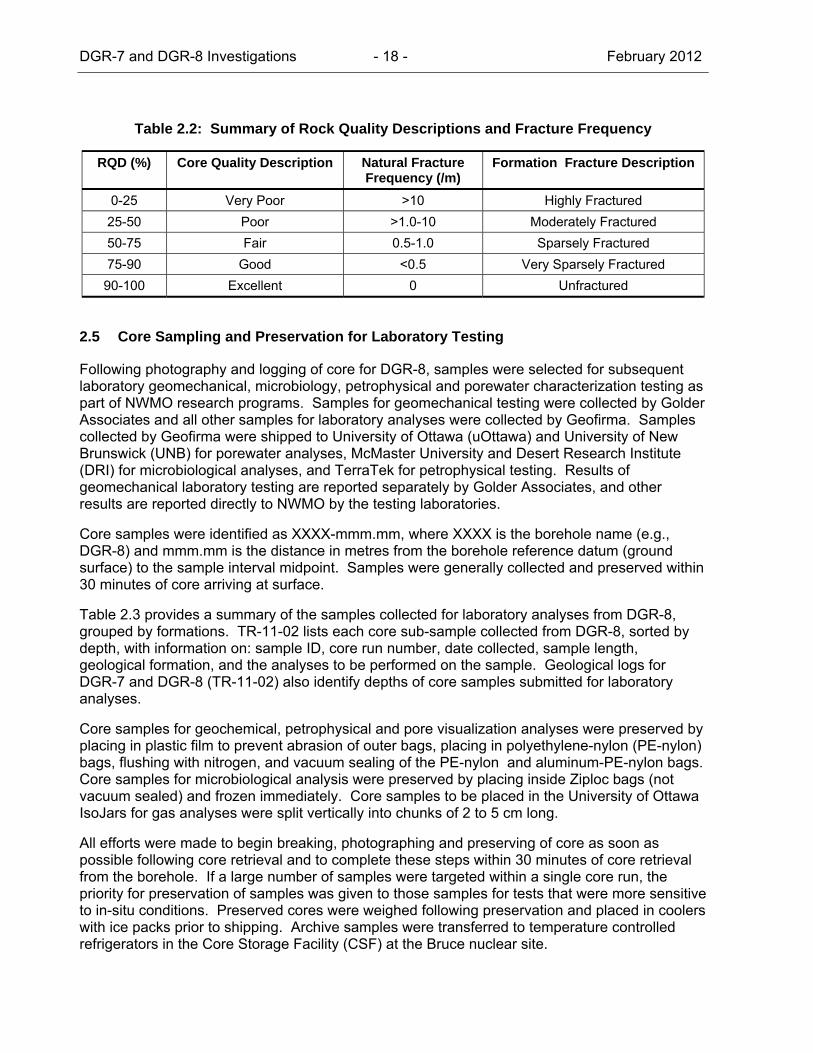
DGR-7 and DGR-8 Investigations - 18 - February 2012
Table 2.2: Summary of Rock Quality Descriptions and Fracture Frequency
RQD (%) Core Quality Description Natural Fracture Frequency (/m)
Formation Fracture Description
0-25 Very Poor >10 Highly Fractured 25-50 Poor >1.0-10 Moderately Fractured 50-75 Fair 0.5-1.0 Sparsely Fractured 75-90 Good <0.5 Very Sparsely Fractured 90-100 Excellent 0 Unfractured
2.5 Core Sampling and Preservation for Laboratory Testing
Following photography and logging of core for DGR-8, samples were selected for subsequent laboratory geomechanical, microbiology, petrophysical and porewater characterization testing as part of NWMO research programs. Samples for geomechanical testing were collected by Golder Associates and all other samples for laboratory analyses were collected by Geofirma. Samples collected by Geofirma were shipped to University of Ottawa (uOttawa) and University of New Brunswick (UNB) for porewater analyses, McMaster University and Desert Research Institute (DRI) for microbiological analyses, and TerraTek for petrophysical testing. Results of geomechanical laboratory testing are reported separately by Golder Associates, and other results are reported directly to NWMO by the testing laboratories.
Core samples were identified as XXXX-mmm.mm, where XXXX is the borehole name (e.g., DGR-8) and mmm.mm is the distance in metres from the borehole reference datum (ground surface) to the sample interval midpoint. Samples were generally collected and preserved within 30 minutes of core arriving at surface.
Table 2.3 provides a summary of the samples collected for laboratory analyses from DGR-8, grouped by formations. TR-11-02 lists each core sub-sample collected from DGR-8, sorted by depth, with information on: sample ID, core run number, date collected, sample length, geological formation, and the analyses to be performed on the sample. Geological logs for DGR-7 and DGR-8 (TR-11-02) also identify depths of core samples submitted for laboratory analyses.
Core samples for geochemical, petrophysical and pore visualization analyses were preserved by placing in plastic film to prevent abrasion of outer bags, placing in polyethylene-nylon (PE-nylon) bags, flushing with nitrogen, and vacuum sealing of the PE-nylon and aluminum-PE-nylon bags. Core samples for microbiological analysis were preserved by placing inside Ziploc bags (not vacuum sealed) and frozen immediately. Core samples to be placed in the University of Ottawa IsoJars for gas analyses were split vertically into chunks of 2 to 5 cm long.
All efforts were made to begin breaking, photographing and preserving of core as soon as possible following core retrieval and to complete these steps within 30 minutes of core retrieval from the borehole. If a large number of samples were targeted within a single core run, the priority for preservation of samples was given to those samples for tests that were more sensitive to in-situ conditions. Preserved cores were weighed following preservation and placed in coolers with ice packs prior to shipping. Archive samples were transferred to temperature controlled refrigerators in the Core Storage Facility (CSF) at the Bruce nuclear site.
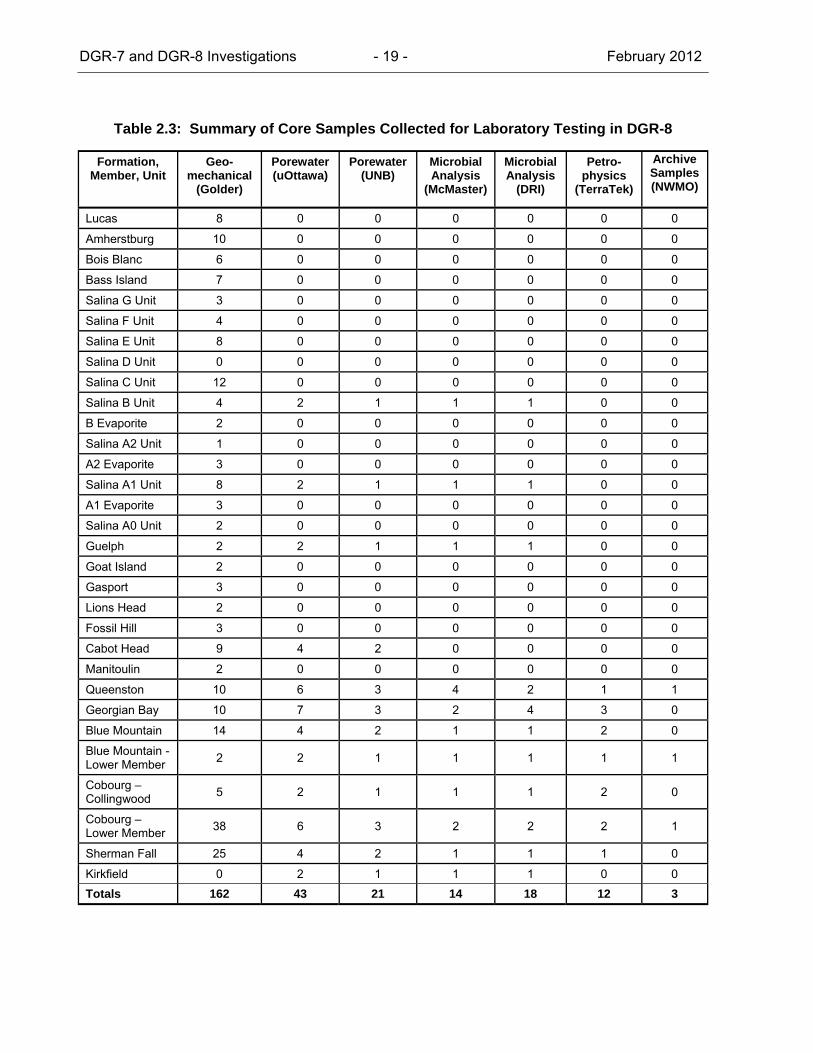
DGR-7 and DGR-8 Investigations - 19 - February 2012
Table 2.3: Summary of Core Samples Collected for Laboratory Testing in DGR-8
Formation, Member, Unit
Geo-mechanical
(Golder)
Porewater (uOttawa)
Porewater (UNB)
Microbial Analysis
(McMaster)
Microbial Analysis
(DRI)
Petro-physics
(TerraTek)
Archive Samples (NWMO)
Lucas 8 0 0 0 0 0 0
Amherstburg 10 0 0 0 0 0 0
Bois Blanc 6 0 0 0 0 0 0
Bass Island 7 0 0 0 0 0 0
Salina G Unit 3 0 0 0 0 0 0
Salina F Unit 4 0 0 0 0 0 0
Salina E Unit 8 0 0 0 0 0 0
Salina D Unit 0 0 0 0 0 0 0
Salina C Unit 12 0 0 0 0 0 0
Salina B Unit 4 2 1 1 1 0 0
B Evaporite 2 0 0 0 0 0 0
Salina A2 Unit 1 0 0 0 0 0 0
A2 Evaporite 3 0 0 0 0 0 0
Salina A1 Unit 8 2 1 1 1 0 0
A1 Evaporite 3 0 0 0 0 0 0
Salina A0 Unit 2 0 0 0 0 0 0
Guelph 2 2 1 1 1 0 0
Goat Island 2 0 0 0 0 0 0
Gasport 3 0 0 0 0 0 0
Lions Head 2 0 0 0 0 0 0
Fossil Hill 3 0 0 0 0 0 0
Cabot Head 9 4 2 0 0 0 0
Manitoulin 2 0 0 0 0 0 0
Queenston 10 6 3 4 2 1 1
Georgian Bay 10 7 3 2 4 3 0
Blue Mountain 14 4 2 1 1 2 0
Blue Mountain -Lower Member 2 2 1 1 1 1 1
Cobourg – Collingwood 5 2 1 1 1 2 0
Cobourg – Lower Member 38 6 3 2 2 2 1
Sherman Fall 25 4 2 1 1 1 0
Kirkfield 0 2 1 1 1 0 0 Totals 162 43 21 14 18 12 3
DGR-7 and DGR-8 Investigations - 20 - February 2012
2.6 Borehole Orientation Monitoring and Corrections
DGR-7 and DGR-8 were to be drilled vertical within a tolerance of two metres radius from the borehole starting coordinates for DGR-7 and from shaft centre for DGR-8. To ensure each borehole stayed within tolerance, frequent measurements of azimuth and plunge were completed by Layne/IDS during drilling using two independent methods including DeviToolTM Peewee magnetic tool approximately every 24 m and an SPT GyroTracerTM north seeking gyro approximately every 75 m or as warranted due to Peewee readings. All borehole orientation equipment was operated from surface using a wireline to lower the tool inside of the drill rods to the targeted depth. The tools measured the borehole azimuth (angle clockwise from magnetic north) and borehole plunge (angle below horizontal) at the measurement depth.
Summary plots showing the borehole orientation data collected during drilling operations are included in TR-11-02. Information from these borehole orientation measurements provided real-time data during drilling that were used to determine when a borehole orientation correction was required. No corrections were required for DGR-7 and two corrections were completed for DGR-8. The corrections completed from 204.81 to 242.08 mBGS and from 468.81 to 492.68 mBGS in DGR-8 are evident in the summary plots provided in TR-11-02. Final borehole orientations were measured after the completion of drilling using higher accuracy and precision downhole geophysical logging tools (i.e. acoustic televiewer) and are further discussed and presented in TR-11-04.
A summary of the borehole orientation equipment used in DGR-7 and DGR-8 by Layne/IDS included:
• SPT GyroTracerTM, an electronic north seeking gyroscopic tool that measures borehole orientation (azimuth and plunge) in both magnetic and non-magnetic environments (i.e. capable of measuring inside of drill rods), manufactured by Stockholm Precision Tools AB based in Stockholm, Sweden. GyroTracerTM surveys were completed approximately every 75 m of coring (every 25 core runs) with more frequent surveys completed when additional information was required in order to make decisions pertaining to borehole orientation corrective action. During each gyro survey, borehole orientation (azimuth and dip) measurements were recorded every 5 m. Individual gyro surveys were completed over each newly cored section of borehole (75 m) plus a minimum of two overlapping data points with the previous survey results to ensure consistency and duplication.
• DeviToolTM Peewee, an electronic survey instrument that uses three high-accuracy magnetometers and accelerometers, manufactured by Devico AS based in Melhus, Norway. The DeviToolTM Peewee was operated by IDS with assistance from Layne Christensen to lower the tool on a wireline. The DeviToolTM Peewee and was used to collect single-shot measurements of borehole orientation (azimuth and plunge) in an open borehole with the core barrel removed. IDS collected measurements using the DeviToolTM Peewee every 25 m during coring and more frequently during the borehole corrections in DGR-8.
Following drilling operations, borehole orientations were also measured using selected geophysical logging tools to confirm the results of the Layne/IDS measurements. Figures 2.2 and 2.3 show the plan and sectional views of the final positions of boreholes DGR-7 and DGR-8 based on available borehole orientation measurements collected by Layne/IDS and during subsequent borehole geophysical logging.
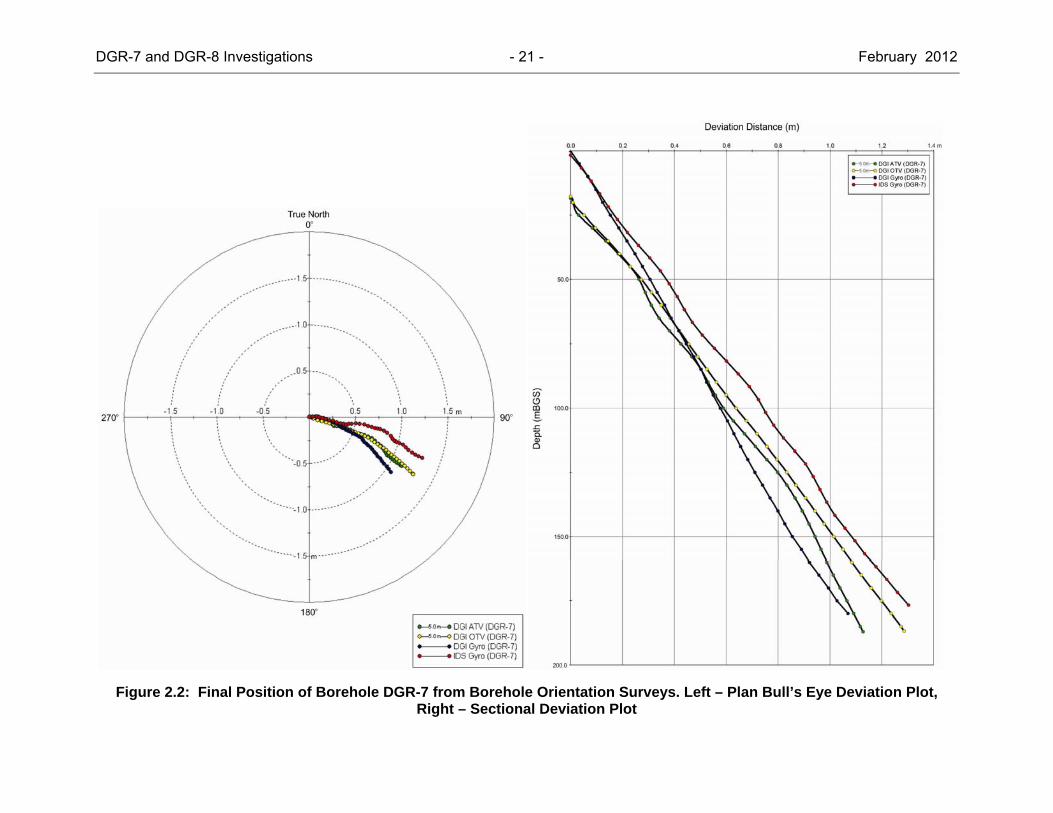
DGR-7 and DGR-8 Investigations - 21 - February 2012
Figure 2.2: Final Position of Borehole DGR-7 from Borehole Orientation Surveys. Left – Plan Bull’s Eye Deviation Plot, Right – Sectional Deviation Plot
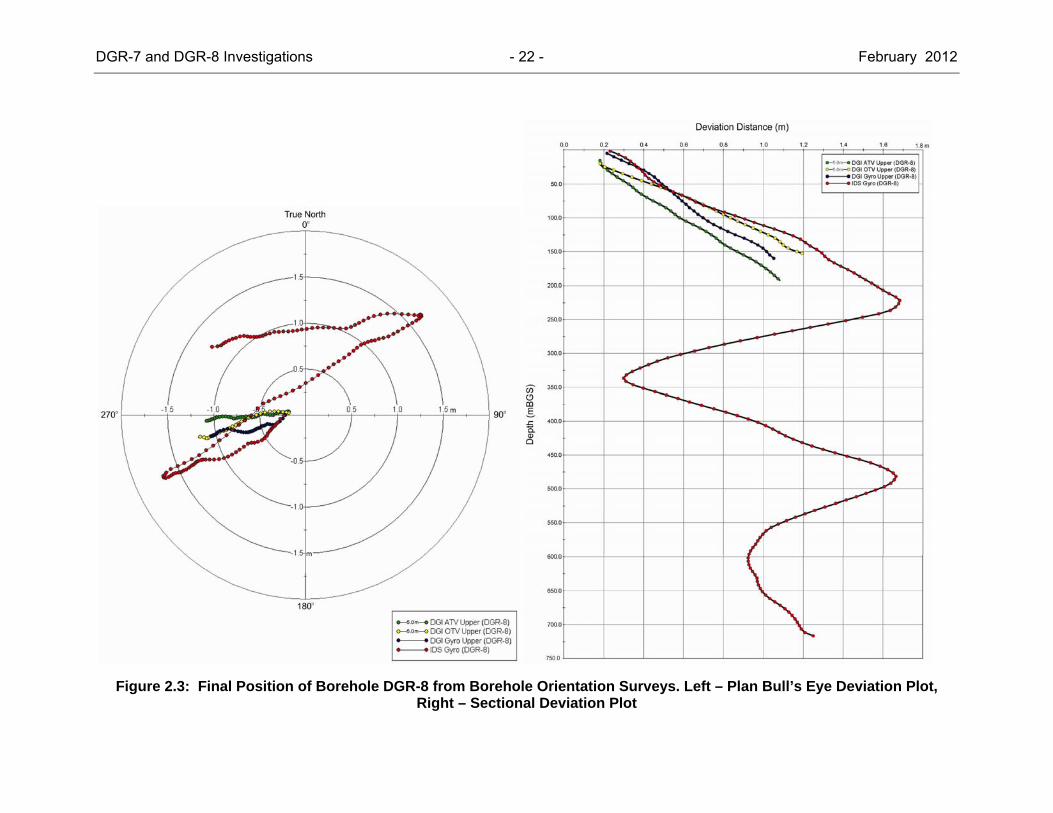
DGR-7 and DGR-8 Investigations - 22 - February 2012
Figure 2.3: Final Position of Borehole DGR-8 from Borehole Orientation Surveys. Left – Plan Bull’s Eye Deviation Plot, Right – Sectional Deviation Plot
DGR-7 and DGR-8 Investigations - 23 - February 2012
For DGR-7 and the upper part of DGR-8 corroborating borehole orientation measurements were obtained from borehole acoustic televiewer (ATV), optical televiewer (OTV) and gyroscopic logs. For the lower part of DGR-8 corroborating borehole orientation measurements were obtained from borehole acoustic televiewer logs.
Figure 2.2 shows the maximum deviation in borehole DGR-7 was about 1.1 to 1.3 m to the southeast of the starting position at ground surface. The DGR-7 borehole position information determined by Layne/IDS was confirmed by the subsequent geophysical measurements obtained from gyroscopic, acoustic televiewer and optical televiewer logging.
Figure 2.3 shows that the maximum deviation in borehole DGR-8 was about 1.5-1.6 m to the northeast and to the west-southwest of the starting position at ground surface. The DGR-8 borehole position information determined by Layne/IDS was confirmed by the subsequent geophysical measurements obtained from gyroscopic, acoustic televiewer and optical televiewer logging in the upper part of the hole and acoustic televiewer in the lower part of the hole. Figure 2.3, shows that the starting position of DGR-8 was offset from the expected starting position by about 18 cm to the west due to limited accuracy in positioning of the drill rig on the drilling platform with a crane.
Comparison of the different independent borehole orientation measurements suggests that borehole position information is only accurate to about +/- 15% or +/-0.15 m at depths of a few hundred metres.
2.7 Borehole Geophysical Logging
Borehole geophysical logging of DGR-7 and DGR-8 was completed in three mobilizations or phases (TR-11-04).
• Phase 1: Borehole DGR-7 (0 to ~189 mBGS) on May 29 to June 1, 2011. • Phase 2: Upper part of borehole DGR- 8 (0 to ~192 mBGS) on June 13 to 16, 2011. • Phase 3: Lower part of borehole DGR-8 (~200 to ~723mBGS) on September 21 to 27, 2011.
Table 2.4 summarizes the types of logs completed in each phase of the borehole geophysical logging. All planned logs were completed during the logging of DGR-7. During logging of the upper part of DGR-8, focused density (gamma-gamma) logs were not run due to unavailability of the sonde at the time of logging in mid June. During the logging of the lower part of DGR-8, gyroscopic verticality logs were not run due to sonde unavailability, and focused density logging was completed using a relative-density sonde. In order to complete the geophysical logging of the lower part of DGR-8 in the contractor’s scheduled time slot, optical televiewer logs were not completed and some logging speeds were increased over those used in the logging of DGR-7 and the upper part of DGR-8.
In accordance with the Test Plan for geophysical logging of DGR-7 and DGR-8, field quality control measures were implemented to ensure the quality of the borehole geophysical logs. These quality control measures included depth control by ensuring after survey depth errors (ASDE) were less than 0.1% of logged depth and field review of logging data for errors and acceptable data resolution and collection rates. Field review of collected geophysical logging data confirmed the acceptability of the data for use in the DGR-7 and DGR-8 geoscientific investigation program.
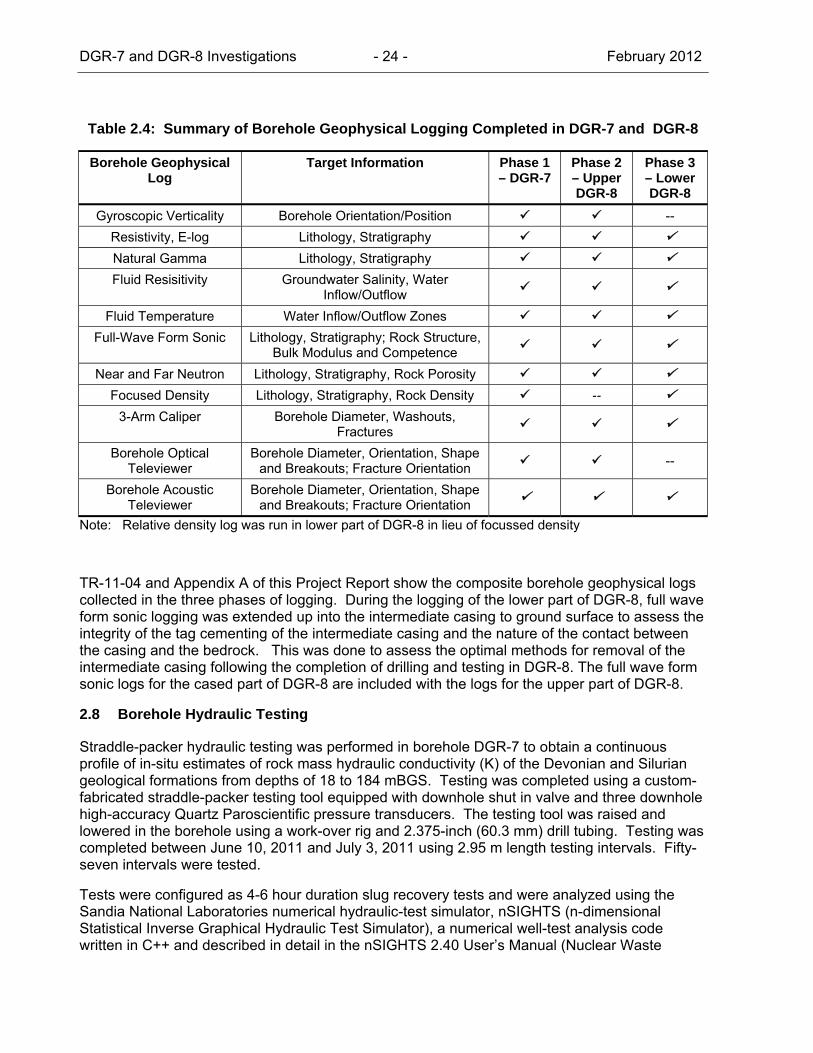
DGR-7 and DGR-8 Investigations - 24 - February 2012
Table 2.4: Summary of Borehole Geophysical Logging Completed in DGR-7 and DGR-8
Borehole Geophysical Log
Target Information Phase 1 – DGR-7
Phase 2 – Upper DGR-8
Phase 3 – Lower DGR-8
Gyroscopic Verticality Borehole Orientation/Position -- Resistivity, E-log Lithology, Stratigraphy Natural Gamma Lithology, Stratigraphy Fluid Resisitivity Groundwater Salinity, Water
Inflow/Outflow
Fluid Temperature Water Inflow/Outflow Zones Full-Wave Form Sonic Lithology, Stratigraphy; Rock Structure,
Bulk Modulus and Competence
Near and Far Neutron Lithology, Stratigraphy, Rock Porosity Focused Density Lithology, Stratigraphy, Rock Density --
3-Arm Caliper Borehole Diameter, Washouts, Fractures
Borehole Optical Televiewer
Borehole Diameter, Orientation, Shape and Breakouts; Fracture Orientation --
Borehole Acoustic Televiewer
Borehole Diameter, Orientation, Shape and Breakouts; Fracture Orientation
Note: Relative density log was run in lower part of DGR-8 in lieu of focussed density
TR-11-04 and Appendix A of this Project Report show the composite borehole geophysical logs collected in the three phases of logging. During the logging of the lower part of DGR-8, full wave form sonic logging was extended up into the intermediate casing to ground surface to assess the integrity of the tag cementing of the intermediate casing and the nature of the contact between the casing and the bedrock. This was done to assess the optimal methods for removal of the intermediate casing following the completion of drilling and testing in DGR-8. The full wave form sonic logs for the cased part of DGR-8 are included with the logs for the upper part of DGR-8.
2.8 Borehole Hydraulic Testing
Straddle-packer hydraulic testing was performed in borehole DGR-7 to obtain a continuous profile of in-situ estimates of rock mass hydraulic conductivity (K) of the Devonian and Silurian geological formations from depths of 18 to 184 mBGS. Testing was completed using a custom-fabricated straddle-packer testing tool equipped with downhole shut in valve and three downhole high-accuracy Quartz Paroscientific pressure transducers. The testing tool was raised and lowered in the borehole using a work-over rig and 2.375-inch (60.3 mm) drill tubing. Testing was completed between June 10, 2011 and July 3, 2011 using 2.95 m length testing intervals. Fifty-seven intervals were tested.
Tests were configured as 4-6 hour duration slug recovery tests and were analyzed using the Sandia National Laboratories numerical hydraulic-test simulator, nSIGHTS (n-dimensional Statistical Inverse Graphical Hydraulic Test Simulator), a numerical well-test analysis code written in C++ and described in detail in the nSIGHTS 2.40 User’s Manual (Nuclear Waste
DGR-7 and DGR-8 Investigations - 25 - February 2012
Management Program 2006). Detailed descriptions of the testing equipment, testing procedures and analysis approach are given in TR-11-05.
A simplified description of the testing methodology including prerequisite activities and hydraulic testing procedures follows. Prerequisite activities to hydraulic testing in DGR-7 included the following:
• The test tool components were assembled and leak tested on racks above ground before installation in the borehole. The lengths, diameters, and placement of all tool elements and gauges were measured, and a sketch of the tool showing all of the measurements was made in the Scientific Notebook (SN). Digital photographs of the tool were also taken and inserted in the SN.
• Once the tool was assembled up to the shut-in valve, it was placed in a section of 125-mm diameter steel casing long enough to cover both packers. The packers were inflated and the test zone interval was then pressurized to greater than 1700 kPa with nitrogen. No fittings or connections were found to be leaking. Note that the packers were inflated with nitrogen for all of the DGR-7 tests.
• A tubing tally was prepared by measuring and recording (to the nearest centimetre) the lengths of enough joints and pup joints of 2.375-inch (60.3 mm) tubing to reach the desired test depth. The joints were numbered sequentially, writing with chalk on the tubing or coupling. The joints were examined and cleaned of small amounts of flaking due to rusting.
• The caliper log from the preceding borehole geophysical surveys (TR-11-04) was reviewed to verify that the borehole maintained a consistent diameter of approximately 123 mm in order for the test tool to move freely to all desired depths. Results from the gyroscopic verticality survey confirmed that minimal curvature existed in the borehole, and tool flexibility would be able to accommodate any existing variations in borehole inclination.
• The test tool was lowered into the well on 2.375-inch (60.3 mm) diameter drill tubing to the first interval to be tested. Once the tool was at the desired depth, all transducers were connected to the data acquisition system (DAS) and communication was then tested and confirmed.
The procedure for straddle-packer hydraulic testing at each test interval was as follows:
• The test was identified with a test ID consisting of the borehole name and the top and bottom of the depth interval tested (e.g. DGR-7_103_106).
• The test tool was lowered into the well on 2.375-inch (60 mm) tubing to its desired position. Once the tool was at the desired depth, all transducers were connected to the data acquisition system (DAS) and communication was initiated. The shut-in valve remained in an open position while the packers were inflated. The packer inflation pressure was set to exceed the fluid pressure in the borehole at the testing depth by a minimum of 1.4 MPa. Fluid pressure was determined using measured pressure in the test zone prior to packer inflation. Target inflation pressure and measured initial pressure were documented in the SN.
• The shut-in valve was closed following packer inflation. Fluid was swabbed or airlifted from the tubing to create the desired slug magnitude. Slug size was confirmed by monitoring pressure inside the tubing.

DGR-7 and DGR-8 Investigations - 26 - February 2012
• When test-zone and tubing pressure stability were achieved, the shut-in valve was opened to initiate the slug test. Test-zone pressure was monitored until test termination criteria were reached. These criteria were: a) when fully recovered, or b) when a six-hour period was complete, or c) when the Task Lead and Testing Lead agreed that sufficient data had been obtained to provide an analysis consistent with program objectives. The six-hour period was reduced to four hours during testing at the discretion of the Task and Testing Leads.
• Packers were deflated when test termination criteria had been reached, and data acquisition was stopped. The tool was then moved down to the next interval. For continuous coverage of the DGR-7 stratigraphy, the upper packer for the new test was set so that its lower seal was a minimum of 5 cm above where the upper seal of the lower packer was set for the previous test.
Due to clogging of the shut-in valve with suspended solids in the drilling fluid column, the shut-in valve was intentionally left open or removed for tests completed between 114.42 to 184.07 mBGS and 18.52 to 33.27 mBGS.
2.9 Borehole Sealing
Following the completion of drilling and testing, boreholes DGR-7 and DGR-8 were plugged in accordance with MNR Provincial Operating Standards, with approval from MNR for minor departures from the Provincial Operating Standards. DGR-7 was plugged to ground surface and DGR-8 was plugged to 195 mBGS.
DGR-7 was utilized as borehole P1 in a grouting feasibility study conducted by NWMO. During the grouting feasibility study, DGR-7 was pressure grouted using grout weights ranging from 1.5 to 1.65 kg/L from 110 to 190 mBGS, injected at approximately 20 bar (290 psi). Final plugging of the remaining open borehole from 110 mBGS to surface was completed on August 10, 2011. The final plugging was completed with 1.8 kg/L cement grout through zones that were already pressure grouted as described above, and re-drilled. The 1.8 kg/L grout slurry was a mixture of Type HE cement, super-plasticizer and a viscosity modifying/anti-washout admixture. The 139.7 mm diameter surface casing as grouted in place and remains above grade so it can be easily located during future site operations.
DGR-8 was grouted from 723.81 to 195 mBGS by Schlumberger Pressure Pumping Services on September 28, 2011. The well was plugged with a 2.0 kg/L Class G cement installed as four continuous 132 m plugs from 723.81 to 195 mBGS. Following plugging to 195 mBGS the well was flushed with freshwater to evacuate any residual brine drilling fluid. Layne then attempted to remove the 139.7 mm diameter BOP casing by pulling on it with the drilling rig without success. The casing was then cut from the inside with mechanical cutters at a depth of 170 mBGS, above the portion that was tag cemented. A second attempt to pull the casing with the drilling rig was also unsuccessful. Hydraulic jacks were then mobilized to site to allow Layne to lift to the maximum rated tension of the casing. At approximately 90% of the rated maximum tension, the casing broke at the top joint. The casing was repaired, however no further attempts were made to remove the casing. The well was completed with a stick up casing and threaded cap.
Final plugging of both boreholes was observed by Certified MNR Well Examiner No. E058/07-10/124. Class 1 Examiner Reports and Form 10 – Plugging of a Well Reports were completed and submitted to the MNR for both boreholes (see TR-11-02).
DGR-7 and DGR-8 Investigations - 27 - February 2012
3. GEOLOGICAL CHARACTERIZATION
3.1 Regional Paleozoic Stratigraphy
The Paleozoic stratigraphy of southern Ontario is summarized by Armstrong and Carter (2006, 2010) and in the context of the Bruce DGR project by AECOM and ITASCA CANADA (2011). The bedrock map of southern Ontario illustrating the location of the Bruce nuclear site and the regional geological framework study area surrounding the site is shown in Figure 3.1. The following description of the Paleozoic stratigraphy of southern Ontario are from AECOM and ITASCA CANADA (2011) and the DGSM.
During the Paleozoic Era, eastern North America was mainly located in tropical latitudes and intermittently covered by basin-centred inland seas. Consequently, the Paleozoic bedrock in southern Ontario consists largely of marine sediments from Cambrian to Mississippian age (Armstrong and Carter 2010). The Paleozoic stratigraphy and depositional history of southern Ontario and the Bruce site is conveniently discussed according the following main stratigraphic sequences:
• Cambrian sandstones and carbonates; • Ordovician carbonates; • Ordovician shales; • Silurian carbonates and shale; • Silurian Salina Group and Bass Islands Formation; and • Devonian carbonates.
Cambrian rocks of Ontario were deposited over the irregular and altered Precambrian surface and extend from the Appalachian Basin to the Michigan Basin but have largely been eroded over the Algonquin Arch. The lithology of the Cambrian deposits ranges from fine to medium crystalline dolostone, sandy dolostone, argillaceous dolostone to fine and coarse sandstone.
The Middle Ordovician carbonates of southern Ontario are divided into two groups, the Black River Group (Shadow Lake, Gull River and Coboconk formations) and the Trenton Group (Kirkfield, Sherman Fall and Cobourg formations). These carbonate rocks were deposited in a major marine transgression that followed the uplift and erosion of Cambrian rocks. This transgression was responsible for the sequence of Black River and Trenton facies assemblages that characterize a succession from supratidal and tidal flat clastics/carbonates to lagoonal carbonates and offshore shallow water and deep shelf carbonates.
Onset of the Taconic Orogeny in the Early to Middle Ordovician resulted in the collapse of platform carbonates of the Trenton Group and the westward inundation of these rocks with orogen-derived marine clastic (shale) sediments resulting in deposition of the Blue Mountain, Georgian Bay and Queenston formations. The quantity of clastics decreases over the Algonquin Arch and into the Michigan Basin.
The top of the Queenston Formation is a discontinuity associated with a global eustatic/sea level drop and marks the return to carbonate-forming conditions during the marine transgressions that followed the Queenston disconformity. The Manitoulin, Cabot Head, Fossil Hill, Lions Head, Gasport, Goat Island and Guelph formations were deposited during these marine transgressions.
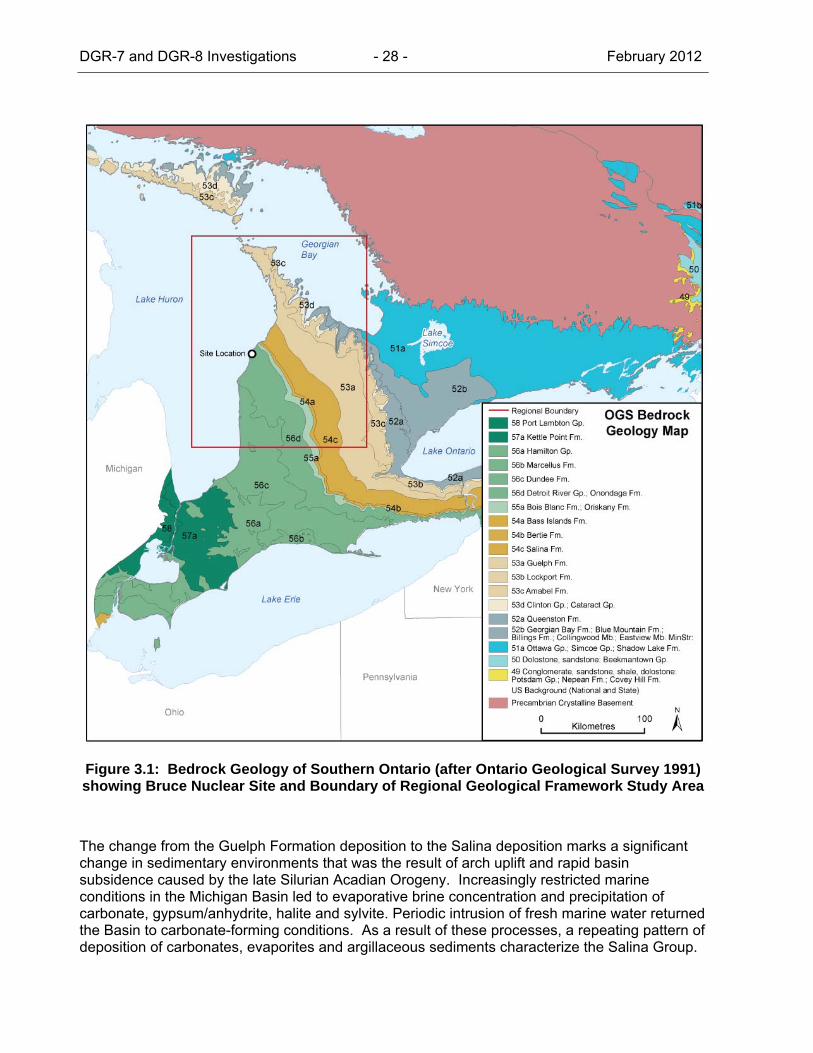
DGR-7 and DGR-8 Investigations - 28 - February 2012
Figure 3.1: Bedrock Geology of Southern Ontario (after Ontario Geological Survey 1991) showing Bruce Nuclear Site and Boundary of Regional Geological Framework Study Area
The change from the Guelph Formation deposition to the Salina deposition marks a significant change in sedimentary environments that was the result of arch uplift and rapid basin subsidence caused by the late Silurian Acadian Orogeny. Increasingly restricted marine conditions in the Michigan Basin led to evaporative brine concentration and precipitation of carbonate, gypsum/anhydrite, halite and sylvite. Periodic intrusion of fresh marine water returned the Basin to carbonate-forming conditions. As a result of these processes, a repeating pattern of deposition of carbonates, evaporites and argillaceous sediments characterize the Salina Group.
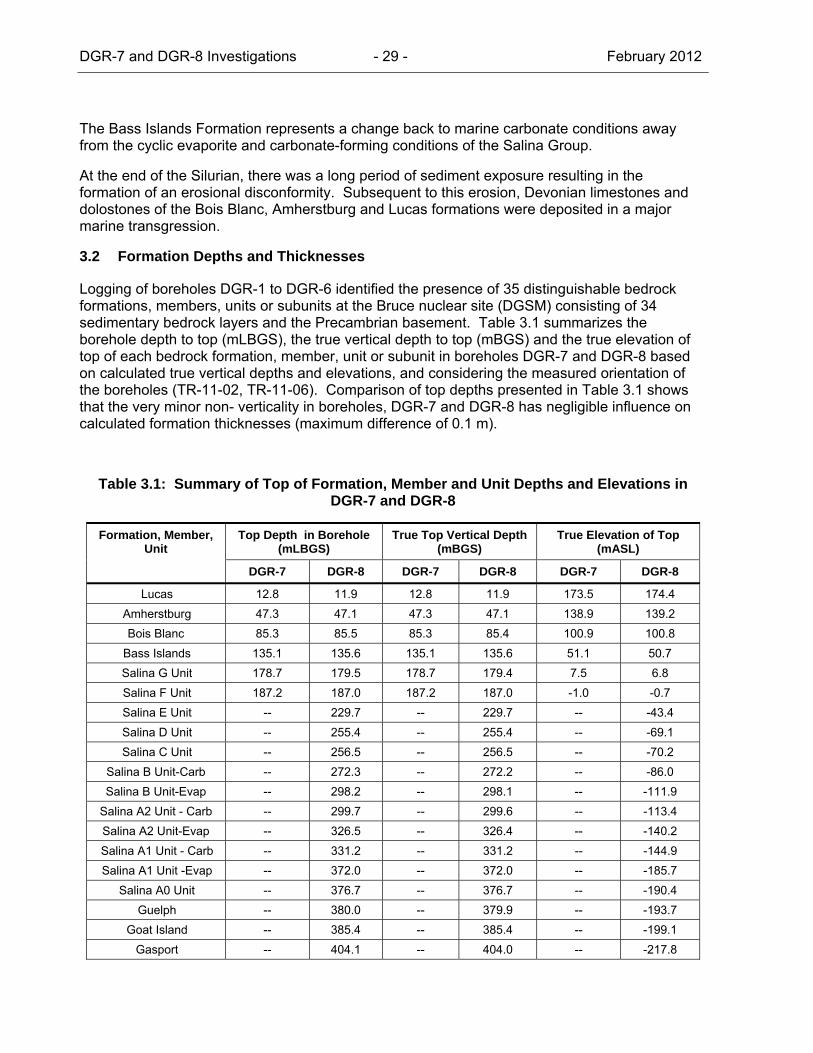
DGR-7 and DGR-8 Investigations - 29 - February 2012
The Bass Islands Formation represents a change back to marine carbonate conditions away from the cyclic evaporite and carbonate-forming conditions of the Salina Group.
At the end of the Silurian, there was a long period of sediment exposure resulting in the formation of an erosional disconformity. Subsequent to this erosion, Devonian limestones and dolostones of the Bois Blanc, Amherstburg and Lucas formations were deposited in a major marine transgression.
3.2 Formation Depths and Thicknesses
Logging of boreholes DGR-1 to DGR-6 identified the presence of 35 distinguishable bedrock formations, members, units or subunits at the Bruce nuclear site (DGSM) consisting of 34 sedimentary bedrock layers and the Precambrian basement. Table 3.1 summarizes the borehole depth to top (mLBGS), the true vertical depth to top (mBGS) and the true elevation of top of each bedrock formation, member, unit or subunit in boreholes DGR-7 and DGR-8 based on calculated true vertical depths and elevations, and considering the measured orientation of the boreholes (TR-11-02, TR-11-06). Comparison of top depths presented in Table 3.1 shows that the very minor non- verticality in boreholes, DGR-7 and DGR-8 has negligible influence on calculated formation thicknesses (maximum difference of 0.1 m).
Table 3.1: Summary of Top of Formation, Member and Unit Depths and Elevations in DGR-7 and DGR-8
Formation, Member, Unit
Top Depth in Borehole (mLBGS)
True Top Vertical Depth (mBGS)
True Elevation of Top (mASL)
DGR-7 DGR-8 DGR-7 DGR-8 DGR-7 DGR-8
Lucas 12.8 11.9 12.8 11.9 173.5 174.4 Amherstburg 47.3 47.1 47.3 47.1 138.9 139.2 Bois Blanc 85.3 85.5 85.3 85.4 100.9 100.8
Bass Islands 135.1 135.6 135.1 135.6 51.1 50.7 Salina G Unit 178.7 179.5 178.7 179.4 7.5 6.8 Salina F Unit 187.2 187.0 187.2 187.0 -1.0 -0.7 Salina E Unit -- 229.7 -- 229.7 -- -43.4 Salina D Unit -- 255.4 -- 255.4 -- -69.1 Salina C Unit -- 256.5 -- 256.5 -- -70.2
Salina B Unit-Carb -- 272.3 -- 272.2 -- -86.0 Salina B Unit-Evap -- 298.2 -- 298.1 -- -111.9
Salina A2 Unit - Carb -- 299.7 -- 299.6 -- -113.4 Salina A2 Unit-Evap -- 326.5 -- 326.4 -- -140.2 Salina A1 Unit - Carb -- 331.2 -- 331.2 -- -144.9 Salina A1 Unit -Evap -- 372.0 -- 372.0 -- -185.7
Salina A0 Unit -- 376.7 -- 376.7 -- -190.4 Guelph -- 380.0 -- 379.9 -- -193.7
Goat Island -- 385.4 -- 385.4 -- -199.1 Gasport -- 404.1 -- 404.0 -- -217.8

DGR-7 and DGR-8 Investigations - 30 - February 2012
Formation, Member, Unit
Top Depth in Borehole (mLBGS)
True Top Vertical Depth (mBGS)
True Elevation of Top (mASL)
DGR-7 DGR-8 DGR-7 DGR-8 DGR-7 DGR-8
Lions Head -- 411.1 -- 411.0 -- -224.8 Fossil Hill -- 415.0 -- 415.0 -- -228.7
Cabot Head -- 417.2 -- 417.1 -- -230.9 Manitoulin -- 440.7 -- 440.7 -- -254.4 Queenston -- 451.6 -- 451.6 -- -265.3
Georgian Bay -- 524.2 -- 524.2 -- -337.9 Blue Mountain -- 613.7 -- 613.6 -- -427.4
Collingwood Member -- 658.0 -- 657.9 -- -471.7 Cobourg -- 665.8 -- 665.8 -- -479.5
Sherman Fall -- 693.7 -- 693.6 -- -507.4 Kirkfield --- 722.9 --- 722.9 -- -536.6
Coboconk -- -- -- -- -- -- Gull River -- -- -- -- -- --
Shadow Lake -- -- -- -- -- -- Cambrian -- -- -- - -- --
Precambrian -- -- -- - -- --
Table 3.2 show the thicknesses of bedrock formations, members and units in DGR-7 and DGR-8 as well as similar information for boreholes DGR-1 to DGR-6 from the DGSM. Table 3.2 shows that the thickness of formations, members and units in DGR-7 and DGR-8 are similar to those reported for boreholes DGR-1 through DGR-6. The thickness of formations, members and units are somewhat more variable above the Salina B Unit and more uniform below the B Unit. As discussed in the DGSM, this is most likely due to collapse and minor rotation of the overlying bedrock following paleo-dissolution of the Salina B and D Unit salt beds and the difficulty of making subtle formation picks based on geophysical and core logs in some of these Devonian and Silurian formations.
Below the Salina B Unit, formation thicknesses in DGR boreholes are typically within a few metres of each other in different holes, The formation thickness below the Salina B Unit in DGR-8 are within the range of thicknesses reported for boreholes DGR-1 through DGR-6. The DGR host formation – the Cobourg Formation, has thickness of 27.9 m in DGR-8, which is very similar to the thicknesses reported in DGR-2 (28.6 m), DGR-3 (27.8 m), DGR-4 (27.5 m), DGR-5 (27.1 m) and DGR-6 (28.5 m). The overlying ultra low-permeability Upper Ordovician shales (Queenston, Georgian Bay and Blue Mountain formations and the Collingwood Member) have thickness of 214.2 m at DGR-8, which is again very similar to the thicknesses reported in DGR-2 (211.9 m), DGR-3 (215.9 m), DGR-4 (215.2 m), DGR-5 (212.7 m) and DGR-6 (209.0 m).
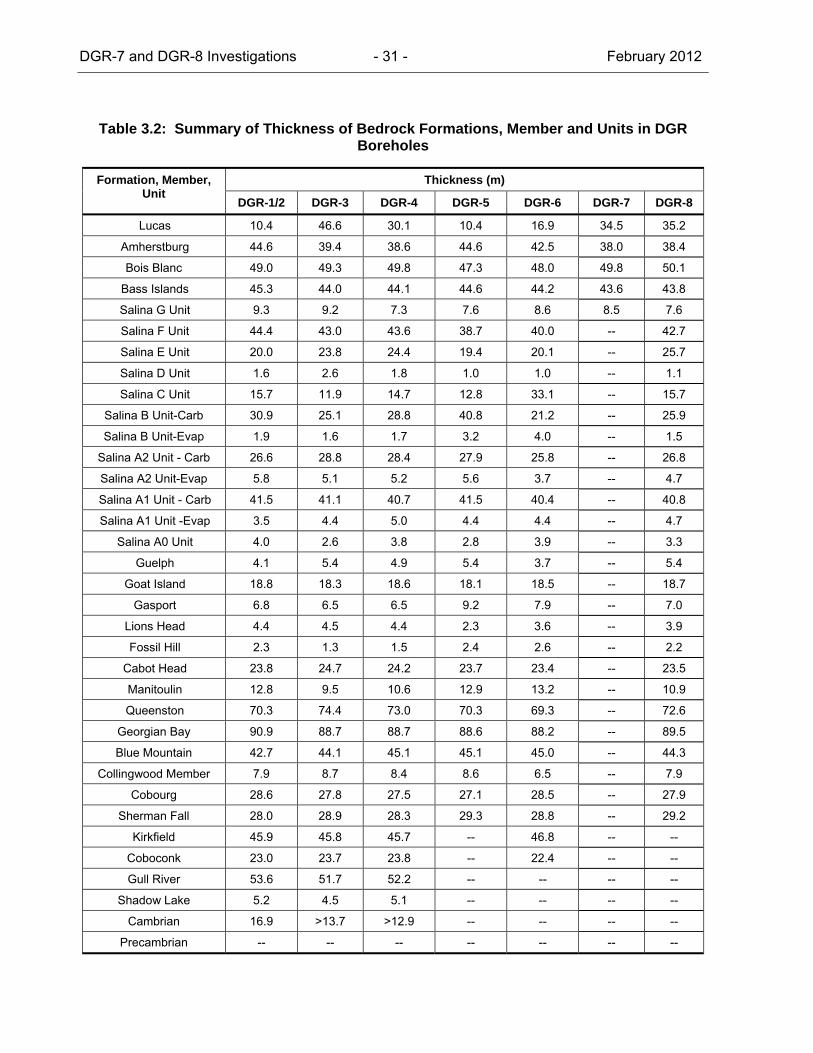
DGR-7 and DGR-8 Investigations - 31 - February 2012
Table 3.2: Summary of Thickness of Bedrock Formations, Member and Units in DGR Boreholes
Formation, Member, Unit
Thickness (m)
DGR-1/2 DGR-3 DGR-4 DGR-5 DGR-6 DGR-7 DGR-8
Lucas 10.4 46.6 30.1 10.4 16.9 34.5 35.2
Amherstburg 44.6 39.4 38.6 44.6 42.5 38.0 38.4
Bois Blanc 49.0 49.3 49.8 47.3 48.0 49.8 50.1
Bass Islands 45.3 44.0 44.1 44.6 44.2 43.6 43.8
Salina G Unit 9.3 9.2 7.3 7.6 8.6 8.5 7.6
Salina F Unit 44.4 43.0 43.6 38.7 40.0 -- 42.7
Salina E Unit 20.0 23.8 24.4 19.4 20.1 -- 25.7
Salina D Unit 1.6 2.6 1.8 1.0 1.0 -- 1.1
Salina C Unit 15.7 11.9 14.7 12.8 33.1 -- 15.7
Salina B Unit-Carb 30.9 25.1 28.8 40.8 21.2 -- 25.9
Salina B Unit-Evap 1.9 1.6 1.7 3.2 4.0 -- 1.5
Salina A2 Unit - Carb 26.6 28.8 28.4 27.9 25.8 -- 26.8
Salina A2 Unit-Evap 5.8 5.1 5.2 5.6 3.7 -- 4.7
Salina A1 Unit - Carb 41.5 41.1 40.7 41.5 40.4 -- 40.8
Salina A1 Unit -Evap 3.5 4.4 5.0 4.4 4.4 -- 4.7
Salina A0 Unit 4.0 2.6 3.8 2.8 3.9 -- 3.3
Guelph 4.1 5.4 4.9 5.4 3.7 -- 5.4
Goat Island 18.8 18.3 18.6 18.1 18.5 -- 18.7
Gasport 6.8 6.5 6.5 9.2 7.9 -- 7.0
Lions Head 4.4 4.5 4.4 2.3 3.6 -- 3.9
Fossil Hill 2.3 1.3 1.5 2.4 2.6 -- 2.2
Cabot Head 23.8 24.7 24.2 23.7 23.4 -- 23.5
Manitoulin 12.8 9.5 10.6 12.9 13.2 -- 10.9
Queenston 70.3 74.4 73.0 70.3 69.3 -- 72.6
Georgian Bay 90.9 88.7 88.7 88.6 88.2 -- 89.5
Blue Mountain 42.7 44.1 45.1 45.1 45.0 -- 44.3
Collingwood Member 7.9 8.7 8.4 8.6 6.5 -- 7.9
Cobourg 28.6 27.8 27.5 27.1 28.5 -- 27.9
Sherman Fall 28.0 28.9 28.3 29.3 28.8 -- 29.2
Kirkfield 45.9 45.8 45.7 -- 46.8 -- --
Coboconk 23.0 23.7 23.8 -- 22.4 -- --
Gull River 53.6 51.7 52.2 -- -- -- --
Shadow Lake 5.2 4.5 5.1 -- -- -- --
Cambrian 16.9 >13.7 >12.9 -- -- -- --
Precambrian -- -- -- -- -- -- --
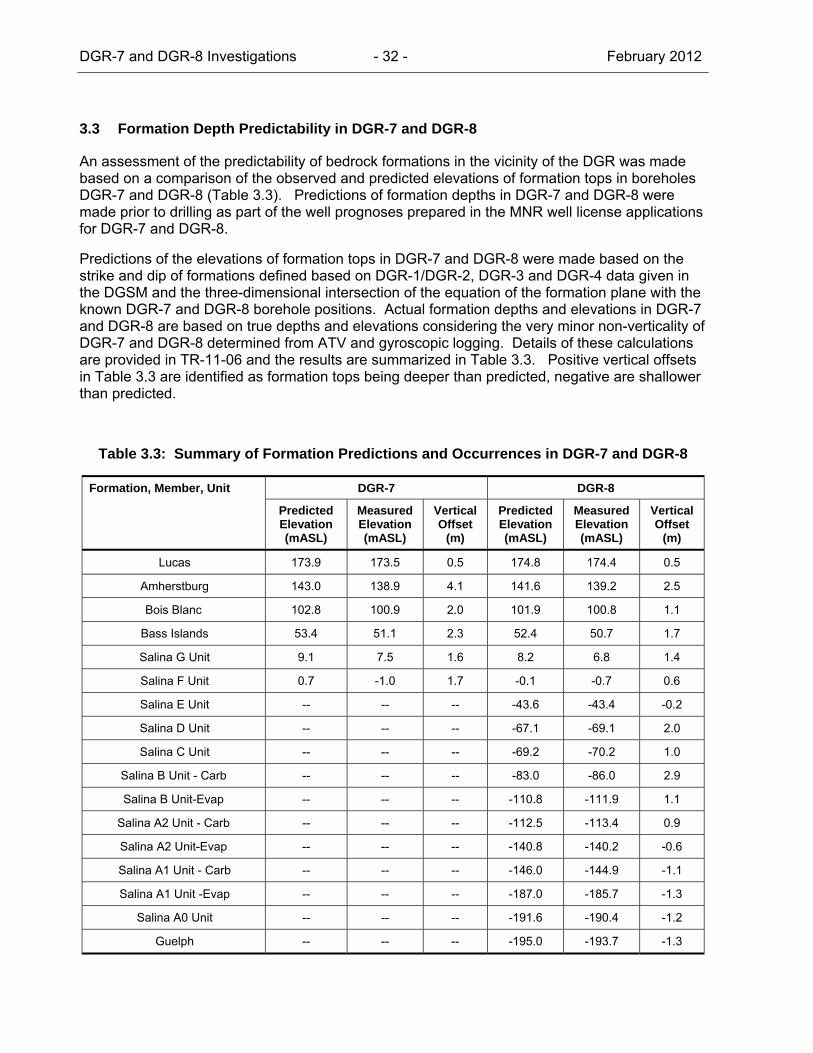
DGR-7 and DGR-8 Investigations - 32 - February 2012
3.3 Formation Depth Predictability in DGR-7 and DGR-8
An assessment of the predictability of bedrock formations in the vicinity of the DGR was made based on a comparison of the observed and predicted elevations of formation tops in boreholes DGR-7 and DGR-8 (Table 3.3). Predictions of formation depths in DGR-7 and DGR-8 were made prior to drilling as part of the well prognoses prepared in the MNR well license applications for DGR-7 and DGR-8.
Predictions of the elevations of formation tops in DGR-7 and DGR-8 were made based on the strike and dip of formations defined based on DGR-1/DGR-2, DGR-3 and DGR-4 data given in the DGSM and the three-dimensional intersection of the equation of the formation plane with the known DGR-7 and DGR-8 borehole positions. Actual formation depths and elevations in DGR-7 and DGR-8 are based on true depths and elevations considering the very minor non-verticality of DGR-7 and DGR-8 determined from ATV and gyroscopic logging. Details of these calculations are provided in TR-11-06 and the results are summarized in Table 3.3. Positive vertical offsets in Table 3.3 are identified as formation tops being deeper than predicted, negative are shallower than predicted.
Table 3.3: Summary of Formation Predictions and Occurrences in DGR-7 and DGR-8
Formation, Member, Unit DGR-7 DGR-8
Predicted Elevation (mASL)
Measured Elevation (mASL)
Vertical Offset
(m)
Predicted Elevation (mASL)
Measured Elevation (mASL)
Vertical Offset
(m)
Lucas 173.9 173.5 0.5 174.8 174.4 0.5
Amherstburg 143.0 138.9 4.1 141.6 139.2 2.5
Bois Blanc 102.8 100.9 2.0 101.9 100.8 1.1
Bass Islands 53.4 51.1 2.3 52.4 50.7 1.7
Salina G Unit 9.1 7.5 1.6 8.2 6.8 1.4
Salina F Unit 0.7 -1.0 1.7 -0.1 -0.7 0.6
Salina E Unit -- -- -- -43.6 -43.4 -0.2
Salina D Unit -- -- -- -67.1 -69.1 2.0
Salina C Unit -- -- -- -69.2 -70.2 1.0
Salina B Unit - Carb -- -- -- -83.0 -86.0 2.9
Salina B Unit-Evap -- -- -- -110.8 -111.9 1.1
Salina A2 Unit - Carb -- -- -- -112.5 -113.4 0.9
Salina A2 Unit-Evap -- -- -- -140.8 -140.2 -0.6
Salina A1 Unit - Carb -- -- -- -146.0 -144.9 -1.1
Salina A1 Unit -Evap -- -- -- -187.0 -185.7 -1.3
Salina A0 Unit -- -- -- -191.6 -190.4 -1.2
Guelph -- -- -- -195.0 -193.7 -1.3
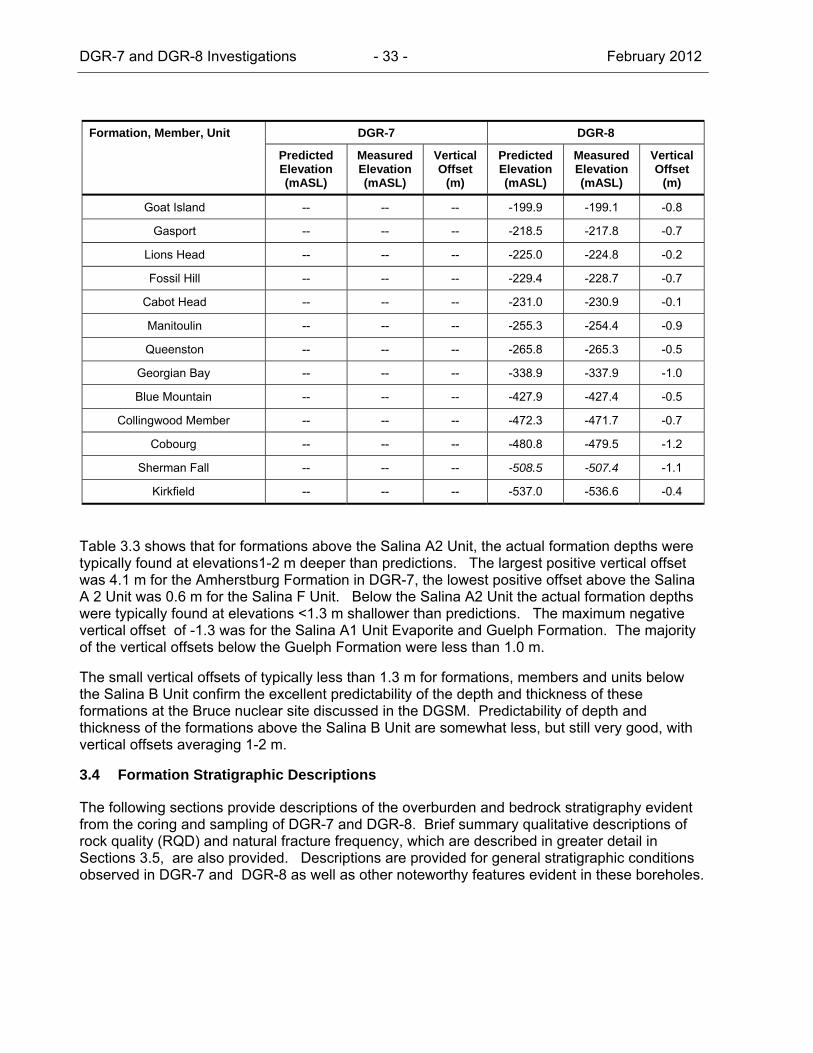
DGR-7 and DGR-8 Investigations - 33 - February 2012
Formation, Member, Unit DGR-7 DGR-8
Predicted Elevation (mASL)
Measured Elevation (mASL)
Vertical Offset
(m)
Predicted Elevation (mASL)
Measured Elevation (mASL)
Vertical Offset
(m)
Goat Island -- -- -- -199.9 -199.1 -0.8
Gasport -- -- -- -218.5 -217.8 -0.7
Lions Head -- -- -- -225.0 -224.8 -0.2
Fossil Hill -- -- -- -229.4 -228.7 -0.7
Cabot Head -- -- -- -231.0 -230.9 -0.1
Manitoulin -- -- -- -255.3 -254.4 -0.9
Queenston -- -- -- -265.8 -265.3 -0.5
Georgian Bay -- -- -- -338.9 -337.9 -1.0
Blue Mountain -- -- -- -427.9 -427.4 -0.5
Collingwood Member -- -- -- -472.3 -471.7 -0.7
Cobourg -- -- -- -480.8 -479.5 -1.2
Sherman Fall -- -- -- -508.5 -507.4 -1.1
Kirkfield -- -- -- -537.0 -536.6 -0.4
Table 3.3 shows that for formations above the Salina A2 Unit, the actual formation depths were typically found at elevations1-2 m deeper than predictions. The largest positive vertical offset was 4.1 m for the Amherstburg Formation in DGR-7, the lowest positive offset above the Salina A 2 Unit was 0.6 m for the Salina F Unit. Below the Salina A2 Unit the actual formation depths were typically found at elevations <1.3 m shallower than predictions. The maximum negative vertical offset of -1.3 was for the Salina A1 Unit Evaporite and Guelph Formation. The majority of the vertical offsets below the Guelph Formation were less than 1.0 m.
The small vertical offsets of typically less than 1.3 m for formations, members and units below the Salina B Unit confirm the excellent predictability of the depth and thickness of these formations at the Bruce nuclear site discussed in the DGSM. Predictability of depth and thickness of the formations above the Salina B Unit are somewhat less, but still very good, with vertical offsets averaging 1-2 m.
3.4 Formation Stratigraphic Descriptions
The following sections provide descriptions of the overburden and bedrock stratigraphy evident from the coring and sampling of DGR-7 and DGR-8. Brief summary qualitative descriptions of rock quality (RQD) and natural fracture frequency, which are described in greater detail in Sections 3.5, are also provided. Descriptions are provided for general stratigraphic conditions observed in DGR-7 and DGR-8 as well as other noteworthy features evident in these boreholes.
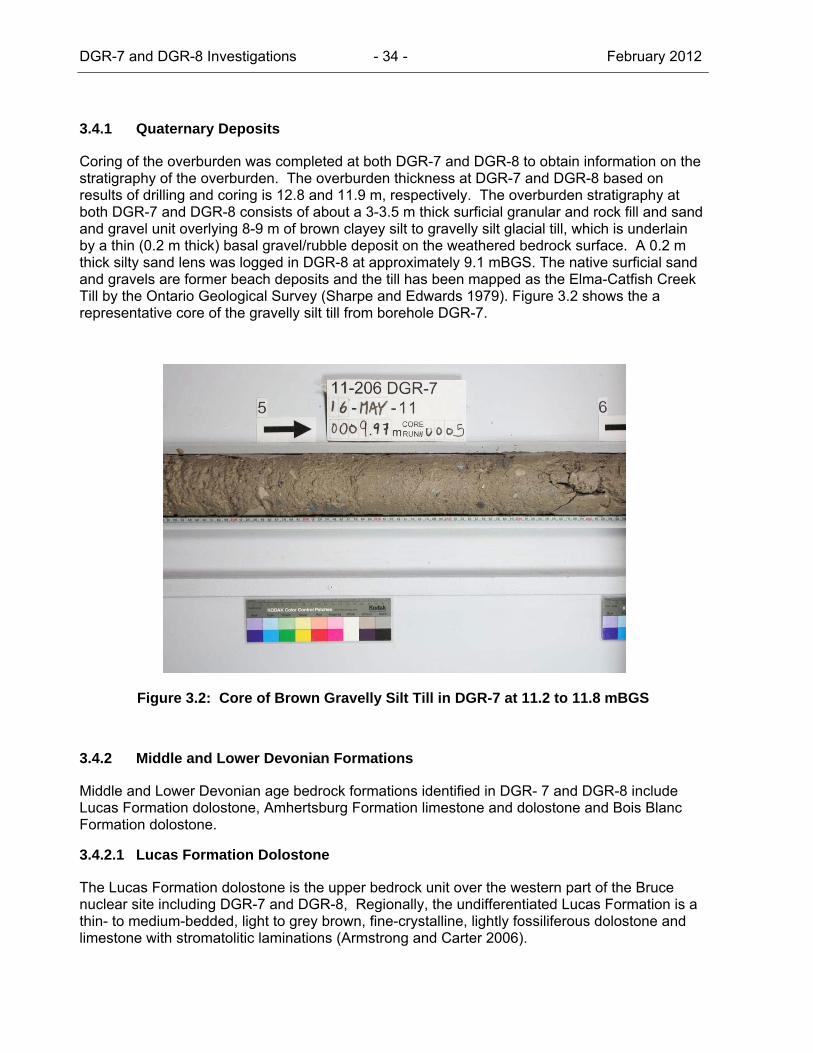
DGR-7 and DGR-8 Investigations - 34 - February 2012
3.4.1 Quaternary Deposits
Coring of the overburden was completed at both DGR-7 and DGR-8 to obtain information on the stratigraphy of the overburden. The overburden thickness at DGR-7 and DGR-8 based on results of drilling and coring is 12.8 and 11.9 m, respectively. The overburden stratigraphy at both DGR-7 and DGR-8 consists of about a 3-3.5 m thick surficial granular and rock fill and sand and gravel unit overlying 8-9 m of brown clayey silt to gravelly silt glacial till, which is underlain by a thin (0.2 m thick) basal gravel/rubble deposit on the weathered bedrock surface. A 0.2 m thick silty sand lens was logged in DGR-8 at approximately 9.1 mBGS. The native surficial sand and gravels are former beach deposits and the till has been mapped as the Elma-Catfish Creek Till by the Ontario Geological Survey (Sharpe and Edwards 1979). Figure 3.2 shows the a representative core of the gravelly silt till from borehole DGR-7.
Figure 3.2: Core of Brown Gravelly Silt Till in DGR-7 at 11.2 to 11.8 mBGS
3.4.2 Middle and Lower Devonian Formations
Middle and Lower Devonian age bedrock formations identified in DGR- 7 and DGR-8 include Lucas Formation dolostone, Amhertsburg Formation limestone and dolostone and Bois Blanc Formation dolostone.
3.4.2.1 Lucas Formation Dolostone
The Lucas Formation dolostone is the upper bedrock unit over the western part of the Bruce nuclear site including DGR-7 and DGR-8, Regionally, the undifferentiated Lucas Formation is a thin- to medium-bedded, light to grey brown, fine-crystalline, lightly fossiliferous dolostone and limestone with stromatolitic laminations (Armstrong and Carter 2006).

DGR-7 and DGR-8 Investigations - 35 - February 2012
The Lucas Formation is logged in boreholes DGR-7 and DGR-8 as brownish-grey, fine-grained, hard dolostone with bituminous stromatolitic laminae (Figure 3.3). The erosional surface is found in DGR-7 and DGR-8 at true vertical depths of 12.8 and 11.9 mBGS (TR-11-06), indicating an eroded formation thickness of 34.5 and 35.2 m, respectively. RQD and natural fracture frequency data indicate fair to good core quality and moderately fractured conditions for the Lucas Formation in DGR-7 and DGR-8.
Figure 3.3: Lucas Formation Dolostone at 26.4 - 26.9 mBGS in DGR-7 Showing Bituminous Stromatolitic Laminae
3.4.2.2 Amherstburg Formation Dolostone
Regionally, the Amhertsburg Formation is a tan to grey-brown, fine- to coarse-grained, bituminous, bioclastic, fossiliferous limestone and dolostone with vuggy horizons and frequent open weathered fractures and brecciated zones (Armstrong and Carter 2006). At the Bruce nuclear site, the Amherstburg Formation is a dolostone characterized by the presence of abundant rugose and tabulate corals, especially in the bottom 5 to 10 m of the formation (DGSM).
The Amherstburg Formation is logged in boreholes DGR-7 and DGR-8 as brown-grey, fine- to medium grained, fossiliferous dolostone with increasing chert content with depth. The formation is found in DGR-7 and DGR-8 at true vertical depths of 47.3 and 47.1 mBGS (TR-11-06), indicating formation thickness of 38.0 and 38.4 m, respectively. RQD and natural fracture frequency data indicate good to excellent core quality and moderately fractured conditions for the
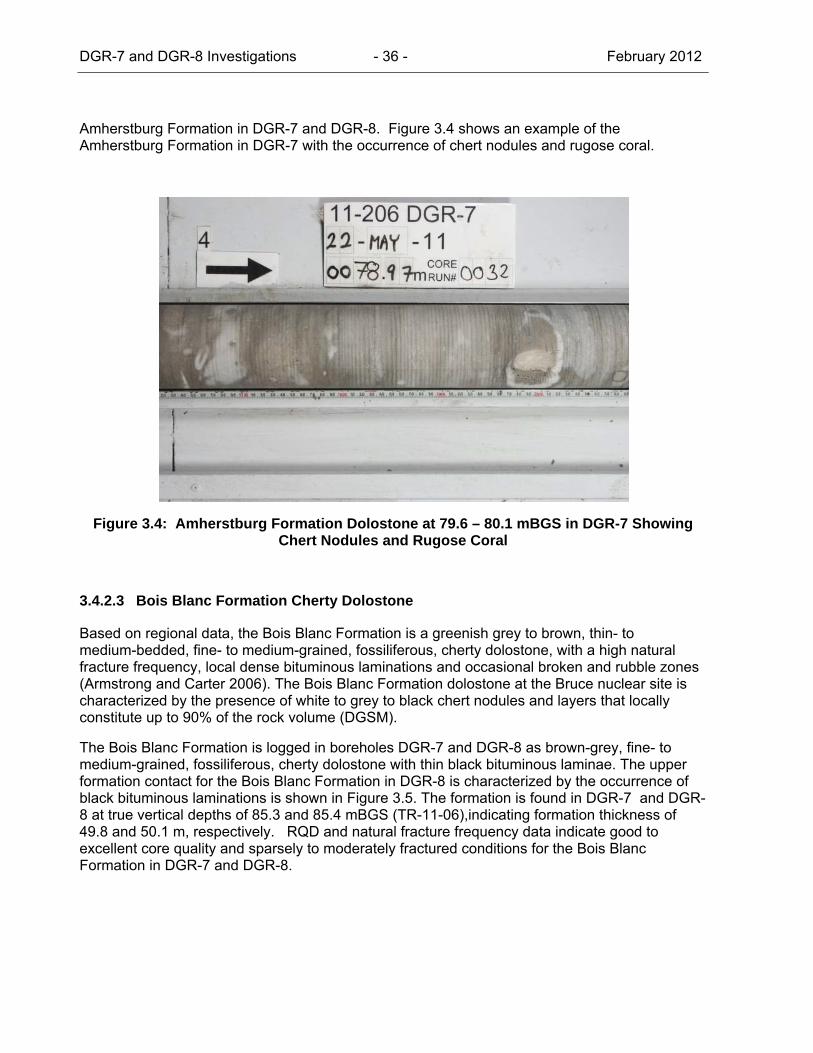
DGR-7 and DGR-8 Investigations - 36 - February 2012
Amherstburg Formation in DGR-7 and DGR-8. Figure 3.4 shows an example of the Amherstburg Formation in DGR-7 with the occurrence of chert nodules and rugose coral.
Figure 3.4: Amherstburg Formation Dolostone at 79.6 – 80.1 mBGS in DGR-7 Showing Chert Nodules and Rugose Coral
3.4.2.3 Bois Blanc Formation Cherty Dolostone
Based on regional data, the Bois Blanc Formation is a greenish grey to brown, thin- to medium-bedded, fine- to medium-grained, fossiliferous, cherty dolostone, with a high natural fracture frequency, local dense bituminous laminations and occasional broken and rubble zones (Armstrong and Carter 2006). The Bois Blanc Formation dolostone at the Bruce nuclear site is characterized by the presence of white to grey to black chert nodules and layers that locally constitute up to 90% of the rock volume (DGSM).
The Bois Blanc Formation is logged in boreholes DGR-7 and DGR-8 as brown-grey, fine- to medium-grained, fossiliferous, cherty dolostone with thin black bituminous laminae. The upper formation contact for the Bois Blanc Formation in DGR-8 is characterized by the occurrence of black bituminous laminations is shown in Figure 3.5. The formation is found in DGR-7 and DGR-8 at true vertical depths of 85.3 and 85.4 mBGS (TR-11-06),indicating formation thickness of 49.8 and 50.1 m, respectively. RQD and natural fracture frequency data indicate good to excellent core quality and sparsely to moderately fractured conditions for the Bois Blanc Formation in DGR-7 and DGR-8.
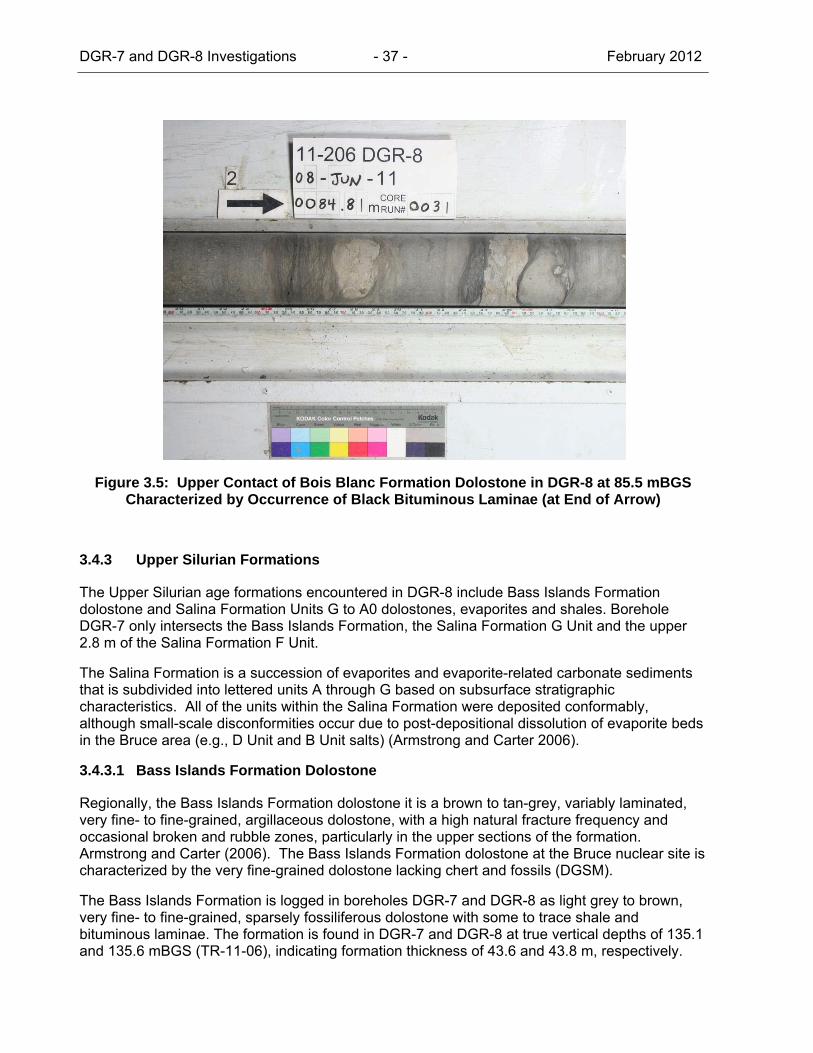
DGR-7 and DGR-8 Investigations - 37 - February 2012
Figure 3.5: Upper Contact of Bois Blanc Formation Dolostone in DGR-8 at 85.5 mBGS Characterized by Occurrence of Black Bituminous Laminae (at End of Arrow)
3.4.3 Upper Silurian Formations
The Upper Silurian age formations encountered in DGR-8 include Bass Islands Formation dolostone and Salina Formation Units G to A0 dolostones, evaporites and shales. Borehole DGR-7 only intersects the Bass Islands Formation, the Salina Formation G Unit and the upper 2.8 m of the Salina Formation F Unit.
The Salina Formation is a succession of evaporites and evaporite-related carbonate sediments that is subdivided into lettered units A through G based on subsurface stratigraphic characteristics. All of the units within the Salina Formation were deposited conformably, although small-scale disconformities occur due to post-depositional dissolution of evaporite beds in the Bruce area (e.g., D Unit and B Unit salts) (Armstrong and Carter 2006).
3.4.3.1 Bass Islands Formation Dolostone
Regionally, the Bass Islands Formation dolostone it is a brown to tan-grey, variably laminated, very fine- to fine-grained, argillaceous dolostone, with a high natural fracture frequency and occasional broken and rubble zones, particularly in the upper sections of the formation. Armstrong and Carter (2006). The Bass Islands Formation dolostone at the Bruce nuclear site is characterized by the very fine-grained dolostone lacking chert and fossils (DGSM).
The Bass Islands Formation is logged in boreholes DGR-7 and DGR-8 as light grey to brown, very fine- to fine-grained, sparsely fossiliferous dolostone with some to trace shale and bituminous laminae. The formation is found in DGR-7 and DGR-8 at true vertical depths of 135.1 and 135.6 mBGS (TR-11-06), indicating formation thickness of 43.6 and 43.8 m, respectively.

DGR-7 and DGR-8 Investigations - 38 - February 2012
RQD and natural fracture frequency data indicate fair to good core quality and moderately fractured conditions for the Bass Islands Formation in DGR-7 and DGR-8. Figure 3.6 shows an example of thin rubble zone found in the lower part of the Bass Islands Formation in DGR-8.
Figure 3.6: Thin Rubble Zone in Bass Islands Formation Dolostone at 166.3 – 166.7 mBGS in DGR-8
3.4.3.2 Salina Formation, G Unit Argillaceous Dolostone
Regionally, the Salina Formation G Unit is a tan to grey, argillaceous dolostone, with shale and anhydrite layers (Armstrong and Carter 2006). The G Unit dolostone at the Bruce nuclear site is identified by the first presence of white, orange and pink anhydrite layers and nodules (DGSM).
The Salina Formation G Unit is logged in boreholes DGR-7 and DGR-8 as brown, fine-grained dolostone and argillaceous dolostone interlayered with grey/blue to grey dolomitic shale with anhydrite and gypsum veins. White, orange and pink anhydrite/gypsum veins and layers are present through the Unit as secondary infilling of healed fractures. The G Unit is found in DGR-7 and DGR-8 at true vertical depths of 178.7 and 179.4 mBGS (TR-11-06), indicating formation thickness of 8.5 and 7.6 m, respectively. RQD and natural fracture frequency data indicate fair to good core quality and moderately fractured conditions for the Salina G Unit dolostone in DGR-7 and DGR-8. Based on the elevated natural fracture frequency in DGR-8 (see Figure 3.7), there is greater brecciation present in the G Unit at DGR-8 than in other DGR boreholes.
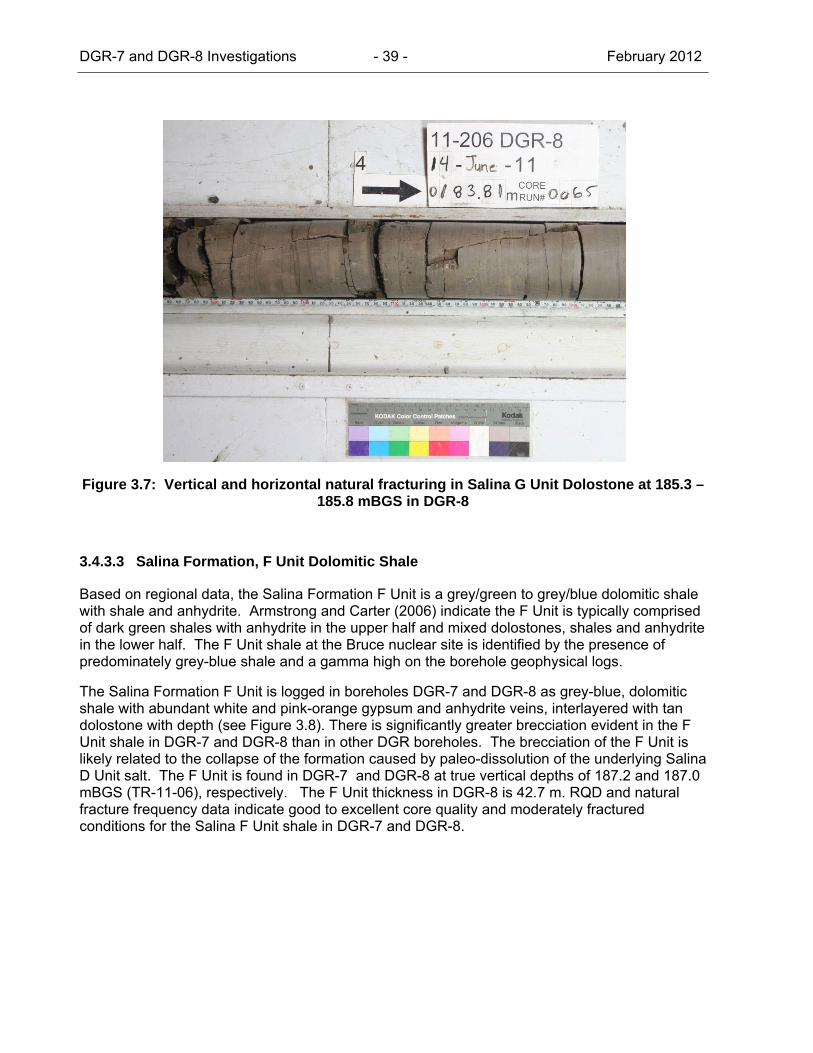
DGR-7 and DGR-8 Investigations - 39 - February 2012
Figure 3.7: Vertical and horizontal natural fracturing in Salina G Unit Dolostone at 185.3 – 185.8 mBGS in DGR-8
3.4.3.3 Salina Formation, F Unit Dolomitic Shale
Based on regional data, the Salina Formation F Unit is a grey/green to grey/blue dolomitic shale with shale and anhydrite. Armstrong and Carter (2006) indicate the F Unit is typically comprised of dark green shales with anhydrite in the upper half and mixed dolostones, shales and anhydrite in the lower half. The F Unit shale at the Bruce nuclear site is identified by the presence of predominately grey-blue shale and a gamma high on the borehole geophysical logs.
The Salina Formation F Unit is logged in boreholes DGR-7 and DGR-8 as grey-blue, dolomitic shale with abundant white and pink-orange gypsum and anhydrite veins, interlayered with tan dolostone with depth (see Figure 3.8). There is significantly greater brecciation evident in the F Unit shale in DGR-7 and DGR-8 than in other DGR boreholes. The brecciation of the F Unit is likely related to the collapse of the formation caused by paleo-dissolution of the underlying Salina D Unit salt. The F Unit is found in DGR-7 and DGR-8 at true vertical depths of 187.2 and 187.0 mBGS (TR-11-06), respectively. The F Unit thickness in DGR-8 is 42.7 m. RQD and natural fracture frequency data indicate good to excellent core quality and moderately fractured conditions for the Salina F Unit shale in DGR-7 and DGR-8.
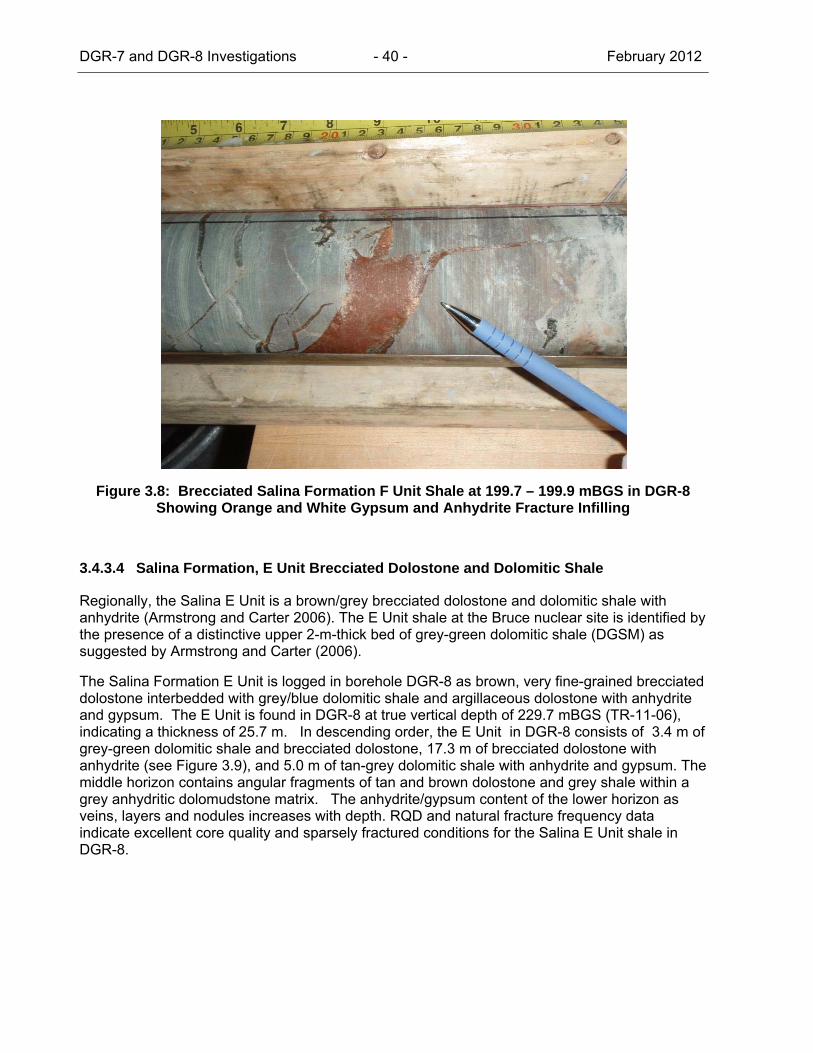
DGR-7 and DGR-8 Investigations - 40 - February 2012
Figure 3.8: Brecciated Salina Formation F Unit Shale at 199.7 – 199.9 mBGS in DGR-8 Showing Orange and White Gypsum and Anhydrite Fracture Infilling
3.4.3.4 Salina Formation, E Unit Brecciated Dolostone and Dolomitic Shale
Regionally, the Salina E Unit is a brown/grey brecciated dolostone and dolomitic shale with anhydrite (Armstrong and Carter 2006). The E Unit shale at the Bruce nuclear site is identified by the presence of a distinctive upper 2-m-thick bed of grey-green dolomitic shale (DGSM) as suggested by Armstrong and Carter (2006).
The Salina Formation E Unit is logged in borehole DGR-8 as brown, very fine-grained brecciated dolostone interbedded with grey/blue dolomitic shale and argillaceous dolostone with anhydrite and gypsum. The E Unit is found in DGR-8 at true vertical depth of 229.7 mBGS (TR-11-06), indicating a thickness of 25.7 m. In descending order, the E Unit in DGR-8 consists of 3.4 m of grey-green dolomitic shale and brecciated dolostone, 17.3 m of brecciated dolostone with anhydrite (see Figure 3.9), and 5.0 m of tan-grey dolomitic shale with anhydrite and gypsum. The middle horizon contains angular fragments of tan and brown dolostone and grey shale within a grey anhydritic dolomudstone matrix. The anhydrite/gypsum content of the lower horizon as veins, layers and nodules increases with depth. RQD and natural fracture frequency data indicate excellent core quality and sparsely fractured conditions for the Salina E Unit shale in DGR-8.

DGR-7 and DGR-8 Investigations - 41 - February 2012
Figure 3.9: Grey Brecciated Dolostone with Anhydrite of the Salina Formation E Unit at 243.8 mBGS in DGR-8
3.4.3.5 Salina Formation, D Unit Anhydritic Dolostone and C Unit Dolomitic Shale and Shale
The Salina D Unit at the Bruce nuclear site is a thin blue-grey to brown anhydritic dolostone that represents the less soluble or non-salt constituents of the D Unit salt bed that has been dissolved in the geologic past. Armstrong and Carter (2006) indicate the D Unit salt is up to 16 m thick elsewhere in Ontario, where the salt is preserved and that the C Unit is an inter-layered red and green-grey shale with anhydrite veins and nodules that grades into a dolomitic shale or dolomite with depth.
The Salina Formation D Unit is logged in borehole DGR-8 as light grey/blue, fine-grained anhydritic dolostone. The D Unit is found in DGR-8 at true vertical depth of 255.4 mBGS (TR-11-06), indicating a thickness of 1.1 m. The Salina Formation C Unit is logged in borehole DGR-8 as grey/blue, massive to laminated dolomitic shale with trace to some anhydrite and gypsum nodules, laminae and thin beds. The C Unit is found in DGR-8 at true vertical depth of 256.5 mBGS (TR-11-06), indicating a thickness of 15.7 m. RQD and natural fracture frequency data indicate excellent core quality and unfractured to very sparsely fractured conditions for the combined Salina D and C Units in DGR-8.
3.4.3.6 Salina Formation, B Unit Argillaceous Dolostone and Evaporite
Regionally, the B Unit comprises a grey-green argillaceous dolostone, a salt horizon and an underlying thin evaporite (i.e., anhydrite) and dolostone layer. Armstrong and Carter (2006) also indicate the B Unit is up to 90 m thick where it contains salt. The brecciation of the upper dolostone of the B Unit at the Bruce nuclear site, reflects the dissolution of the formerly
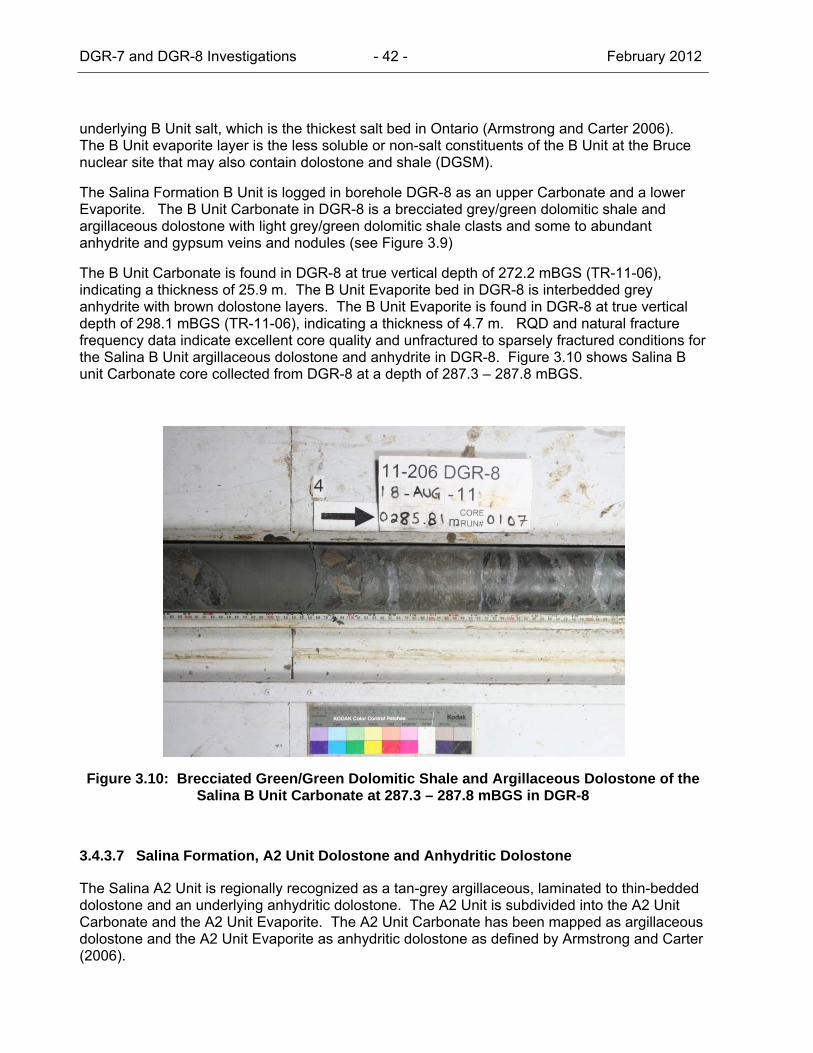
DGR-7 and DGR-8 Investigations - 42 - February 2012
underlying B Unit salt, which is the thickest salt bed in Ontario (Armstrong and Carter 2006). The B Unit evaporite layer is the less soluble or non-salt constituents of the B Unit at the Bruce nuclear site that may also contain dolostone and shale (DGSM).
The Salina Formation B Unit is logged in borehole DGR-8 as an upper Carbonate and a lower Evaporite. The B Unit Carbonate in DGR-8 is a brecciated grey/green dolomitic shale and argillaceous dolostone with light grey/green dolomitic shale clasts and some to abundant anhydrite and gypsum veins and nodules (see Figure 3.9)
The B Unit Carbonate is found in DGR-8 at true vertical depth of 272.2 mBGS (TR-11-06), indicating a thickness of 25.9 m. The B Unit Evaporite bed in DGR-8 is interbedded grey anhydrite with brown dolostone layers. The B Unit Evaporite is found in DGR-8 at true vertical depth of 298.1 mBGS (TR-11-06), indicating a thickness of 4.7 m. RQD and natural fracture frequency data indicate excellent core quality and unfractured to sparsely fractured conditions for the Salina B Unit argillaceous dolostone and anhydrite in DGR-8. Figure 3.10 shows Salina B unit Carbonate core collected from DGR-8 at a depth of 287.3 – 287.8 mBGS.
Figure 3.10: Brecciated Green/Green Dolomitic Shale and Argillaceous Dolostone of the Salina B Unit Carbonate at 287.3 – 287.8 mBGS in DGR-8
3.4.3.7 Salina Formation, A2 Unit Dolostone and Anhydritic Dolostone
The Salina A2 Unit is regionally recognized as a tan-grey argillaceous, laminated to thin-bedded dolostone and an underlying anhydritic dolostone. The A2 Unit is subdivided into the A2 Unit Carbonate and the A2 Unit Evaporite. The A2 Unit Carbonate has been mapped as argillaceous dolostone and the A2 Unit Evaporite as anhydritic dolostone as defined by Armstrong and Carter (2006).
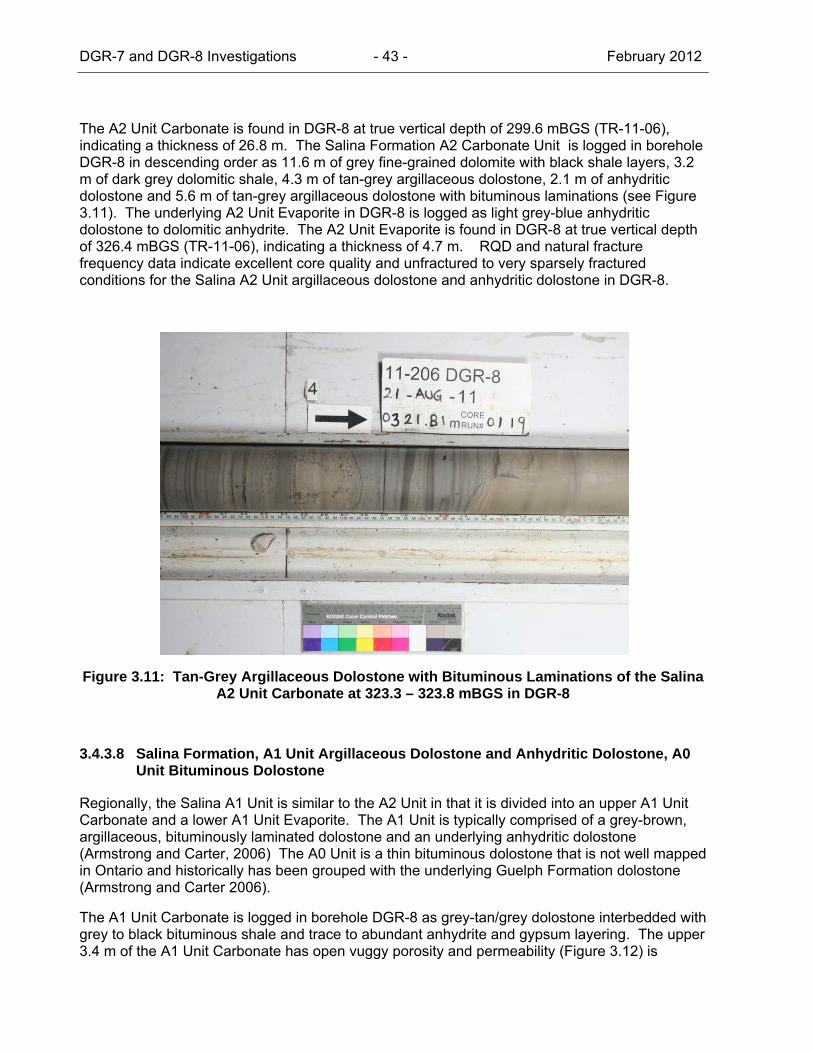
DGR-7 and DGR-8 Investigations - 43 - February 2012
The A2 Unit Carbonate is found in DGR-8 at true vertical depth of 299.6 mBGS (TR-11-06), indicating a thickness of 26.8 m. The Salina Formation A2 Carbonate Unit is logged in borehole DGR-8 in descending order as 11.6 m of grey fine-grained dolomite with black shale layers, 3.2 m of dark grey dolomitic shale, 4.3 m of tan-grey argillaceous dolostone, 2.1 m of anhydritic dolostone and 5.6 m of tan-grey argillaceous dolostone with bituminous laminations (see Figure 3.11). The underlying A2 Unit Evaporite in DGR-8 is logged as light grey-blue anhydritic dolostone to dolomitic anhydrite. The A2 Unit Evaporite is found in DGR-8 at true vertical depth of 326.4 mBGS (TR-11-06), indicating a thickness of 4.7 m. RQD and natural fracture frequency data indicate excellent core quality and unfractured to very sparsely fractured conditions for the Salina A2 Unit argillaceous dolostone and anhydritic dolostone in DGR-8.
Figure 3.11: Tan-Grey Argillaceous Dolostone with Bituminous Laminations of the Salina A2 Unit Carbonate at 323.3 – 323.8 mBGS in DGR-8
3.4.3.8 Salina Formation, A1 Unit Argillaceous Dolostone and Anhydritic Dolostone, A0 Unit Bituminous Dolostone
Regionally, the Salina A1 Unit is similar to the A2 Unit in that it is divided into an upper A1 Unit Carbonate and a lower A1 Unit Evaporite. The A1 Unit is typically comprised of a grey-brown, argillaceous, bituminously laminated dolostone and an underlying anhydritic dolostone (Armstrong and Carter, 2006) The A0 Unit is a thin bituminous dolostone that is not well mapped in Ontario and historically has been grouped with the underlying Guelph Formation dolostone (Armstrong and Carter 2006).
The A1 Unit Carbonate is logged in borehole DGR-8 as grey-tan/grey dolostone interbedded with grey to black bituminous shale and trace to abundant anhydrite and gypsum layering. The upper 3.4 m of the A1 Unit Carbonate has open vuggy porosity and permeability (Figure 3.12) is
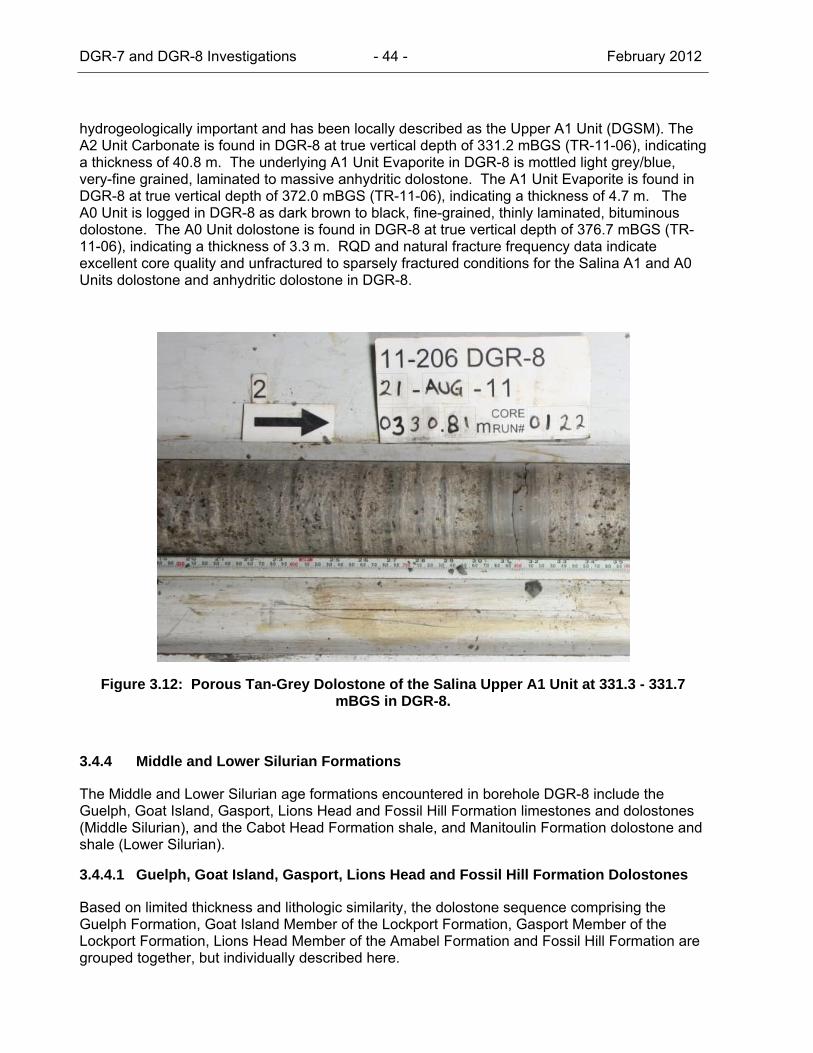
DGR-7 and DGR-8 Investigations - 44 - February 2012
hydrogeologically important and has been locally described as the Upper A1 Unit (DGSM). The A2 Unit Carbonate is found in DGR-8 at true vertical depth of 331.2 mBGS (TR-11-06), indicating a thickness of 40.8 m. The underlying A1 Unit Evaporite in DGR-8 is mottled light grey/blue, very-fine grained, laminated to massive anhydritic dolostone. The A1 Unit Evaporite is found in DGR-8 at true vertical depth of 372.0 mBGS (TR-11-06), indicating a thickness of 4.7 m. The A0 Unit is logged in DGR-8 as dark brown to black, fine-grained, thinly laminated, bituminous dolostone. The A0 Unit dolostone is found in DGR-8 at true vertical depth of 376.7 mBGS (TR-11-06), indicating a thickness of 3.3 m. RQD and natural fracture frequency data indicate excellent core quality and unfractured to sparsely fractured conditions for the Salina A1 and A0 Units dolostone and anhydritic dolostone in DGR-8.
Figure 3.12: Porous Tan-Grey Dolostone of the Salina Upper A1 Unit at 331.3 - 331.7 mBGS in DGR-8.
3.4.4 Middle and Lower Silurian Formations
The Middle and Lower Silurian age formations encountered in borehole DGR-8 include the Guelph, Goat Island, Gasport, Lions Head and Fossil Hill Formation limestones and dolostones (Middle Silurian), and the Cabot Head Formation shale, and Manitoulin Formation dolostone and shale (Lower Silurian).
3.4.4.1 Guelph, Goat Island, Gasport, Lions Head and Fossil Hill Formation Dolostones
Based on limited thickness and lithologic similarity, the dolostone sequence comprising the Guelph Formation, Goat Island Member of the Lockport Formation, Gasport Member of the Lockport Formation, Lions Head Member of the Amabel Formation and Fossil Hill Formation are grouped together, but individually described here.
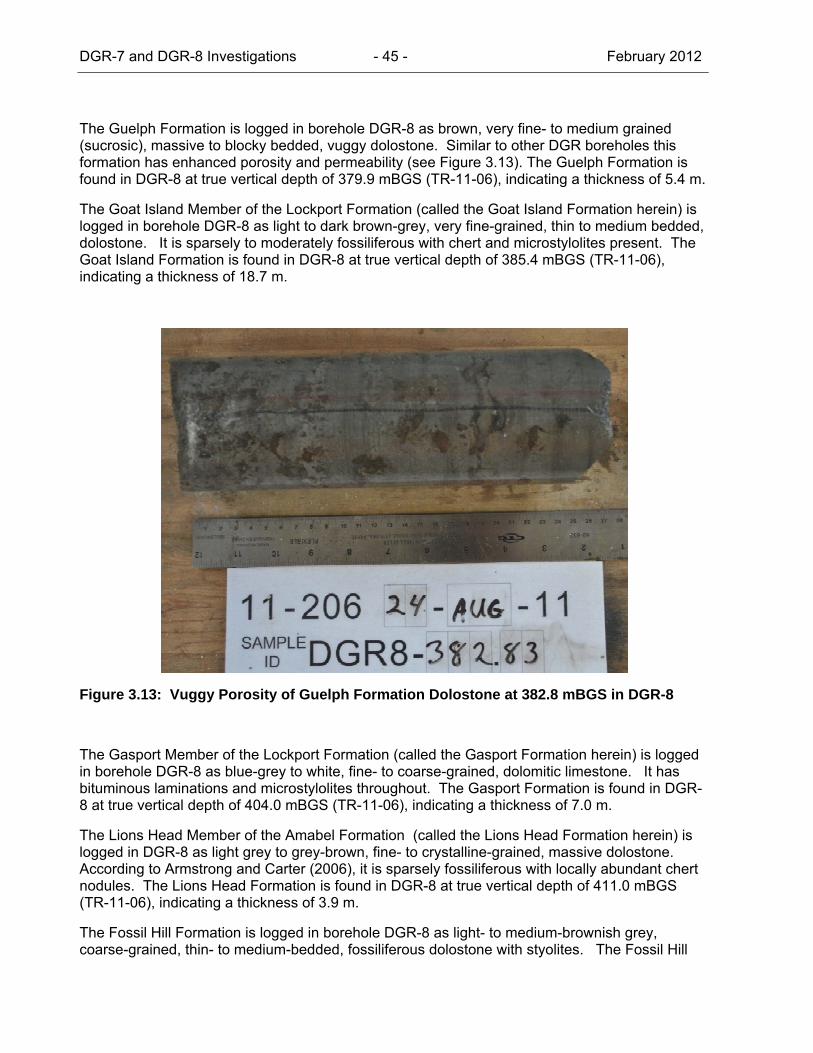
DGR-7 and DGR-8 Investigations - 45 - February 2012
The Guelph Formation is logged in borehole DGR-8 as brown, very fine- to medium grained (sucrosic), massive to blocky bedded, vuggy dolostone. Similar to other DGR boreholes this formation has enhanced porosity and permeability (see Figure 3.13). The Guelph Formation is found in DGR-8 at true vertical depth of 379.9 mBGS (TR-11-06), indicating a thickness of 5.4 m.
The Goat Island Member of the Lockport Formation (called the Goat Island Formation herein) is logged in borehole DGR-8 as light to dark brown-grey, very fine-grained, thin to medium bedded, dolostone. It is sparsely to moderately fossiliferous with chert and microstylolites present. The Goat Island Formation is found in DGR-8 at true vertical depth of 385.4 mBGS (TR-11-06), indicating a thickness of 18.7 m.
Figure 3.13: Vuggy Porosity of Guelph Formation Dolostone at 382.8 mBGS in DGR-8
The Gasport Member of the Lockport Formation (called the Gasport Formation herein) is logged in borehole DGR-8 as blue-grey to white, fine- to coarse-grained, dolomitic limestone. It has bituminous laminations and microstylolites throughout. The Gasport Formation is found in DGR-8 at true vertical depth of 404.0 mBGS (TR-11-06), indicating a thickness of 7.0 m.
The Lions Head Member of the Amabel Formation (called the Lions Head Formation herein) is logged in DGR-8 as light grey to grey-brown, fine- to crystalline-grained, massive dolostone. According to Armstrong and Carter (2006), it is sparsely fossiliferous with locally abundant chert nodules. The Lions Head Formation is found in DGR-8 at true vertical depth of 411.0 mBGS (TR-11-06), indicating a thickness of 3.9 m.
The Fossil Hill Formation is logged in borehole DGR-8 as light- to medium-brownish grey, coarse-grained, thin- to medium-bedded, fossiliferous dolostone with styolites. The Fossil Hill
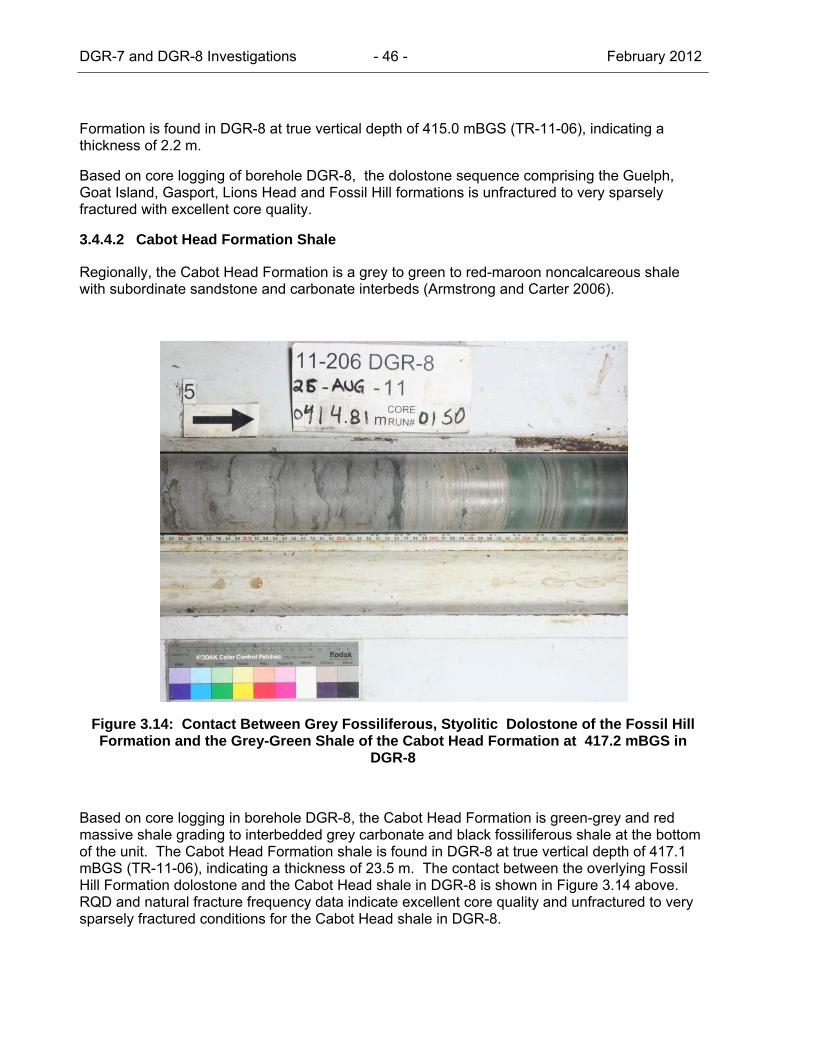
DGR-7 and DGR-8 Investigations - 46 - February 2012
Formation is found in DGR-8 at true vertical depth of 415.0 mBGS (TR-11-06), indicating a thickness of 2.2 m.
Based on core logging of borehole DGR-8, the dolostone sequence comprising the Guelph, Goat Island, Gasport, Lions Head and Fossil Hill formations is unfractured to very sparsely fractured with excellent core quality.
3.4.4.2 Cabot Head Formation Shale
Regionally, the Cabot Head Formation is a grey to green to red-maroon noncalcareous shale with subordinate sandstone and carbonate interbeds (Armstrong and Carter 2006).
Figure 3.14: Contact Between Grey Fossiliferous, Styolitic Dolostone of the Fossil Hill Formation and the Grey-Green Shale of the Cabot Head Formation at 417.2 mBGS in
DGR-8
Based on core logging in borehole DGR-8, the Cabot Head Formation is green-grey and red massive shale grading to interbedded grey carbonate and black fossiliferous shale at the bottom of the unit. The Cabot Head Formation shale is found in DGR-8 at true vertical depth of 417.1 mBGS (TR-11-06), indicating a thickness of 23.5 m. The contact between the overlying Fossil Hill Formation dolostone and the Cabot Head shale in DGR-8 is shown in Figure 3.14 above. RQD and natural fracture frequency data indicate excellent core quality and unfractured to very sparsely fractured conditions for the Cabot Head shale in DGR-8.
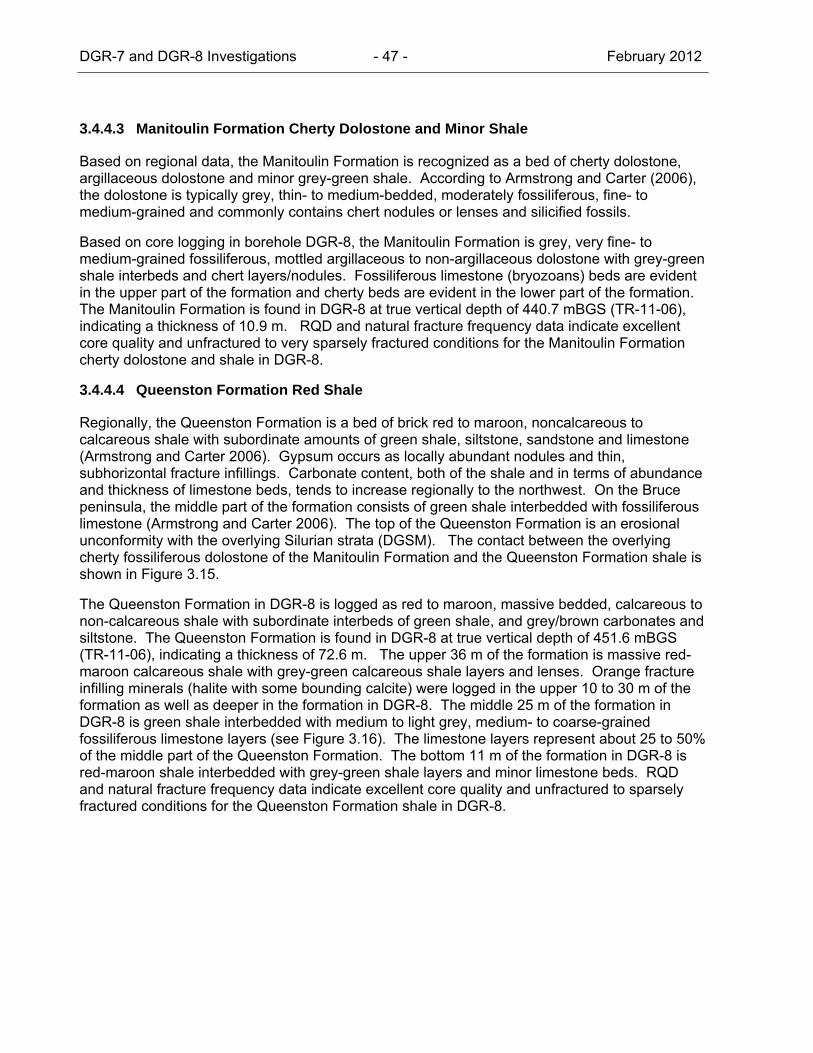
DGR-7 and DGR-8 Investigations - 47 - February 2012
3.4.4.3 Manitoulin Formation Cherty Dolostone and Minor Shale
Based on regional data, the Manitoulin Formation is recognized as a bed of cherty dolostone, argillaceous dolostone and minor grey-green shale. According to Armstrong and Carter (2006), the dolostone is typically grey, thin- to medium-bedded, moderately fossiliferous, fine- to medium-grained and commonly contains chert nodules or lenses and silicified fossils.
Based on core logging in borehole DGR-8, the Manitoulin Formation is grey, very fine- to medium-grained fossiliferous, mottled argillaceous to non-argillaceous dolostone with grey-green shale interbeds and chert layers/nodules. Fossiliferous limestone (bryozoans) beds are evident in the upper part of the formation and cherty beds are evident in the lower part of the formation. The Manitoulin Formation is found in DGR-8 at true vertical depth of 440.7 mBGS (TR-11-06), indicating a thickness of 10.9 m. RQD and natural fracture frequency data indicate excellent core quality and unfractured to very sparsely fractured conditions for the Manitoulin Formation cherty dolostone and shale in DGR-8.
3.4.4.4 Queenston Formation Red Shale
Regionally, the Queenston Formation is a bed of brick red to maroon, noncalcareous to calcareous shale with subordinate amounts of green shale, siltstone, sandstone and limestone (Armstrong and Carter 2006). Gypsum occurs as locally abundant nodules and thin, subhorizontal fracture infillings. Carbonate content, both of the shale and in terms of abundance and thickness of limestone beds, tends to increase regionally to the northwest. On the Bruce peninsula, the middle part of the formation consists of green shale interbedded with fossiliferous limestone (Armstrong and Carter 2006). The top of the Queenston Formation is an erosional unconformity with the overlying Silurian strata (DGSM). The contact between the overlying cherty fossiliferous dolostone of the Manitoulin Formation and the Queenston Formation shale is shown in Figure 3.15.
The Queenston Formation in DGR-8 is logged as red to maroon, massive bedded, calcareous to non-calcareous shale with subordinate interbeds of green shale, and grey/brown carbonates and siltstone. The Queenston Formation is found in DGR-8 at true vertical depth of 451.6 mBGS (TR-11-06), indicating a thickness of 72.6 m. The upper 36 m of the formation is massive red-maroon calcareous shale with grey-green calcareous shale layers and lenses. Orange fracture infilling minerals (halite with some bounding calcite) were logged in the upper 10 to 30 m of the formation as well as deeper in the formation in DGR-8. The middle 25 m of the formation in DGR-8 is green shale interbedded with medium to light grey, medium- to coarse-grained fossiliferous limestone layers (see Figure 3.16). The limestone layers represent about 25 to 50% of the middle part of the Queenston Formation. The bottom 11 m of the formation in DGR-8 is red-maroon shale interbedded with grey-green shale layers and minor limestone beds. RQD and natural fracture frequency data indicate excellent core quality and unfractured to sparsely fractured conditions for the Queenston Formation shale in DGR-8.
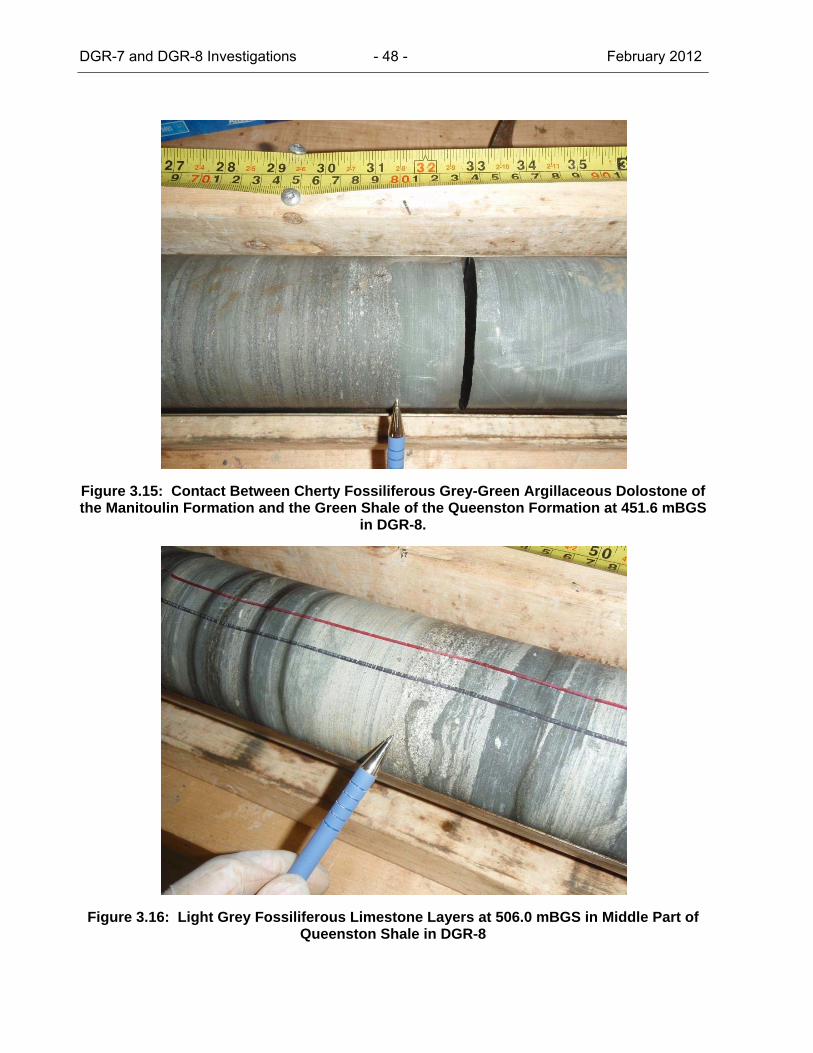
DGR-7 and DGR-8 Investigations - 48 - February 2012
Figure 3.15: Contact Between Cherty Fossiliferous Grey-Green Argillaceous Dolostone of the Manitoulin Formation and the Green Shale of the Queenston Formation at 451.6 mBGS
in DGR-8.
Figure 3.16: Light Grey Fossiliferous Limestone Layers at 506.0 mBGS in Middle Part of Queenston Shale in DGR-8
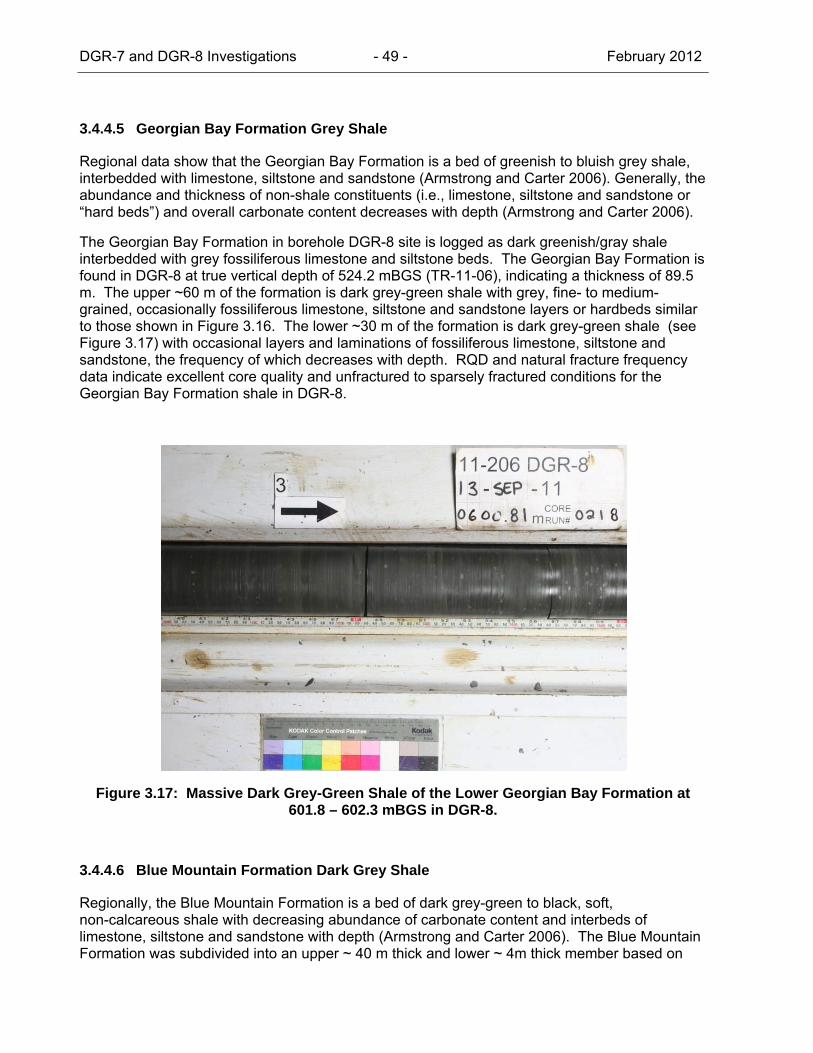
DGR-7 and DGR-8 Investigations - 49 - February 2012
3.4.4.5 Georgian Bay Formation Grey Shale
Regional data show that the Georgian Bay Formation is a bed of greenish to bluish grey shale, interbedded with limestone, siltstone and sandstone (Armstrong and Carter 2006). Generally, the abundance and thickness of non-shale constituents (i.e., limestone, siltstone and sandstone or “hard beds”) and overall carbonate content decreases with depth (Armstrong and Carter 2006).
The Georgian Bay Formation in borehole DGR-8 site is logged as dark greenish/gray shale interbedded with grey fossiliferous limestone and siltstone beds. The Georgian Bay Formation is found in DGR-8 at true vertical depth of 524.2 mBGS (TR-11-06), indicating a thickness of 89.5 m. The upper ~60 m of the formation is dark grey-green shale with grey, fine- to medium-grained, occasionally fossiliferous limestone, siltstone and sandstone layers or hardbeds similar to those shown in Figure 3.16. The lower ~30 m of the formation is dark grey-green shale (see Figure 3.17) with occasional layers and laminations of fossiliferous limestone, siltstone and sandstone, the frequency of which decreases with depth. RQD and natural fracture frequency data indicate excellent core quality and unfractured to sparsely fractured conditions for the Georgian Bay Formation shale in DGR-8.
Figure 3.17: Massive Dark Grey-Green Shale of the Lower Georgian Bay Formation at 601.8 – 602.3 mBGS in DGR-8.
3.4.4.6 Blue Mountain Formation Dark Grey Shale
Regionally, the Blue Mountain Formation is a bed of dark grey-green to black, soft, non-calcareous shale with decreasing abundance of carbonate content and interbeds of limestone, siltstone and sandstone with depth (Armstrong and Carter 2006). The Blue Mountain Formation was subdivided into an upper ~ 40 m thick and lower ~ 4m thick member based on
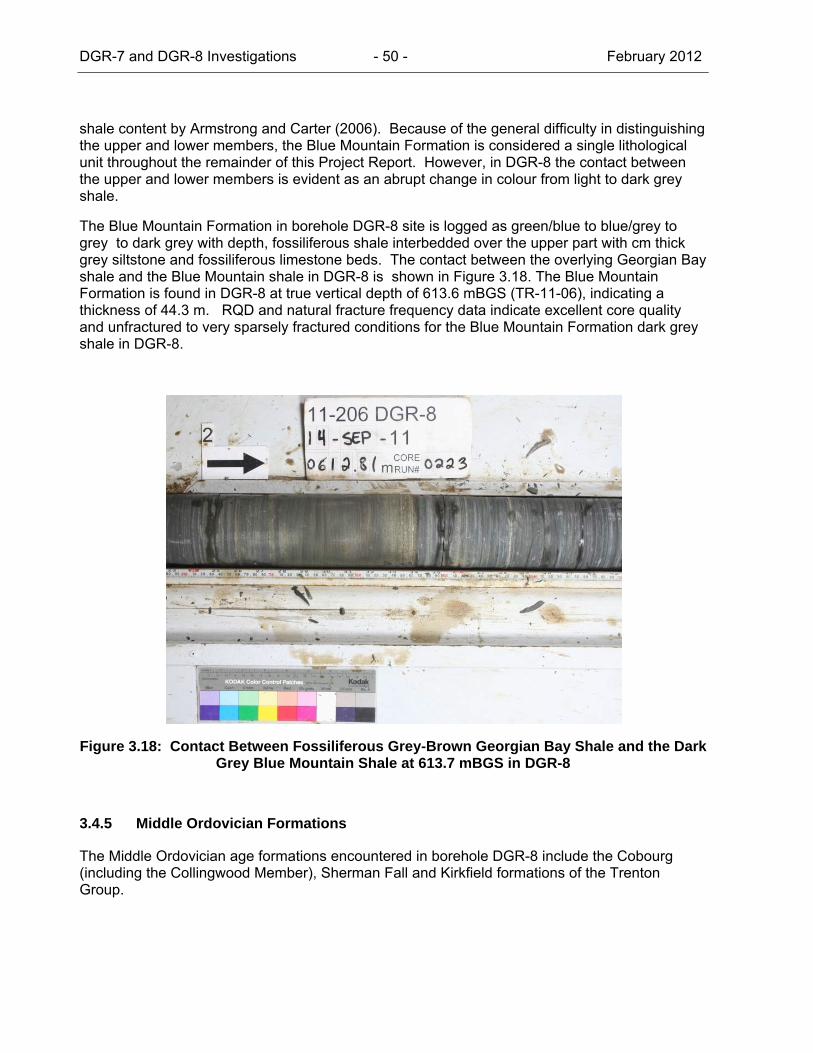
DGR-7 and DGR-8 Investigations - 50 - February 2012
shale content by Armstrong and Carter (2006). Because of the general difficulty in distinguishing the upper and lower members, the Blue Mountain Formation is considered a single lithological unit throughout the remainder of this Project Report. However, in DGR-8 the contact between the upper and lower members is evident as an abrupt change in colour from light to dark grey shale.
The Blue Mountain Formation in borehole DGR-8 site is logged as green/blue to blue/grey to grey to dark grey with depth, fossiliferous shale interbedded over the upper part with cm thick grey siltstone and fossiliferous limestone beds. The contact between the overlying Georgian Bay shale and the Blue Mountain shale in DGR-8 is shown in Figure 3.18. The Blue Mountain Formation is found in DGR-8 at true vertical depth of 613.6 mBGS (TR-11-06), indicating a thickness of 44.3 m. RQD and natural fracture frequency data indicate excellent core quality and unfractured to very sparsely fractured conditions for the Blue Mountain Formation dark grey shale in DGR-8.
Figure 3.18: Contact Between Fossiliferous Grey-Brown Georgian Bay Shale and the Dark Grey Blue Mountain Shale at 613.7 mBGS in DGR-8
3.4.5 Middle Ordovician Formations
The Middle Ordovician age formations encountered in borehole DGR-8 include the Cobourg (including the Collingwood Member), Sherman Fall and Kirkfield formations of the Trenton Group.
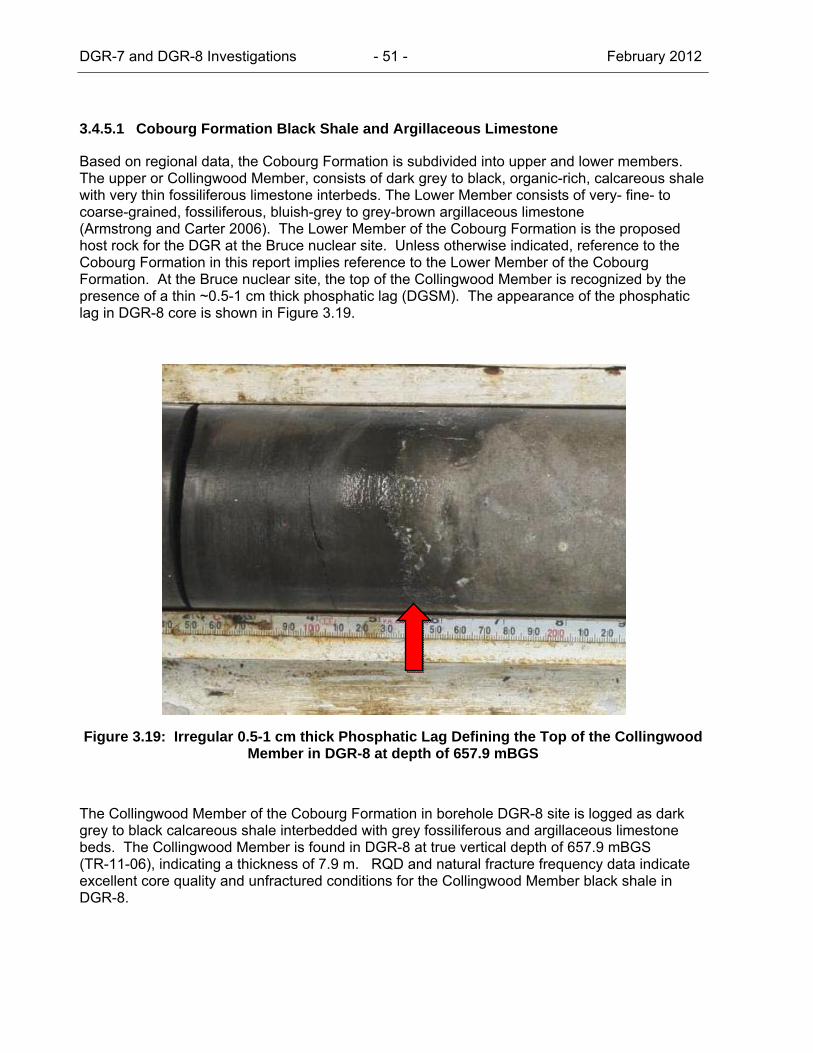
DGR-7 and DGR-8 Investigations - 51 - February 2012
3.4.5.1 Cobourg Formation Black Shale and Argillaceous Limestone
Based on regional data, the Cobourg Formation is subdivided into upper and lower members. The upper or Collingwood Member, consists of dark grey to black, organic-rich, calcareous shale with very thin fossiliferous limestone interbeds. The Lower Member consists of very- fine- to coarse-grained, fossiliferous, bluish-grey to grey-brown argillaceous limestone (Armstrong and Carter 2006). The Lower Member of the Cobourg Formation is the proposed host rock for the DGR at the Bruce nuclear site. Unless otherwise indicated, reference to the Cobourg Formation in this report implies reference to the Lower Member of the Cobourg Formation. At the Bruce nuclear site, the top of the Collingwood Member is recognized by the presence of a thin ~0.5-1 cm thick phosphatic lag (DGSM). The appearance of the phosphatic lag in DGR-8 core is shown in Figure 3.19.
Figure 3.19: Irregular 0.5-1 cm thick Phosphatic Lag Defining the Top of the Collingwood Member in DGR-8 at depth of 657.9 mBGS
The Collingwood Member of the Cobourg Formation in borehole DGR-8 site is logged as dark grey to black calcareous shale interbedded with grey fossiliferous and argillaceous limestone beds. The Collingwood Member is found in DGR-8 at true vertical depth of 657.9 mBGS (TR-11-06), indicating a thickness of 7.9 m. RQD and natural fracture frequency data indicate excellent core quality and unfractured conditions for the Collingwood Member black shale in DGR-8.
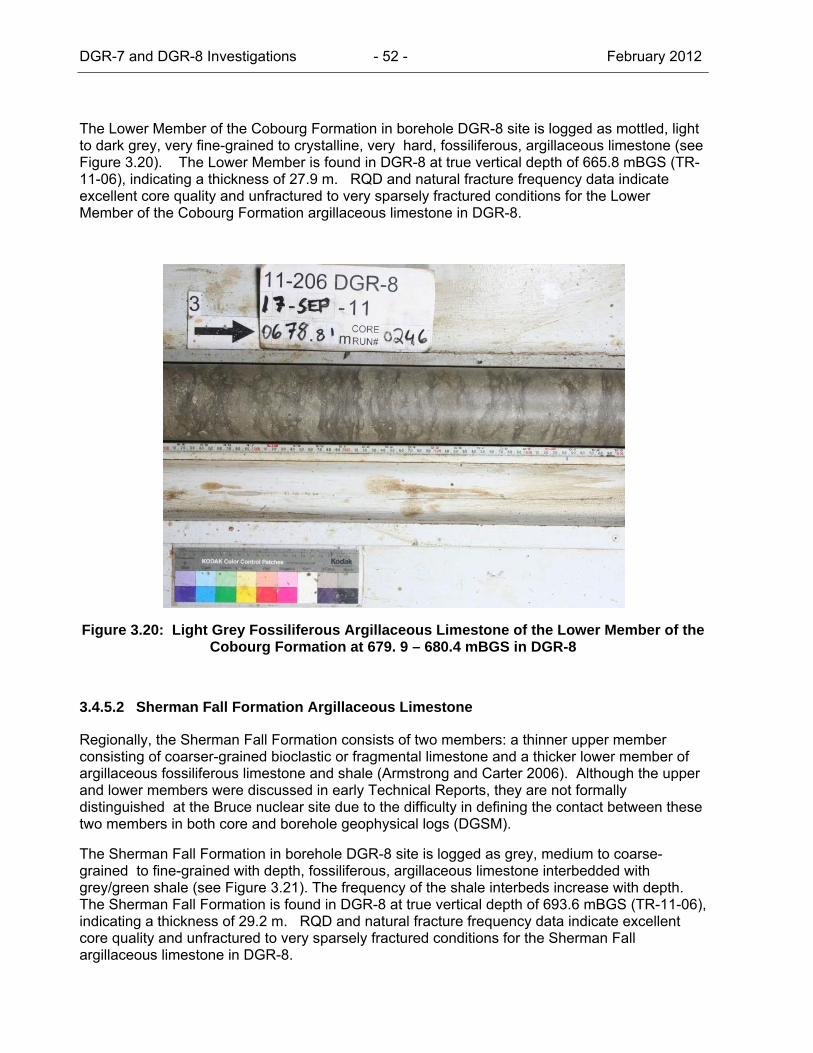
DGR-7 and DGR-8 Investigations - 52 - February 2012
The Lower Member of the Cobourg Formation in borehole DGR-8 site is logged as mottled, light to dark grey, very fine-grained to crystalline, very hard, fossiliferous, argillaceous limestone (see Figure 3.20). The Lower Member is found in DGR-8 at true vertical depth of 665.8 mBGS (TR-11-06), indicating a thickness of 27.9 m. RQD and natural fracture frequency data indicate excellent core quality and unfractured to very sparsely fractured conditions for the Lower Member of the Cobourg Formation argillaceous limestone in DGR-8.
Figure 3.20: Light Grey Fossiliferous Argillaceous Limestone of the Lower Member of the Cobourg Formation at 679. 9 – 680.4 mBGS in DGR-8
3.4.5.2 Sherman Fall Formation Argillaceous Limestone
Regionally, the Sherman Fall Formation consists of two members: a thinner upper member consisting of coarser-grained bioclastic or fragmental limestone and a thicker lower member of argillaceous fossiliferous limestone and shale (Armstrong and Carter 2006). Although the upper and lower members were discussed in early Technical Reports, they are not formally distinguished at the Bruce nuclear site due to the difficulty in defining the contact between these two members in both core and borehole geophysical logs (DGSM).
The Sherman Fall Formation in borehole DGR-8 site is logged as grey, medium to coarse-grained to fine-grained with depth, fossiliferous, argillaceous limestone interbedded with grey/green shale (see Figure 3.21). The frequency of the shale interbeds increase with depth. The Sherman Fall Formation is found in DGR-8 at true vertical depth of 693.6 mBGS (TR-11-06), indicating a thickness of 29.2 m. RQD and natural fracture frequency data indicate excellent core quality and unfractured to very sparsely fractured conditions for the Sherman Fall argillaceous limestone in DGR-8.
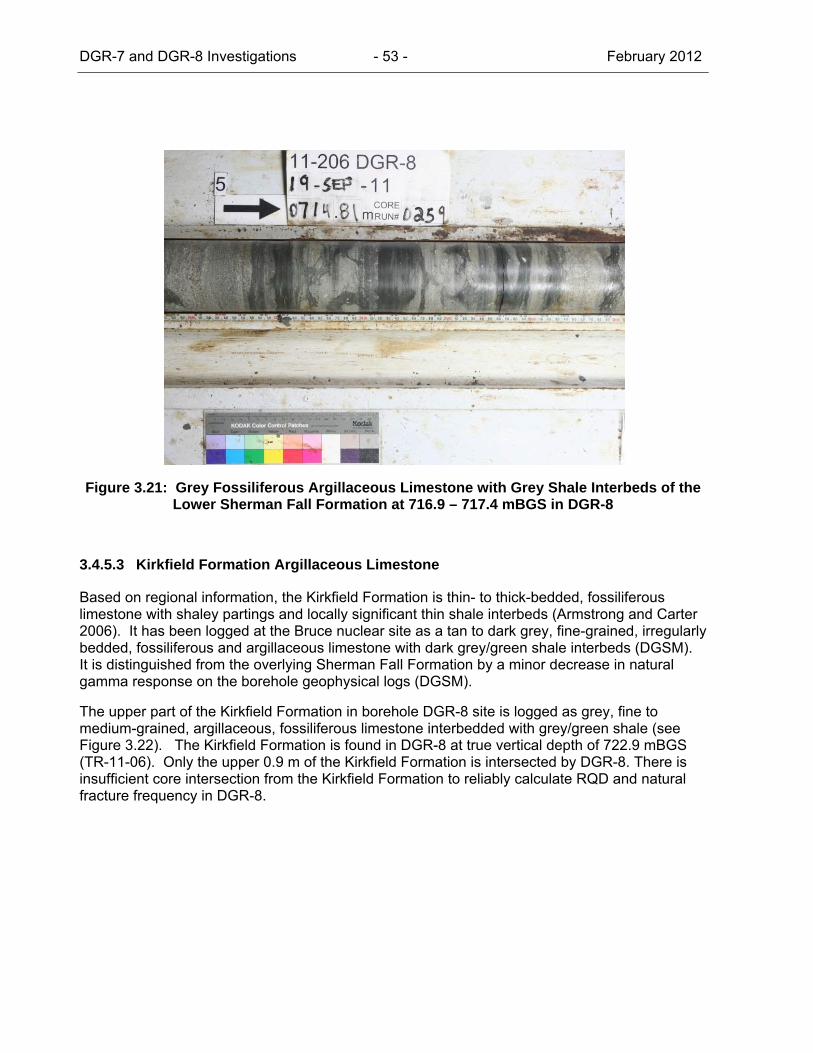
DGR-7 and DGR-8 Investigations - 53 - February 2012
Figure 3.21: Grey Fossiliferous Argillaceous Limestone with Grey Shale Interbeds of the Lower Sherman Fall Formation at 716.9 – 717.4 mBGS in DGR-8
3.4.5.3 Kirkfield Formation Argillaceous Limestone
Based on regional information, the Kirkfield Formation is thin- to thick-bedded, fossiliferous limestone with shaley partings and locally significant thin shale interbeds (Armstrong and Carter 2006). It has been logged at the Bruce nuclear site as a tan to dark grey, fine-grained, irregularly bedded, fossiliferous and argillaceous limestone with dark grey/green shale interbeds (DGSM). It is distinguished from the overlying Sherman Fall Formation by a minor decrease in natural gamma response on the borehole geophysical logs (DGSM).
The upper part of the Kirkfield Formation in borehole DGR-8 site is logged as grey, fine to medium-grained, argillaceous, fossiliferous limestone interbedded with grey/green shale (see Figure 3.22). The Kirkfield Formation is found in DGR-8 at true vertical depth of 722.9 mBGS (TR-11-06). Only the upper 0.9 m of the Kirkfield Formation is intersected by DGR-8. There is insufficient core intersection from the Kirkfield Formation to reliably calculate RQD and natural fracture frequency in DGR-8.
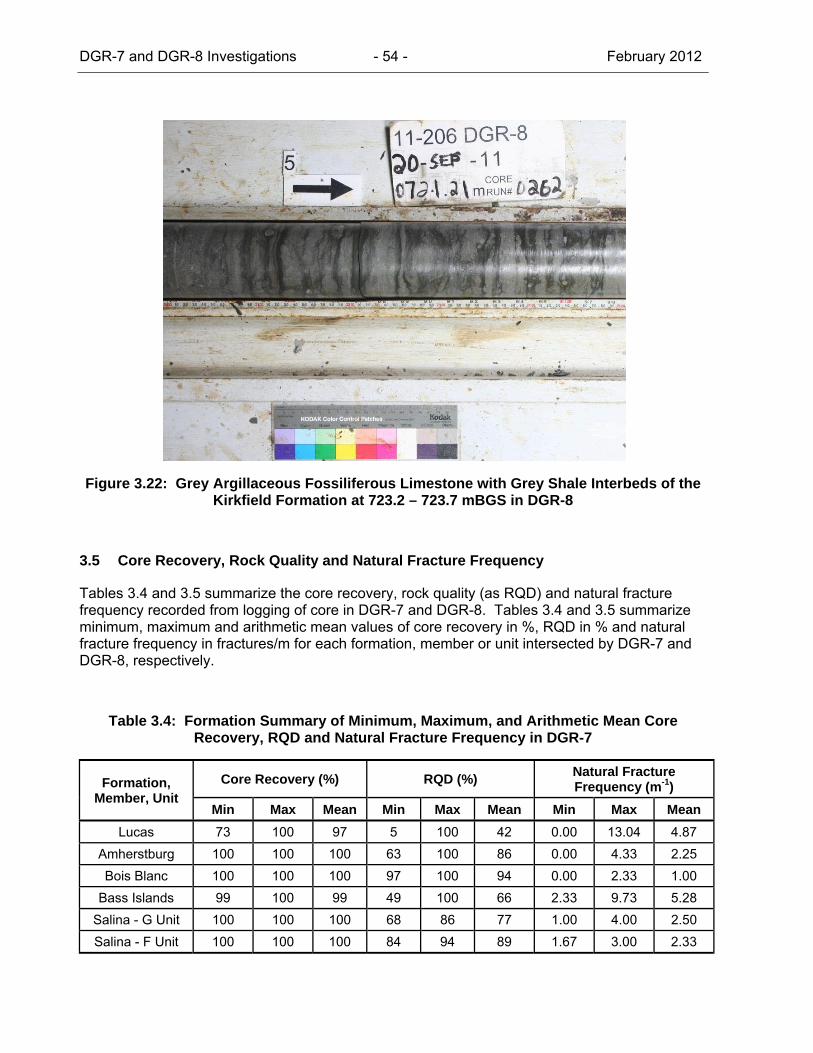
DGR-7 and DGR-8 Investigations - 54 - February 2012
Figure 3.22: Grey Argillaceous Fossiliferous Limestone with Grey Shale Interbeds of the Kirkfield Formation at 723.2 – 723.7 mBGS in DGR-8
3.5 Core Recovery, Rock Quality and Natural Fracture Frequency
Tables 3.4 and 3.5 summarize the core recovery, rock quality (as RQD) and natural fracture frequency recorded from logging of core in DGR-7 and DGR-8. Tables 3.4 and 3.5 summarize minimum, maximum and arithmetic mean values of core recovery in %, RQD in % and natural fracture frequency in fractures/m for each formation, member or unit intersected by DGR-7 and DGR-8, respectively.
Table 3.4: Formation Summary of Minimum, Maximum, and Arithmetic Mean Core Recovery, RQD and Natural Fracture Frequency in DGR-7
Formation, Member, Unit
Core Recovery (%) RQD (%) Natural Fracture Frequency (m-1)
Min Max Mean Min Max Mean Min Max Mean Lucas 73 100 97 5 100 42 0.00 13.04 4.87
Amherstburg 100 100 100 63 100 86 0.00 4.33 2.25 Bois Blanc 100 100 100 97 100 94 0.00 2.33 1.00
Bass Islands 99 100 99 49 100 66 2.33 9.73 5.28 Salina - G Unit 100 100 100 68 86 77 1.00 4.00 2.50 Salina - F Unit 100 100 100 84 94 89 1.67 3.00 2.33
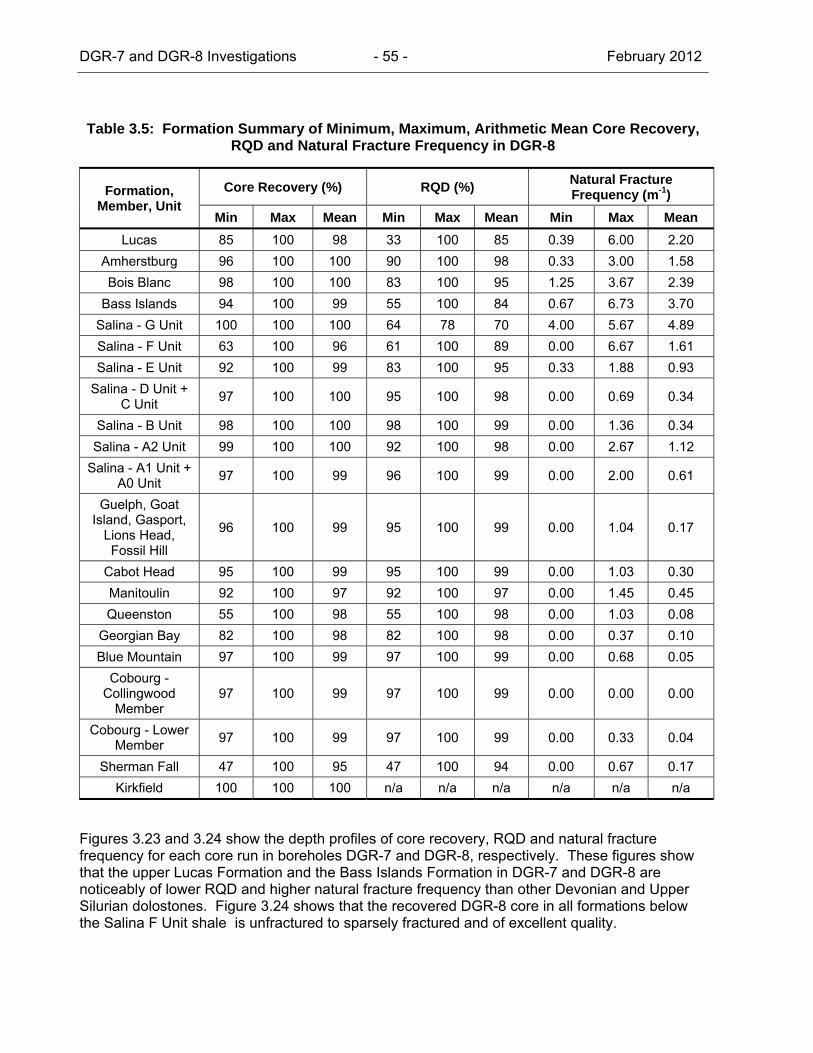
DGR-7 and DGR-8 Investigations - 55 - February 2012
Table 3.5: Formation Summary of Minimum, Maximum, Arithmetic Mean Core Recovery, RQD and Natural Fracture Frequency in DGR-8
Formation, Member, Unit
Core Recovery (%) RQD (%) Natural Fracture Frequency (m-1)
Min Max Mean Min Max Mean Min Max Mean Lucas 85 100 98 33 100 85 0.39 6.00 2.20
Amherstburg 96 100 100 90 100 98 0.33 3.00 1.58 Bois Blanc 98 100 100 83 100 95 1.25 3.67 2.39
Bass Islands 94 100 99 55 100 84 0.67 6.73 3.70 Salina - G Unit 100 100 100 64 78 70 4.00 5.67 4.89 Salina - F Unit 63 100 96 61 100 89 0.00 6.67 1.61 Salina - E Unit 92 100 99 83 100 95 0.33 1.88 0.93
Salina - D Unit + C Unit 97 100 100 95 100 98 0.00 0.69 0.34
Salina - B Unit 98 100 100 98 100 99 0.00 1.36 0.34 Salina - A2 Unit 99 100 100 92 100 98 0.00 2.67 1.12
Salina - A1 Unit + A0 Unit 97 100 99 96 100 99 0.00 2.00 0.61
Guelph, Goat Island, Gasport,
Lions Head, Fossil Hill
96 100 99 95 100 99 0.00 1.04 0.17
Cabot Head 95 100 99 95 100 99 0.00 1.03 0.30 Manitoulin 92 100 97 92 100 97 0.00 1.45 0.45 Queenston 55 100 98 55 100 98 0.00 1.03 0.08
Georgian Bay 82 100 98 82 100 98 0.00 0.37 0.10 Blue Mountain 97 100 99 97 100 99 0.00 0.68 0.05
Cobourg - Collingwood
Member 97 100 99 97 100 99 0.00 0.00 0.00
Cobourg - Lower Member 97 100 99 97 100 99 0.00 0.33 0.04
Sherman Fall 47 100 95 47 100 94 0.00 0.67 0.17 Kirkfield 100 100 100 n/a n/a n/a n/a n/a n/a
Figures 3.23 and 3.24 show the depth profiles of core recovery, RQD and natural fracture frequency for each core run in boreholes DGR-7 and DGR-8, respectively. These figures show that the upper Lucas Formation and the Bass Islands Formation in DGR-7 and DGR-8 are noticeably of lower RQD and higher natural fracture frequency than other Devonian and Upper Silurian dolostones. Figure 3.24 shows that the recovered DGR-8 core in all formations below the Salina F Unit shale is unfractured to sparsely fractured and of excellent quality.
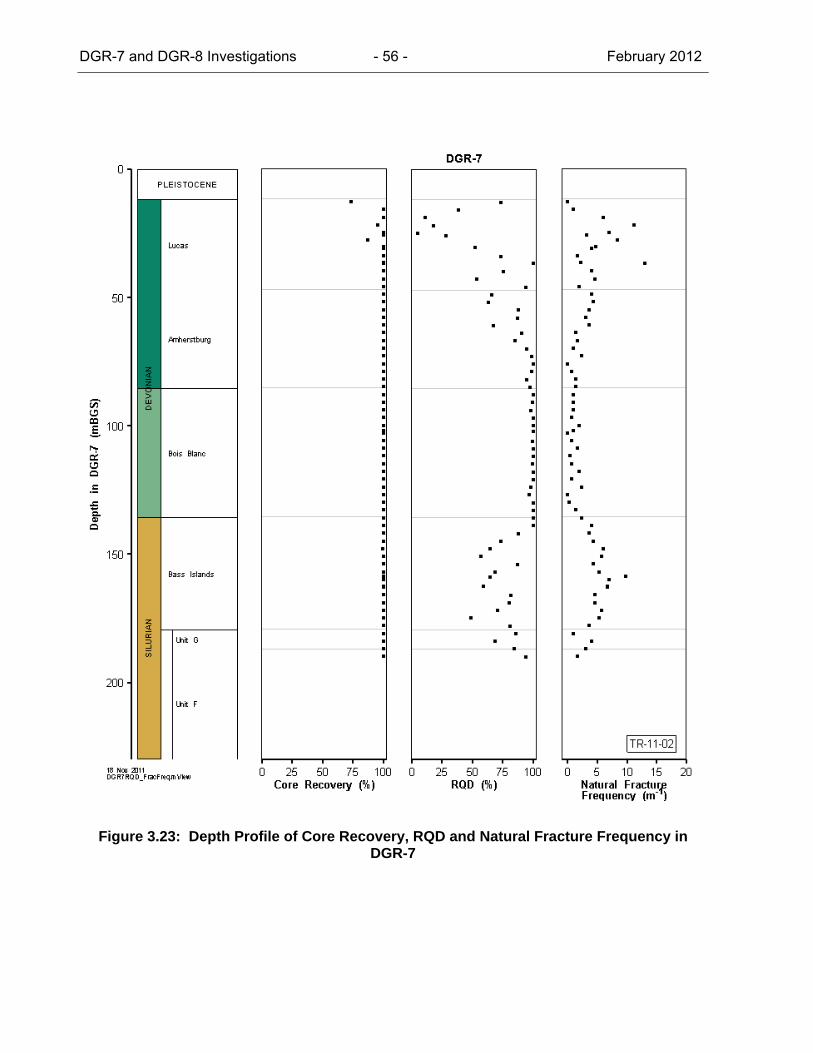
DGR-7 and DGR-8 Investigations - 56 - February 2012
Figure 3.23: Depth Profile of Core Recovery, RQD and Natural Fracture Frequency in DGR-7
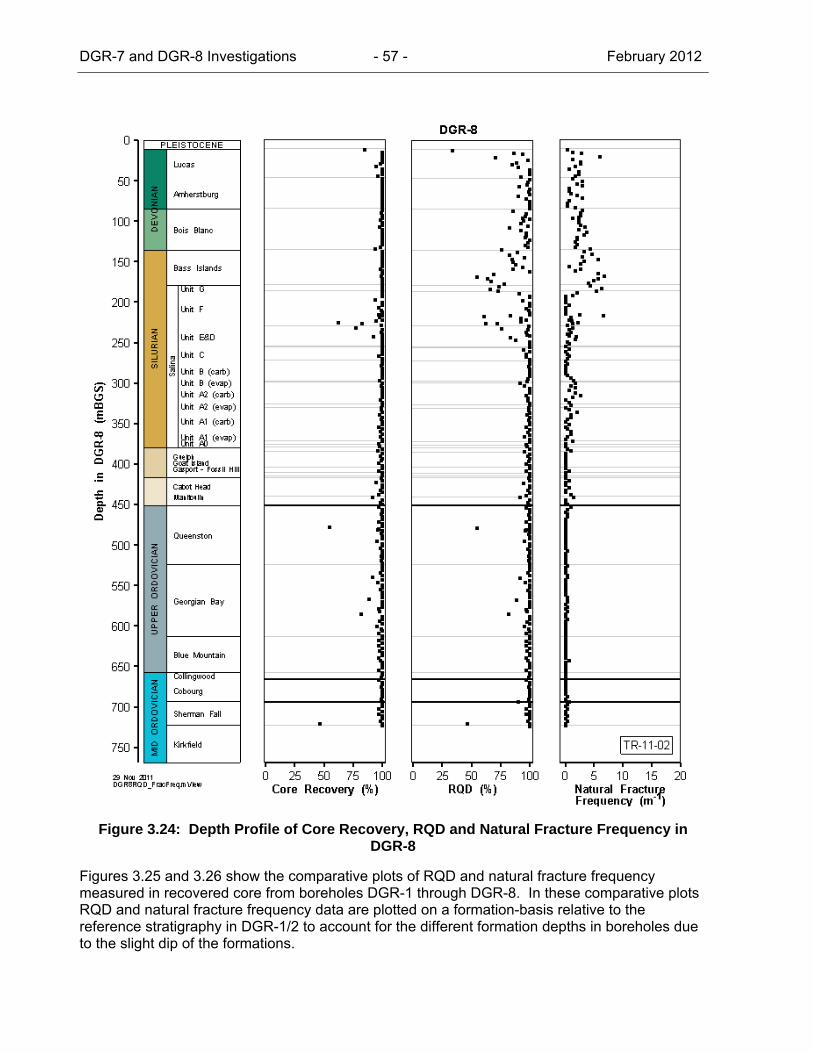
DGR-7 and DGR-8 Investigations - 57 - February 2012
Figure 3.24: Depth Profile of Core Recovery, RQD and Natural Fracture Frequency in
DGR-8
Figures 3.25 and 3.26 show the comparative plots of RQD and natural fracture frequency measured in recovered core from boreholes DGR-1 through DGR-8. In these comparative plots RQD and natural fracture frequency data are plotted on a formation-basis relative to the reference stratigraphy in DGR-1/2 to account for the different formation depths in boreholes due to the slight dip of the formations.

DGR-7 and DGR-8 Investigations - 58 - February 2012
Figure 3.25: Comparative Depth Profiles of RQD in Borehole DGR-1 to DGR-8 Core
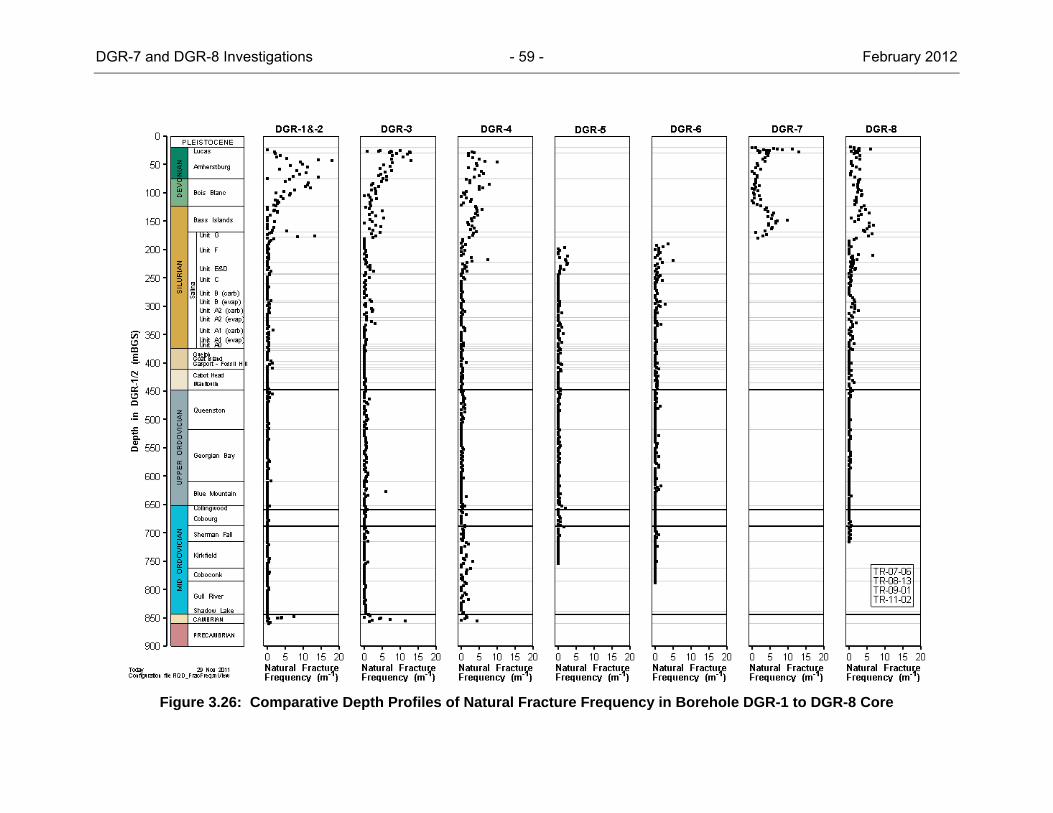
DGR-7 and DGR-8 Investigations - 59 - February 2012
Figure 3.26: Comparative Depth Profiles of Natural Fracture Frequency in Borehole DGR-1 to DGR-8 Core

DGR-7 and DGR-8 Investigations - 60 - February 2012
Tables 3.6 and 3.7 summarize the arithmetic mean RQD and arithmetic mean natural fracture frequency for each formation, member and unit in each DGR borehole and the overall mean value for these parameters based on boreholes DGR-1 through DGR-8. Similar overall arithmetic mean RQD and natural fracture frequency values for formations, members and units were presented in the DGSM based on data from boreholes DGR-1 through DGR-6.
Table 3.6: Summary of Arithmetic Mean RQD in Cored DGR Boreholes in Percent
Formation, Member, Unit
DGR-1/2 DGR-3 DGR-4 DGR-5 DGR-6 DGR-7 DGR-8 All
Lucas 57 36 83 n/a n/a 42 85 63 +4 Amherstburg 37 56 46 n/a n/a 86 98 65 +19Bois Blanc 55 70 74 n/a n/a 94 95 79 +13Bass Islands 27 49 37 n/a n/a 66 84 54 +16Salina - G Unit 52 67 55 n/a n/a 77 70 64 +6 Salina - F Unit 96 88 89 92 84 89 89 90 Salina - E Unit 98 89 97 98 99 n/a 95 96 Salina - D Unit + C Unit 100 95 99 96 98 n/a 99 98
Salina - B Unit 99 94 99 95 99 n/a 99 98 +1 Salina - A2 Unit 98 91 99 98 97 n/a 98 97 Salina - A1 + A0 Unit 98 98 99 97 100 n/a 99 99 +1 Guelph, Goat Island, Gasport, Lions Head, Fossil Hill
100 99 100 100 99 n/a 99 99
Cabot Head 100 99 99 77 96 n/a 99 95 +1 Manitoulin 97 99 100 99 100 n/a 97 99 Queenston 99 99 98 99 97 n/a 98 99+ Georgian Bay 98 95 95 97 97 n/a 98 97 Blue Mountain 99 94 98 97 98 n/a 99 98 +1 Cobourg - Collingwood Member 96 97 100 99 99 n/a 99 99
Cobourg - Lower Member 98 100 99 100 100 n/a 99 99
Sherman Fall 99 97 99 99 99 n/a 94 98- Kirkfield 94 96 99 100 100 n/a n/a 98 Coboconk 97 99 98 n/a 100 n/a n/a 98 Gull River 99 98 99 n/a 100 n/a n/a 99 Shadow Lake 99 84 98 n/a n/a n/a n/a 93 Cambrian Sandstone 99 64 95 n/a n/a n/a n/a 86 Precambrian 100 n/a n/a n/a n/a n/a n/a 100
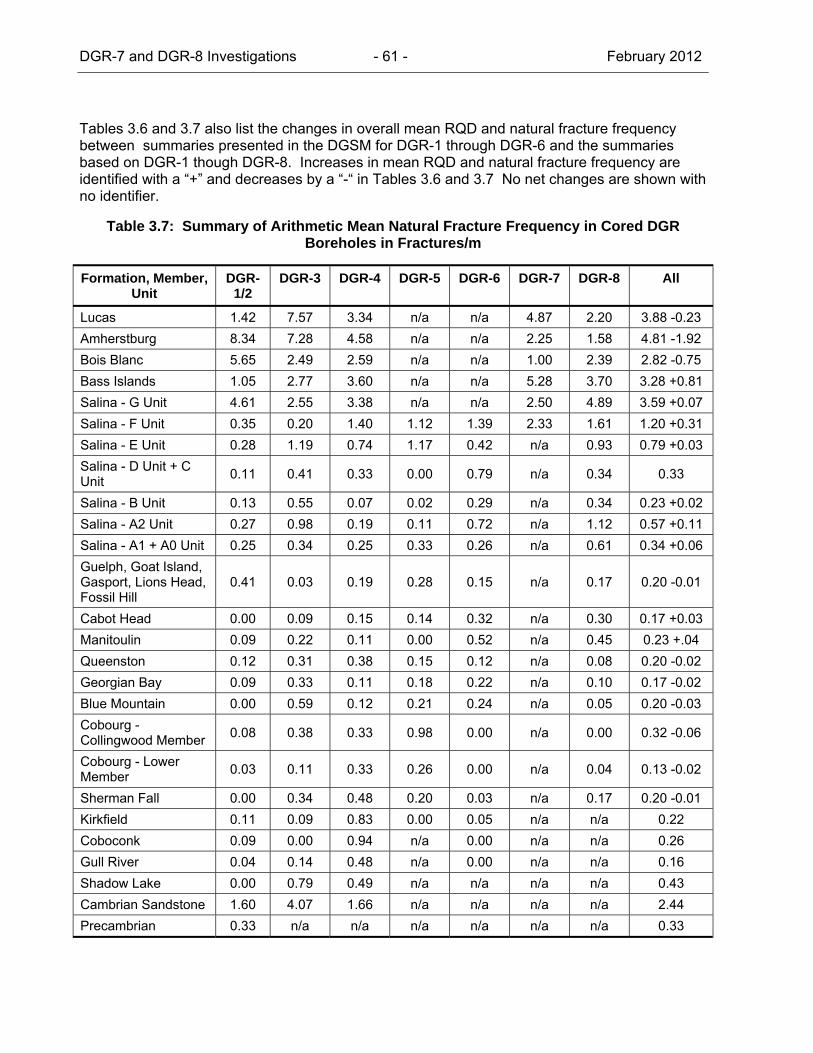
DGR-7 and DGR-8 Investigations - 61 - February 2012
Tables 3.6 and 3.7 also list the changes in overall mean RQD and natural fracture frequency between summaries presented in the DGSM for DGR-1 through DGR-6 and the summaries based on DGR-1 though DGR-8. Increases in mean RQD and natural fracture frequency are identified with a “+” and decreases by a “-“ in Tables 3.6 and 3.7 No net changes are shown with no identifier.
Table 3.7: Summary of Arithmetic Mean Natural Fracture Frequency in Cored DGR Boreholes in Fractures/m
Formation, Member, Unit
DGR-1/2
DGR-3 DGR-4 DGR-5 DGR-6 DGR-7 DGR-8 All
Lucas 1.42 7.57 3.34 n/a n/a 4.87 2.20 3.88 -0.23 Amherstburg 8.34 7.28 4.58 n/a n/a 2.25 1.58 4.81 -1.92 Bois Blanc 5.65 2.49 2.59 n/a n/a 1.00 2.39 2.82 -0.75 Bass Islands 1.05 2.77 3.60 n/a n/a 5.28 3.70 3.28 +0.81 Salina - G Unit 4.61 2.55 3.38 n/a n/a 2.50 4.89 3.59 +0.07 Salina - F Unit 0.35 0.20 1.40 1.12 1.39 2.33 1.61 1.20 +0.31 Salina - E Unit 0.28 1.19 0.74 1.17 0.42 n/a 0.93 0.79 +0.03 Salina - D Unit + C Unit 0.11 0.41 0.33 0.00 0.79 n/a 0.34 0.33
Salina - B Unit 0.13 0.55 0.07 0.02 0.29 n/a 0.34 0.23 +0.02 Salina - A2 Unit 0.27 0.98 0.19 0.11 0.72 n/a 1.12 0.57 +0.11 Salina - A1 + A0 Unit 0.25 0.34 0.25 0.33 0.26 n/a 0.61 0.34 +0.06 Guelph, Goat Island, Gasport, Lions Head, Fossil Hill
0.41 0.03 0.19 0.28 0.15 n/a 0.17 0.20 -0.01
Cabot Head 0.00 0.09 0.15 0.14 0.32 n/a 0.30 0.17 +0.03 Manitoulin 0.09 0.22 0.11 0.00 0.52 n/a 0.45 0.23 +.04 Queenston 0.12 0.31 0.38 0.15 0.12 n/a 0.08 0.20 -0.02 Georgian Bay 0.09 0.33 0.11 0.18 0.22 n/a 0.10 0.17 -0.02 Blue Mountain 0.00 0.59 0.12 0.21 0.24 n/a 0.05 0.20 -0.03 Cobourg - Collingwood Member 0.08 0.38 0.33 0.98 0.00 n/a 0.00 0.32 -0.06
Cobourg - Lower Member 0.03 0.11 0.33 0.26 0.00 n/a 0.04 0.13 -0.02
Sherman Fall 0.00 0.34 0.48 0.20 0.03 n/a 0.17 0.20 -0.01 Kirkfield 0.11 0.09 0.83 0.00 0.05 n/a n/a 0.22 Coboconk 0.09 0.00 0.94 n/a 0.00 n/a n/a 0.26 Gull River 0.04 0.14 0.48 n/a 0.00 n/a n/a 0.16 Shadow Lake 0.00 0.79 0.49 n/a n/a n/a n/a 0.43 Cambrian Sandstone 1.60 4.07 1.66 n/a n/a n/a n/a 2.44 Precambrian 0.33 n/a n/a n/a n/a n/a n/a 0.33
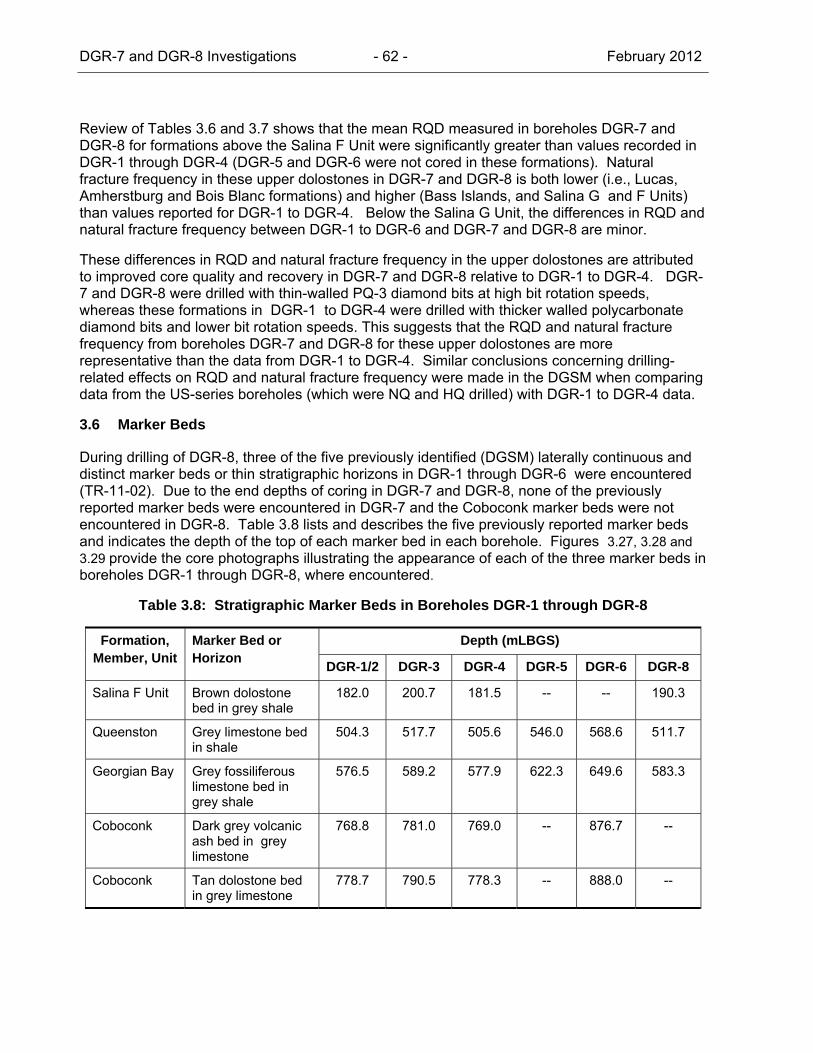
DGR-7 and DGR-8 Investigations - 62 - February 2012
Review of Tables 3.6 and 3.7 shows that the mean RQD measured in boreholes DGR-7 and DGR-8 for formations above the Salina F Unit were significantly greater than values recorded in DGR-1 through DGR-4 (DGR-5 and DGR-6 were not cored in these formations). Natural fracture frequency in these upper dolostones in DGR-7 and DGR-8 is both lower (i.e., Lucas, Amherstburg and Bois Blanc formations) and higher (Bass Islands, and Salina G and F Units) than values reported for DGR-1 to DGR-4. Below the Salina G Unit, the differences in RQD and natural fracture frequency between DGR-1 to DGR-6 and DGR-7 and DGR-8 are minor.
These differences in RQD and natural fracture frequency in the upper dolostones are attributed to improved core quality and recovery in DGR-7 and DGR-8 relative to DGR-1 to DGR-4. DGR-7 and DGR-8 were drilled with thin-walled PQ-3 diamond bits at high bit rotation speeds, whereas these formations in DGR-1 to DGR-4 were drilled with thicker walled polycarbonate diamond bits and lower bit rotation speeds. This suggests that the RQD and natural fracture frequency from boreholes DGR-7 and DGR-8 for these upper dolostones are more representative than the data from DGR-1 to DGR-4. Similar conclusions concerning drilling-related effects on RQD and natural fracture frequency were made in the DGSM when comparing data from the US-series boreholes (which were NQ and HQ drilled) with DGR-1 to DGR-4 data.
3.6 Marker Beds
During drilling of DGR-8, three of the five previously identified (DGSM) laterally continuous and distinct marker beds or thin stratigraphic horizons in DGR-1 through DGR-6 were encountered (TR-11-02). Due to the end depths of coring in DGR-7 and DGR-8, none of the previously reported marker beds were encountered in DGR-7 and the Coboconk marker beds were not encountered in DGR-8. Table 3.8 lists and describes the five previously reported marker beds and indicates the depth of the top of each marker bed in each borehole. Figures 3.27, 3.28 and 3.29 provide the core photographs illustrating the appearance of each of the three marker beds in boreholes DGR-1 through DGR-8, where encountered.
Table 3.8: Stratigraphic Marker Beds in Boreholes DGR-1 through DGR-8
Formation, Member, Unit
Marker Bed or Horizon
Depth (mLBGS)
DGR-1/2 DGR-3 DGR-4 DGR-5 DGR-6 DGR-8
Salina F Unit Brown dolostone bed in grey shale
182.0 200.7 181.5 -- -- 190.3
Queenston Grey limestone bed in shale
504.3 517.7 505.6 546.0 568.6 511.7
Georgian Bay Grey fossiliferous limestone bed in grey shale
576.5 589.2 577.9 622.3 649.6 583.3
Coboconk Dark grey volcanic ash bed in grey limestone
768.8 781.0 769.0 -- 876.7 --
Coboconk Tan dolostone bed in grey limestone
778.7 790.5 778.3 -- 888.0 --
DGR-7 and DGR-8 Investigations - 63 - February 2012
Figure 3.27: Top of Grey Limestone Marker Bed within the Queenston Formation Shale in DGR Boreholes
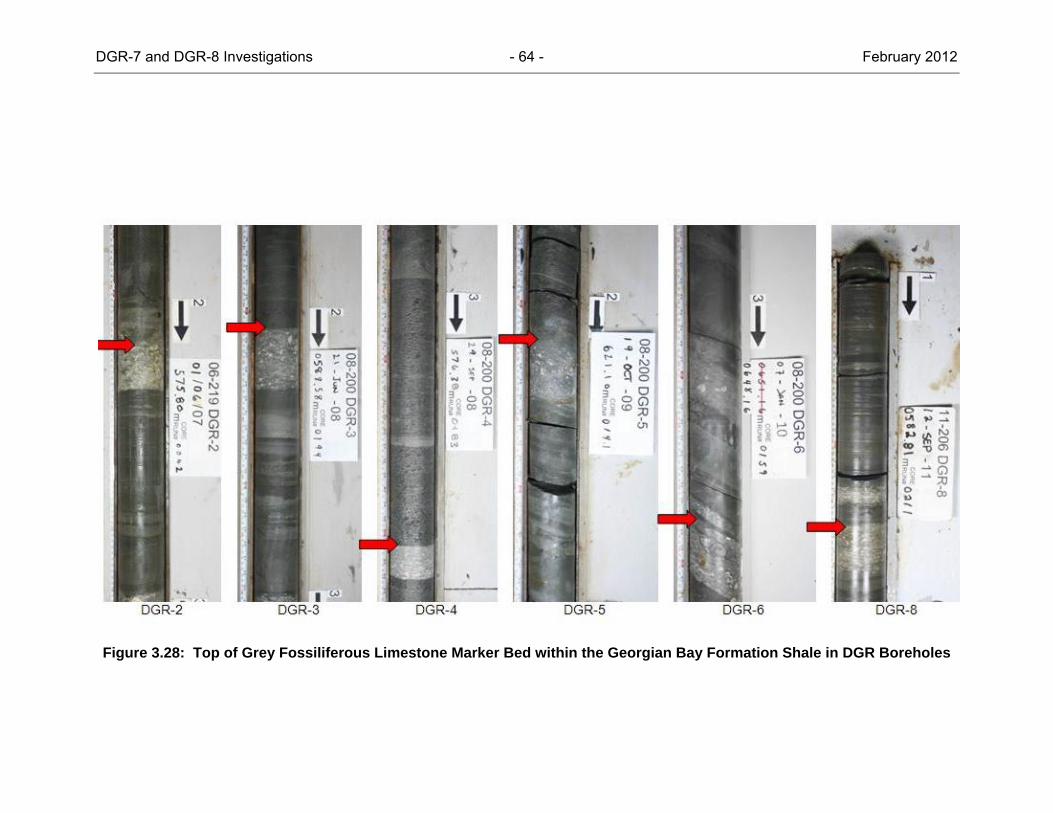
DGR-7 and DGR-8 Investigations - 64 - February 2012
Figure 3.28: Top of Grey Fossiliferous Limestone Marker Bed within the Georgian Bay Formation Shale in DGR Boreholes
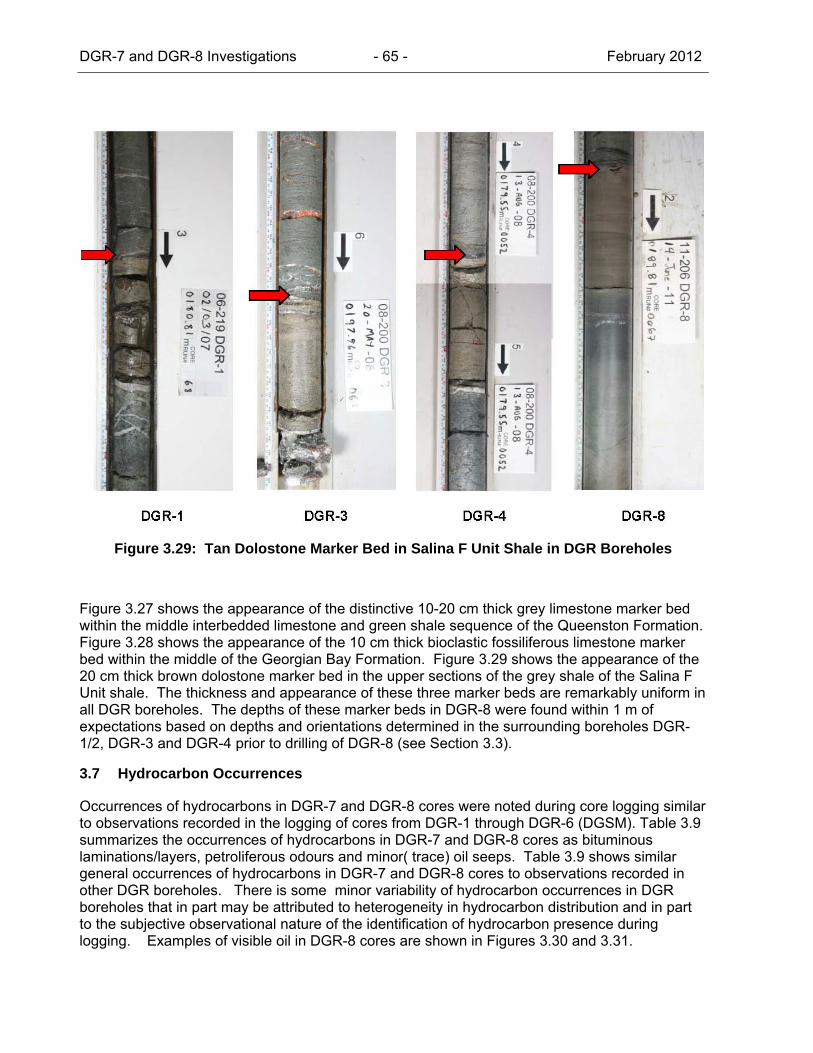
DGR-7 and DGR-8 Investigations - 65 - February 2012
Figure 3.29: Tan Dolostone Marker Bed in Salina F Unit Shale in DGR Boreholes
Figure 3.27 shows the appearance of the distinctive 10-20 cm thick grey limestone marker bed within the middle interbedded limestone and green shale sequence of the Queenston Formation. Figure 3.28 shows the appearance of the 10 cm thick bioclastic fossiliferous limestone marker bed within the middle of the Georgian Bay Formation. Figure 3.29 shows the appearance of the 20 cm thick brown dolostone marker bed in the upper sections of the grey shale of the Salina F Unit shale. The thickness and appearance of these three marker beds are remarkably uniform in all DGR boreholes. The depths of these marker beds in DGR-8 were found within 1 m of expectations based on depths and orientations determined in the surrounding boreholes DGR-1/2, DGR-3 and DGR-4 prior to drilling of DGR-8 (see Section 3.3).
3.7 Hydrocarbon Occurrences
Occurrences of hydrocarbons in DGR-7 and DGR-8 cores were noted during core logging similar to observations recorded in the logging of cores from DGR-1 through DGR-6 (DGSM). Table 3.9 summarizes the occurrences of hydrocarbons in DGR-7 and DGR-8 cores as bituminous laminations/layers, petroliferous odours and minor( trace) oil seeps. Table 3.9 shows similar general occurrences of hydrocarbons in DGR-7 and DGR-8 cores to observations recorded in other DGR boreholes. There is some minor variability of hydrocarbon occurrences in DGR boreholes that in part may be attributed to heterogeneity in hydrocarbon distribution and in part to the subjective observational nature of the identification of hydrocarbon presence during logging. Examples of visible oil in DGR-8 cores are shown in Figures 3.30 and 3.31.
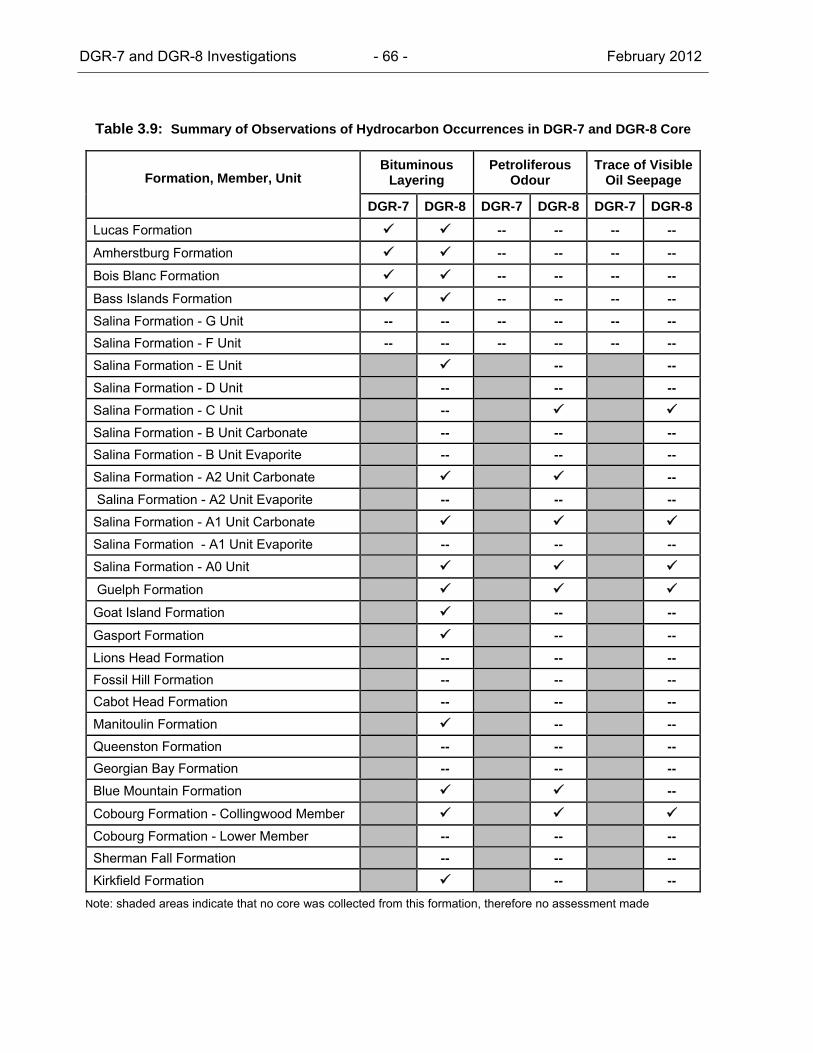
DGR-7 and DGR-8 Investigations - 66 - February 2012
Table 3.9: Summary of Observations of Hydrocarbon Occurrences in DGR-7 and DGR-8 Core
Formation, Member, Unit Bituminous
Layering Petroliferous
Odour Trace of Visible
Oil Seepage
DGR-7 DGR-8 DGR-7 DGR-8 DGR-7 DGR-8
Lucas Formation -- -- -- -- Amherstburg Formation -- -- -- -- Bois Blanc Formation -- -- -- -- Bass Islands Formation -- -- -- -- Salina Formation - G Unit -- -- -- -- -- -- Salina Formation - F Unit -- -- -- -- -- -- Salina Formation - E Unit -- -- Salina Formation - D Unit -- -- -- Salina Formation - C Unit -- Salina Formation - B Unit Carbonate -- -- -- Salina Formation - B Unit Evaporite -- -- -- Salina Formation - A2 Unit Carbonate -- Salina Formation - A2 Unit Evaporite -- -- -- Salina Formation - A1 Unit Carbonate Salina Formation - A1 Unit Evaporite -- -- -- Salina Formation - A0 Unit Guelph Formation Goat Island Formation -- -- Gasport Formation -- -- Lions Head Formation -- -- -- Fossil Hill Formation -- -- -- Cabot Head Formation -- -- -- Manitoulin Formation -- -- Queenston Formation -- -- -- Georgian Bay Formation -- -- -- Blue Mountain Formation -- Cobourg Formation - Collingwood Member Cobourg Formation - Lower Member -- -- -- Sherman Fall Formation -- -- -- Kirkfield Formation -- --
Note: shaded areas indicate that no core was collected from this formation, therefore no assessment made

DGR-7 and DGR-8 Investigations - 67 - February 2012
Figure 3.30: Oil within Open Anhydrite-Lined Vug in Argillaceous Dolostone of Salina A1 Unit at 348.7 mBGS in DGR-8
Figure 3.31: Oil Seeping from Pores and Styolites in a Fossiliferous Limestone Bed of Collingwood Member of Cobourg Formation at 660.9 – 661.0 mBGS in DGR-8
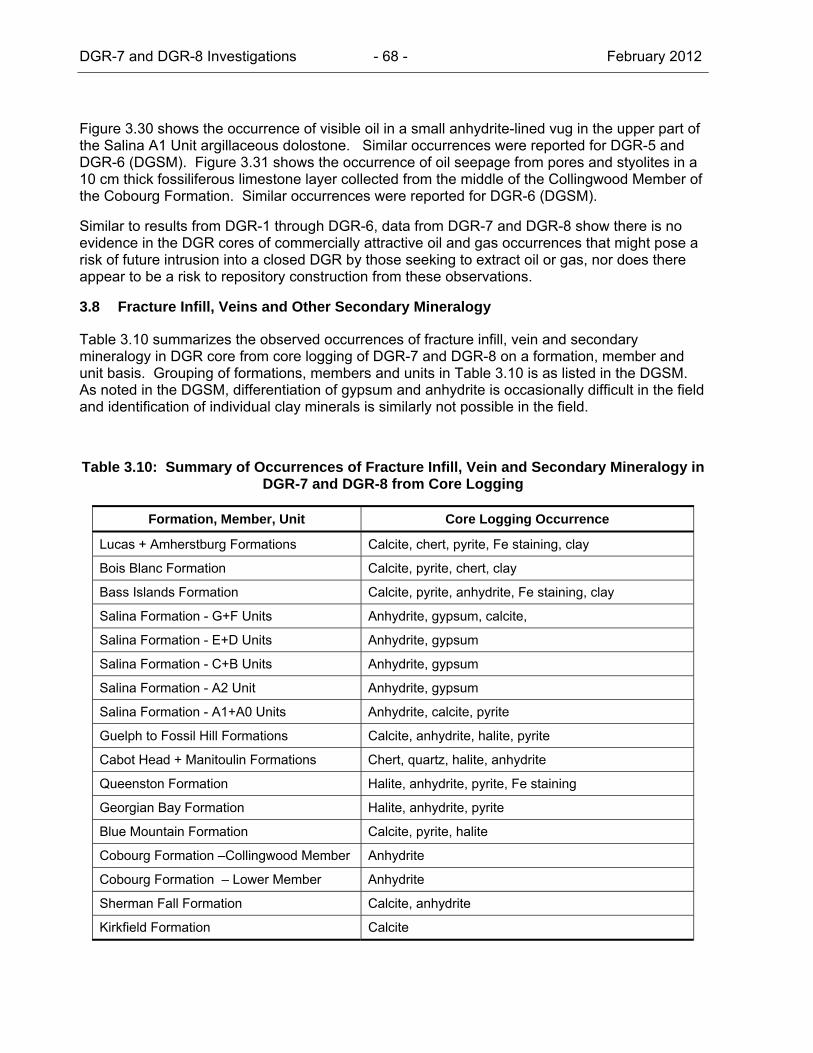
DGR-7 and DGR-8 Investigations - 68 - February 2012
Figure 3.30 shows the occurrence of visible oil in a small anhydrite-lined vug in the upper part of the Salina A1 Unit argillaceous dolostone. Similar occurrences were reported for DGR-5 and DGR-6 (DGSM). Figure 3.31 shows the occurrence of oil seepage from pores and styolites in a 10 cm thick fossiliferous limestone layer collected from the middle of the Collingwood Member of the Cobourg Formation. Similar occurrences were reported for DGR-6 (DGSM).
Similar to results from DGR-1 through DGR-6, data from DGR-7 and DGR-8 show there is no evidence in the DGR cores of commercially attractive oil and gas occurrences that might pose a risk of future intrusion into a closed DGR by those seeking to extract oil or gas, nor does there appear to be a risk to repository construction from these observations.
3.8 Fracture Infill, Veins and Other Secondary Mineralogy
Table 3.10 summarizes the observed occurrences of fracture infill, vein and secondary mineralogy in DGR core from core logging of DGR-7 and DGR-8 on a formation, member and unit basis. Grouping of formations, members and units in Table 3.10 is as listed in the DGSM. As noted in the DGSM, differentiation of gypsum and anhydrite is occasionally difficult in the field and identification of individual clay minerals is similarly not possible in the field.
Table 3.10: Summary of Occurrences of Fracture Infill, Vein and Secondary Mineralogy in DGR-7 and DGR-8 from Core Logging
Formation, Member, Unit Core Logging Occurrence
Lucas + Amherstburg Formations Calcite, chert, pyrite, Fe staining, clay
Bois Blanc Formation Calcite, pyrite, chert, clay
Bass Islands Formation Calcite, pyrite, anhydrite, Fe staining, clay
Salina Formation - G+F Units Anhydrite, gypsum, calcite,
Salina Formation - E+D Units Anhydrite, gypsum
Salina Formation - C+B Units Anhydrite, gypsum
Salina Formation - A2 Unit Anhydrite, gypsum
Salina Formation - A1+A0 Units Anhydrite, calcite, pyrite
Guelph to Fossil Hill Formations Calcite, anhydrite, halite, pyrite
Cabot Head + Manitoulin Formations Chert, quartz, halite, anhydrite
Queenston Formation Halite, anhydrite, pyrite, Fe staining
Georgian Bay Formation Halite, anhydrite, pyrite
Blue Mountain Formation Calcite, pyrite, halite
Cobourg Formation –Collingwood Member Anhydrite
Cobourg Formation – Lower Member Anhydrite
Sherman Fall Formation Calcite, anhydrite
Kirkfield Formation Calcite

DGR-7 and DGR-8 Investigations - 69 - February 2012
Logging of recovered core from DGR-7 and DGR-8 identified a full suite of fracture infill (see Figures 3.4, 3.8, 3.9, 3.15 and 3.30), vein and other secondary mineral features including nodules. This suite included chert, quartz, calcite, pyrite, halite, anhydrite, gypsum,, Fe oxide/hydroxide and clay. Anhydrite was frequently observed in DGR-7 and DGR-8 core from the Bass Islands Formation to the Sherman Fall Formation. Gypsum was observed in the Salina G to A2 Units of DGR-7 and DGR-8. Generally, although occasionally ambiguous, differentiation of anhydrite from gypsum was done in the field based on hardness and colour. However, in many samples both anhydrite and gypsum are present (see Figure 3.8). Calcite and pyrite were observed from the Lucas Formation to the Sherman Fall Formation.
Soluble fracture infill minerals including halite were commonly observed in the Upper Ordovician shales as well as occasionally in the overlying Cabot Head and Manitoulin formations in DGR-8. Figures 3.32, 3.33 and 3.34 show examples of translucent halite-infilled fractures in the Queenston Formation shale, Georgian Bay Formation shale, and the Blue Mountain Formation shale in DGR-8. Halite infilling was observed on both subhorizontal and inclined fractures in these formations.
Figure 3.32: Halite Infilled Fracture at 461.7 mBGS in Upper Part of the Queenston Shale in DGR-8
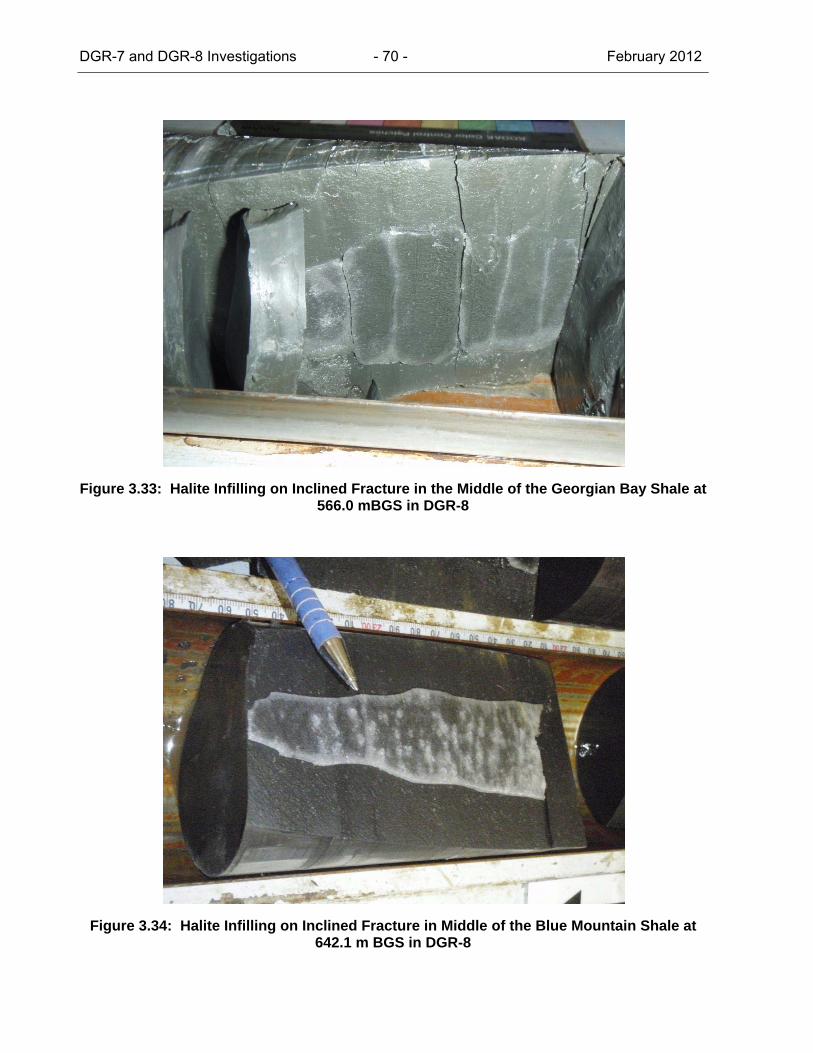
DGR-7 and DGR-8 Investigations - 70 - February 2012
Figure 3.33: Halite Infilling on Inclined Fracture in the Middle of the Georgian Bay Shale at 566.0 mBGS in DGR-8
Figure 3.34: Halite Infilling on Inclined Fracture in Middle of the Blue Mountain Shale at 642.1 m BGS in DGR-8
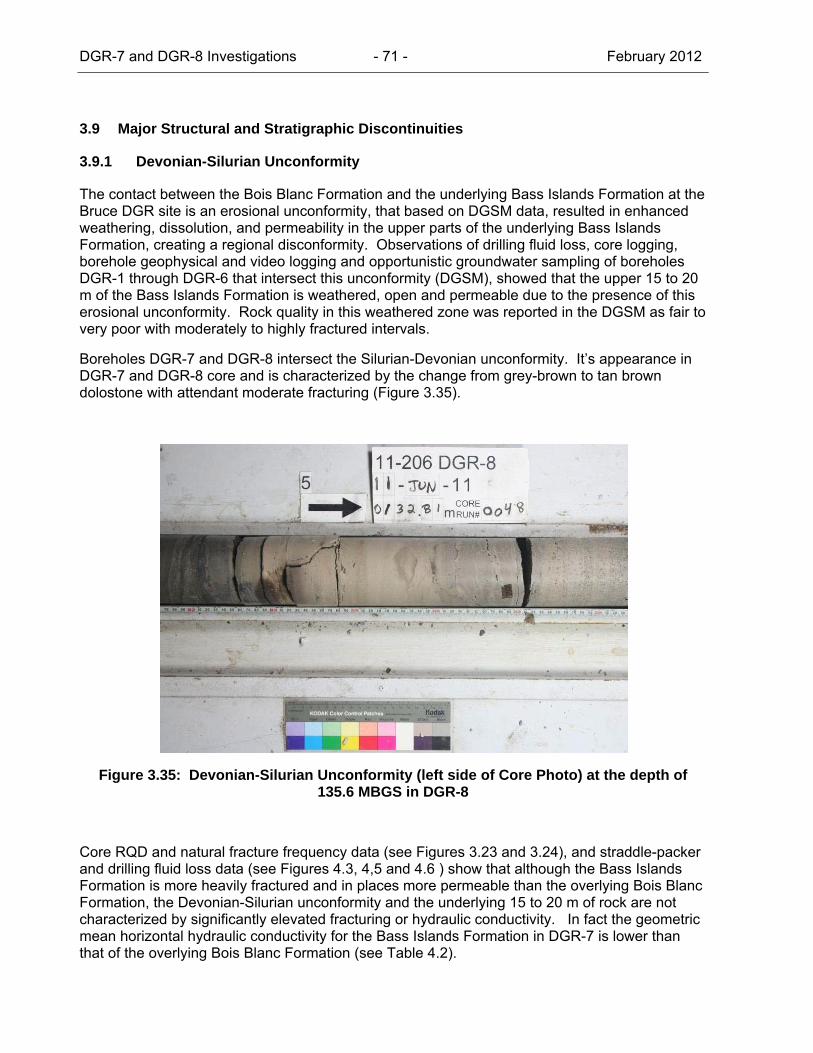
DGR-7 and DGR-8 Investigations - 71 - February 2012
3.9 Major Structural and Stratigraphic Discontinuities
3.9.1 Devonian-Silurian Unconformity
The contact between the Bois Blanc Formation and the underlying Bass Islands Formation at the Bruce DGR site is an erosional unconformity, that based on DGSM data, resulted in enhanced weathering, dissolution, and permeability in the upper parts of the underlying Bass Islands Formation, creating a regional disconformity. Observations of drilling fluid loss, core logging, borehole geophysical and video logging and opportunistic groundwater sampling of boreholes DGR-1 through DGR-6 that intersect this unconformity (DGSM), showed that the upper 15 to 20 m of the Bass Islands Formation is weathered, open and permeable due to the presence of this erosional unconformity. Rock quality in this weathered zone was reported in the DGSM as fair to very poor with moderately to highly fractured intervals.
Boreholes DGR-7 and DGR-8 intersect the Silurian-Devonian unconformity. It’s appearance in DGR-7 and DGR-8 core and is characterized by the change from grey-brown to tan brown dolostone with attendant moderate fracturing (Figure 3.35).
Figure 3.35: Devonian-Silurian Unconformity (left side of Core Photo) at the depth of 135.6 MBGS in DGR-8
Core RQD and natural fracture frequency data (see Figures 3.23 and 3.24), and straddle-packer and drilling fluid loss data (see Figures 4.3, 4,5 and 4.6 ) show that although the Bass Islands Formation is more heavily fractured and in places more permeable than the overlying Bois Blanc Formation, the Devonian-Silurian unconformity and the underlying 15 to 20 m of rock are not characterized by significantly elevated fracturing or hydraulic conductivity. In fact the geometric mean horizontal hydraulic conductivity for the Bass Islands Formation in DGR-7 is lower than that of the overlying Bois Blanc Formation (see Table 4.2).
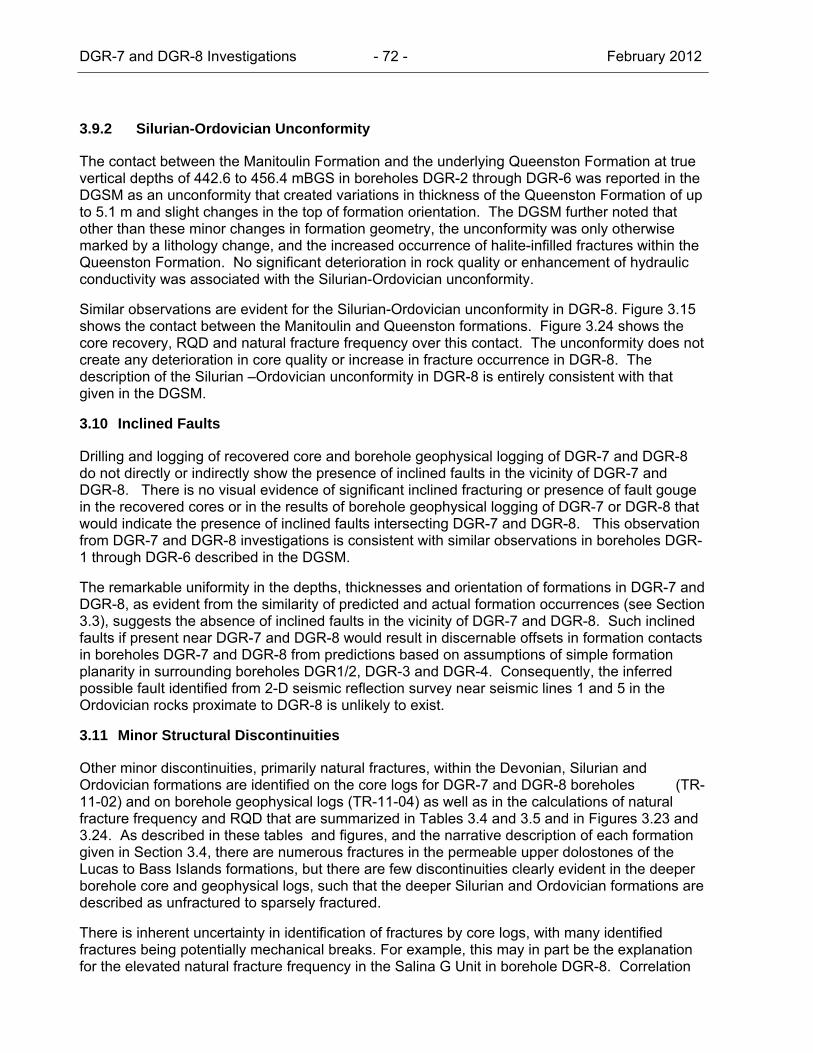
DGR-7 and DGR-8 Investigations - 72 - February 2012
3.9.2 Silurian-Ordovician Unconformity
The contact between the Manitoulin Formation and the underlying Queenston Formation at true vertical depths of 442.6 to 456.4 mBGS in boreholes DGR-2 through DGR-6 was reported in the DGSM as an unconformity that created variations in thickness of the Queenston Formation of up to 5.1 m and slight changes in the top of formation orientation. The DGSM further noted that other than these minor changes in formation geometry, the unconformity was only otherwise marked by a lithology change, and the increased occurrence of halite-infilled fractures within the Queenston Formation. No significant deterioration in rock quality or enhancement of hydraulic conductivity was associated with the Silurian-Ordovician unconformity.
Similar observations are evident for the Silurian-Ordovician unconformity in DGR-8. Figure 3.15 shows the contact between the Manitoulin and Queenston formations. Figure 3.24 shows the core recovery, RQD and natural fracture frequency over this contact. The unconformity does not create any deterioration in core quality or increase in fracture occurrence in DGR-8. The description of the Silurian –Ordovician unconformity in DGR-8 is entirely consistent with that given in the DGSM.
3.10 Inclined Faults
Drilling and logging of recovered core and borehole geophysical logging of DGR-7 and DGR-8 do not directly or indirectly show the presence of inclined faults in the vicinity of DGR-7 and DGR-8. There is no visual evidence of significant inclined fracturing or presence of fault gouge in the recovered cores or in the results of borehole geophysical logging of DGR-7 or DGR-8 that would indicate the presence of inclined faults intersecting DGR-7 and DGR-8. This observation from DGR-7 and DGR-8 investigations is consistent with similar observations in boreholes DGR-1 through DGR-6 described in the DGSM.
The remarkable uniformity in the depths, thicknesses and orientation of formations in DGR-7 and DGR-8, as evident from the similarity of predicted and actual formation occurrences (see Section 3.3), suggests the absence of inclined faults in the vicinity of DGR-7 and DGR-8. Such inclined faults if present near DGR-7 and DGR-8 would result in discernable offsets in formation contacts in boreholes DGR-7 and DGR-8 from predictions based on assumptions of simple formation planarity in surrounding boreholes DGR1/2, DGR-3 and DGR-4. Consequently, the inferred possible fault identified from 2-D seismic reflection survey near seismic lines 1 and 5 in the Ordovician rocks proximate to DGR-8 is unlikely to exist.
3.11 Minor Structural Discontinuities
Other minor discontinuities, primarily natural fractures, within the Devonian, Silurian and Ordovician formations are identified on the core logs for DGR-7 and DGR-8 boreholes (TR-11-02) and on borehole geophysical logs (TR-11-04) as well as in the calculations of natural fracture frequency and RQD that are summarized in Tables 3.4 and 3.5 and in Figures 3.23 and 3.24. As described in these tables and figures, and the narrative description of each formation given in Section 3.4, there are numerous fractures in the permeable upper dolostones of the Lucas to Bass Islands formations, but there are few discontinuities clearly evident in the deeper borehole core and geophysical logs, such that the deeper Silurian and Ordovician formations are described as unfractured to sparsely fractured.
There is inherent uncertainty in identification of fractures by core logs, with many identified fractures being potentially mechanical breaks. For example, this may in part be the explanation for the elevated natural fracture frequency in the Salina G Unit in borehole DGR-8. Correlation

DGR-7 and DGR-8 Investigations - 73 - February 2012
of core logs and core photographs with borehole geophysical logs, in particular borehole acoustic televiewer (ATV) image logs, provides confirmation of suspected discontinuities identified in recovered core. However, there is similar uncertainty with identification of discontinuities by ATV, as many of the horizontal features evident on ATV logs that may be potential discontinuities are actually thin beds of variable lithology from the host rock (e.g., thin siltstone and limestone beds within host shale formation).
Figure 3.36 shows an example of a steeply dipping fracture in core from the Georgian Bay Formation shale that is clearly evident as a natural fracture in core based on presence of halite fracture infilling minerals and is also apparent on borehole acoustic televiewer logs.
Figure 3.36: Inclined Halite-Infilled Fracture at 563.4 – 563.9 mBGS in the Georgian Bay Formation Shale in DGR-8
3.11.1 Mapping of Inclined Fractures
Identification of fracture occurrence and orientation is an important part of the DGR site characterization program, but such characterization, particularly for inclined fractures using vertical boreholes such as DGR-7 and DGR-8 is inherently difficult due to the limited sampling of such features provided by vertical boreholes. With the inclusion of data from inclined boreholes DGR-5 and DGR-6, logging of core and analysis of ATV images of DGR borehole walls provides useful information on the occurrence and orientation of fractures in DGR boreholes.
While logging of core from vertical DGR boreholes can identify the occurrence and approximate dip of some inclined to sub-vertical structural features, analysis of ATV images provides information on the occurrence and orientation (strike and dip) of such features though analysis of the depths of the tops and bottoms of the elliptical traces made by such features on the borehole
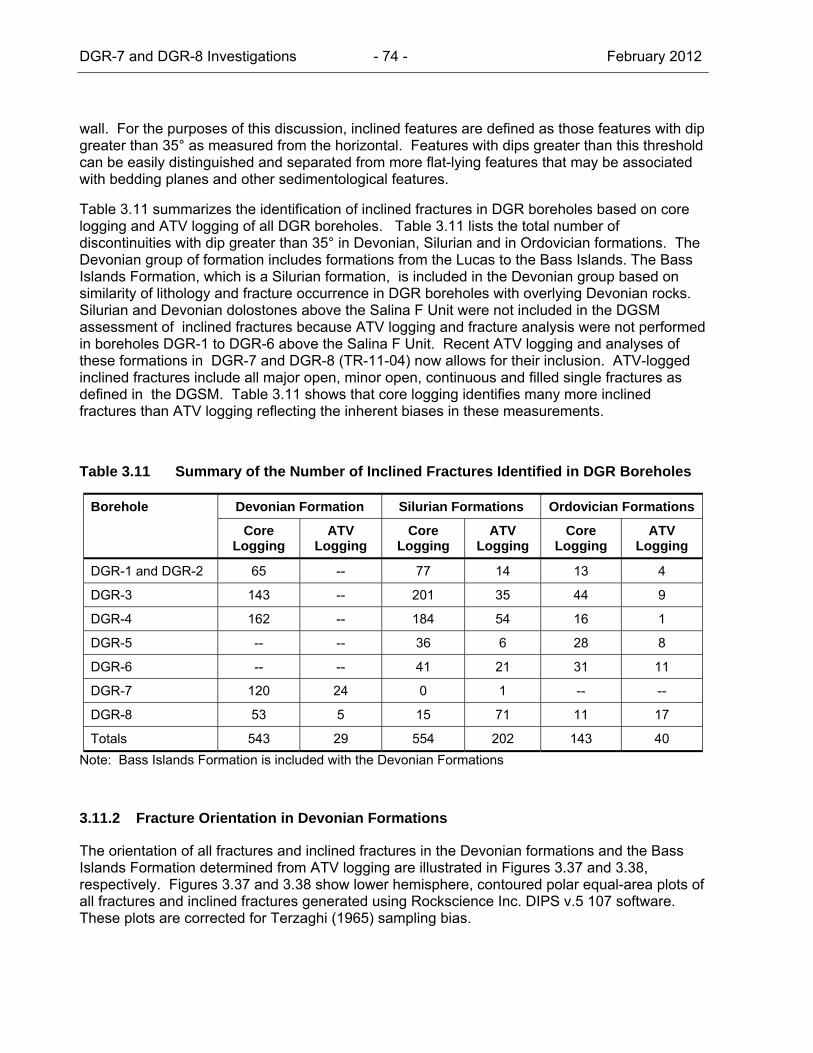
DGR-7 and DGR-8 Investigations - 74 - February 2012
wall. For the purposes of this discussion, inclined features are defined as those features with dip greater than 35° as measured from the horizontal. Features with dips greater than this threshold can be easily distinguished and separated from more flat-lying features that may be associated with bedding planes and other sedimentological features.
Table 3.11 summarizes the identification of inclined fractures in DGR boreholes based on core logging and ATV logging of all DGR boreholes. Table 3.11 lists the total number of discontinuities with dip greater than 35° in Devonian, Silurian and in Ordovician formations. The Devonian group of formation includes formations from the Lucas to the Bass Islands. The Bass Islands Formation, which is a Silurian formation, is included in the Devonian group based on similarity of lithology and fracture occurrence in DGR boreholes with overlying Devonian rocks. Silurian and Devonian dolostones above the Salina F Unit were not included in the DGSM assessment of inclined fractures because ATV logging and fracture analysis were not performed in boreholes DGR-1 to DGR-6 above the Salina F Unit. Recent ATV logging and analyses of these formations in DGR-7 and DGR-8 (TR-11-04) now allows for their inclusion. ATV-logged inclined fractures include all major open, minor open, continuous and filled single fractures as defined in the DGSM. Table 3.11 shows that core logging identifies many more inclined fractures than ATV logging reflecting the inherent biases in these measurements.
Table 3.11 Summary of the Number of Inclined Fractures Identified in DGR Boreholes
Borehole Devonian Formation Silurian Formations Ordovician Formations
Core Logging
ATV Logging
Core Logging
ATV Logging
Core Logging
ATV Logging
DGR-1 and DGR-2 65 -- 77 14 13 4
DGR-3 143 -- 201 35 44 9
DGR-4 162 -- 184 54 16 1
DGR-5 -- -- 36 6 28 8
DGR-6 -- -- 41 21 31 11
DGR-7 120 24 0 1 -- --
DGR-8 53 5 15 71 11 17
Totals 543 29 554 202 143 40 Note: Bass Islands Formation is included with the Devonian Formations
3.11.2 Fracture Orientation in Devonian Formations
The orientation of all fractures and inclined fractures in the Devonian formations and the Bass Islands Formation determined from ATV logging are illustrated in Figures 3.37 and 3.38, respectively. Figures 3.37 and 3.38 show lower hemisphere, contoured polar equal-area plots of all fractures and inclined fractures generated using Rockscience Inc. DIPS v.5 107 software. These plots are corrected for Terzaghi (1965) sampling bias.
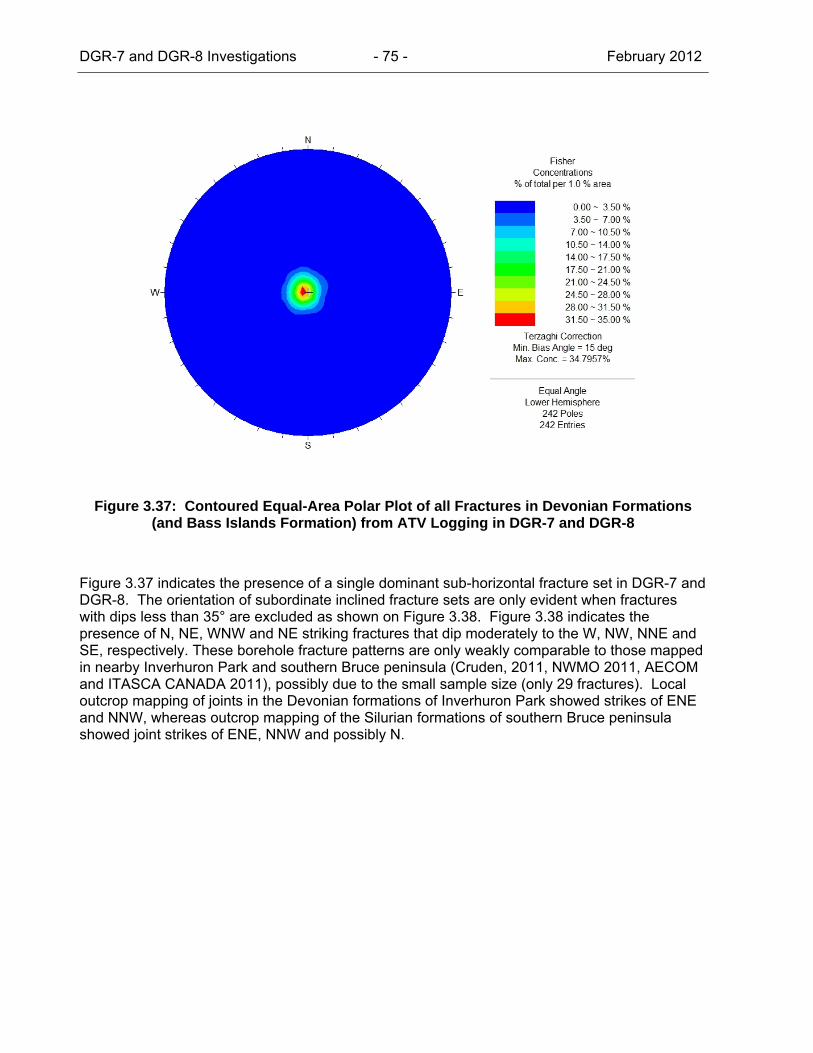
DGR-7 and DGR-8 Investigations - 75 - February 2012
Figure 3.37: Contoured Equal-Area Polar Plot of all Fractures in Devonian Formations (and Bass Islands Formation) from ATV Logging in DGR-7 and DGR-8
Figure 3.37 indicates the presence of a single dominant sub-horizontal fracture set in DGR-7 and DGR-8. The orientation of subordinate inclined fracture sets are only evident when fractures with dips less than 35° are excluded as shown on Figure 3.38. Figure 3.38 indicates the presence of N, NE, WNW and NE striking fractures that dip moderately to the W, NW, NNE and SE, respectively. These borehole fracture patterns are only weakly comparable to those mapped in nearby Inverhuron Park and southern Bruce peninsula (Cruden, 2011, NWMO 2011, AECOM and ITASCA CANADA 2011), possibly due to the small sample size (only 29 fractures). Local outcrop mapping of joints in the Devonian formations of Inverhuron Park showed strikes of ENE and NNW, whereas outcrop mapping of the Silurian formations of southern Bruce peninsula showed joint strikes of ENE, NNW and possibly N.
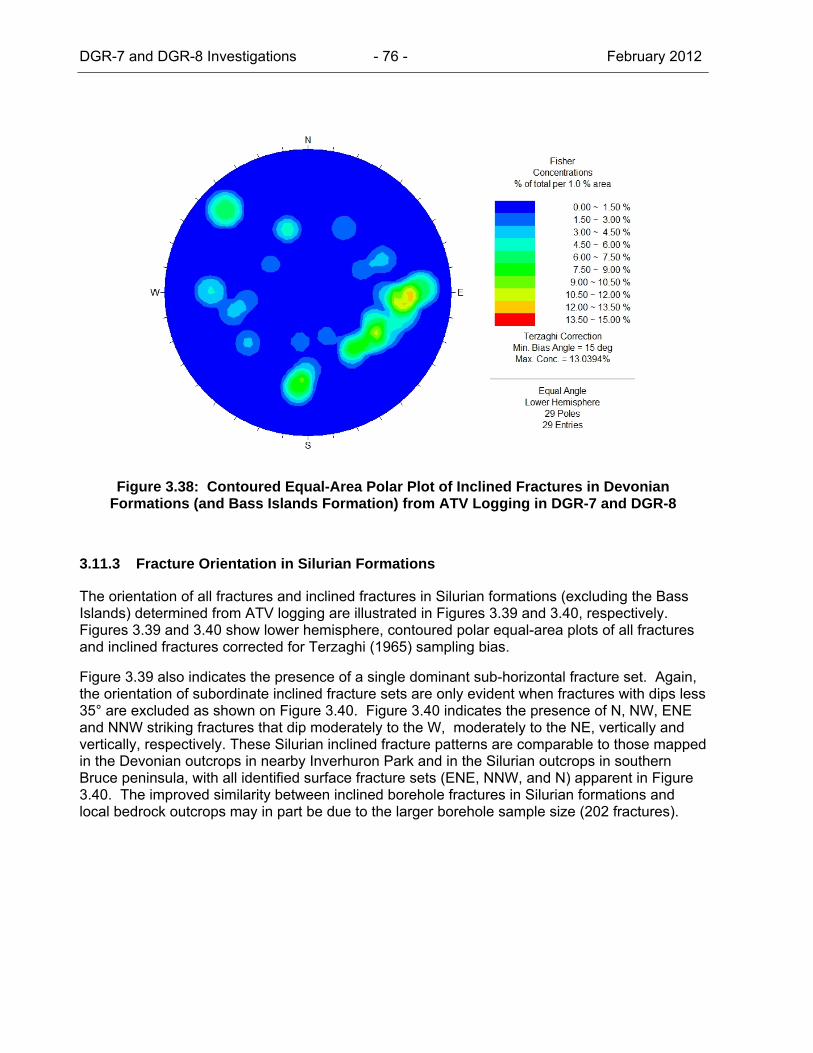
DGR-7 and DGR-8 Investigations - 76 - February 2012
Figure 3.38: Contoured Equal-Area Polar Plot of Inclined Fractures in Devonian Formations (and Bass Islands Formation) from ATV Logging in DGR-7 and DGR-8
3.11.3 Fracture Orientation in Silurian Formations
The orientation of all fractures and inclined fractures in Silurian formations (excluding the Bass Islands) determined from ATV logging are illustrated in Figures 3.39 and 3.40, respectively. Figures 3.39 and 3.40 show lower hemisphere, contoured polar equal-area plots of all fractures and inclined fractures corrected for Terzaghi (1965) sampling bias.
Figure 3.39 also indicates the presence of a single dominant sub-horizontal fracture set. Again, the orientation of subordinate inclined fracture sets are only evident when fractures with dips less 35° are excluded as shown on Figure 3.40. Figure 3.40 indicates the presence of N, NW, ENE and NNW striking fractures that dip moderately to the W, moderately to the NE, vertically and vertically, respectively. These Silurian inclined fracture patterns are comparable to those mapped in the Devonian outcrops in nearby Inverhuron Park and in the Silurian outcrops in southern Bruce peninsula, with all identified surface fracture sets (ENE, NNW, and N) apparent in Figure 3.40. The improved similarity between inclined borehole fractures in Silurian formations and local bedrock outcrops may in part be due to the larger borehole sample size (202 fractures).

DGR-7 and DGR-8 Investigations - 77 - February 2012
Figure 3.39: Contoured Equal-Area Polar Plot of all Fractures in Silurian Formations (excluding Bass Islands Formation) from ATV Logging in all DGR Boreholes
Figure 3.40: Contoured Equal-Area Polar Plot of Inclined Fractures in Silurian Formations (excluding Bass Islands Formation) from ATV Logging in all DGR Boreholes
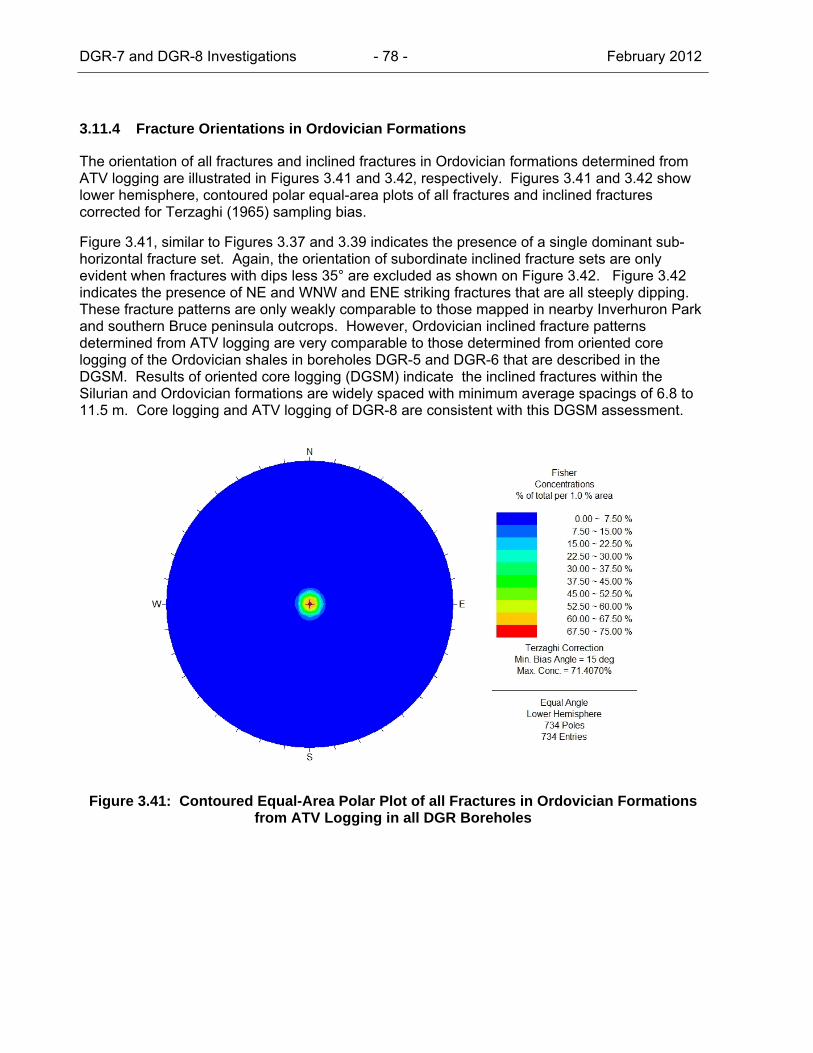
DGR-7 and DGR-8 Investigations - 78 - February 2012
3.11.4 Fracture Orientations in Ordovician Formations
The orientation of all fractures and inclined fractures in Ordovician formations determined from ATV logging are illustrated in Figures 3.41 and 3.42, respectively. Figures 3.41 and 3.42 show lower hemisphere, contoured polar equal-area plots of all fractures and inclined fractures corrected for Terzaghi (1965) sampling bias.
Figure 3.41, similar to Figures 3.37 and 3.39 indicates the presence of a single dominant sub-horizontal fracture set. Again, the orientation of subordinate inclined fracture sets are only evident when fractures with dips less 35° are excluded as shown on Figure 3.42. Figure 3.42 indicates the presence of NE and WNW and ENE striking fractures that are all steeply dipping. These fracture patterns are only weakly comparable to those mapped in nearby Inverhuron Park and southern Bruce peninsula outcrops. However, Ordovician inclined fracture patterns determined from ATV logging are very comparable to those determined from oriented core logging of the Ordovician shales in boreholes DGR-5 and DGR-6 that are described in the DGSM. Results of oriented core logging (DGSM) indicate the inclined fractures within the Silurian and Ordovician formations are widely spaced with minimum average spacings of 6.8 to 11.5 m. Core logging and ATV logging of DGR-8 are consistent with this DGSM assessment.
Figure 3.41: Contoured Equal-Area Polar Plot of all Fractures in Ordovician Formations from ATV Logging in all DGR Boreholes

DGR-7 and DGR-8 Investigations - 79 - February 2012
Figure 3.42: Contoured Equal-Area Polar Plot of Inclined Fractures in Ordovician Formations from ATV Logging in all DGR Boreholes
3.12 Borehole Quality
Review of borehole geophysical logs for DGR-7 and DGR-8 (TR-11-05), in particular borehole acoustic televiewer and caliper logs for the Ordovician shales and limestones, shows excellent borehole quality with no evidence of borehole instability, breakouts or ellipticity that would be indicative high in-situ ground stresses. Borehole quality observed in DGR-7 and DGR-8 was entirely consistent with observations made during drilling of DGR-1 through DGR-6.
DGR-7 and DGR-8 Investigations - 80 - February 2012
4. HYDROGEOLOGICAL CHARACTERIZATION
4.1 Straddle-Packer Hydraulic Testing in DGR-7
Straddle-packer test data from 57 slug recovery tests completed in DGR-7 were analysed using the nSIGHTS numerical well test analysis code to quantify test interval horizontal hydraulic conductivity (Kh). As part of the analyses, estimates of specific storage were also determined for each test and these and can be found in TR-11-05. However, because the determination of these later hydrogeological parameters was not the focus of the hydrogeological characterization work, and their determination is only approximate, they are not reported here. Equilibrium formation pressures and hydraulic heads were also determined for those straddle-packer tests that showed full pressure recovery during the slug testing.
Due to an incorrect depth calculation, two 5 cm sections of borehole DGR-7 at 27.27-27.32 mBGS and 30.27-30.32 mBGS were not tested.
4.1.1 Hydraulic Conductivity
Initial analyses of the straddle-packer test data using a constant hydraulic conductivity were unable to adequately fit the measured pressure responses. Good fits were obtained using a time varying permeability, where the permeability increased as the test progressed. Such time-varying permeability may be due to test equipment, borehole test fluid, and/or formation effects. Test recovery data were defined by three time periods: 1) early-time with initial recovery, 2) mid-time to capture the curve recovery inflection point, and 3) late-time which is primarily the stabilization period.
For some of the lower-permeability tests where the test was terminated before full recovery, the time periods are not as easily distinguished; however, these tests showed much less variation in permeability over the different time periods. Figures 4.1 and 4.2 are example cartesian pressure data plots of hydraulic tests of a moderate and low permeability interval, respectively. Figures 4.1 and 4.2 show test data and best-fit simulation and hydraulic parameter estimates. TR-11-05 provides cartesian pressure data plots for all DGR-7 hydraulic tests.
Figure 4.1 shows the boundaries of the three time periods (t1, t2 and t3) and the corresponding estimates of formation horizontal hydraulic conductivity, as well as the fitted estimate of formation specific storage for a test completed within the Bois Blanc Formation. Figure 4.2 shows hydraulic test data for a low-permeability interval in the Salina Formation G Unit. For this and several other lower permeability tests, time period boundaries were not identified as the tests were adequately fit without time-varying permeability.
The mid-time and late time Kh estimates are considered to be most representative of formation Kh. The single estimated Kh values presented in this Project Report are the geometric mean of these two values. Table 4.1 summarizes the best-estimate values for formation hydraulic conductivity from testing of DGR-7. Figure 4.3 shows the depth profile of these best estimate data plotted against formation stratigraphy.
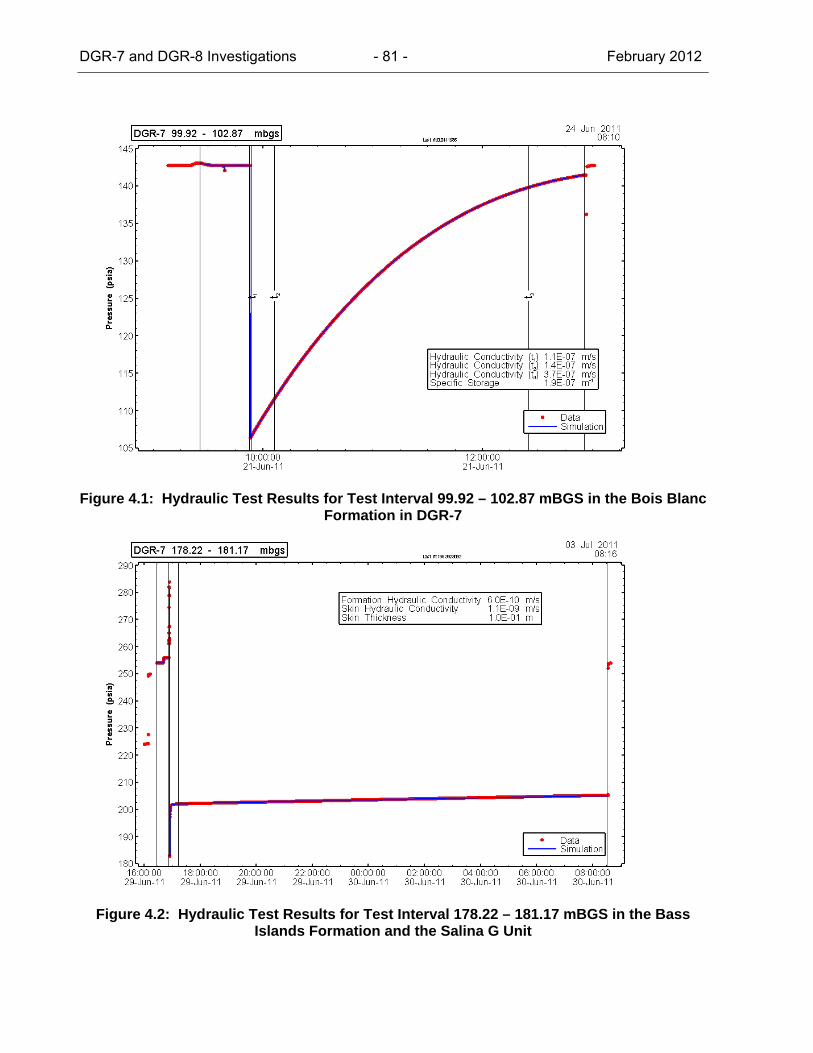
DGR-7 and DGR-8 Investigations - 81 - February 2012
Figure 4.1: Hydraulic Test Results for Test Interval 99.92 – 102.87 mBGS in the Bois Blanc Formation in DGR-7
Figure 4.2: Hydraulic Test Results for Test Interval 178.22 – 181.17 mBGS in the Bass Islands Formation and the Salina G Unit
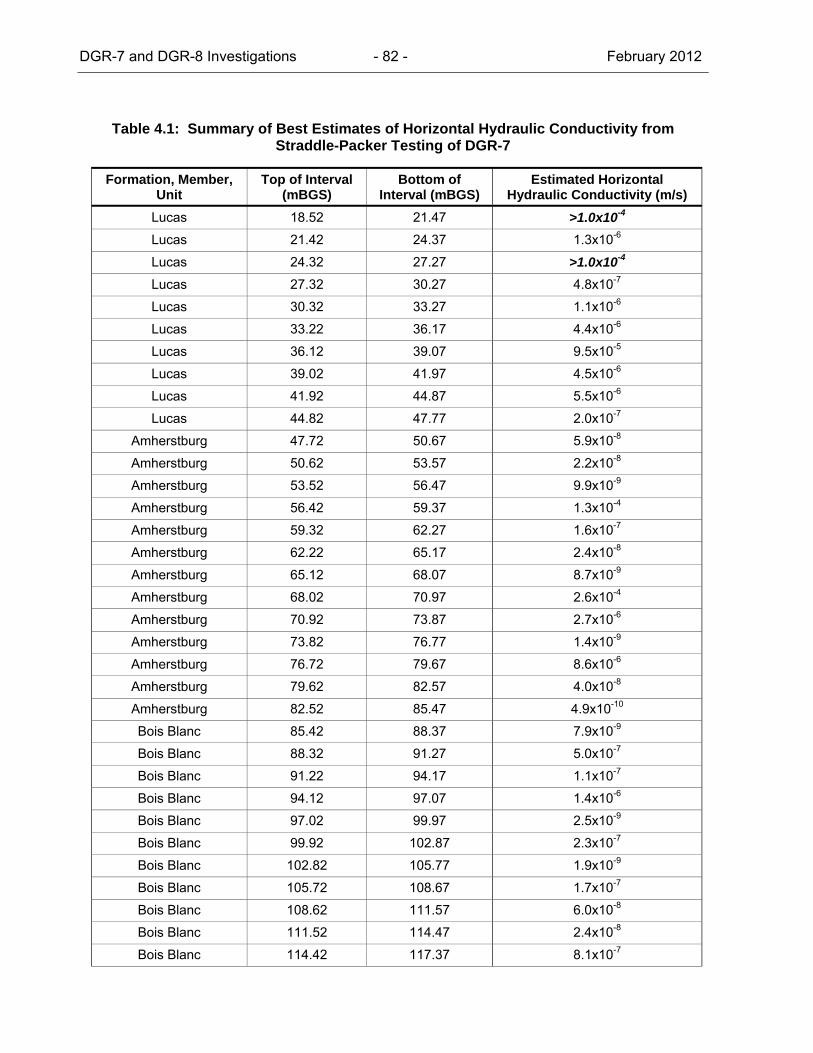
DGR-7 and DGR-8 Investigations - 82 - February 2012
Table 4.1: Summary of Best Estimates of Horizontal Hydraulic Conductivity from Straddle-Packer Testing of DGR-7
Formation, Member, Unit
Top of Interval (mBGS)
Bottom of Interval (mBGS)
Estimated Horizontal Hydraulic Conductivity (m/s)
Lucas 18.52 21.47 >1.0x10⁻⁴ Lucas 21.42 24.37 1.3x10⁻⁶
Lucas 24.32 27.27 >1.0x10⁻⁴ Lucas 27.32 30.27 4.8x10⁻⁷
Lucas 30.32 33.27 1.1x10⁻⁶
Lucas 33.22 36.17 4.4x10⁻⁶
Lucas 36.12 39.07 9.5x10⁻⁵
Lucas 39.02 41.97 4.5x10⁻⁶
Lucas 41.92 44.87 5.5x10⁻⁶
Lucas 44.82 47.77 2.0x10⁻⁷
Amherstburg 47.72 50.67 5.9x10⁻⁸
Amherstburg 50.62 53.57 2.2x10⁻⁸
Amherstburg 53.52 56.47 9.9x10⁻⁹
Amherstburg 56.42 59.37 1.3x10⁻⁴
Amherstburg 59.32 62.27 1.6x10⁻⁷
Amherstburg 62.22 65.17 2.4x10⁻⁸
Amherstburg 65.12 68.07 8.7x10⁻⁹
Amherstburg 68.02 70.97 2.6x10⁻⁴
Amherstburg 70.92 73.87 2.7x10⁻⁶
Amherstburg 73.82 76.77 1.4x10⁻⁹
Amherstburg 76.72 79.67 8.6x10⁻⁶
Amherstburg 79.62 82.57 4.0x10⁻⁸
Amherstburg 82.52 85.47 4.9x10⁻¹⁰
Bois Blanc 85.42 88.37 7.9x10⁻⁹
Bois Blanc 88.32 91.27 5.0x10⁻⁷
Bois Blanc 91.22 94.17 1.1x10⁻⁷
Bois Blanc 94.12 97.07 1.4x10⁻⁶
Bois Blanc 97.02 99.97 2.5x10⁻⁹
Bois Blanc 99.92 102.87 2.3x10⁻⁷
Bois Blanc 102.82 105.77 1.9x10⁻⁹
Bois Blanc 105.72 108.67 1.7x10⁻⁷
Bois Blanc 108.62 111.57 6.0x10⁻⁸
Bois Blanc 111.52 114.47 2.4x10⁻⁸
Bois Blanc 114.42 117.37 8.1x10⁻⁷
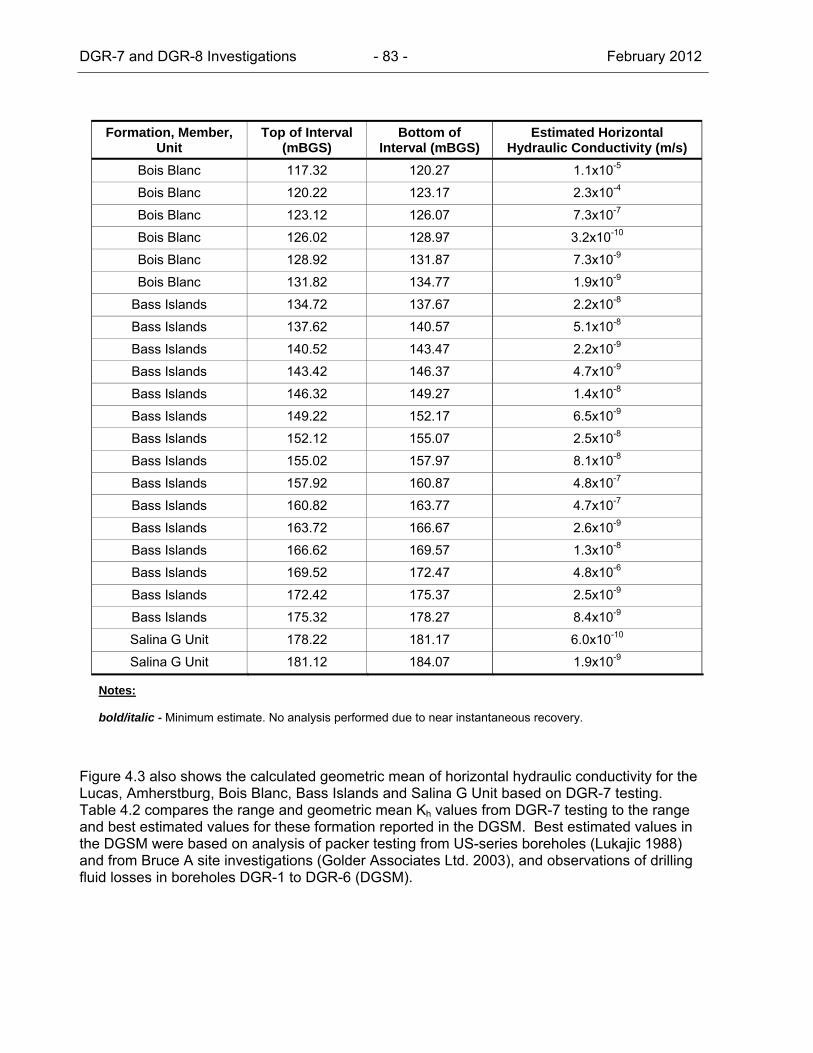
DGR-7 and DGR-8 Investigations - 83 - February 2012
Formation, Member, Unit
Top of Interval (mBGS)
Bottom of Interval (mBGS)
Estimated Horizontal Hydraulic Conductivity (m/s)
Bois Blanc 117.32 120.27 1.1x10⁻⁵
Bois Blanc 120.22 123.17 2.3x10⁻⁴
Bois Blanc 123.12 126.07 7.3x10⁻⁷
Bois Blanc 126.02 128.97 3.2x10⁻¹⁰
Bois Blanc 128.92 131.87 7.3x10⁻⁹
Bois Blanc 131.82 134.77 1.9x10⁻⁹
Bass Islands 134.72 137.67 2.2x10⁻⁸
Bass Islands 137.62 140.57 5.1x10⁻⁸
Bass Islands 140.52 143.47 2.2x10⁻⁹
Bass Islands 143.42 146.37 4.7x10⁻⁹
Bass Islands 146.32 149.27 1.4x10⁻⁸
Bass Islands 149.22 152.17 6.5x10⁻⁹
Bass Islands 152.12 155.07 2.5x10⁻⁸
Bass Islands 155.02 157.97 8.1x10⁻⁸
Bass Islands 157.92 160.87 4.8x10⁻⁷
Bass Islands 160.82 163.77 4.7x10⁻⁷
Bass Islands 163.72 166.67 2.6x10⁻⁹
Bass Islands 166.62 169.57 1.3x10⁻⁸
Bass Islands 169.52 172.47 4.8x10⁻⁶
Bass Islands 172.42 175.37 2.5x10⁻⁹
Bass Islands 175.32 178.27 8.4x10⁻⁹
Salina G Unit 178.22 181.17 6.0x10⁻¹⁰
Salina G Unit 181.12 184.07 1.9x10⁻⁹
Notes:
bold/italic - Minimum estimate. No analysis performed due to near instantaneous recovery.
Figure 4.3 also shows the calculated geometric mean of horizontal hydraulic conductivity for the Lucas, Amherstburg, Bois Blanc, Bass Islands and Salina G Unit based on DGR-7 testing. Table 4.2 compares the range and geometric mean Kh values from DGR-7 testing to the range and best estimated values for these formation reported in the DGSM. Best estimated values in the DGSM were based on analysis of packer testing from US-series boreholes (Lukajic 1988) and from Bruce A site investigations (Golder Associates Ltd. 2003), and observations of drilling fluid losses in boreholes DGR-1 to DGR-6 (DGSM).
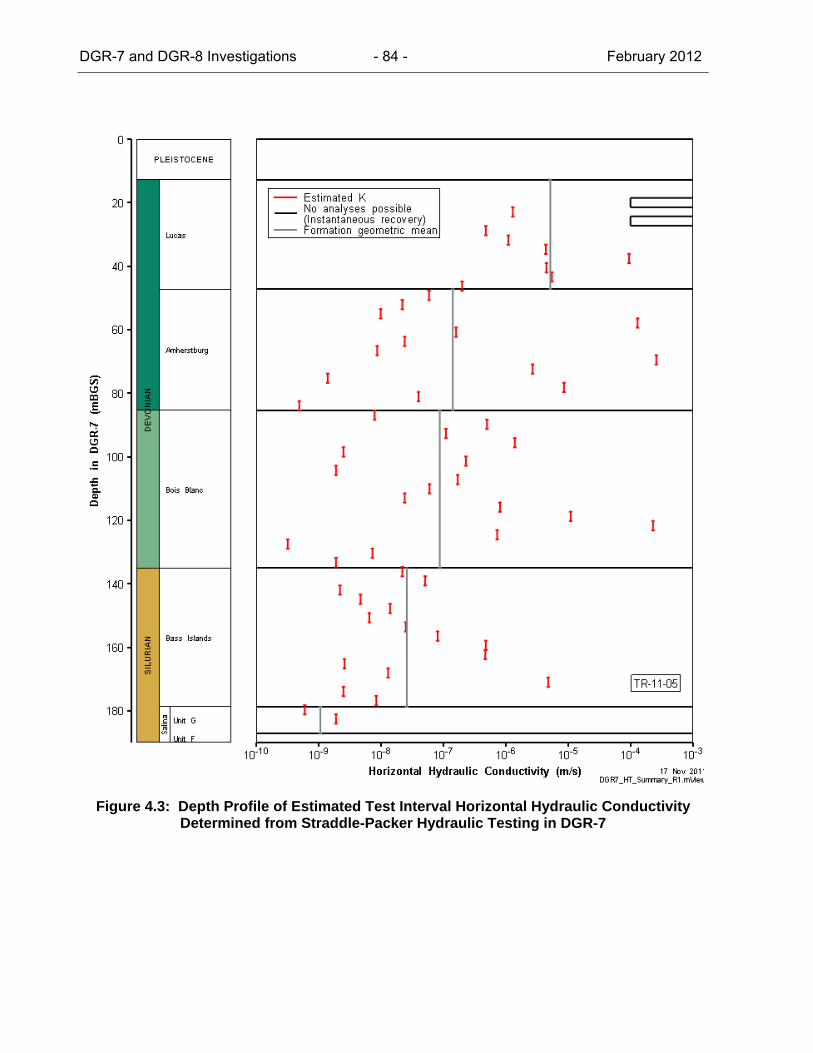
DGR-7 and DGR-8 Investigations - 84 - February 2012
Figure 4.3: Depth Profile of Estimated Test Interval Horizontal Hydraulic Conductivity Determined from Straddle-Packer Hydraulic Testing in DGR-7
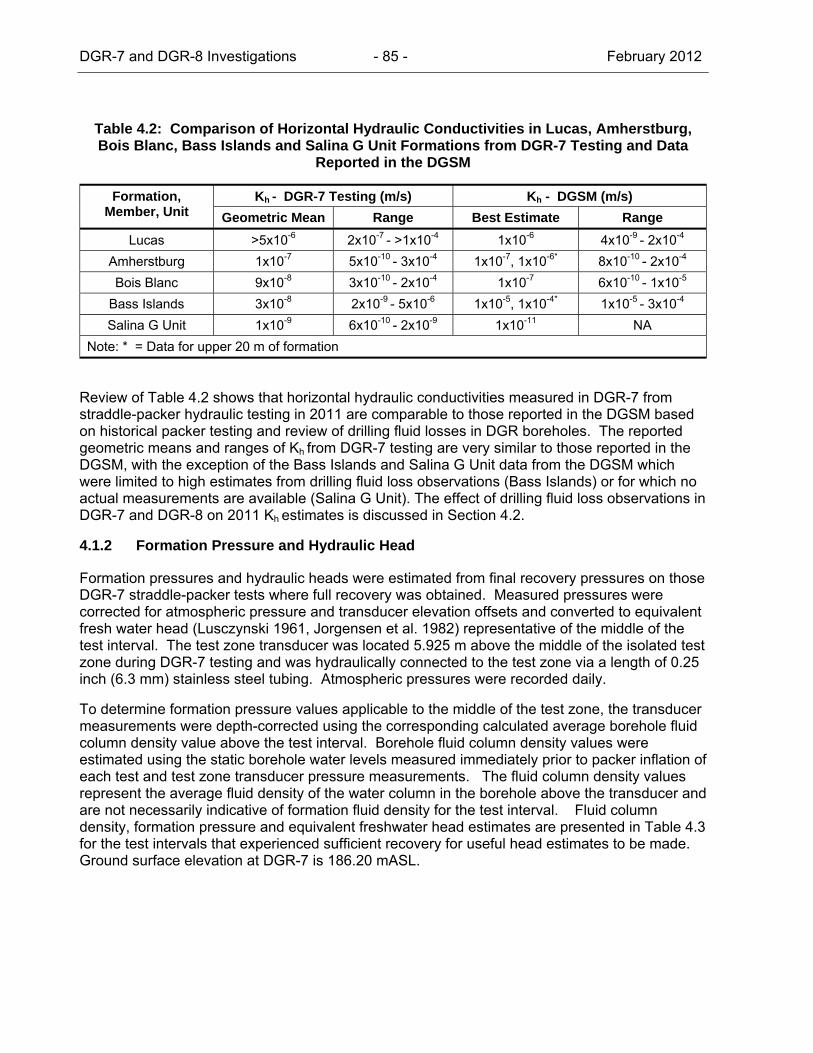
DGR-7 and DGR-8 Investigations - 85 - February 2012
Table 4.2: Comparison of Horizontal Hydraulic Conductivities in Lucas, Amherstburg, Bois Blanc, Bass Islands and Salina G Unit Formations from DGR-7 Testing and Data
Reported in the DGSM
Formation, Member, Unit
Kh - DGR-7 Testing (m/s) Kh - DGSM (m/s) Geometric Mean Range Best Estimate Range
Lucas >5x10⁻⁶ 2x10⁻⁷ - >1x10⁻⁴ 1x10⁻⁶ 4x10⁻⁹ - 2x10⁻⁴ Amherstburg 1x10⁻⁷ 5x10⁻¹⁰ - 3x10⁻⁴ 1x10⁻⁷, 1x10-6* 8x10-10 - 2x10⁻⁴ Bois Blanc 9x10⁻⁸ 3x10⁻¹⁰ - 2x10⁻⁴ 1x10⁻⁷ 6x10⁻¹⁰ - 1x10⁻⁵
Bass Islands 3x10⁻⁸ 2x10⁻⁹ - 5x10⁻⁶ 1x10⁻⁵, 1x10-4* 1x10-5 - 3x10⁻⁴ Salina G Unit 1x10⁻⁹ 6x10⁻¹⁰ - 2x10⁻⁹ 1x10-11 NA
Note: * = Data for upper 20 m of formation
Review of Table 4.2 shows that horizontal hydraulic conductivities measured in DGR-7 from straddle-packer hydraulic testing in 2011 are comparable to those reported in the DGSM based on historical packer testing and review of drilling fluid losses in DGR boreholes. The reported geometric means and ranges of Kh from DGR-7 testing are very similar to those reported in the DGSM, with the exception of the Bass Islands and Salina G Unit data from the DGSM which were limited to high estimates from drilling fluid loss observations (Bass Islands) or for which no actual measurements are available (Salina G Unit). The effect of drilling fluid loss observations in DGR-7 and DGR-8 on 2011 Kh estimates is discussed in Section 4.2.
4.1.2 Formation Pressure and Hydraulic Head
Formation pressures and hydraulic heads were estimated from final recovery pressures on those DGR-7 straddle-packer tests where full recovery was obtained. Measured pressures were corrected for atmospheric pressure and transducer elevation offsets and converted to equivalent fresh water head (Lusczynski 1961, Jorgensen et al. 1982) representative of the middle of the test interval. The test zone transducer was located 5.925 m above the middle of the isolated test zone during DGR-7 testing and was hydraulically connected to the test zone via a length of 0.25 inch (6.3 mm) stainless steel tubing. Atmospheric pressures were recorded daily.
To determine formation pressure values applicable to the middle of the test zone, the transducer measurements were depth-corrected using the corresponding calculated average borehole fluid column density value above the test interval. Borehole fluid column density values were estimated using the static borehole water levels measured immediately prior to packer inflation of each test and test zone transducer pressure measurements. The fluid column density values represent the average fluid density of the water column in the borehole above the transducer and are not necessarily indicative of formation fluid density for the test interval. Fluid column density, formation pressure and equivalent freshwater head estimates are presented in Table 4.3 for the test intervals that experienced sufficient recovery for useful head estimates to be made. Ground surface elevation at DGR-7 is 186.20 mASL.
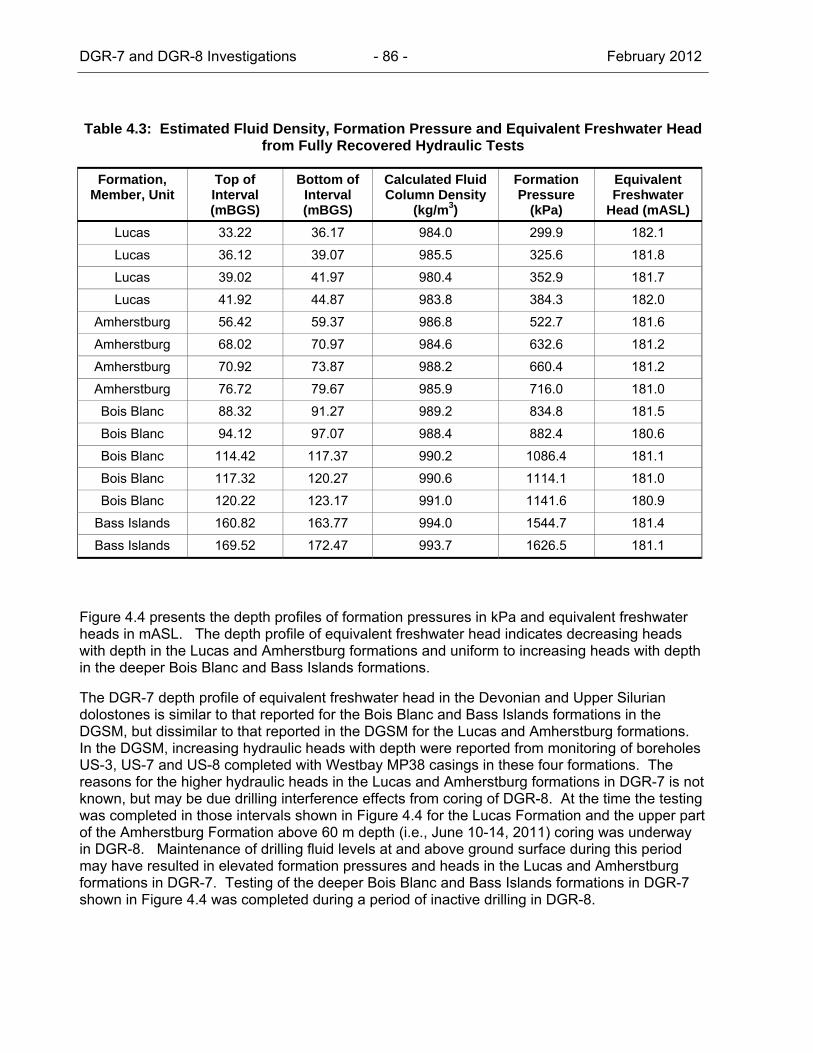
DGR-7 and DGR-8 Investigations - 86 - February 2012
Table 4.3: Estimated Fluid Density, Formation Pressure and Equivalent Freshwater Head from Fully Recovered Hydraulic Tests
Formation, Member, Unit
Top of Interval (mBGS)
Bottom of Interval (mBGS)
Calculated Fluid Column Density
(kg/m3)
Formation Pressure
(kPa)
Equivalent Freshwater
Head (mASL) Lucas 33.22 36.17 984.0 299.9 182.1
Lucas 36.12 39.07 985.5 325.6 181.8
Lucas 39.02 41.97 980.4 352.9 181.7
Lucas 41.92 44.87 983.8 384.3 182.0
Amherstburg 56.42 59.37 986.8 522.7 181.6
Amherstburg 68.02 70.97 984.6 632.6 181.2
Amherstburg 70.92 73.87 988.2 660.4 181.2
Amherstburg 76.72 79.67 985.9 716.0 181.0
Bois Blanc 88.32 91.27 989.2 834.8 181.5
Bois Blanc 94.12 97.07 988.4 882.4 180.6
Bois Blanc 114.42 117.37 990.2 1086.4 181.1
Bois Blanc 117.32 120.27 990.6 1114.1 181.0
Bois Blanc 120.22 123.17 991.0 1141.6 180.9
Bass Islands 160.82 163.77 994.0 1544.7 181.4
Bass Islands 169.52 172.47 993.7 1626.5 181.1
Figure 4.4 presents the depth profiles of formation pressures in kPa and equivalent freshwater heads in mASL. The depth profile of equivalent freshwater head indicates decreasing heads with depth in the Lucas and Amherstburg formations and uniform to increasing heads with depth in the deeper Bois Blanc and Bass Islands formations.
The DGR-7 depth profile of equivalent freshwater head in the Devonian and Upper Silurian dolostones is similar to that reported for the Bois Blanc and Bass Islands formations in the DGSM, but dissimilar to that reported in the DGSM for the Lucas and Amherstburg formations. In the DGSM, increasing hydraulic heads with depth were reported from monitoring of boreholes US-3, US-7 and US-8 completed with Westbay MP38 casings in these four formations. The reasons for the higher hydraulic heads in the Lucas and Amherstburg formations in DGR-7 is not known, but may be due drilling interference effects from coring of DGR-8. At the time the testing was completed in those intervals shown in Figure 4.4 for the Lucas Formation and the upper part of the Amherstburg Formation above 60 m depth (i.e., June 10-14, 2011) coring was underway in DGR-8. Maintenance of drilling fluid levels at and above ground surface during this period may have resulted in elevated formation pressures and heads in the Lucas and Amherstburg formations in DGR-7. Testing of the deeper Bois Blanc and Bass Islands formations in DGR-7 shown in Figure 4.4 was completed during a period of inactive drilling in DGR-8.
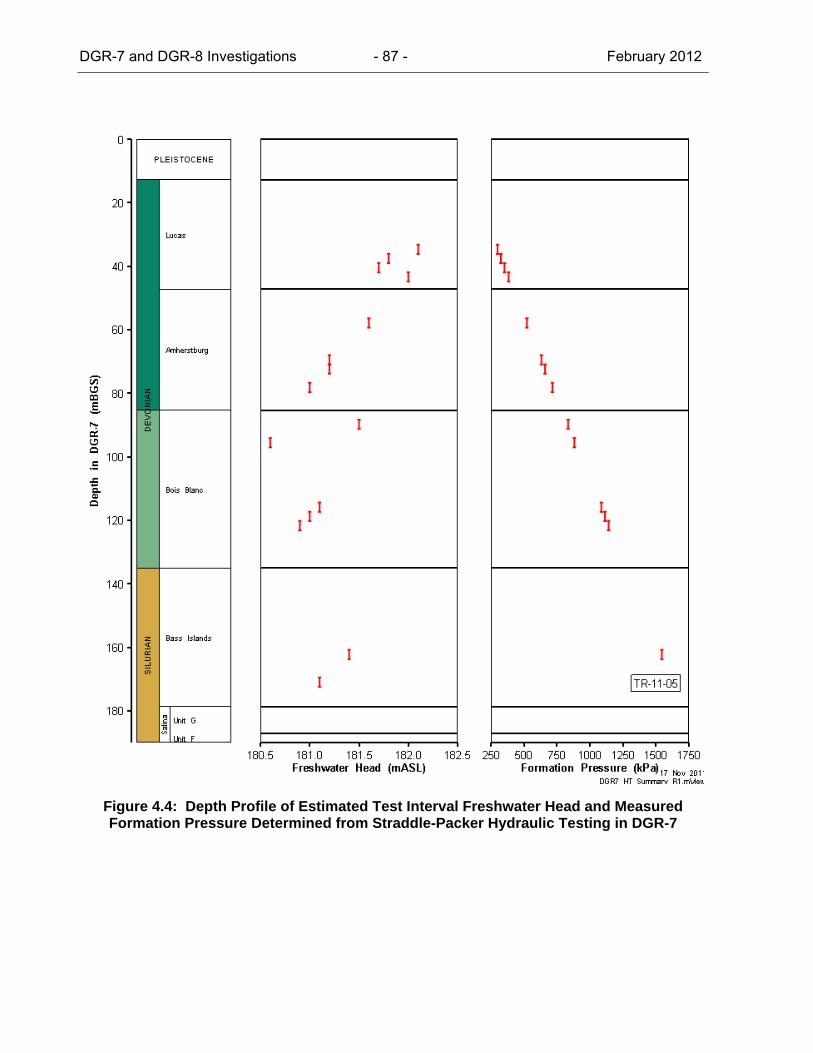
DGR-7 and DGR-8 Investigations - 87 - February 2012
Figure 4.4: Depth Profile of Estimated Test Interval Freshwater Head and Measured Formation Pressure Determined from Straddle-Packer Hydraulic Testing in DGR-7

DGR-7 and DGR-8 Investigations - 88 - February 2012
4.2 Drilling Fluid Losses
Drilling fluid loss measurements can provide approximate estimates of formation hydraulic properties when these loss measurements are combined with information on core run drilling times and formation pressures and hydraulic heads for the intervals being drilled. Figures 4.5 and 4.6 summarize the observations of drilling fluid loss in boreholes DGR-7 and DGR-8, respectively, as described in TR-11-03.
Figure 4.5: Drilling Fluid Losses in DGR-7
TR-11-05 and Figure 4.5 show that significant drilling fluid losses of several thousand L/core run occurred during drilling of DGR-7. DGR-7 drilling fluid losses ranged from 0 to 730 L/core run at depths of 0 to 25.9 mBGS and then increased to 1,800 to 3,000 L/core run between 25.9 and 40 mBGS. There was no drilling fluid return below a depth of about 57 mBGS in DGR-7 and measured drilling fluid losses below this depth ranged from 550 L/core run to a maximum of 8,500 L/core run. The average drilling fluid loss in DGR-7 was 4,600 L/core run. The total volume of drilling fluid lost during drilling of DGR-7 was approximately 246 m3.
TR-11-05 and Figure 4.6 summarize the drilling fluid losses during drilling of the upper part (0 - 195.7 mBGS) and the lower part (195.7 - 723.8 mBGS) of DGR-8. Trends in drilling fluid losses in the upper part of DGR-8 were similar to those observed in DGR-7 although total amounts lost in DGR-8 at 126 m3 were about half of those measured in DGR-7, and complete loss of drilling fluid circulation did not occur in DGR-8. Drilling fluid losses in the upper part of DGR-8 were negligible from 0 to 27.8 mBGS and then increased to a maximum of 3,400 L/core run at 39.8 -
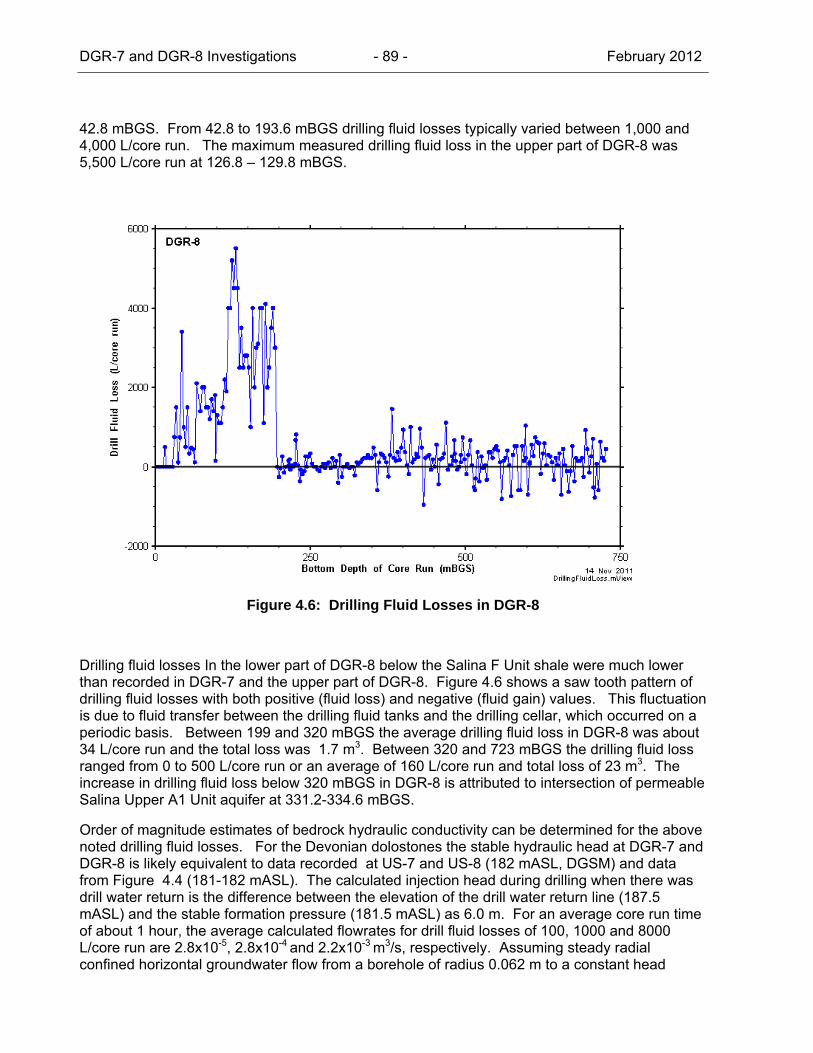
DGR-7 and DGR-8 Investigations - 89 - February 2012
42.8 mBGS. From 42.8 to 193.6 mBGS drilling fluid losses typically varied between 1,000 and 4,000 L/core run. The maximum measured drilling fluid loss in the upper part of DGR-8 was 5,500 L/core run at 126.8 – 129.8 mBGS.
Figure 4.6: Drilling Fluid Losses in DGR-8
Drilling fluid losses In the lower part of DGR-8 below the Salina F Unit shale were much lower than recorded in DGR-7 and the upper part of DGR-8. Figure 4.6 shows a saw tooth pattern of drilling fluid losses with both positive (fluid loss) and negative (fluid gain) values. This fluctuation is due to fluid transfer between the drilling fluid tanks and the drilling cellar, which occurred on a periodic basis. Between 199 and 320 mBGS the average drilling fluid loss in DGR-8 was about 34 L/core run and the total loss was 1.7 m3. Between 320 and 723 mBGS the drilling fluid loss ranged from 0 to 500 L/core run or an average of 160 L/core run and total loss of 23 m3. The increase in drilling fluid loss below 320 mBGS in DGR-8 is attributed to intersection of permeable Salina Upper A1 Unit aquifer at 331.2-334.6 mBGS.
Order of magnitude estimates of bedrock hydraulic conductivity can be determined for the above noted drilling fluid losses. For the Devonian dolostones the stable hydraulic head at DGR-7 and DGR-8 is likely equivalent to data recorded at US-7 and US-8 (182 mASL, DGSM) and data from Figure 4.4 (181-182 mASL). The calculated injection head during drilling when there was drill water return is the difference between the elevation of the drill water return line (187.5 mASL) and the stable formation pressure (181.5 mASL) as 6.0 m. For an average core run time of about 1 hour, the average calculated flowrates for drill fluid losses of 100, 1000 and 8000 L/core run are 2.8x10⁻⁵, 2.8x10⁻⁴ and 2.2x10⁻³ m3/s, respectively. Assuming steady radial confined horizontal groundwater flow from a borehole of radius 0.062 m to a constant head
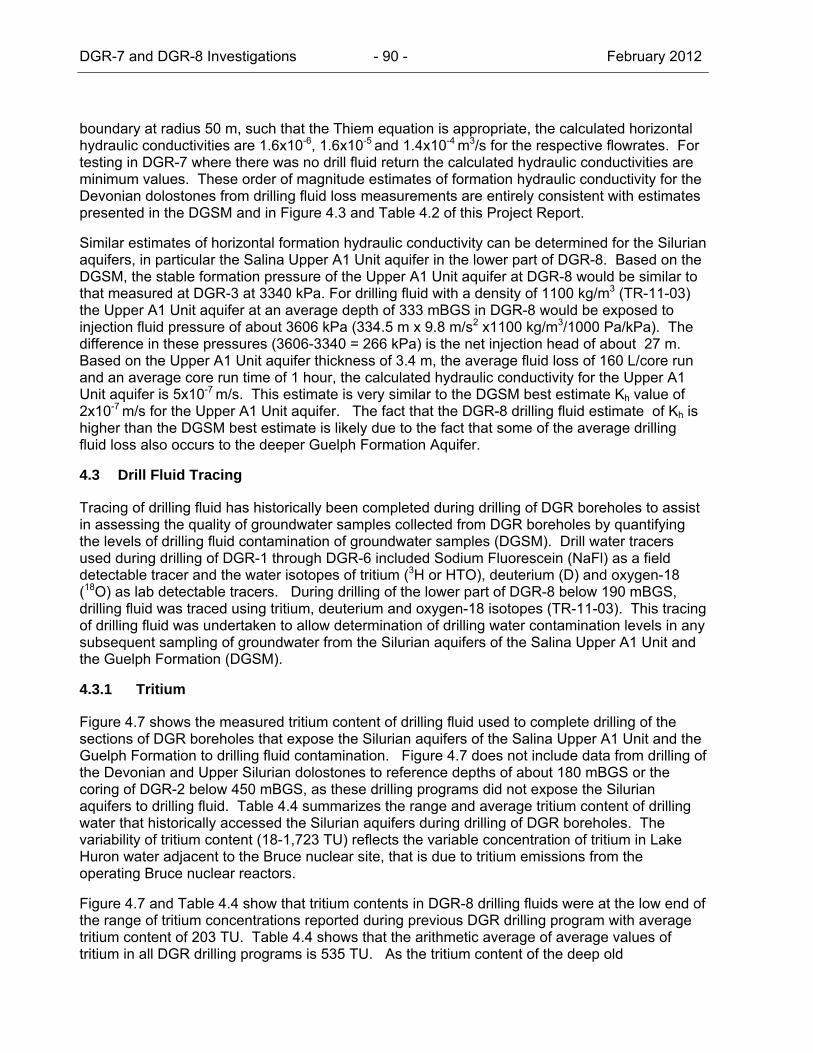
DGR-7 and DGR-8 Investigations - 90 - February 2012
boundary at radius 50 m, such that the Thiem equation is appropriate, the calculated horizontal hydraulic conductivities are 1.6x10⁻⁶, 1.6x10⁻⁵ and 1.4x10⁻⁴ m3/s for the respective flowrates. For testing in DGR-7 where there was no drill fluid return the calculated hydraulic conductivities are minimum values. These order of magnitude estimates of formation hydraulic conductivity for the Devonian dolostones from drilling fluid loss measurements are entirely consistent with estimates presented in the DGSM and in Figure 4.3 and Table 4.2 of this Project Report.
Similar estimates of horizontal formation hydraulic conductivity can be determined for the Silurian aquifers, in particular the Salina Upper A1 Unit aquifer in the lower part of DGR-8. Based on the DGSM, the stable formation pressure of the Upper A1 Unit aquifer at DGR-8 would be similar to that measured at DGR-3 at 3340 kPa. For drilling fluid with a density of 1100 kg/m3 (TR-11-03) the Upper A1 Unit aquifer at an average depth of 333 mBGS in DGR-8 would be exposed to injection fluid pressure of about 3606 kPa (334.5 m x 9.8 m/s2 x1100 kg/m3/1000 Pa/kPa). The difference in these pressures (3606-3340 = 266 kPa) is the net injection head of about 27 m. Based on the Upper A1 Unit aquifer thickness of 3.4 m, the average fluid loss of 160 L/core run and an average core run time of 1 hour, the calculated hydraulic conductivity for the Upper A1 Unit aquifer is 5x10⁻⁷ m/s. This estimate is very similar to the DGSM best estimate Kh value of 2x10⁻⁷ m/s for the Upper A1 Unit aquifer. The fact that the DGR-8 drilling fluid estimate of Kh is higher than the DGSM best estimate is likely due to the fact that some of the average drilling fluid loss also occurs to the deeper Guelph Formation Aquifer.
4.3 Drill Fluid Tracing
Tracing of drilling fluid has historically been completed during drilling of DGR boreholes to assist in assessing the quality of groundwater samples collected from DGR boreholes by quantifying the levels of drilling fluid contamination of groundwater samples (DGSM). Drill water tracers used during drilling of DGR-1 through DGR-6 included Sodium Fluorescein (NaFl) as a field detectable tracer and the water isotopes of tritium (3H or HTO), deuterium (D) and oxygen-18 (18O) as lab detectable tracers. During drilling of the lower part of DGR-8 below 190 mBGS, drilling fluid was traced using tritium, deuterium and oxygen-18 isotopes (TR-11-03). This tracing of drilling fluid was undertaken to allow determination of drilling water contamination levels in any subsequent sampling of groundwater from the Silurian aquifers of the Salina Upper A1 Unit and the Guelph Formation (DGSM).
4.3.1 Tritium
Figure 4.7 shows the measured tritium content of drilling fluid used to complete drilling of the sections of DGR boreholes that expose the Silurian aquifers of the Salina Upper A1 Unit and the Guelph Formation to drilling fluid contamination. Figure 4.7 does not include data from drilling of the Devonian and Upper Silurian dolostones to reference depths of about 180 mBGS or the coring of DGR-2 below 450 mBGS, as these drilling programs did not expose the Silurian aquifers to drilling fluid. Table 4.4 summarizes the range and average tritium content of drilling water that historically accessed the Silurian aquifers during drilling of DGR boreholes. The variability of tritium content (18-1,723 TU) reflects the variable concentration of tritium in Lake Huron water adjacent to the Bruce nuclear site, that is due to tritium emissions from the operating Bruce nuclear reactors.
Figure 4.7 and Table 4.4 show that tritium contents in DGR-8 drilling fluids were at the low end of the range of tritium concentrations reported during previous DGR drilling program with average tritium content of 203 TU. Table 4.4 shows that the arithmetic average of average values of tritium in all DGR drilling programs is 535 TU. As the tritium content of the deep old
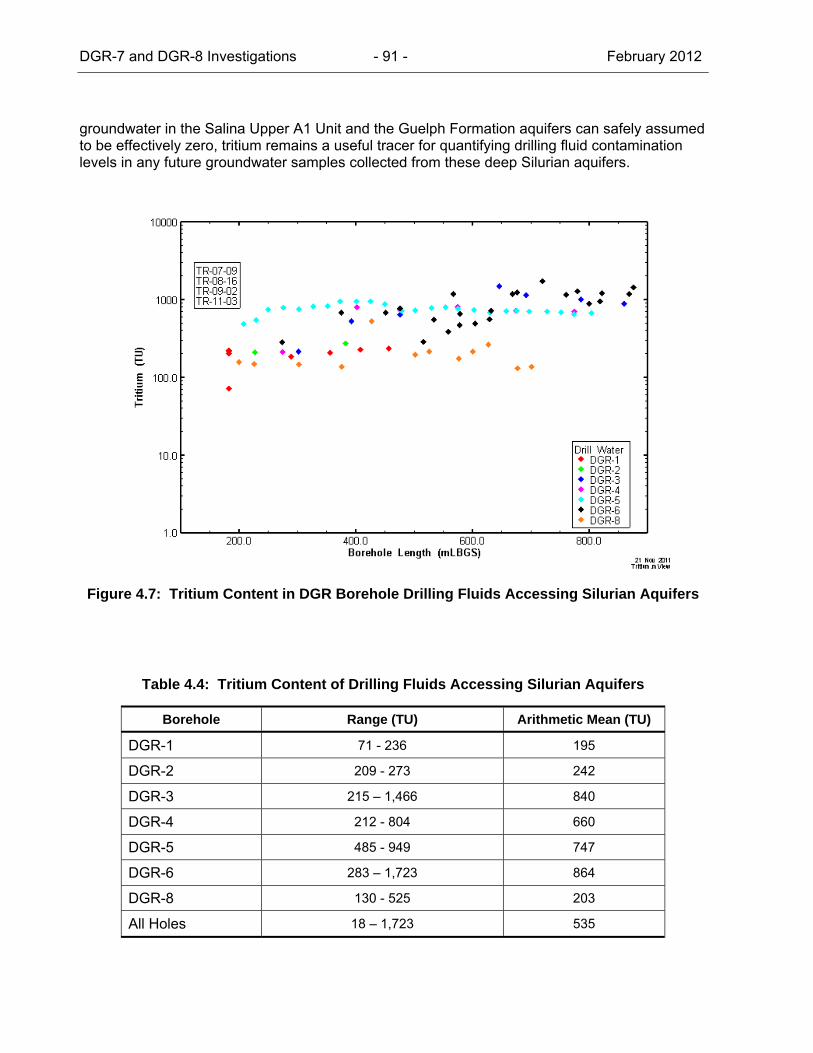
DGR-7 and DGR-8 Investigations - 91 - February 2012
groundwater in the Salina Upper A1 Unit and the Guelph Formation aquifers can safely assumed to be effectively zero, tritium remains a useful tracer for quantifying drilling fluid contamination levels in any future groundwater samples collected from these deep Silurian aquifers.
Figure 4.7: Tritium Content in DGR Borehole Drilling Fluids Accessing Silurian Aquifers
Table 4.4: Tritium Content of Drilling Fluids Accessing Silurian Aquifers
Borehole Range (TU) Arithmetic Mean (TU)
DGR-1 71 - 236 195
DGR-2 209 - 273 242
DGR-3 215 – 1,466 840
DGR-4 212 - 804 660
DGR-5 485 - 949 747
DGR-6 283 – 1,723 864
DGR-8 130 - 525 203
All Holes 18 – 1,723 535
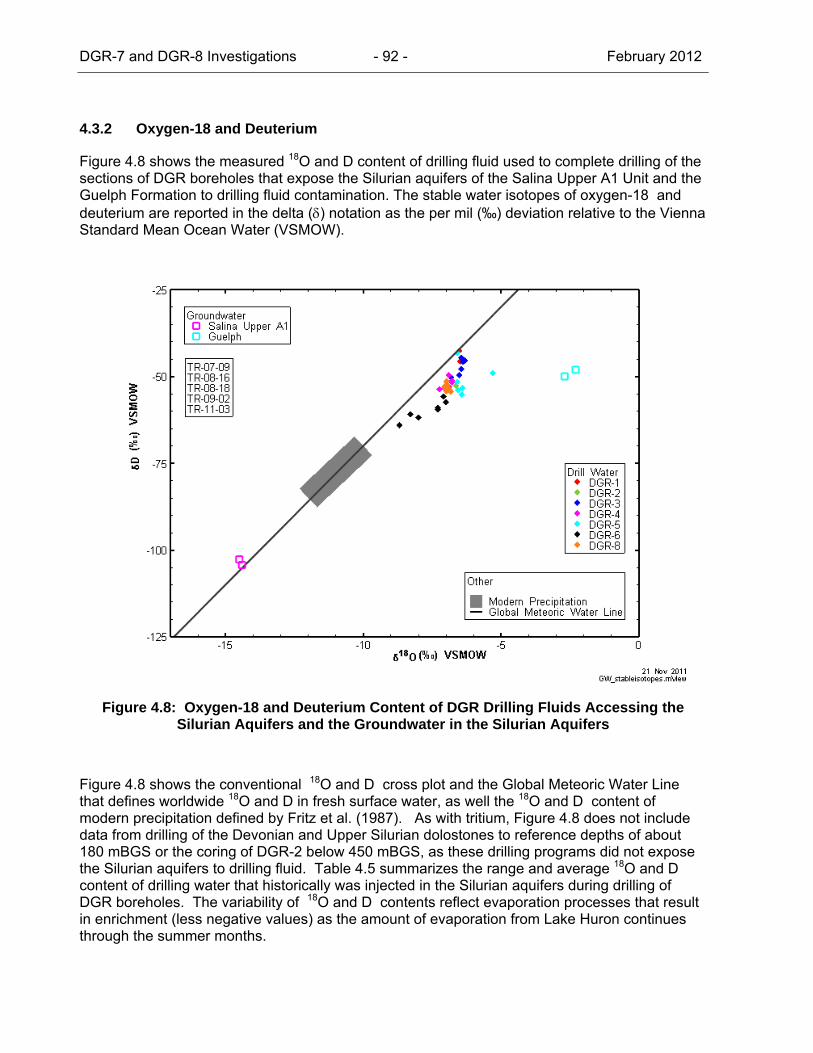
DGR-7 and DGR-8 Investigations - 92 - February 2012
4.3.2 Oxygen-18 and Deuterium
Figure 4.8 shows the measured 18O and D content of drilling fluid used to complete drilling of the sections of DGR boreholes that expose the Silurian aquifers of the Salina Upper A1 Unit and the Guelph Formation to drilling fluid contamination. The stable water isotopes of oxygen-18 and deuterium are reported in the delta (δ) notation as the per mil (‰) deviation relative to the Vienna Standard Mean Ocean Water (VSMOW).
Figure 4.8: Oxygen-18 and Deuterium Content of DGR Drilling Fluids Accessing the Silurian Aquifers and the Groundwater in the Silurian Aquifers
Figure 4.8 shows the conventional 18O and D cross plot and the Global Meteoric Water Line that defines worldwide 18O and D in fresh surface water, as well the 18O and D content of modern precipitation defined by Fritz et al. (1987). As with tritium, Figure 4.8 does not include data from drilling of the Devonian and Upper Silurian dolostones to reference depths of about 180 mBGS or the coring of DGR-2 below 450 mBGS, as these drilling programs did not expose the Silurian aquifers to drilling fluid. Table 4.5 summarizes the range and average 18O and D content of drilling water that historically was injected in the Silurian aquifers during drilling of DGR boreholes. The variability of 18O and D contents reflect evaporation processes that result in enrichment (less negative values) as the amount of evaporation from Lake Huron continues through the summer months.
DGR-7 and DGR-8 Investigations - 93 - February 2012
Figure 4.8 and Table 4.5 show that δ18O and δD contents in DGR-8 drilling fluids were in the mid range of values reported during previous DGR drilling programs. The average δ18O and δD contents in DGR-8 drilling fluids were -6.96 ‰ and -53.0 ‰, respectively. These DGR-8 average isotope contents are very similar to the overall average δ18O and δD contents in all DGR drilling fluids that accessed the Silurian aquifers during all DGR drilling programs at -6.80 ‰ and -51.6 ‰, respectively (Table 4.5).
Figure 4.8 also shows the δ18O and δD contents of groundwater from the Salina Upper A1 Unit and the Guelph Formation aquifers. As there is significant separation between the δ18O and δD signatures of the Silurian aquifer groundwaters and DGR drilling fluids that may have entered these deep aquifers, 18O and D remain useful tracers for quantifying drilling fluid contamination levels in any future groundwater samples collected from these deep Silurian aquifers.
Table 4.5: Oxygen-18 and Deuterium Content of Drilling Fluids Accessing Silurian Aquifers
Borehole Range (‰ VSMOW) Arithmetic Mean (‰ VSMOW)
δ18O δD δ18O δD
DGR-1 -6.49 - -6.53 -42.69 - -45.79 -6.50 -44.8
DGR-2 -6.64 - -6.64 -52.7 - -52.7 -6.64 -52.7
DGR-3 -6.31 - -6.93 -44.6 - -52.6 -6.55 -48.1
DGR-4 -6.79 - -7.24 -49.64 - -53.79 -6.94 -52.1
DGR-5 -5.3 - -6.6 -43.2 - -55.2 -6.3 -51.1
DGR-6 -7.0 - -8.3 -55.8 - -64.1 -7.67 -59.8
DGR-8 -6.83 - -7.06 -51.4 - -54.4 -6.96 -53.0
All Holes -5.3 - -8.3 -42.69 - -64.1 -6.80 -51.6
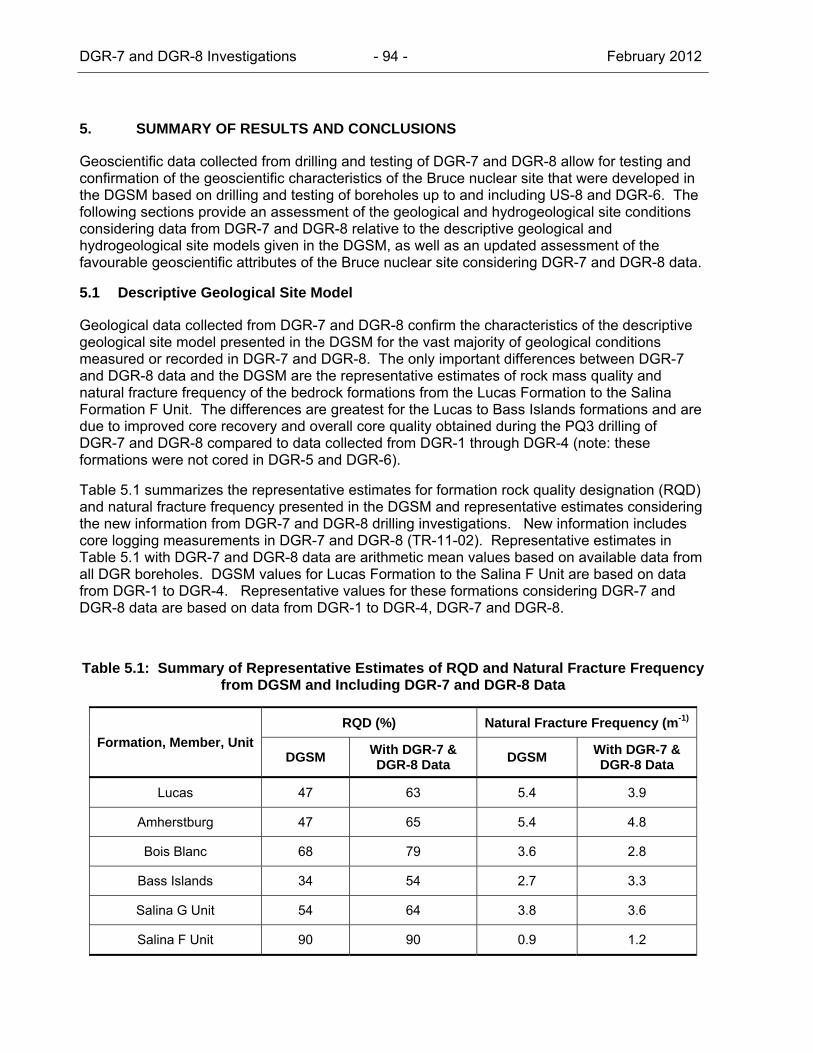
DGR-7 and DGR-8 Investigations - 94 - February 2012
5. SUMMARY OF RESULTS AND CONCLUSIONS
Geoscientific data collected from drilling and testing of DGR-7 and DGR-8 allow for testing and confirmation of the geoscientific characteristics of the Bruce nuclear site that were developed in the DGSM based on drilling and testing of boreholes up to and including US-8 and DGR-6. The following sections provide an assessment of the geological and hydrogeological site conditions considering data from DGR-7 and DGR-8 relative to the descriptive geological and hydrogeological site models given in the DGSM, as well as an updated assessment of the favourable geoscientific attributes of the Bruce nuclear site considering DGR-7 and DGR-8 data.
5.1 Descriptive Geological Site Model
Geological data collected from DGR-7 and DGR-8 confirm the characteristics of the descriptive geological site model presented in the DGSM for the vast majority of geological conditions measured or recorded in DGR-7 and DGR-8. The only important differences between DGR-7 and DGR-8 data and the DGSM are the representative estimates of rock mass quality and natural fracture frequency of the bedrock formations from the Lucas Formation to the Salina Formation F Unit. The differences are greatest for the Lucas to Bass Islands formations and are due to improved core recovery and overall core quality obtained during the PQ3 drilling of DGR-7 and DGR-8 compared to data collected from DGR-1 through DGR-4 (note: these formations were not cored in DGR-5 and DGR-6).
Table 5.1 summarizes the representative estimates for formation rock quality designation (RQD) and natural fracture frequency presented in the DGSM and representative estimates considering the new information from DGR-7 and DGR-8 drilling investigations. New information includes core logging measurements in DGR-7 and DGR-8 (TR-11-02). Representative estimates in Table 5.1 with DGR-7 and DGR-8 data are arithmetic mean values based on available data from all DGR boreholes. DGSM values for Lucas Formation to the Salina F Unit are based on data from DGR-1 to DGR-4. Representative values for these formations considering DGR-7 and DGR-8 data are based on data from DGR-1 to DGR-4, DGR-7 and DGR-8.
Table 5.1: Summary of Representative Estimates of RQD and Natural Fracture Frequency from DGSM and Including DGR-7 and DGR-8 Data
Formation, Member, Unit RQD (%) Natural Fracture Frequency (m-1)
DGSM With DGR-7 & DGR-8 Data DGSM With DGR-7 &
DGR-8 Data
Lucas 47 63 5.4 3.9
Amherstburg 47 65 5.4 4.8
Bois Blanc 68 79 3.6 2.8
Bass Islands 34 54 2.7 3.3
Salina G Unit 54 64 3.8 3.6
Salina F Unit 90 90 0.9 1.2
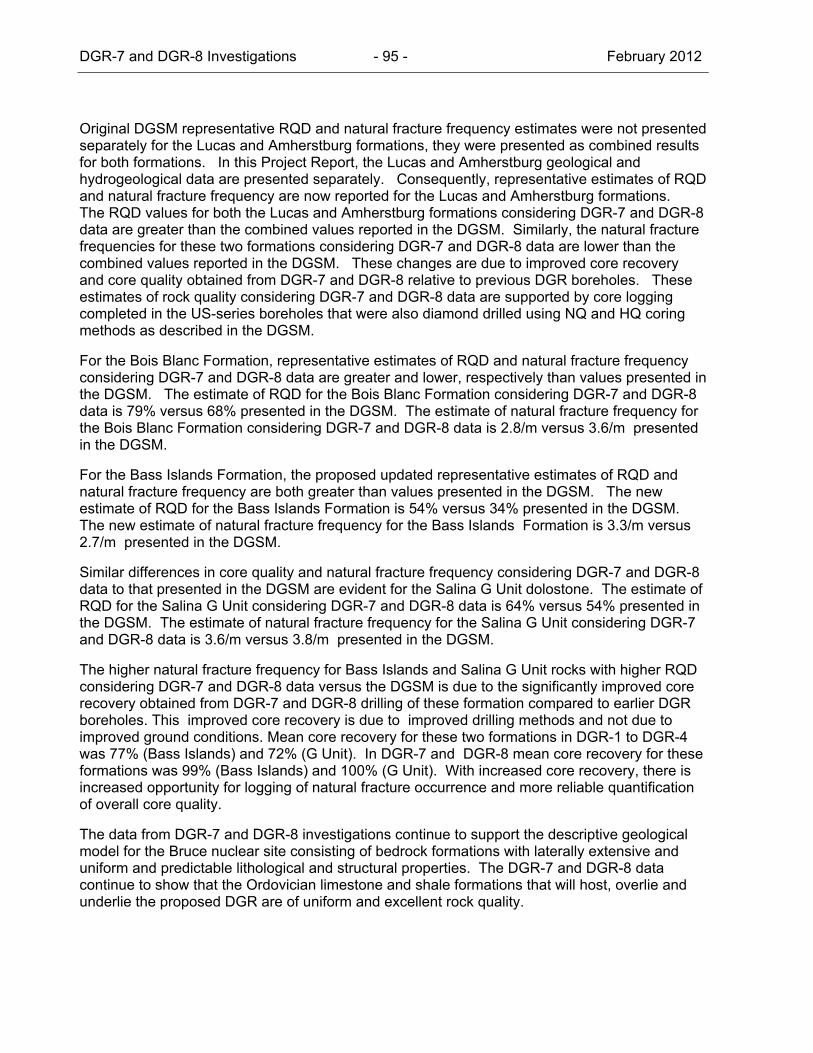
DGR-7 and DGR-8 Investigations - 95 - February 2012
Original DGSM representative RQD and natural fracture frequency estimates were not presented separately for the Lucas and Amherstburg formations, they were presented as combined results for both formations. In this Project Report, the Lucas and Amherstburg geological and hydrogeological data are presented separately. Consequently, representative estimates of RQD and natural fracture frequency are now reported for the Lucas and Amherstburg formations. The RQD values for both the Lucas and Amherstburg formations considering DGR-7 and DGR-8 data are greater than the combined values reported in the DGSM. Similarly, the natural fracture frequencies for these two formations considering DGR-7 and DGR-8 data are lower than the combined values reported in the DGSM. These changes are due to improved core recovery and core quality obtained from DGR-7 and DGR-8 relative to previous DGR boreholes. These estimates of rock quality considering DGR-7 and DGR-8 data are supported by core logging completed in the US-series boreholes that were also diamond drilled using NQ and HQ coring methods as described in the DGSM.
For the Bois Blanc Formation, representative estimates of RQD and natural fracture frequency considering DGR-7 and DGR-8 data are greater and lower, respectively than values presented in the DGSM. The estimate of RQD for the Bois Blanc Formation considering DGR-7 and DGR-8 data is 79% versus 68% presented in the DGSM. The estimate of natural fracture frequency for the Bois Blanc Formation considering DGR-7 and DGR-8 data is 2.8/m versus 3.6/m presented in the DGSM.
For the Bass Islands Formation, the proposed updated representative estimates of RQD and natural fracture frequency are both greater than values presented in the DGSM. The new estimate of RQD for the Bass Islands Formation is 54% versus 34% presented in the DGSM. The new estimate of natural fracture frequency for the Bass Islands Formation is 3.3/m versus 2.7/m presented in the DGSM.
Similar differences in core quality and natural fracture frequency considering DGR-7 and DGR-8 data to that presented in the DGSM are evident for the Salina G Unit dolostone. The estimate of RQD for the Salina G Unit considering DGR-7 and DGR-8 data is 64% versus 54% presented in the DGSM. The estimate of natural fracture frequency for the Salina G Unit considering DGR-7 and DGR-8 data is 3.6/m versus 3.8/m presented in the DGSM.
The higher natural fracture frequency for Bass Islands and Salina G Unit rocks with higher RQD considering DGR-7 and DGR-8 data versus the DGSM is due to the significantly improved core recovery obtained from DGR-7 and DGR-8 drilling of these formation compared to earlier DGR boreholes. This improved core recovery is due to improved drilling methods and not due to improved ground conditions. Mean core recovery for these two formations in DGR-1 to DGR-4 was 77% (Bass Islands) and 72% (G Unit). In DGR-7 and DGR-8 mean core recovery for these formations was 99% (Bass Islands) and 100% (G Unit). With increased core recovery, there is increased opportunity for logging of natural fracture occurrence and more reliable quantification of overall core quality.
The data from DGR-7 and DGR-8 investigations continue to support the descriptive geological model for the Bruce nuclear site consisting of bedrock formations with laterally extensive and uniform and predictable lithological and structural properties. The DGR-7 and DGR-8 data continue to show that the Ordovician limestone and shale formations that will host, overlie and underlie the proposed DGR are of uniform and excellent rock quality.
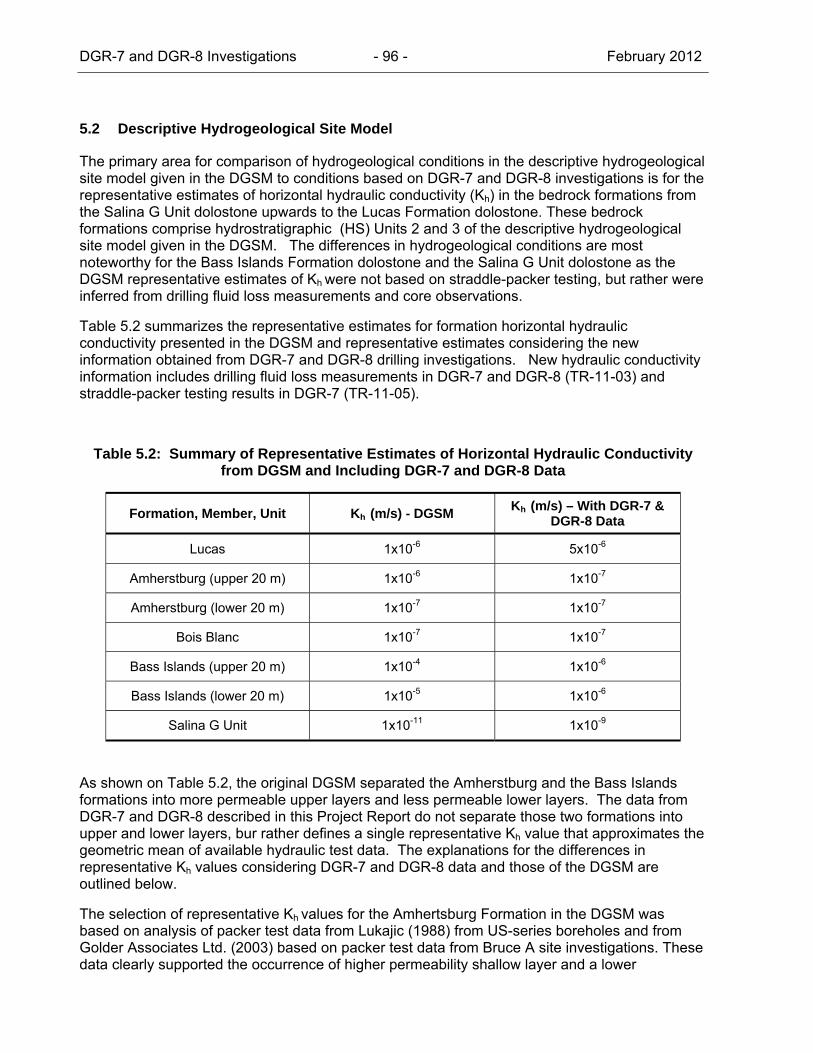
DGR-7 and DGR-8 Investigations - 96 - February 2012
5.2 Descriptive Hydrogeological Site Model
The primary area for comparison of hydrogeological conditions in the descriptive hydrogeological site model given in the DGSM to conditions based on DGR-7 and DGR-8 investigations is for the representative estimates of horizontal hydraulic conductivity (Kh) in the bedrock formations from the Salina G Unit dolostone upwards to the Lucas Formation dolostone. These bedrock formations comprise hydrostratigraphic (HS) Units 2 and 3 of the descriptive hydrogeological site model given in the DGSM. The differences in hydrogeological conditions are most noteworthy for the Bass Islands Formation dolostone and the Salina G Unit dolostone as the DGSM representative estimates of Kh were not based on straddle-packer testing, but rather were inferred from drilling fluid loss measurements and core observations.
Table 5.2 summarizes the representative estimates for formation horizontal hydraulic conductivity presented in the DGSM and representative estimates considering the new information obtained from DGR-7 and DGR-8 drilling investigations. New hydraulic conductivity information includes drilling fluid loss measurements in DGR-7 and DGR-8 (TR-11-03) and straddle-packer testing results in DGR-7 (TR-11-05).
Table 5.2: Summary of Representative Estimates of Horizontal Hydraulic Conductivity from DGSM and Including DGR-7 and DGR-8 Data
Formation, Member, Unit Kh (m/s) - DGSM Kh (m/s) – With DGR-7 & DGR-8 Data
Lucas 1x10⁻⁶ 5x10⁻⁶
Amherstburg (upper 20 m) 1x10⁻⁶ 1x10⁻⁷
Amherstburg (lower 20 m) 1x10⁻⁷ 1x10⁻⁷
Bois Blanc 1x10⁻⁷ 1x10⁻⁷
Bass Islands (upper 20 m) 1x10⁻⁴ 1x10⁻⁶
Bass Islands (lower 20 m) 1x10⁻⁵ 1x10⁻⁶
Salina G Unit 1x10-11 1x10⁻⁹
As shown on Table 5.2, the original DGSM separated the Amherstburg and the Bass Islands formations into more permeable upper layers and less permeable lower layers. The data from DGR-7 and DGR-8 described in this Project Report do not separate those two formations into upper and lower layers, bur rather defines a single representative Kh value that approximates the geometric mean of available hydraulic test data. The explanations for the differences in representative Kh values considering DGR-7 and DGR-8 data and those of the DGSM are outlined below.
The selection of representative Kh values for the Amhertsburg Formation in the DGSM was based on analysis of packer test data from Lukajic (1988) from US-series boreholes and from Golder Associates Ltd. (2003) based on packer test data from Bruce A site investigations. These data clearly supported the occurrence of higher permeability shallow layer and a lower
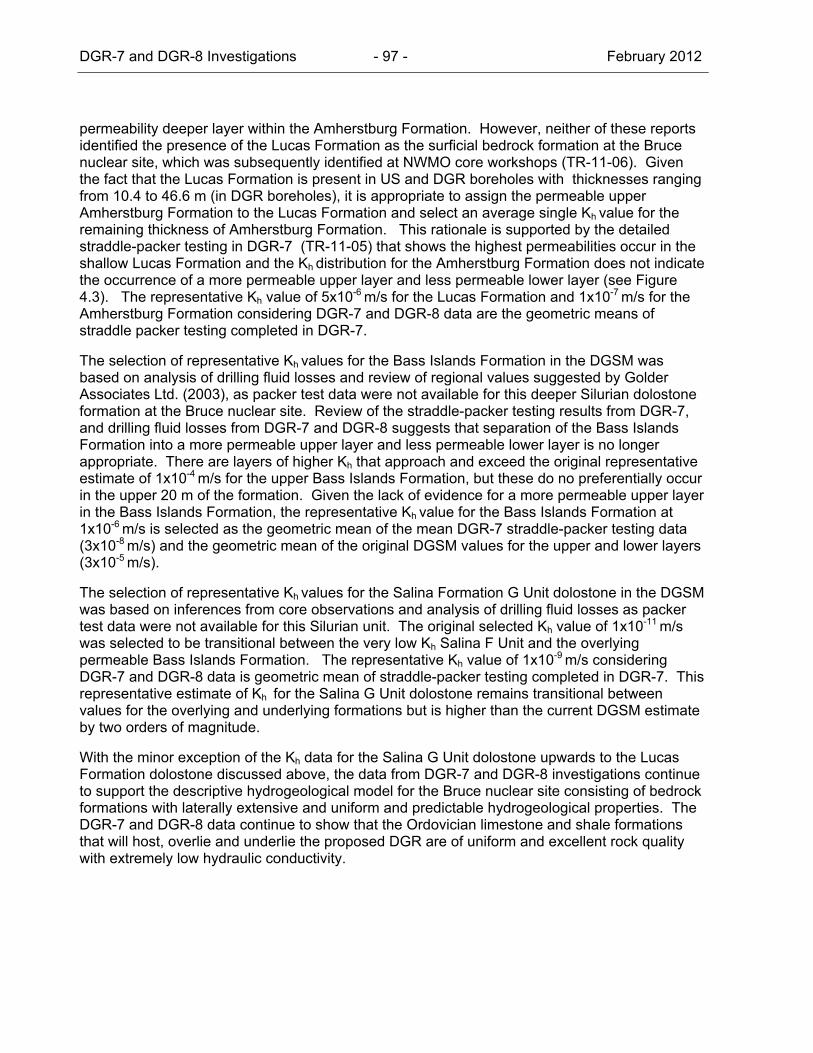
DGR-7 and DGR-8 Investigations - 97 - February 2012
permeability deeper layer within the Amherstburg Formation. However, neither of these reports identified the presence of the Lucas Formation as the surficial bedrock formation at the Bruce nuclear site, which was subsequently identified at NWMO core workshops (TR-11-06). Given the fact that the Lucas Formation is present in US and DGR boreholes with thicknesses ranging from 10.4 to 46.6 m (in DGR boreholes), it is appropriate to assign the permeable upper Amherstburg Formation to the Lucas Formation and select an average single Kh value for the remaining thickness of Amherstburg Formation. This rationale is supported by the detailed straddle-packer testing in DGR-7 (TR-11-05) that shows the highest permeabilities occur in the shallow Lucas Formation and the Kh distribution for the Amherstburg Formation does not indicate the occurrence of a more permeable upper layer and less permeable lower layer (see Figure 4.3). The representative Kh value of 5x10⁻⁶ m/s for the Lucas Formation and 1x10⁻⁷ m/s for the Amherstburg Formation considering DGR-7 and DGR-8 data are the geometric means of straddle packer testing completed in DGR-7.
The selection of representative Kh values for the Bass Islands Formation in the DGSM was based on analysis of drilling fluid losses and review of regional values suggested by Golder Associates Ltd. (2003), as packer test data were not available for this deeper Silurian dolostone formation at the Bruce nuclear site. Review of the straddle-packer testing results from DGR-7, and drilling fluid losses from DGR-7 and DGR-8 suggests that separation of the Bass Islands Formation into a more permeable upper layer and less permeable lower layer is no longer appropriate. There are layers of higher Kh that approach and exceed the original representative estimate of 1x10⁻⁴ m/s for the upper Bass Islands Formation, but these do no preferentially occur in the upper 20 m of the formation. Given the lack of evidence for a more permeable upper layer in the Bass Islands Formation, the representative Kh value for the Bass Islands Formation at 1x10⁻⁶ m/s is selected as the geometric mean of the mean DGR-7 straddle-packer testing data (3x10⁻⁸ m/s) and the geometric mean of the original DGSM values for the upper and lower layers (3x10⁻⁵ m/s).
The selection of representative Kh values for the Salina Formation G Unit dolostone in the DGSM was based on inferences from core observations and analysis of drilling fluid losses as packer test data were not available for this Silurian unit. The original selected Kh value of 1x10-11 m/s was selected to be transitional between the very low Kh Salina F Unit and the overlying permeable Bass Islands Formation. The representative Kh value of 1x10⁻⁹ m/s considering DGR-7 and DGR-8 data is geometric mean of straddle-packer testing completed in DGR-7. This representative estimate of Kh for the Salina G Unit dolostone remains transitional between values for the overlying and underlying formations but is higher than the current DGSM estimate by two orders of magnitude.
With the minor exception of the Kh data for the Salina G Unit dolostone upwards to the Lucas Formation dolostone discussed above, the data from DGR-7 and DGR-8 investigations continue to support the descriptive hydrogeological model for the Bruce nuclear site consisting of bedrock formations with laterally extensive and uniform and predictable hydrogeological properties. The DGR-7 and DGR-8 data continue to show that the Ordovician limestone and shale formations that will host, overlie and underlie the proposed DGR are of uniform and excellent rock quality with extremely low hydraulic conductivity.
DGR-7 and DGR-8 Investigations - 98 - February 2012
5.3 Assessment of Favourable Geoscientific Site Attributes
The Geosynthesis Report (NWMO 2011) provides a listing of seven favourable geoscientific site attributes and/or characteristics of the Bruce nuclear site that are useful for demonstration of geoscientific site suitability for implementation of the DGR concept. The currency of these favourable geoscientific site attributes are assessed below based on the geoscientific data obtained from drilling, testing and logging of DGR-7 and DGR-8.
Site Predictability
The geoscientific information obtained from DGR-7 and DGR-8 continue to show that that the primary Ordovician barrier rocks for the DGR at the Bruce nuclear site are near-horizontal, layered, undeformed sedimentary shale and limestone formations of large lateral extent. These Ordovician formations, as well as the overlying Silurian and Devonian formations are consistent and predictable at the site scale with respect to geological, hydrogeological and geomechanical properties.
Multiple Natural Barriers
No geoscientific data were obtained from drilling and testing of DGR-7 and DGR-8 to contradict the hypothesis developed in the Geosynthesis Report that the sedimentary sequence underlying the Bruce nuclear site is comprised of multiple low-permeability formations that would enclose and overlie the DGR. Although no additional detailed hydraulic testing of deep Silurian and Ordovician bedrock formations are reported in this Project Report, the generally consistent observations of core quality and formation integrity from drilling and core/geophysical logging activities in DGR-7 and DGR-8 with earlier DGR boreholes, indicate the multiple barrier hypothesis remains appropriate for the Bruce nuclear site.
Contaminant Transport is Diffusion Dominated
The Geosynthesis Report hypothesized that the deep groundwater regime at the Bruce nuclear site was ancient showing no evidence of glacial perturbations or cross-formational groundwater flow. Although no additional detailed core testing for diffusion properties and porewater characterization are reported in this Project Report, the generally consistent observations of core quality and formation integrity from drilling and core/geophysical logging activities in DGR-7 and DGR-8 with earlier DGR boreholes, indicate the diffusion-dominant transport hypothesis remains appropriate for the Bruce nuclear site.
Seismically Quiet
The Geosynthesis Report hypothesized that the Bruce nuclear site was seismically quiet and comparable to a stable Canadian Shield setting. No new information was collected in this Project Report to allow for assessment of this hypothesis.
Geomechanically Stable
No geoscientific data were obtained from drilling and testing of DGR-7 and DGR-8 to contradict the hypothesis developed in the Geosynthesis Report that the selected DGR limestone formation will provide stable, virtually dry openings. The lack of borehole breakouts in DGR-7 and DGR-8 and the similarity of core quality and formation integrity from core/geophysical logging activities in DGR-7 and DGR-8 with earlier DGR boreholes indicates that the hypothesis of geomechanical stability remains appropriate for the Bruce nuclear site.
DGR-7 and DGR-8 Investigations - 99 - February 2012
Natural Resource Potential is Low
Observations of oil and gas occurrence in recovered core from DGR-7 and DGR-8 confirm the Geosynthesis Report assessment that commercially viable oil and gas reserves are not present at the Bruce nuclear site.
Shallow Groundwater Resources are Isolated
The Geosynthesis Report hypothesized that near-surface groundwater aquifers at the Bruce nuclear site were isolated from the deep saline groundwater system. No new geoscientific data were collected from DGR-7 and DGR-8 to refute that hypothesis. The similarity of core quality and formation integrity from core/geophysical logging activities in DGR-7 and DGR-8 with earlier DGR boreholes confirms that the hypothesis of isolation and protection of shallow groundwater resources is appropriate for the Bruce nuclear site.
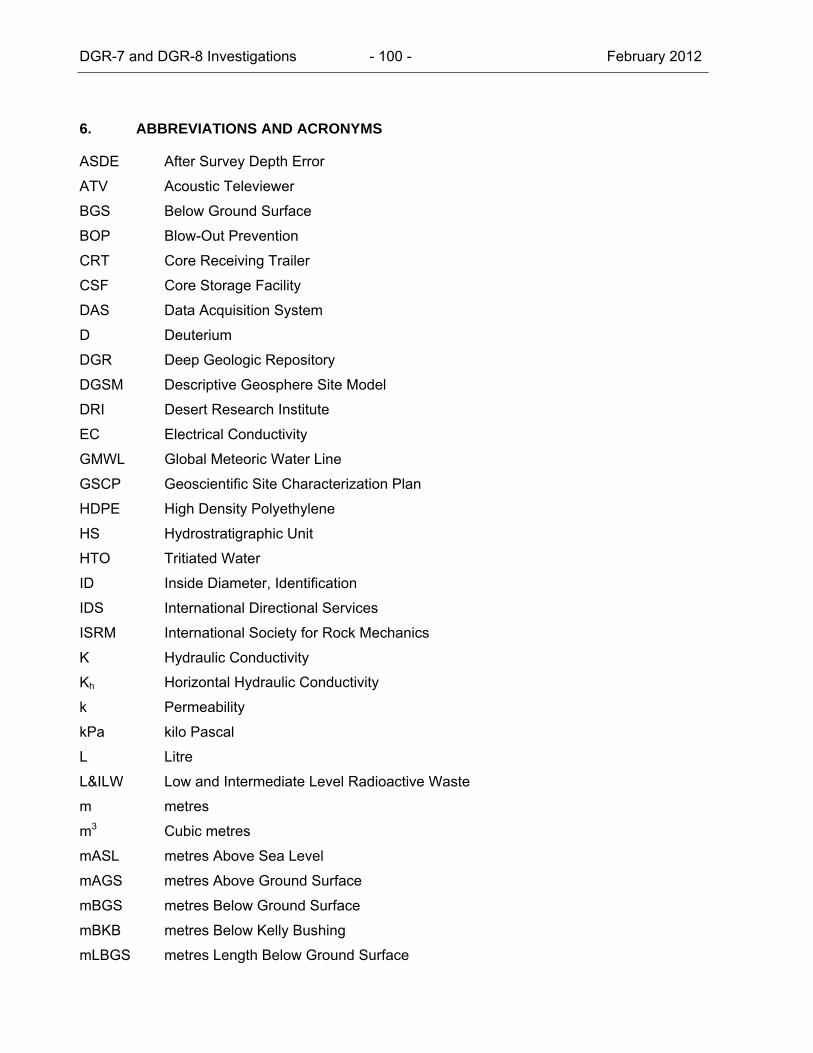
DGR-7 and DGR-8 Investigations - 100 - February 2012
6. ABBREVIATIONS AND ACRONYMS
ASDE After Survey Depth Error
ATV Acoustic Televiewer
BGS Below Ground Surface
BOP Blow-Out Prevention
CRT Core Receiving Trailer
CSF Core Storage Facility
DAS Data Acquisition System
D Deuterium
DGR Deep Geologic Repository
DGSM Descriptive Geosphere Site Model
DRI Desert Research Institute
EC Electrical Conductivity
GMWL Global Meteoric Water Line
GSCP Geoscientific Site Characterization Plan
HDPE High Density Polyethylene
HS Hydrostratigraphic Unit
HTO Tritiated Water
ID Inside Diameter, Identification
IDS International Directional Services
ISRM International Society for Rock Mechanics
K Hydraulic Conductivity
Kh Horizontal Hydraulic Conductivity
k Permeability
kPa kilo Pascal
L Litre
L&ILW Low and Intermediate Level Radioactive Waste
m metres
m3 Cubic metres
mASL metres Above Sea Level
mAGS metres Above Ground Surface
mBGS metres Below Ground Surface
mBKB metres Below Kelly Bushing
mLBGS metres Length Below Ground Surface
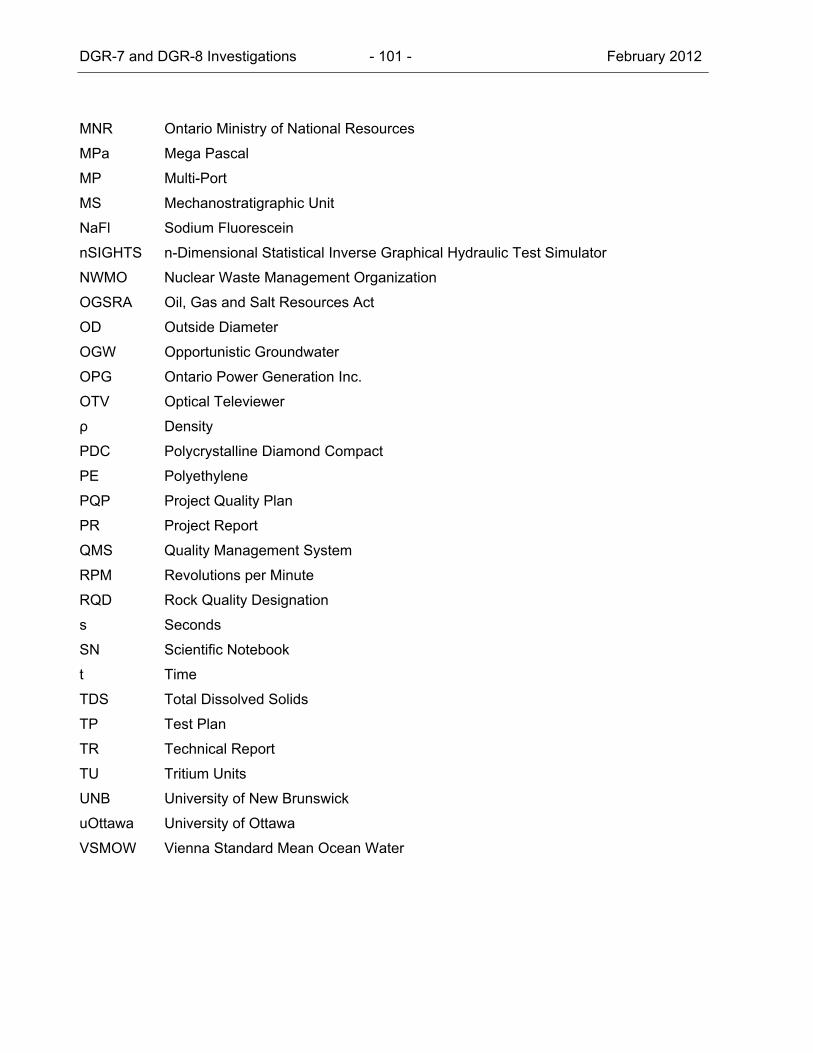
DGR-7 and DGR-8 Investigations - 101 - February 2012
MNR Ontario Ministry of National Resources
MPa Mega Pascal
MP Multi-Port
MS Mechanostratigraphic Unit
NaFl Sodium Fluorescein
nSIGHTS n-Dimensional Statistical Inverse Graphical Hydraulic Test Simulator
NWMO Nuclear Waste Management Organization
OGSRA Oil, Gas and Salt Resources Act
OD Outside Diameter
OGW Opportunistic Groundwater
OPG Ontario Power Generation Inc.
OTV Optical Televiewer
ρ Density
PDC Polycrystalline Diamond Compact
PE Polyethylene
PQP Project Quality Plan
PR Project Report
QMS Quality Management System
RPM Revolutions per Minute
RQD Rock Quality Designation
s Seconds
SN Scientific Notebook
t Time
TDS Total Dissolved Solids
TP Test Plan
TR Technical Report
TU Tritium Units
UNB University of New Brunswick
uOttawa University of Ottawa
VSMOW Vienna Standard Mean Ocean Water

DGR-7 and DGR-8 Investigations - 102 - February 2012
7. REFERENCES
AECOM and ITASCA CANADA. 2011. Regional Geology – Southern Ontario. AECOM Canada Ltd. and Itasca Consulting Canada, Inc. report for the Nuclear Waste Management Organization NWMO DGR-TR-2011-15 R000. Toronto, Canada.
Armstrong, D.K. and T.R. Carter. 2010. The Subsurface Paleozoic Stratigraphy of Southern Ontario, Ontario Geological Survey, Special Volume 7.
Armstrong, D.K. and T.R. Carter. 2006. An Updated Guide to the Subsurface Paleozoic Stratigraphy of Southern Ontario, Ontario Geological Survey, Open File Report 6191.
Briscoe, G. and S. Sterling. 2012. Technical Report: Drilling, Logging and Sampling of DGR-7 and DGR-8, TR-11-02, Revision 0, February 3, Geofirma Engineering Ltd., Ottawa.
Cruden, A. 2011. Outcrop Fracture Mapping. Nuclear Waste Management Organization Report NWMO DGR-TR-2011-43 R000. Toronto, Canada.
Fritz, P., R.J. Drimmie, S.K. Frape and O. O'Shea. 1987. The isotopic composition of precipitation and groundwater in Canada, In: Isotope Techniques in Water Resources Development, IAEA Symposium 299, March, Vienna, 539-550.
Geofirma Engineering Ltd., 2011a. Project Quality Plan, DGR Site Characterization, Revision 6, May 18, Ottawa.
Geofirma Engineering Ltd., 2011b. Environment Health and Safety Plan: Geoscientific Investigation – Shaft Pilot Holes, Bruce DGR Project, Revision 0, April 6, Ottawa.
Golder Associates Ltd. 2003. LLW Geotechnical Feasibility Study, Western Waste Management Facility, Bruce Site, Tiverton, Ontario. Report to Municipality of Kincardine and Ontario Power Generation, January.
Heagle, D. and M. Brooks. 2011. Technical Report: Drilling fluid Management and Testing in DGR-7 and DGR-8, TR-11-03, Revision 0, November 24, Geofirma Engineering Ltd., Ottawa.
Intera Engineering Ltd., 2011. Descriptive Geosphere Site Model, OPG’s Deep Geologic Repository for Low and Intermediate Level Waste, NWMO DGR-TR-2011-24, March, Ottawa.
Intera Engineering Ltd. 2008. Phase 2 Geoscientific Site Characterization Plan, OPG’s Deep Geologic Repository for Low and Intermediate Level Waste, Report INTERA 06-219.50-Phase 2 GSCP-R0, OPG 00216-REP-03902-00006-R00, April, Ottawa.
Intera Engineering Ltd. 2006. Geoscientific Site Characterization Plan, OPG’s Deep Geologic Repository for Low and Intermediate Level Waste, Report INTERA 05-220-1, OPG 00216-REP-03902-00002-R00, April, Ottawa.
DGR-7 and DGR-8 Investigations - 103 - February 2012
International Society for Rock Mechanics. 1977. Suggested Methods for the Quantitative Description of Discontinuities in Rock Masses, Commission on Standardization of Laboratory and Field Tests, Int. J. Rock Mech. Min. Sci. & Geomech. Abstract 15, 319-368.
Jorgensen, D.G., T. Gogel and D.C. Signor. 1982. Determination of flow in aquifers containing variable-density water, Groundwater Monitoring Review 2 (2), 40-45.
Lukajic, B.J. 1988. Preliminary Results of the 1986-87 Geological Investigations, BNPD Proposed Underground Irradiated Fuel Storage Facility, Ontario Hydro Report GHED-DR-8801, July, Toronto.
Lusczynski, N. J. 1961. Head and flow of groundwater of variable density, Journal of Geophysical Research 66, 4247-4256.
Nuclear Waste Management Organization (NWMO). 2011. Geosynthesis. Nuclear Waste Management Organization Report NWMO DGR-TR-2011-11 R000. Toronto, Canada.
NWMO. 2009. L&ILW Deep Geologic Repository Project Quality Plan, Revision 2, 27 May 2009. Nuclear Waste Management Organization Document 00216N-PLAN-00120-0002-R002. Toronto, Canada.
Nuclear Waste Management Program 2006. nSIGHTS 2.40 User Manual Version 2.1, ERMS #530161, April 12, Sandia National Laboratories, Carlsbad, New Mexico.
Ontario Geological Survey. 1991. Bedrock Geology of Ontario, Southern Sheet, Ontario Geological Survey, Map 2544, scale 1:1,000,000.
Sharpe, D.R. and W.A.D. Edwards. 1979. Quaternary Geology of the Chesley-Tiverton Area, Southern Ontario; Ontario Geological Survey Preliminary Map P.2314, Geological Series. Scale 1:50,000.
Smith, R., R. Roberts and J. Avis. 2011. Technical Report: Straddle-Packer Hydraulic Testing in DGR-7, TR-11-05, Revision 0, November 10, Geofirma Engineering Ltd., Ottawa.
Sterling, S. and P. Pehme. 2012. Technical Report: Borehole Geophysical Logging of DGR-7 and DGR-8, TR-11-04, Revision 0, February 3, Geofirma Engineering Ltd., Ottawa.
Sterling, S. 2011. Technical Report: Bedrock Formations in DGR-7 and DGR-8, TR-11-06, Revision 0, December 6, Geofirma Engineering Ltd., Ottawa.
Terzaghi, R. D. 1965. Sources of error in joint surveys, Geotechnique 15, 287-304.
Wilson, D., J. van Heerden and R. Heystee. 2011. OPG’s Deep Geologic Repository for Low and Intermediate Level Waste Project Description – Design & Construction, In: Proceedings of Waste Management, Decommissioning and Environmental Restoration for Canada’s Nuclear Activities Conference, Toronto, September 11-14.
APPENDIX A
Composite Borehole Geophysical Logs
Figurer A.1 - DGR-7
Figure A.2 - Upper DGR-8
Figure A.3 - Lower DGR-8
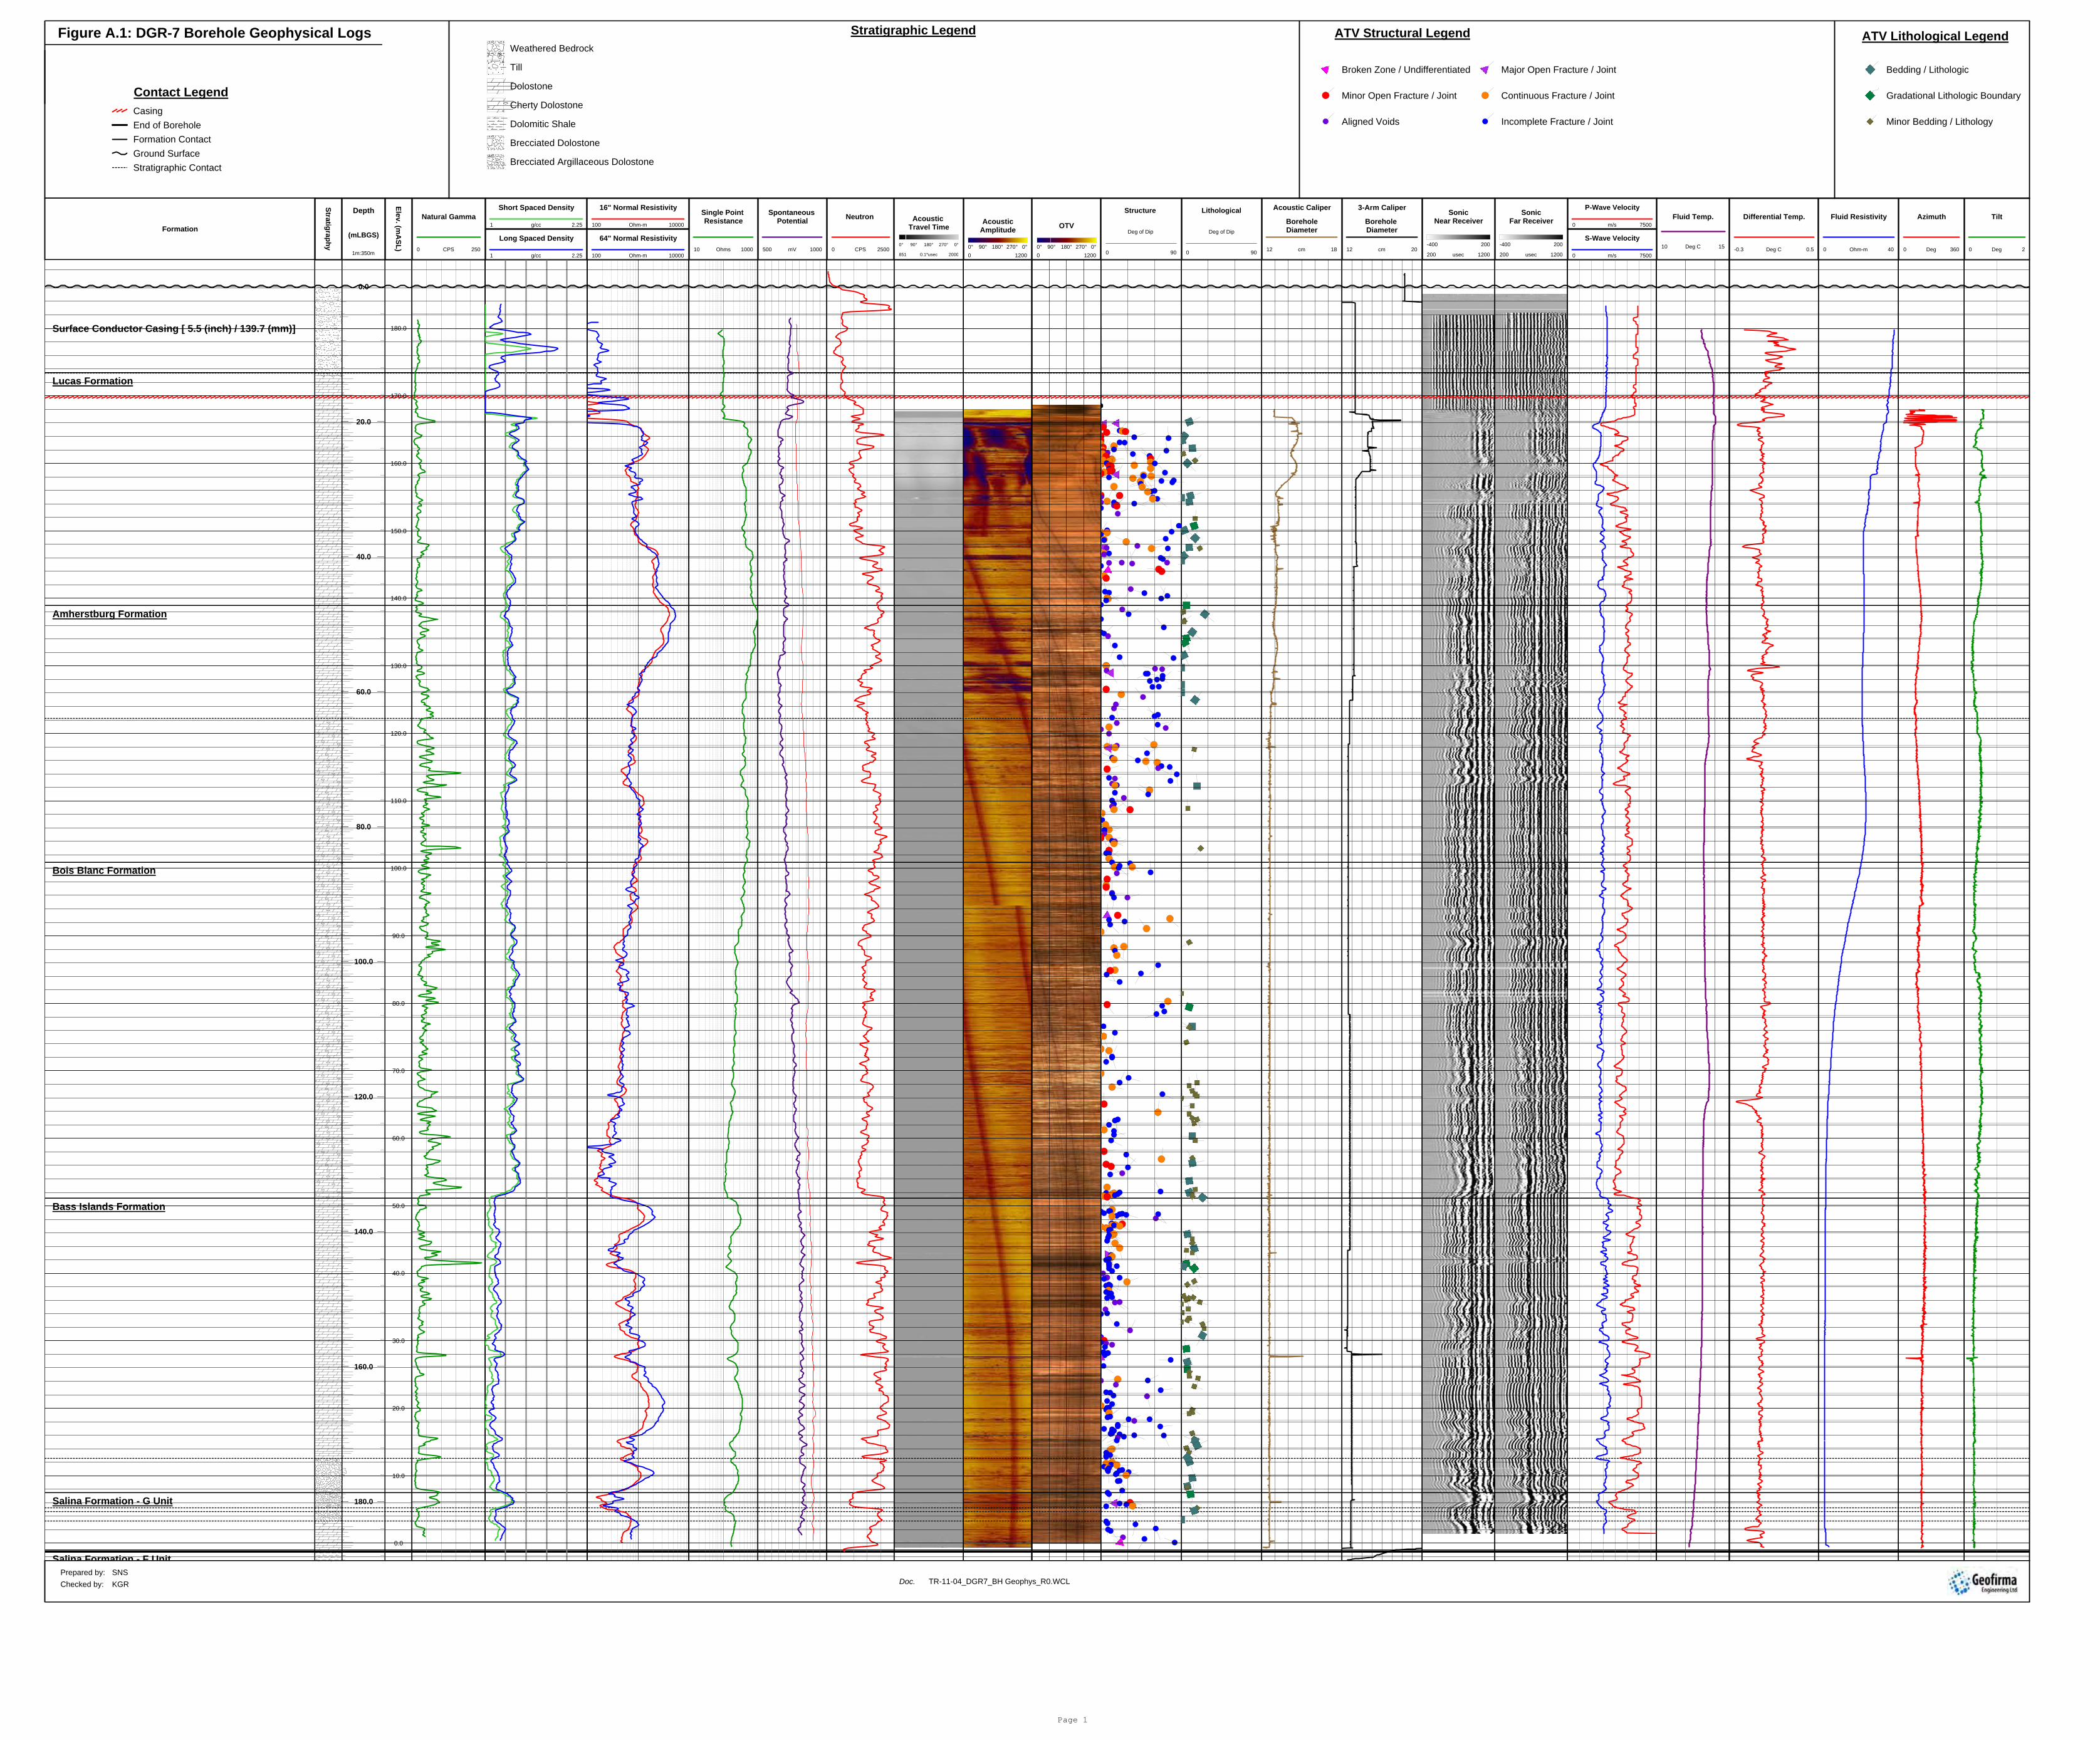
CasingEnd of BoreholeFormation ContactGround SurfaceStratigraphic Contact
Contact Legend
Weathered Bedrock
Till
Dolostone
Cherty Dolostone
Dolomitic Shale
Brecciated Dolostone
Brecciated Argillaceous Dolostone
Stratigraphic Legend ATV Lithological Legend
Bedding / Lithologic
Gradational Lithologic Boundary
Minor Bedding / Lithology
Figure A.1: DGR-7 Borehole Geophysical Logs ATV Structural Legend
Broken Zone / Undifferentiated Major Open Fracture / Joint
Minor Open Fracture / Joint Continuous Fracture / Joint
Aligned Voids Incomplete Fracture / Joint
Depth
(mLBGS)
1m:350m
Natural Gamma
0 250CPS
Spontaneous Potential
500 1000mV
Single Point Resistance
10 1000Ohms
Fluid Resistivity
0 40Ohm-m
Fluid Temp.
10 15Deg C
16" Normal Resistivity
100 10000Ohm-m
64" Normal Resistivity
100 10000Ohm-m
3-Arm Caliper
Borehole Diameter
12 20cm
Neutron
0 2500CPS
Short Spaced Density
1 2.25g/cc
Long Spaced Density
1 2.25g/cc
SonicNear Receiver
-400 200
200 1200usec
P-Wave Velocity
0 7500m/s
S-Wave Velocity
0 7500m/s
Acoustic Caliper
BoreholeDiameter
12 18cm
OTV
0° 0°180°90° 270°0 1200
AcousticAmplitude
0° 0°180°90° 270°0 1200
Acoustic Travel Time
0° 0°180°90° 270°
851 20000.1*usec
Tilt
0 2Deg
Azimuth
0 360Deg
Lithological
Deg of Dip
0 90
Structure
Deg of Dip
0 90
SonicFar Receiver
-400 200
200 1200usec
FormationDifferential Temp.
-0.3 0.5Deg C
Stratigraphy
Elev. (mA
SL)
0.0
20.0
40.0
60.0
80.0
100.0
120.0
140.0
160.0
180.0
Lucas Formation
Amherstburg Formation
Bois Blanc Formation
Bass Islands Formation
Salina Formation - G Unit
Salina Formation - F Unit
Surface Conductor Casing [ 5.5 (inch) / 139.7 (mm)] 180.0
170.0
160.0
150.0
140.0
130.0
120.0
110.0
100.0
90.0
80.0
70.0
60.0
50.0
40.0
30.0
20.0
10.0
0.0
Checked by: KGR Doc. TR-11-04_DGR7_BH Geophys_R0.WCLPrepared by: SNS
Page 1
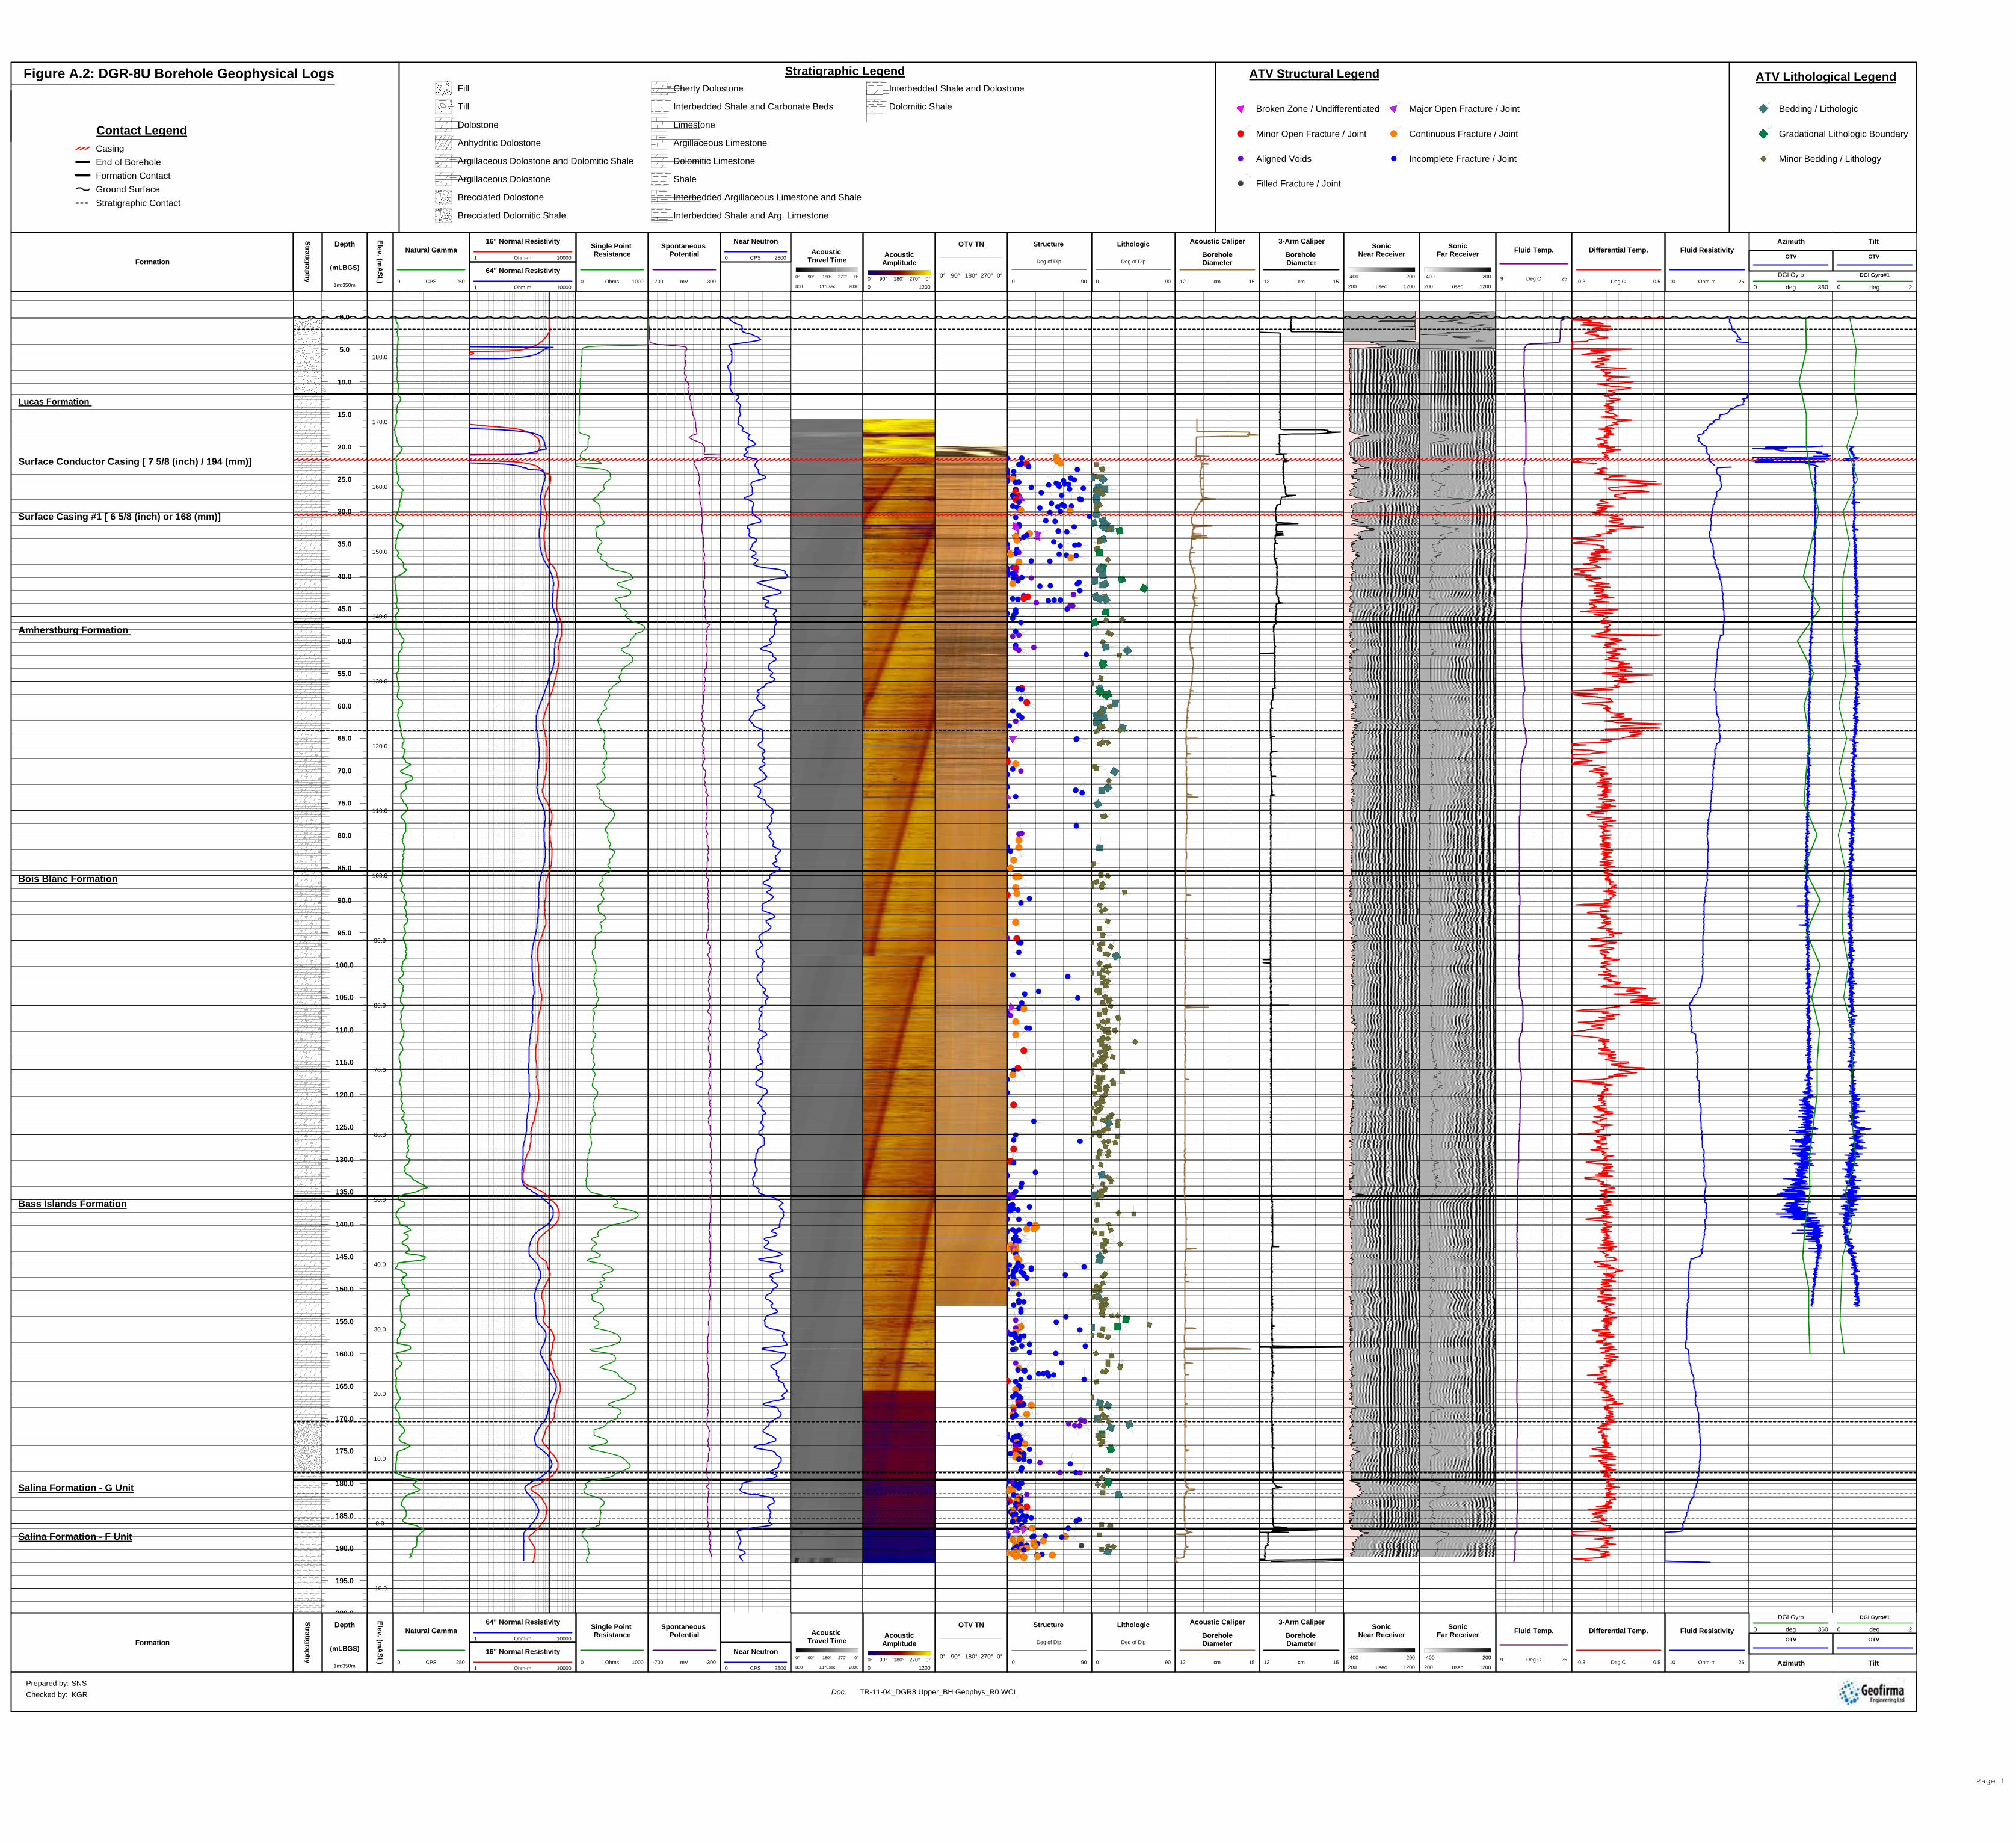
CasingEnd of BoreholeFormation ContactGround SurfaceStratigraphic Contact
Contact Legend
Fill
Till
Dolostone
Anhydritic Dolostone
Argillaceous Dolostone and Dolomitic Shale
Argillaceous Dolostone
Brecciated Dolostone
Brecciated Dolomitic Shale
Cherty Dolostone
Interbedded Shale and Carbonate Beds
Limestone
Argillaceous Limestone
Dolomitic Limestone
Shale
Interbedded Argillaceous Limestone and Shale
Interbedded Shale and Arg. Limestone
Interbedded Shale and Dolostone
Dolomitic Shale
Stratigraphic Legend ATV Lithological Legend
Bedding / Lithologic
Gradational Lithologic Boundary
Minor Bedding / Lithology
Figure A.2: DGR-8U Borehole Geophysical Logs ATV Structural Legend
Broken Zone / Undifferentiated Major Open Fracture / Joint
Minor Open Fracture / Joint Continuous Fracture / Joint
Aligned Voids Incomplete Fracture / Joint
Filled Fracture / Joint
OTV
DGI Gyro#1
0 2deg
Tilt
OTV
DGI Gyro
0 360deg
AzimuthDepth
(mLBGS)
1m:350m
OTV TN
0° 0°180°90° 270°
AcousticAmplitude
0° 0°180°90° 270°0 1200
Acoustic Caliper
BoreholeDiameter
12 15cm
Natural Gamma
0 250CPS
Near Neutron
0 2500CPS
Structure
Deg of Dip
0 90
Lithologic
Deg of Dip
0 90
3-Arm Caliper
Borehole Diameter
12 15cm
Fluid Resistivity
10 25Ohm-m
Fluid Temp.
9 25Deg C
16" Normal Resistivity
1 10000Ohm-m
64" Normal Resistivity
1 10000Ohm-m
SonicNear Receiver
-400 200
200 1200usec
SonicFar Receiver
-400 200
200 1200usec
FormationAcoustic
Travel Time
0° 0°180°90° 270°
850 20000.1*usec
Differential Temp.
-0.3 0.5Deg C
Spontaneous Potential
-700 -300mV
Single Point Resistance
0 1000Ohms
Stratigraphy
Elev. (mA
SL)
0.0
5.0
10.0
15.0
20.0
25.0
30.0
35.0
40.0
45.0
50.0
55.0
60.0
65.0
70.0
75.0
80.0
85.0
90.0
95.0
100.0
105.0
110.0
115.0
120.0
125.0
130.0
135.0
140.0
145.0
150.0
155.0
160.0
165.0
170.0
175.0
180.0
185.0
190.0
195.0
200 0
Lucas Formation
Amherstburg Formation
Bois Blanc Formation
Bass Islands Formation
Salina Formation - G Unit
Salina Formation - F Unit
180.0
170.0
160.0
150.0
140.0
130.0
120.0
110.0
100.0
90.0
80.0
70.0
60.0
50.0
40.0
30.0
20.0
10.0
0.0
-10.0
Surface Conductor Casing [ 7 5/8 (inch) / 194 (mm)]
Surface Casing #1 [ 6 5/8 (inch) or 168 (mm)]
OTV
DGI Gyro#1
0 2deg
Tilt
OTV
DGI Gyro
0 360deg
Azimuth
Depth
(mLBGS)
1m:350m
OTV TN
0° 0°180°90° 270°
AcousticAmplitude
0° 0°180°90° 270°0 1200
Acoustic Caliper
BoreholeDiameter
12 15cm
Natural Gamma
0 250CPS
Near Neutron
0 2500CPS
Structure
Deg of Dip
0 90
Lithologic
Deg of Dip
0 90
3-Arm Caliper
Borehole Diameter
12 15cm
Fluid Resistivity
10 25Ohm-m
Fluid Temp.
9 25Deg C16" Normal Resistivity
1 10000Ohm-m
64" Normal Resistivity
1 10000Ohm-m
SonicNear Receiver
-400 200
200 1200usec
SonicFar Receiver
-400 200
200 1200usec
FormationAcoustic
Travel Time
0° 0°180°90° 270°
850 20000.1*usec
Differential Temp.
-0.3 0.5Deg C
Spontaneous Potential
-700 -300mV
Single Point Resistance
0 1000Ohms
Stratigraphy
Elev. (mA
SL)
Checked by: KGR Doc. TR-11-04_DGR8 Upper_BH Geophys_R0.WCLPrepared by: SNS
Page 1

CasingEnd of BoreholeFormation ContactGround SurfaceStratigraphic Contact
Contact Legend
Fill
Till
Dolostone
Anhydritic Dolostone
Argillaceous Dolostone and Dolomitic Shale
Argillaceous Dolostone
Brecciated Dolostone
Brecciated Dolomitic Shale
Cherty Dolostone
Interbedded Shale and Carbonate Beds
Limestone
Argillaceous Limestone
Dolomitic Limestone
Shale
Interbedded Argillaceous Limestone and Shale
Interbedded Shale and Arg. Limestone
Interbedded Shale and Dolostone
Dolomitic Shale
Stratigraphic Legend ATV Lithological Legend
Bedding / Lithologic
Gradational Lithologic Boundary
Minor Bedding / Lithology
Figure A.3: DGR-8L Borehole Geophysical Logs ATV Structural Legend
Broken Zone / Undifferentiated Major Open Fracture / Joint
Minor Open Fracture / Joint Continuous Fracture / Joint
Aligned Voids Incomplete Fracture / Joint
Styolite Filled Fracture / Joint
Tilt
10 30Deg
Azimuth
0 360Deg
IDS (Gyro)
Tilt (ATV)
0 5Deg
Azimuth TN
0 360Deg
Lotowater (ATV)Depth
(mLBGS)
1m:350m
ATV - Lithological
Deg of Dip 0 90
ATV - Structure
Deg of Dip 0 90
FormationTemp. Variability
-0.1 0.1Deg C
Differential Temp.
-0.3 0.5Deg C
Neutron
0 2500CPS
Relative Density
40000 75000cps
Spontaneous Potential
400 1000mV
Single Point Resistance
3000 10000Ohms
16" Relative Resistivity
1 10000Ohm-m
64" Relative Resistivity
1 10000Ohm-m
Fluid Resistivity
-5 -3Ohm-m
SonicNear Receiver
-150 150
0 1000us
SonicFar Receiver
-150 150
0 1000us
Temperature
9 25Deg C
Natural Gamma
0 200CPS
AcousticAmplitude
0° 0°180°90° 270°0 1200
Acoustic Travel Time
0° 0°180°90° 270°
851 20000.1*usec
Acoustic Caliper
BoreholeDiameter
12 18cm
3-Arm Caliper
BoreholeDiameter
12 22cm
Stratigraphy
Elev. (mA
SL)
Interpretation LimitedInterpretation Impeded
175.0
180.0
185.0
190.0
195.0
200.0
205.0
210.0
215.0
220.0
225.0
230.0
235.0
240.0
245.0
250.0
255.0
260.0
265.0
270.0
275.0
280.0
285.0
290.0
295.0
300.0
305.0
310.0
315.0
320.0
325.0
330.0
335.0
340.0
345.0
350.0
355.0
360.0
365.0
370.0
375.0
380.0
385.0
390.0
395.0
400.0
405.0
410.0
415.0
420.0
425.0
430.0
435.0
440.0
445.0
450.0
455.0
460.0
465.0
470.0
475.0
480.0
485.0
490.0
495.0
500.0
505.0
510.0
515.0
520.0
525.0
530.0
535.0
540.0
545.0
550.0
555.0
560.0
565.0
570.0
575.0
580.0
585.0
590.0
595.0
600.0
605.0
610.0
615.0
620.0
625.0
630.0
635.0
640.0
645.0
650.0
655.0
660.0
665.0
670.0
675.0
680.0
685.0
690.0
695.0
700.0
705.0
710.0
715.0
720.0
725.0
730.0
Intermediate BOP Casing [ 5 1/2 (inch) / 140 (mm)]
Open Borehole [ 4 5/6 (inch) / 123 (mm)]
Salina Formation - G Unit
Salina Formation - F Unit
Salina Formation - E Unit
Salina Formation - D Unit
Salina Formation - C Unit
Salina Formation - B Unit
B - Anhydrite
Salina Formation - A2 Unit - A2 carbonate
A2 evaporite
Salina Formation - A1 Unit - A1 carbonate
A1 evaporite
Salina Formation - A0 Unit
Guelph Formation
Goat Island Formation
Gasport Formation
Lions Head Formation
Fossil Hill Formation
Cabot Head Formation
Manitoulin Formation
Queenston Formation
Georgian Bay Formation
Blue Mountain Formation
Coburg Formation - Collingwood Member
Cobourg Formation - Lower Member
Sherman Fall Formation
Kirkfield Formation
END OF HOLE 723.81
10.0
0.0
-10.0
-20.0
-30.0
-40.0
-50.0
-60.0
-70.0
-80.0
-90.0
-100.0
-110.0
-120.0
-130.0
-140.0
-150.0
-160.0
-170.0
-180.0
-190.0
-200.0
-210.0
-220.0
-230.0
-240.0
-250.0
-260.0
-270.0
-280.0
-290.0
-300.0
-310.0
-320.0
-330.0
-340.0
-350.0
-360.0
-370.0
-380.0
-390.0
-400.0
-410.0
-420.0
-430.0
-440.0
-450.0
-460.0
-470.0
-480.0
-490.0
-500.0
-510.0
-520.0
-530.0
-540.0
Tilt
10 30Deg
Azimuth
0 360Deg
IDS (Gyro)
Tilt (ATV)
0 5Deg
Azimuth TN
0 360Deg
Lotowater (ATV)
Depth
(mLBGS)
1m:350m
ATV - Lithological
Deg of Dip 0 90
ATV - Structure
Deg of Dip 0 90
FormationTemp. Variability
-0.1 0.1Deg C
Differential Temp.
-0.3 0.5Deg C
Neutron
0 2500CPS
Relative Density
40000 75000cps
Spontaneous Potential
400 1000mV
Single Point Resistance
3000 10000Ohms
16" Relative Resistivity
1 10000Ohm-m
64" Relative Resistivity
1 10000Ohm-mFluid Resistivity
-5 -3Ohm-m
SonicNear Receiver
-150 150
0 1000us
SonicFar Receiver
-150 150
0 1000us
Temperature
9 25Deg C
Natural Gamma
0 200CPS
AcousticAmplitude
0° 0°180°90° 270°0 1200
Acoustic Travel Time
0° 0°180°90° 270°
851 20000.1*usec
Acoustic Caliper
BoreholeDiameter
12 18cm
3-Arm Caliper
BoreholeDiameter
12 22cm
Stratigraphy
Elev. (mA
SL)
Interpretation LimitedInterpretation Impeded
Checked by: KGR Doc. TR-11-04_DGR8 Lower_BH Geophys_R0.WCLPrepared by: SNS