Embed Size (px)
DESCRIPTION
JISRS
Citation preview

RESEARCH ARTICLE
Geospatial Analysis for Coastal Risk Assessment to Cyclones
V. Poompavai & M. Ramalingam
Received: 14 October 2011 /Accepted: 26 December 2011 /Published online: 20 March 2012# Indian Society of Remote Sensing 2012
Abstract Cyclone is one of the major coastal hazardsaffecting the Indian coastline bringing floods and wide-spread damage due to rain, storm surges and heavywinds. Hence, coastal risk assessment is essential toidentify the threats to the land and population, fromcyclones. The risk assessment has been carried out innorthern coast of Tamil Nadu, India, for the stretch fromKattivakkam to Kovalam. Risk is the probability ofexpected losses from a given hazard and it variesaccording to the vulnerability of the region. The riskassessment has been structured in four components,namely, Environmental Vulnerability, Social Vulnera-bility, Hazard Potential and Mitigation Capacity. Thethematic layers and hazard maps are created using Sat-ellite data and Geographic Information System. Coastalrisk indices are generated for each component of riskusing Analytic Hierarchy Process. Based on the indexvalue, the level of risk is mapped and the results help infaster and appropriate decision making.
Keywords Hazard . Risk . Geographic informationsystem . Remote sensing . Cyclones
Introduction
Floods, droughts, cyclones, earthquakes and land-slides have been creating havoc and calamity in theIndian sub-continent, with the tsunami in the IndianOcean adding a new and unforeseen dimension to thenatural calamities scenario. Cyclone is one of themajor coastal hazards affecting the Indian coastlinebringing floods and widespread damage due to rain,storm surges and heavy winds. Hence, coastal riskassessment is essential to identify the threats to theland and population, from cyclones. Risk is defined asthe probability of expected losses from a given hazard,given by: Risk 0 Hazard * Vulnerability. Hazard Po-tential involves the frequency and severity with whicha hazard strikes the region and vary in their speed ofonset, magnitude and duration. Vulnerability could beviewed as the effect of climate change or the cause forfurther mitigation (O’Brien et al. 2004), thus exploringmethods for visualizing the present state of the envi-ronment as the net effect of the adverse impacts ofhazards and the options to reduce it through variousadaptive and mitigation options. Vulnerability is amultidimensional concept involving complex meas-urements, encompassing diverse biophysical, socialand economic components. Hence, vulnerability isthe extent to which an entity is likely to be damagedby the impact of a hazard due to the nature andsensitivity of the system (Clark 1998). Vulnerabilityis also a function of the resilience of the system tocope, adapt and recover (Cutter 1993; Kelly andAdger 2000) from the hazard impact.
J Indian Soc Remote Sens (March 2013) 41(1):157–176DOI 10.1007/s12524-011-0198-8
V. Poompavai (*)Department of Earth and Space Sciences,Indian Institute of Space Science and Technology,Thiruvananthapuram 695 547, Indiae-mail: [email protected]
M. RamalingamInstitute of Remote Sensing, Anna University Chennai,Chennai 600 025, Indiae-mail: [email protected]

Owing to the environmental conditions and associ-ated processes, proximity to the hazard, and mitigationcapabilities, the entire geographic region exposed tothe hazard need not be affected. Similarly, a regionmay be vulnerable but never come under the impact ofa hazard (Gallopin 2006). In short, ‘disasters occurwhen hazard meets vulnerability’ (Blaikie et al.1994). The present study aims at deriving risk forcyclones and associated storms surges causing inun-dation and immediate erosion. The Vulnerability Atlasof India of 1997, revised in 2006, provides district-wide vulnerability and risk levels of building stock towind storm at a scale of 1:2.5 million (BMTPC 1997).The present study aims at generating regional vulner-ability maps at a scale of 1: 50,000 taking into accountmost of the causative factors for vulnerability to cyclo-nes and the resulting storm surges.
Study Area
The risk assessment has been carried out in northTamil Nadu, India, for the coastal stretch from Katti-vakkam (80° 20′ 22″ E, 13° 15′ 24″ N) to Kovalam(80° 15′ 19″ E, 12° 46′ 59″ N) which runs to 50 kmextent with an area of 91.88 sq.km covering threedistricts of Tiruvallur, Chennai and Kancheepuram(Fig. 1). The hazard limits should be identified to definethe estimated extent of land projected to be impactedupon by the hazard. The immediate hazard area repre-sents the landward extent of coast that could be at directthreat from cyclones and storm surges. In the presentstudy, the administrative boundary of the coastal unithas been considered for want of data related to socialfactors like population from census data and for planningpurposes. But, it is proposed that risk assessments such asthese should follow hazard lines based on previous stud-ies and model forecasts combined with local knowledge(UNEP Report 2008). From the perspective of data orga-nization and decision making purposes, the study areahas been delineated according to the administrativeboundaries of the coastal region. Kattivakkam, Eravanurand Tiruvottiyur, Tandaiyarpet, East Vallalar Nagar,South Vallalar Nagar, Chindaripet, Chepauk, Zambazar,Krishnampet, Karaneeswarpuram, Mylapore, Avvaina-gar, Urur; and Thiruvanmiyur, Kottivakkam, Palavak-kam, Neelankarai, Injambakkam, Sholinganallur,Uthandi, Kannathur Reddy Kuppam, Muthukadu, Kun-nakadu and Kovalam are the 25 administrative divisions
including town panchayats, wards and villages of thestudy area.
Materials and Methods
The fundamental starting point for any risk assessmentstudy is the acquisition of basic data that characterizethe hazards and the study area. Typical data layers ofthe environment include landuse/landcover, soil, geo-morphology, geology, drainage, watershed, demogra-phy and infrastructure. The present study adapts theHazards-of-Place model (Cutter et al. 2003) and theassessment has been structured in four components:Environmental Vulnerability, Social Vulnerability,Hazard Potential and Mitigation Capacity. Environ-mental vulnerability (Renaud 2006) is a function ofthe physical exposure of the land to the hazard, where-as, social vulnerability (Cutter et al. 2003) is related tothe population density and the coping capacity of theregion. The hazard potential is associated with thefrequency of strike and magnitude of the hazard.Coastal protection structures and warning systemsform the main constituents of mitigation capacity(Smit and Wandel 2006).
The base or reference map has been preparedfrom Survey of India topographical sheets of1970–71 in the scale of 1:50000. Georeferencedsatellite imagery of IRS-P6 (LISS IV) data(Fig. 2) of November 2004, having spatial resolu-tion of 5.8 m, and, Cartosat-1 (PAN) data of March2007, with a spatial resolution of 2.5 m, have beenused for creating a spatial database of thematiclayers with Transverse Mercator projection andWGS 84 datum using visual image interpretationin ERDAS Imagine software. The GIS database ofthe environment and the hazard has been generatedusing ArcGIS software.
Environmental Scenario
Younger and older coastal alluvial plains (Cushing1913) form the major geomorphological feature ofthe region, called the flat Eastern coastal plains. Nar-row to wider beaches sloping towards the sea side,along with beach sand ridges are part of the youngercoastal plains (Fig. 3). Wave action has given rise toberms in certain pockets. The other prominent coastal
158 J Indian Soc Remote Sens (March 2013) 41(1):157–176
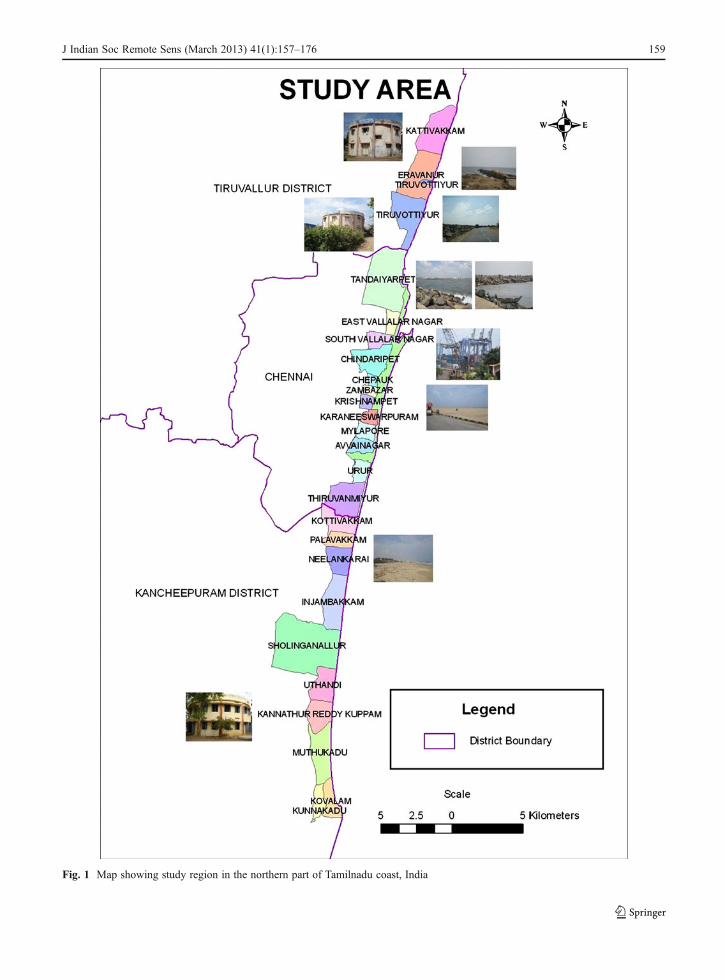
Fig. 1 Map showing study region in the northern part of Tamilnadu coast, India
J Indian Soc Remote Sens (March 2013) 41(1):157–176 159

features are lagoons, estuaries, creeks, spits and dunes.The sandy beach, including one of the longest beachesin the world called the Marina beach, runs almost theentire stretch of the study region with intermittentcoastal inlets and creeks namely Ennore creek andMuthukadu creek. Two major rivers meander throughthe study region, the Cooum in the central region andthe Adyar in the southern region which are linked bythe Buckingham Canal. Another east–west streamcalled Otteri Nullah, runs through north Chennai.Apart from this, a number of perennial as well as drytanks exist in the area. The land use/cover map (Fig. 3)has been prepared as per the NRIS classificationscheme (NRIS 1997). The study area comprises pre-dominantly of coastal settlements, farmlands, and ma-jor industries. Beach resorts, aquaculture ponds andtheme parks are also located in the Southern region.The classification for watershed delineation has beendone as per AISLUS (All India Soil and LanduseSurvey) scheme.
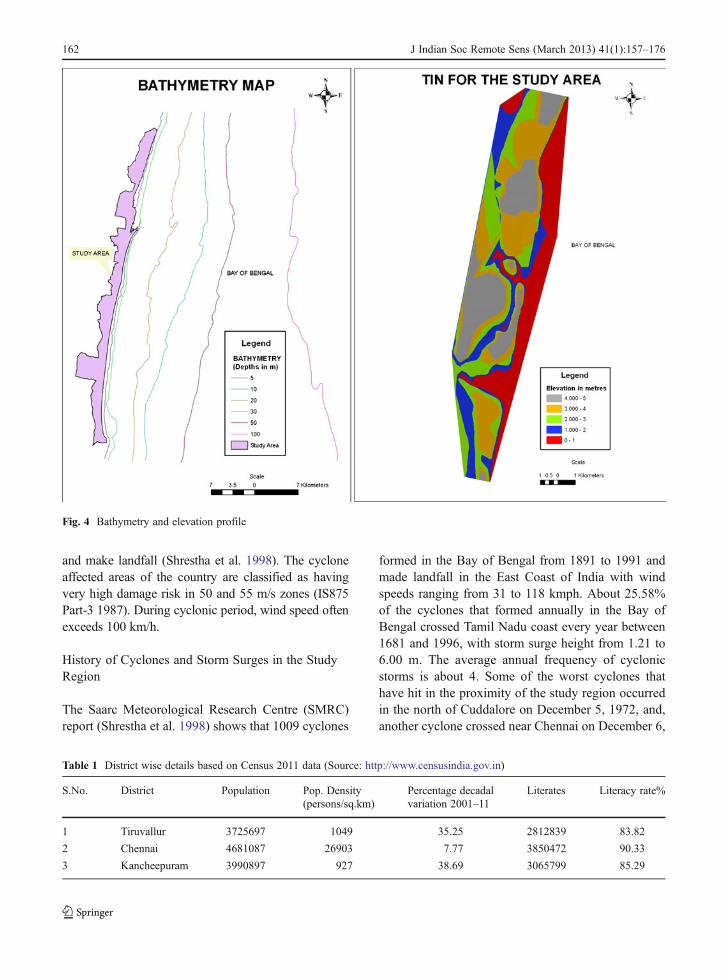
To assess the potential impacts of storm surges andto examine the depth and slope of the ocean floor nearthe shore, the bathymetry map has been digitized fromthe hydrographic chart of Mamallapuram to Point Pudipublished by the Naval Hydrographic Office, Dehra-dun using ArcGIS software (Fig. 4). The bathymetricprofile shows a steep and narrow shelf for the studyregion in general and relatively wider and gentle shelfoff Chennai coast. The coastline is oriented in North–South direction. The width of the continental shelf is43 km and shelf break occurs at 200 m depth offChennai (Rao et al. 1992). The shelf is non-basinalsouth of Chennai. Cyclones and the resulting stormsurges are likely to affect the shallow bays associatedwith basinal areas more, due to wider shelf and gentleslope characteristics (Shetye et al. 1990).
The elevation dataset has been prepared from fairlyaccurate 1-m contour map prepared by the PublicWorks Department of Government of Tamilnadu. Tri-angulated Irregular Network (TIN) model of the re-gion has been created from the contours using ArcGIS3D Analyst extension and visualized in Arc Sceneapplication (Fig. 4). In addition, the ETOPO5 globaldata from UNEP has been utilized to generate a rasterelevation dataset by interpolating the elevation pointsusing Global Mapper software. The ‘ETOPO5’ dataset represents the digital terrain values as integratedfrom existing 5 and 10-minute digital sources. Thedata set has elevation values spaced at every 5-minute latitude/longitude crossing on the global grid.Bathymetric values are included in this data set, start-ing at approximately 10,000 m below sea level, whilethe elevation values, extend up to heights of approxi-mately 8,000 m above sea level. The elevationincreases gradually from sea-shore to inland but theaverage elevation is not more than 6 m above meansea-level, while most of the regions lie at sea-level.The study region has an almost flat terrain with 0–3%slope. Kancheepuram district has a natural slope fromWest to East.
The predominant wind directions in the study areaare NE, ENE, SSW, SW, ESE and SE. During theNortheast monsoon, the wind speed ranges from 5.8to 7.5 m/s with direction of 49–87° with respect tonorth. During the SW monsoon, the winds from thesouthwest have speed between 2 and 12 m/s and direc-tion of 153–263°. The general wave direction in theregion is 100–160° with respect to north during SWmonsoon and 60–90° during NEmonsoon.Waves reach
Fig. 2 Satellite imagery from IRS-P6—LISS 4 showing a por-tion of the study area
160 J Indian Soc Remote Sens (March 2013) 41(1):157–176

a height of 5 to 8m during cyclones. The wave height onthe Chennai Coast during SW monsoon, ranges from0.4 to 1.6 m and from 0.4 to 2.0 m during the NEmonsoon period. The tides are semi-diurnal with meanspring tide ranges of 1.10 m and mean neap tide rangesof 0.8 m as observed by the Port Trust of India, Chennai.
Social Scenario
According to Census of India 2011, the overallpopulation of Tamil Nadu is 7,21,38,958 personswith a density of 555 per km2 (Tables 1 and 2).The study region is well connected by air, roadand rail network and has excellent telecommunica-tion facilities (Fig. 5). Some of the major indus-tries in the study area are steel, automobile,
hardware manufacturing, and healthcare. TheChennai city is served by two major ports, theChennai Port which is one of the largest artificialports and the Ennore Port. Royapuram, a fishinghamlet, hosts a small harbour used by local fishingboats and trawlers. The region has good educationinfrastructure with numerous schools and colleges,along with excellent healthcare facilities.
Hazard Scenario
The study region is situated on the coast of the Bay ofBengal, where there is a high frequency of tropicalstorms when compared to Arabian Sea. From historicaldata, cyclones over the Bay of Bengal are known tousually move westward, northwestward, or northward
Fig. 3 Landuse/landcover and geomorphology of the study region
J Indian Soc Remote Sens (March 2013) 41(1):157–176 161
and make landfall (Shrestha et al. 1998). The cycloneaffected areas of the country are classified as havingvery high damage risk in 50 and 55 m/s zones (IS875Part-3 1987). During cyclonic period, wind speed oftenexceeds 100 km/h.
History of Cyclones and Storm Surges in the StudyRegion
The Saarc Meteorological Research Centre (SMRC)report (Shrestha et al. 1998) shows that 1009 cyclones
formed in the Bay of Bengal from 1891 to 1991 andmade landfall in the East Coast of India with windspeeds ranging from 31 to 118 kmph. About 25.58%of the cyclones that formed annually in the Bay ofBengal crossed Tamil Nadu coast every year between1681 and 1996, with storm surge height from 1.21 to6.00 m. The average annual frequency of cyclonicstorms is about 4. Some of the worst cyclones thathave hit in the proximity of the study region occurredin the north of Cuddalore on December 5, 1972, and,another cyclone crossed near Chennai on December 6,
Fig. 4 Bathymetry and elevation profile
Table 1 District wise details based on Census 2011 data (Source: http://www.censusindia.gov.in)
S.No. District Population Pop. Density(persons/sq.km)
Percentage decadalvariation 2001–11
Literates Literacy rate%
1 Tiruvallur 3725697 1049 35.25 2812839 83.82
2 Chennai 4681087 26903 7.77 3850472 90.33
3 Kancheepuram 3990897 927 38.69 3065799 85.29
162 J Indian Soc Remote Sens (March 2013) 41(1):157–176

1996. Due to the presence of strong vertical windshear in the atmosphere over the North Indian Oceanduring South West monsoon season, only deep depres-sions form in the Bay of Bengal and these do notintensify into cyclonic storms. The cyclones makinglandfall at the Tamilnadu coast occur during May,October and November, due to the presence of littleor no vertical wind shear. Another study (Mani 2000)shows that storm surges of 3–6 m height with aninland penetration of upto 8 km have occurred duringcyclones between 1952 and 1993 in the Tamilnaducoast. The vulnerability atlas of India (BMTPC1997) specifies the probable maximum surge heightalong coastal Chennai as 5.45 m. India’s Initial Na-tional Communication (NATCOM) (MoEF Report2004) to the United Nations Framework Conventionon Climate Change studies show that Chennai hashigh exposure levels to cyclone considering exposure
in terms of density of population and Chennai ranksfirst based on the Cyclone hazard Index value, whenthe number of cyclones is normalized by district area.
The heavy rainfall associated with the cyclones mustbe taken into account when computing risk to cyclones.The maximum rainfall is found to occur in the westernside near the tracks of the cyclones of Bay of Bengal.The historical records of severe cyclones and depressionsformed in the Bay of Bengal and made landfall in NorthTamilnadu during 1891 to 2007 is displayed in the formof a map using the cyclone e-atlas software provided bythe Indian Meteorological Department (IMD) (Fig. 6).The SMRC report (Shrestha et al. 1998) gives the prob-abilistic Estimates of extreme annual frequency of cy-clonic disturbances in the Bay of Bengal. The minimumand maximum number of cyclonic disturbances, depres-sions (including deep depressions), cyclonic storms andsevere cyclonic storms that can be expected in 1 year out
Table 2 Demographic details for the individual administrative units based on census 2001. (Source: http://www.censusindia.gov.in)
S.No. Village/Town/Ward Area (sq.km) Households Population Literates Literacy rate% Pop. Density(persons/sq.km)
1 Kattivakkam 5.612745 7282 32590 22772 69.87 5806
2 Eravanur (Uninhabited) 6.148365 – – – – –
3 Tiruvottiyur 5.967354 49068 212281 160248 75.48 35573
4 Tandaiyarpet 10.612562 6784 32373 20449 63.16 3050
5 East Vallalar Nagar 1.339720 4532 22797 17507 76.79 17016
6 South Vallalar Nagar 1.723276 5013 24788 16996 68.56 14384
7 Chindaripet 4.081409 4168 22068 18665 84.57 5406
8 Chepauk 0.527247 2732 15285 13024 85.20 28990
9 Zambazar 0.746021 3193 15121 11965 79.12 20268
10 Krishnampet 0.942358 4360 21557 14651 67.96 22875
11 Karaneeswarpuram 1.077983 4507 20483 15308 74.73 19001
12 Mylapore 1.447168 4367 18234 15085 82.73 12599
13 Avvainagar 1.635668 12806 53152 41349 77.79 32495
14 Urur 1.606722 5984 62921 52025 82.68 15282
15 Thiruvanmiyur 5.095952 28673 119634 93693 78.31 23476
16 Kottivakkam 3.169262 3258 13884 9656 69.54 4380
17 Palavakkam 2.110306 3327 14361 10424 72.58 6805
18 Neelankarai 2.961774 3604 15367 10803 70.29 5188
19 Injambakkam 5.254416 2408 10117 7267 71.82 1925
20 Sholinganallur 15.595824 3590 15557 10878 69.92 997
21 Uthandi 3.580903 3370 15423 10994 71.28 4307
22 Kannathur Reddy Kuppam 3.286486 869 4078 2908 71.30 1240
23 Muthukadu 5.014400 572 2698 1577 58.45 538
24 Kovalam 2.342664 793 3955 2601 65.76 1688
25 Kunnakadu 1.687127 84 384 206 53.64 227
J Indian Soc Remote Sens (March 2013) 41(1):157–176 163

of 4, 10 and 25 years are given in graph (Fig. 7). Themaximum wind speed that can be expected in 1 cycloneout of 4, 10 and 25 cyclones are 161 kmph, 197 kmphand 224 kmph, respectively.
The significant cyclone tracks for the study regionfrom the year 1945 onwards have been compiled anddigitized in ArcGIS software using data from Joint Ty-phoon Warning Center, Hawaii. The map depicts thepattern of occurrence of cyclones in the vicinity of thestudy region. To estimate the proximity of the region tocyclone track and its landfall, multiple 10 km buffers ofall the cyclone tracks have been generated upto a distanceof 40 km using buffering tool in Arctoolbox (Fig. 8).
Mitigation Capacity
Numerous protection structures like sea walls, jettiesand groynes have been constructed along the coastalarea of the study region. The stretch of about 15 kmfrom Ennore towards its south upto Royapuram
comprises mostly fishing hamlets. The severe erosion,which is at rate of 8 m per year (Ministry of EarthSciences Report 2006), due to the construction of theChennai harbour with breakwaters, has led to thedevelopment of groynes and sea walls for a distanceof 9 km to the north of the port (Fig. 9). The nationalhighway has been severely damaged in this region.
Numerous temporary and permanent cyclone shel-ters (Fig. 10) have been constructed along the coast incertain pockets like Kattivakkam, Tiruvottiyur andKovalam. The locations of the sea walls and otherprotection structures are surveyed using Global Posi-tioning System (GPS) and marked on the base map.Sediment deposition occurs in the updrift direction ofthe groynes and jetties, and, sea walls protect thebackshore, hence, these areas are categorized underlow risk from storm surges.
The Indian Meteorological Department (IMD) is re-sponsible for providing tropical cyclone warnings inIndia. A severe cyclonic storm in the Indian seas takesabout 4 days or longer to make landfall from the time of
Fig. 5 Demographic and transport facility map
164 J Indian Soc Remote Sens (March 2013) 41(1):157–176

forming giving adequate time for warning and evacua-tion. “Cyclone Alert” is issued 48 h before the expectedcommencement of the hazard along the coast. Warningsto ports and fishermen are supplied earlier. Cyclonewarnings are sent to ports, airports, railways and Stateand District authorities via INSAT satellite through Cy-clone Warning Dissemination System (CWDS).
Decision Making Process
Spatial multi-criteria decision-making is a processwhere geographical data is combined and trans-formed into a decision (Schmoldt et al. 2001).The weights and preferences of criteria are integrat-ed to generate an overall assessment of the alter-natives. Recommendations are based on a rankingof the alternatives, with reference to possible uncer-tainties or sensitivities. Sensitivities are changes inthe input of the analysis that bias the outcome.Indices for each hazard have been calculated bygiving ranking and weights to the criteria and alter-natives of the indicators using Analytic Hierarchyprocess (Saaty 1980). The criterion pairwise com-parison matrix takes the pairwise comparisons ofthe criteria as input and produces the relativeweights as output, with the AHP providing a math-ematical method of translating this matrix.
The three stages of intelligence, design and choiceidentified by Malczewski (1999) are transformed into
Fig. 6 Tracks of cyclones and depressions formed in the Bay of Bengal and made landfall in North Tamilnadu during 1891 to 2007(Source: Cyclone e-atlas software from IMD)
Fig. 7 Frequency of cyclonic disturbances, depressions (includ-ing deep depressions), cyclonic storms and severe cyclonicstorms (Source: Shrestha et al. 1998)
J Indian Soc Remote Sens (March 2013) 41(1):157–176 165

specific steps in making decisions. The steps followedin the process are:
1. State the goal and objectives.2. Identify components, criteria and alternatives
that are relevant to the problem of coastal risk.3. Develop the decision hierarchy.4. Assign scores to the alternatives against each of
the criteria and generate the evaluation matrix.5. Standardize the raw scores and generate priority
scores matrix.6. Determine a weight for each criterion to reflect
how important it is to the respective componentof risk.
7. Combine the weights and priority scores by ag-gregation to compute an overall assessment mea-sure for each decision alternative.
8. Rank the spatial units according to the level ofrisk
9. Perform sensitivity analysis to assess the robust-ness of the preference ranking to changes in thecriteria scores and assigned weights.
10. Examine the preference ranking, and demarcatethe zones of very low, low, moderate, high andvery high levels of risk.
Selection of the Evaluation Criteria and Alternatives
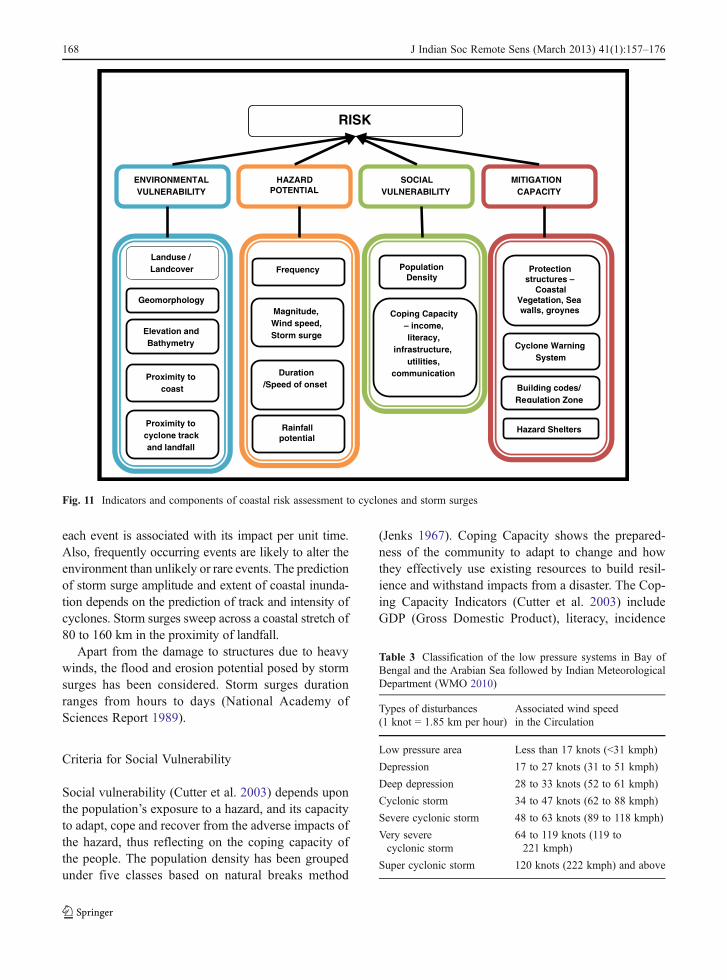
Evaluation criteria and alternatives are initiallyidentified with respect to the hazard scenario. Aset of criteria selected should adequately representthe decision-making environment and must contrib-ute towards the final goal (Fig. 11). Literature
Fig. 8 Multiple Buffers ofCyclone tracks in GIS nearthe study region between1945 and 2008
166 J Indian Soc Remote Sens (March 2013) 41(1):157–176

survey and analytical study are tools that aid in theselection of evaluation criteria (Birkmann 2006).The risk indicators have been selected on the basisof (a) Relevance to the study (b) Simple andstraightforward methods of measurement includinganticipated changes, and (c) Sensitivity and re-sponse to stresses in the system.
Criteria for Environmental Vulnerability
Environmental vulnerability is related to the physicalexposure of the land to the hazard, and is based on the
ability of different types of environments to cope andrecover from a hazard (Coburn 2001). Vulnerability tocyclones and storm surges (Jayanthi 1998) depends onthe local coastal topography and bathymetry includingthe shelf/slope characteristics in general. Shallow bayshave wide shelf and gentle slope properties, whichmake them highly susceptible, in addition to amplify-ing the surge in bays and inlets (Ali and Chowdhury1997; Murty et al. 2006). On the other hand, steepcoastlines and reefs reduce the surge potential. Sincethe hazard involves the conjunction of the sea and theland, the areas located along the direction of cyclonetrack and very near to the coast, will by profoundlyaffected by heavy winds and inundation from highwaves (Boulle et al. 1997). The plain areas near thecoast are most vulnerable to inundation. High sanddunes, wide beaches, mudflats, cliffs and lagoons incoastal areas act as barriers against strong winds,absorb floodwaters and dissipate wave energy, thushelping in coastal stabilization.
Criteria for Hazard Potential
The contributing factors for hazard potential are: Prob-ability of occurrence, Speed of onset, Magnitude ofhazard, Duration and Frequency. The possibility of ahazard strike decides the probability, which is calculatedfrom large historical databases and present observations.Speed or Rapidity of onset creates a setting of thewarning period before the impact. Most of the cyclonicstorms gather strength and make landfall spread over anumber of hours to few days. The magnitude (Table 3)gives the intensity and severity with which a hazardstrikes is important to know the impacts associated withit. Long duration-low impact and short duration-highimpact events bring the same amount of devastation as
Fig. 9 Coastal protection structure (Sea Wall) in Tiruvottiyur asseen from IKONOS imagery
Fig. 10 Cyclone shelters at Tiruvottiyur, Kattivakkam and Kannathur Reddy Kuppam
J Indian Soc Remote Sens (March 2013) 41(1):157–176 167
each event is associated with its impact per unit time.Also, frequently occurring events are likely to alter theenvironment than unlikely or rare events. The predictionof storm surge amplitude and extent of coastal inunda-tion depends on the prediction of track and intensity ofcyclones. Storm surges sweep across a coastal stretch of80 to 160 km in the proximity of landfall.
Apart from the damage to structures due to heavywinds, the flood and erosion potential posed by stormsurges has been considered. Storm surges durationranges from hours to days (National Academy ofSciences Report 1989).
Criteria for Social Vulnerability
Social vulnerability (Cutter et al. 2003) depends uponthe population’s exposure to a hazard, and its capacityto adapt, cope and recover from the adverse impacts ofthe hazard, thus reflecting on the coping capacity ofthe people. The population density has been groupedunder five classes based on natural breaks method
(Jenks 1967). Coping Capacity shows the prepared-ness of the community to adapt to change and howthey effectively use existing resources to build resil-ience and withstand impacts from a disaster. The Cop-ing Capacity Indicators (Cutter et al. 2003) includeGDP (Gross Domestic Product), literacy, incidence
RISK
ENVIRONMENTAL VULNERABILITY
HAZARD POTENTIAL
SOCIAL VULNERABILITY
MITIGATION CAPACITY
Landuse / Landcover
Geomorphology
Elevation and Bathymetry
Proximity to coast
Proximity to cyclone track and landfall
Frequency
Magnitude, Wind speed, Storm surge
Duration /Speed of onset
Rainfall potential
Coping Capacity – income, literacy,
infrastructure, utilities,
communication
Population Density
Protection structures –
Coastal Vegetation, Sea walls, groynes
Cyclone Warning System
Building codes/ Regulation Zone
Hazard Shelters
Fig. 11 Indicators and components of coastal risk assessment to cyclones and storm surges
Table 3 Classification of the low pressure systems in Bay ofBengal and the Arabian Sea followed by Indian MeteorologicalDepartment (WMO 2010)
Types of disturbances(1 knot 0 1.85 km per hour)
Associated wind speedin the Circulation
Low pressure area Less than 17 knots (<31 kmph)
Depression 17 to 27 knots (31 to 51 kmph)
Deep depression 28 to 33 knots (52 to 61 kmph)
Cyclonic storm 34 to 47 knots (62 to 88 kmph)
Severe cyclonic storm 48 to 63 knots (89 to 118 kmph)
Very severecyclonic storm
64 to 119 knots (119 to221 kmph)
Super cyclonic storm 120 knots (222 kmph) and above
168 J Indian Soc Remote Sens (March 2013) 41(1):157–176

of poverty, life expectancy, insurance mechanisms,degree of urbanization, access to public health facili-ties, access to education, community organizations,planning regulations at national and local levels, exist-ing warning and protection mechanisms. The humandevelopment index for India for 2010 has been com-puted as 0.519 by the United Nations DevelopmentProgramme. The Human Development Index (HDI)developed by United Nations Development Programme(UNDP) appears to be the best available indicator formeasuring coping capacities.
Coping capacity indicates how a person’s well be-ing, literacy, income (Winchester 2000), housing,communications, transport, infrastructure and otherbasic amenities serve as lifelines for resilience andsocial security during extreme events. Education leadsto good earnings to absorb and recover from losses,augmenting the ability to understand timely warninginformation. A hazard leads to a disaster only whenthere is human factor involved. Dense settlements giverise to more losses as well as they hinder the evacua-tion process. The value, quality and density of resi-dential construction (Cutter et al. 2003) also results inmajor losses during cyclonic events. All lightweightStructures and houses built of mud, unburnt brick andwood walls, with light weight roofing face high riskfrom heavy winds when compared to concrete
buildings. Also, the loss of basic infrastructure result-ing in disruption of communication and transport fa-cilities during crisis aggravates the delay in recovery.Health care facilities are required for relief measuresduring and after the event (Arya et al. 2005). Hence,social vulnerability is expressed as a function of pop-ulation density, infrastructure and coping capacity ofthe region (Kumpulainen 2006).
Criteria for Mitigation Capacity
Mitigation Capacity refers to the structural (both nat-ural and man-made) and non-structural measures un-dertaken in the region for reducing the hazard impact.Coastal mangroves and Casuarina plantation are thepredominant vegetation that serves as bio-shield(Selvam et al. 2005) or shelterbelts to protect humansettlements and coastal environments by considerablyreducing the wind speed of cyclones, and height ofassociated surges. In addition, construction andstrengthening of hard engineering structures suchas groynes, breakwaters, jetties, sea embankments(National Academy Sciences Report 1989) andfloodgates serve as guard from storm surges. Softmeasures such as beach nourishment, setbackzones, codes and regulations protect the hazard-prone areas. An accurate and timely prediction ofa hazardous event could save many human lives.The mitigation options for cyclone and stormsurges are proper warning and response system(Parker 1999) to provide rapid dissemination ofcyclone warnings to ports, fisheries and public.Weather forecast availability by continuous moni-toring and tracking of storms through satellites,public awareness programmes, evacuation and re-location plans (Perry and Lindell 1997), properly
Table 4 Weights of different criteria obtained by Pairwisecomparison method
Criteria Weightage
Environmentalvulnerability
Proximity to cyclone track 0.409
Proximity to landfall 0.297
Proximity to coast 0.099
Land use/land cover 0.031
Geomorphology 0.031
Shelf/Slope characteristics 0.133
Hazard potential Cyclonic wind speed 0.517
Storm surge height 0.305
Frequency/return period 0.124
Duration/Speed of onset 0.054
Socialvulnerability
Population density 0.5
Coping capacity 0.5
Mitigationcapacity
Coastal protection structures(natural and artificial),Warning system infrastructure
1.0
Table 5 Random Consistency Indices (Saaty 1980)
n RI n RI n RI
1 0.00 6 1.24 11 1.51
2 0.00 7 1.32 12 1.48
3 0.58 8 1.41 13 1.56
4 0.90 9 1.45 14 1.57
5 1.12 10 1.49 15 1.59
RI random consistency index
n number of criteria
J Indian Soc Remote Sens (March 2013) 41(1):157–176 169
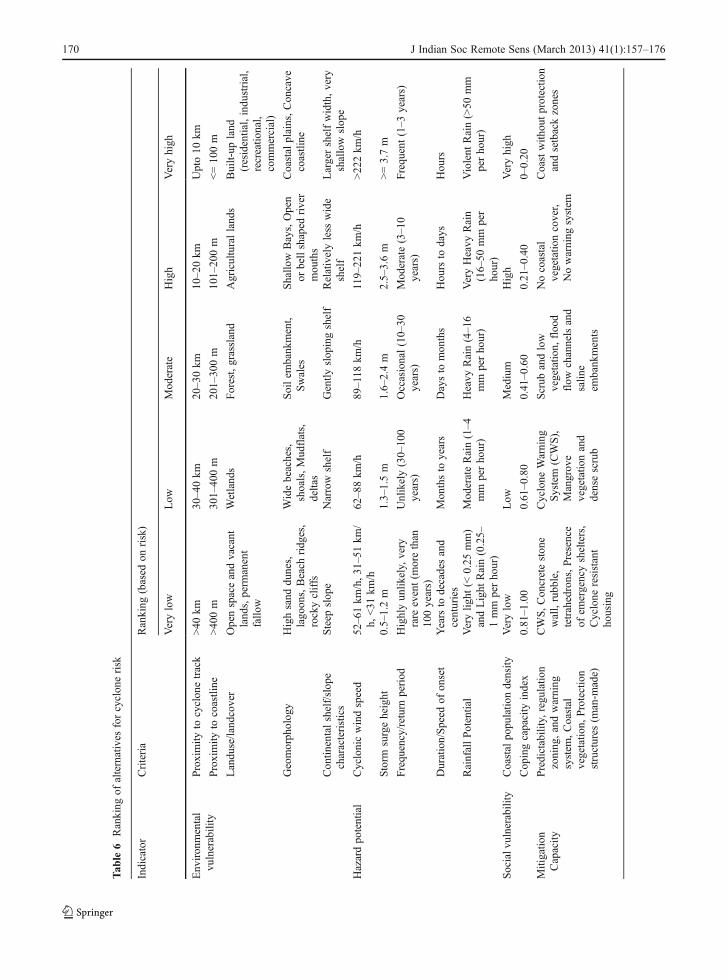
Tab
le6
Ranking
ofalternatives
forcyclon
erisk
Indicator
Criteria
Ranking
(based
onrisk)
Verylow
Low
Mod
erate
High
Veryhigh
Env
iron
mental
vulnerability
Proximity
tocyclon
etrack
>40
km30–4
0km
20–30km
10–2
0km
Upto10
km
Proximity
tocoastline
>40
0m
301–
400m
201–
300m
101–
200m
<010
0m
Landu
se/land
cover
Openspaceandvacant
land
s,perm
anent
fallo
w
Wetland
sForest,grassland
Agriculturalland
sBuilt-up
land
(residential,indu
strial,
recreatio
nal,
commercial)
Geomorph
olog
yHighsand
dunes,
lago
ons,Beach
ridg
es,
rockycliffs
Widebeaches,
shoals,Mud
flats,
deltas
Soilem
bank
ment,
Swales
Shallo
wBays,Open
orbellshaped
river
mou
ths
Coastal
plains,Con
cave
coastline
Con
tinentalshelf/slop
echaracteristics
Steep
slop
eNarrow
shelf
Gently
slop
ingshelf
Relativelyless
wide
shelf
Largershelfwidth,very
shallow
slop
e
Hazardpo
tential
Cyclonicwindspeed
52–6
1km
/h,31
–51km
/h,
<31
km/h
62–8
8km
/h89
–118
km/h
119–22
1km
/h>22
2km
/h
Storm
surgeheight
0.5–1.2m
1.3–1.5m
1.6–
2.4m
2.5–
3.6m
>03.7m
Frequ
ency/returnperiod
Highlyun
likely,very
rare
event(m
orethan
100years)
Unlikely(30–10
0years)
Occasional(10–30
years)
Mod
erate(3–10
years)
Frequ
ent(1–3
years)
Duration/Speed
ofon
set
Years
todecadesand
centuries
Mon
thsto
years
Daysto
mon
ths
Hou
rsto
days
Hou
rs
RainfallPotential
Verylig
ht(<
0.25
mm)
andLight
Rain(0.25–
1mm
perho
ur)
Mod
erateRain(1–4
mm
perho
ur)
Heavy
Rain(4–1
6mm
perho
ur)
VeryHeavy
Rain
(16–50
mm
per
hour)
Violent
Rain(>50
mm
perho
ur)
Socialv
ulnerability
Coastal
popu
latio
ndensity
Verylow
Low
Medium
High
Veryhigh
Cop
ingcapacity
index
0.81–1
.00
0.61–0
.80
0.41
–0.60
0.21
–0.40
0–0.20
Mitigatio
nCapacity
Predictability,regu
latio
nzoning
,andwarning
system
,Coastal
vegetatio
n,Protection
structures
(man-m
ade)
CWS,Con
creteston
ewall,rubb
le,
tetrahedrons,Presence
ofem
ergencyshelters,
Cyclone
resistant
housing
Cyclone
Warning
System
(CWS),
Mangrov
evegetatio
nand
densescrub
Scrub
andlow
vegetatio
n,floo
dflow
channelsand
salin
eem
bank
ments
Nocoastal
vegetatio
ncover,
Nowarning
system
Coastwith
outprotectio
nandsetbackzones
170 J Indian Soc Remote Sens (March 2013) 41(1):157–176

constructed community shelters and building codeenforcement in vulnerable locations also form partof mitigation measures. The community prepared-ness is dependent on the state of infrastructure andcommunication facilities for early warning. Satel-lite data helps follow the movement of cyclonesand project their likely track. Early warninginvolves activities such as modeling and simula-tion of risk scenarios using in-situ and remotelysensed data, publishing of manuals containingcodes and regulations and operational testing ofevacuation procedures.
Decision Making Using AHP
The conceptual framework in developing the coastal riskindex involves the identification of various criteria andalternatives and integrating (Fedra and Feoli 1998) themthrough GIS. The criteria under each component forcoastal risk are given priority scores using the pairwisecomparison matrix to derive their importance in thedecision-making. The nine-point scale developed bySaaty (1980) forms the basis for the pairwise comparisonof the criteria used in the Analytic Hierarchy process(Table 4). Weights are usually normalized to sum up to1, so that in a set of n number of weights (W1, W2, …,Wn), i¼1Σ
nWi ¼ 1. Inconsistent and subjective judg-ments with constantly varying criteria alter the outputssignificantly. Consistency Index (CI) provides a measureof departure from consistency using the formula:CI ¼ lmax � nð Þ= n� 1ð Þ, where λmax is the maximumprincipal eigen value of the judgement matrix and ‘n’ isthe number of criteria.
Calculation of the consistency ratio (CR) is definedas follows: CR 0 CI/RI, where RI is the Random Con-sistency Index and depends on the number of elementsbeing compared (Table 5). The ratio of ConsistencyIndex to the Random Consistency Index based on thenumber of elements gives the Consistency Ratio (CR).Reasonable consistency in the pairwise comparison isachieved if CR<0.10. The AHP process has been exe-cuted using Criterium Decision Plus software.
The alternatives under each criteria are groupedaccording to the risk level posed and are assigned thefollowing rank levels: 1-very low, 2-low, 3-moderate,4-high, 5-very high (Table 6). The various alternativeshave been ranked according to their contribution to thelevel of risk in accordance with the Analytic Hierarchy
process. These ranks are then standardized throughlinear scale transformation procedure to provide valuesin the range of 0 to 1. The preference ranking has beenchecked for consistency by computing the consistencyratio using the CDP software. GIS incorporates theranks and weights as attributes in the spatial entitiesand derives the respective scores. The next step consistsof combining the matrices of priority scores and weightsthus performing the aggregation procedure, giving thelevel of risk under each component category.
The score for every single spatial unit for each ofthe four components of risk is:
Risk Score¼i¼1 Σn Wi � Xið Þ ð1Þ
where
Wi weight of criterion iXi ranking/priority score of alternative for each
criterion i
Risk Index Generation
The methodology used to calculate the risk indexfollows the approach below:
Step 1: Calculate partial indices viz. environmentalvulnerability index, social vulnerability in-dex, hazard potential index and mitigationcapacity index from the respective indicatorsusing multi-criteria analysis.
Step 2: Compute an integrated Coastal Risk indexvalue using the equation
CRI ¼ EVIþ SVIþ HPI�MCI ð2Þwhere
EVI Environmental Vulnerability IndexSVI Social Vulnerability IndexHPI Hazard Potential IndexMCI Mitigation Capacity Index
Coastal risk could thus be expressed as a functionof the following: environmental exposure, population,coping capacity, hazard frequency and magnitude andmitigation capacity of the region. The minus sign forMitigation Capacity index indicates that high mitiga-tion denotes a low level of risk.
J Indian Soc Remote Sens (March 2013) 41(1):157–176 171

Table 7 Normalized cyclone risk indices for the study region
Location Spatial units Normalized cyclonerisk index
Location Spatial units Normalized cyclonerisk index
Eravanur 1 0 Kattivakkam 4 0.449869
Eravanur 1 0.014575 Thiruvanmiyur 1 0.455596
Kattivakkam 2 0.104112 Injambakkam 12 0.457157
Kovalam 1 0.118688 Injambakkam 13 0.460801
Eravanur 2 0.121186 Injambakkam 20 0.463092
Eravanur 3 0.135762 Avvainagar 19 0.464445
Eravanur 2 0.137532 Kattivakkam 4 0.464862
Eravanur 3 0.148464 Thiruvanmiyur 1 0.471941
Eravanur 4 0.152108 Kovalam 1 0.472982
Palavakkam 12 0.159916 Palavakkam 23 0.479437
Uthandi 1 0.196772 Kovalam 2 0.487558
Kovalam 1 0.2004164 Kovalam 1 0.543362
Kovalam 2 0.208953 Kannathur reddy kuppam 3 0.544924
Kattivakkam 1 0.21572 Kannathur reddy kuppam 4 0.56127
Kannathur reddy kuppam 11 0.232587 Chindaripet 2 0.564914
Chindaripet 14 0.236231 Sholinganallur 1 0.576366
Avvainagar 13 0.241644 Eravanur 3 0.641749
Palavakkam 14 0.248932 Muthukadu 5 0.649036
Palavakkam 13 0.252576 Sholinganallur 3 0.65268
Avvainagar 42 0.25622 Eravanur 16 0.656324
Kovalam 1 0.264029 Eravanur 3 0.658094
Kovalam 1 0.264757 Injambakkam 5 0.665382
Kattivakkam 2 0.271525 Tandaiyarpet 6 0.669026
Eravanur 5 0.279021 Palavakkam 11 0.680478
Kovalam 2 0.279333 Eravanur 4 0.712129
Eravanur 5 0.293597 Eravanur 12 0.728474
Avvainagar 5 0.297449 Urur 1 0.744091
Avvainagar 15 0.312024 Avvainagar 4 0.745861
Kattivakkam 1 0.327329 Injambakkam 21 0.753149
Kovalam 1 0.335137 Avvainagar 18 0.756793
Tiruvottiyur 1 0.340343 Tandaiyarpet 2 0.758355
Uthandi 1 0.341905 Avvainagar 39 0.760437
Eravanur 3 0.343987 Avvainagar 6 0.762207
Tiruvottiyur 1 0.344403 Eravanur 5 0.767933
Eravanur 3 0.345757 Urur 3 0.779798
Avvainagar 5 0.353253 Eravanur 13 0.784279
Eravanur 5 0.356689 Kovalam 1 0.792087
Eravanur 2 0.358979 Tandaiyarpet 1 0.799583
Eravanur 6 0.3603331 East vallalar nagar 12 0.816241
Injambakkam 9 0.368141 Avvainagar 3 0.818011
Eravanur 4 0.375325 Kattivakkam 1 0.862467
Palavakkam 12 0.383133 Avvainagar 16 0.872045
Kovalam 2 0.392712 Avvainagar 2 0.873815
Palavakkam 15 0.397709 Kattivakkam 3 0.903695
172 J Indian Soc Remote Sens (March 2013) 41(1):157–176

Step 3: All the values obtained in the intermediateand final steps are standardized accordinglyusing the formula:
Normalized index value ¼ Actual value�Minimumvalueð Þ=Maximumvalue �Minimumvalueð Þ
The spatial units have been derived by overlay-ing the respective hazard and thematic layers andthe final composite layer consists of the spatialunits of different risk levels. For criteria such asmitigation capacity, the ranks and weights havebeen added as attribute data to the spatial entities.The four component indices, Environmental Vul-nerability Index, Social Vulnerability Index, HazardPotential Index and Mitigation Capacity Index,have been overlayed in GIS environment and com-bined using union operation, where the aggregatedscores of the components have been formulated toget the risk map (Edwards et al. 2007) of the studyarea. The standardized values have been mappedand classified under 5 degrees of risk namely “verylow”, “low”, “moderate”, “high” and “very high”risk. The index values have been classified usingthe natural break statistical method and normalizedbetween 0 and 1. Each spatial entity in a singleadministrative unit would have different levels ofrisk based on the environment, social criteria, haz-ard potential and mitigation capacity.
Results and Conclusions
The criteria belonging to the four components aregiven respective weights according to their priorities.
The weights have been transformed into attributes inthe respective thematic layers in GIS environment.Overlay operation is performed and the standardizedscores of the criteria and alternatives have been aggre-gated to give the individual component risk indicesand integrated cyclone risk index values. Each com-ponent index map consists of the corresponding the-matic layers and their attributes with the aggregationweights of criteria and rank scores of alternatives. Theindex values are generated by using Eq. 2 for all thespatial entities of the administrative units of the studyregion in the final integrated map and the normalizedvalues are obtained (Table 7).
The Coastal Risk index map to Cyclones (Fig. 12) hasbeen generated using the normalized cyclone risk indicesand the values have been grouped into five classes bynatural breaks method in ArcMap by identifying breakpoints and patterns inherent in the data (Table 8).
The classes have been transformed into a thematicmap using ArcGIS with different tones on the mapindicating different levels of risk. In this way, a finalrisk map for cyclone could be generated showing‘very low’, ‘low’, ‘moderate’, ‘high’ and ‘very high’vulnerable regions to cyclones and storm surges. Theuncertainty generally associated with any decisionsituation requires a sensitivity analysis to test the con-sistency of a given decision in response to any mod-ification in the input data or the preferences to thecriteria. The main purpose of sensitivity analysis isto examine how sensitive rankings of the alternativesare to the changes in importance to the environmental,hazard, social and mitigation indicators. The presentweight of each indicator such as landuse, geomorphol-ogy, surge height, protection structure etc. are in-creased or decreased and the corresponding finalindex value calculated. The analysis has been
Table 7 (continued)
Location Spatial units Normalized cyclonerisk index
Location Spatial units Normalized cyclonerisk index
Thiruvanmiyur 1 0.399791 Avvainagar 37 0.92785
Thiruvanmiyur 1 0.416137 Kattivakkam 2 0.969078
Kovalam 5 0.431754 Tiruvottiyur 3 0.973297
Kovalam 3 0.433524 Avvainagar 40 0.983654
Injambakkam 12 0.440812 Kattivakkam 2 0.985424
Injambakkam 17 0.448099 Tiruvottiyur 7 0.992074
Kattivakkam 2 0.448516 Tiruvottiyur 9 1
J Indian Soc Remote Sens (March 2013) 41(1):157–176 173

performed dynamically using CDP software by chang-ing the priorities of the criteria in the Sensitivity graph.The priorities of the remaining criteria decrease inproportion to their original priorities. The programrecalculates the priorities of the alternatives based ontheir new relationship. Both weighted and unweightedoptions have been considered for calculation. In un-weighted, the criteria have equal priorities and inweighted, the criteria are given both priorities anddifferences. The process runs in an iterative manneruntil no further change in the level of risk occurs. Any
Table 8 Classification of cyclone risk level
Risk level Range
Very low 0.000–0.216
Low 0.216–0.416
Moderate 0.416–0.576
High 0.576–0.818
Very high 0.818–1.000
Fig . 12 Map showingcoastal risk indices for spa-tial units of the study region
174 J Indian Soc Remote Sens (March 2013) 41(1):157–176

further alteration to the criteria weights would result inan inferior solution. The analysis showed slight varia-tions from the final decision scores, but the level ofrisk remained the same. The results of the sensitivityanalysis indicates no major changes in the spatialdistribution of risk patterns in comparison to thoseproduced from the original scenario.
The mitigation capacity index takes high values forKattivakkam, Tiruvottiyur and Kannuthur ReddyKuppam, hence reducing the risk level. On the otherhand, Tiruvottiyur in Tiruvallur district, and manyplaces in Chennai, face substantial risk due to the hugepopulation and the challenges in evacuating and relo-cating them. The environmental vulnerability is highwithin a few km from the coast throughout the studyarea and is more pronounced in built-up areas, whichis present in the northern part of the study region.North Chennai region faces threat from potential cy-clonic storms as proved by the recent ‘Jal’ cyclonecausing heavy downpour and winds during Octoberand November 2010. The southern areas of Neelan-karai, Palavakkam and Sholinganallur have low levelsof risk from cyclones and storm surges. Kattivakkam,Chindaripet, Avvainagar, Thiruvanmiyur and Urur,which lie adjacent to the river and creeks, face riskfrom flash flooding due to heavy rainfall and stormsurges from cyclones. The present study has showedthat the study region forming the northern coast ofTamilnadu has regions of high risk to cyclones dueto a number of factors like proximity to tracks offrequent cyclones, high population density and inade-quate protection from storm surges.
The above work has attempted to integrate thefunctionalities of multi-criteria analysis in GIS en-vironment for deriving the Cyclone risk Indexvalues for the study region from Kattivakkam toKovalam of Tamilnadu, India. The physical expo-sure of the environment combined with the socialfactors has shown the actual areas under high riskto cyclones. By integrating the evaluation and statisti-cal techniques with GIS, the contributory factors havebeen evaluated more flexibly and the Analytical Hierar-chy Process has captured the importance of each criteriaand component used in the decision making process.Since, the ranks and weights were given to a wide rangeof indicators, representing them in the form of attributedata for different thematic layers using ArcGIS provedvery effective. In addition, the GIS environment provid-ed flexibility during the integration and overlay of
layers, which were mostly generated from remotelysensed data. The risk indices generated for cyclonehazard for the study region will serve as useful pointersin designing better mitigation and protection strategiesfor the region. Hence, the GIS based multi-criteria anal-ysis has proved to be an efficient and useful tool forcoastal risk assessment to cyclones.
References
Ali, A., & Chowdhury, J. U. (1997). Tropical cyclone riskassessment with special reference to Bangladesh. Mausam,48, 305–322.
Arya, A. S., Karanth, A., &Agarwal, A. (2005). Hazards, disastersand your community—version 1.0, A Primer for Parliamen-tarians, GoI-UNDP Disaster Risk Management Programme2002–2009, Government of India, Ministry of Home Affairs,National Disaster Management Division, p. 61.
Birkmann, J. (2006). Indicators and criteria for measuring vul-nerability: Theoretical bases and requirements. In:Measur-ing vulnerability to natural hazards: Towards disasterresilient societies (pp. 55–77). University Press, UnitedNations University.
Blaikie, P., Cannon, T., Davis, I., & Wisner, B. (1994). At risknatural hazards, people’s vulnerability, and disasters, 1stedn. Routledge.
BMTPC (1997). Vulnerability Atlas of India, parts I–III. Build-ing materials and technology promotion council. Ministryof Urban Development, Government of India.
Boulle, P., Vrolijks, L., & Palm, E. (1997). Vulnerability reduc-tion for sustainable urban development. Agency Report, 5(3): 179–188.
Clark, M. J. (1998). Flood insurance and coastal resilience: a UK-focused discussion.Geographical Journal, 164(3), 333–343.
Coburn, A. S. (2001). Reducing the vulnerability of North Caroli-na’s coastal communities: a model approach for identifying,mapping and mitigating coastal hazards. NCEMReport, p. 10.
Cushing, S. W. (1913). The east coast of India. Bulletin of theAmerican Geographical Society, 45(2), 81–92.
Cutter, S. L. (1993). Living with risk. London: Edward Arnold.214 p.
Cutter, S. L., Boruff, B. J., & Shirley, W. L. (2003). Socialvulnerability to environmental hazards. Social ScienceQuarterly, 84(2), 242–261.
Edwards, J., Gustafsson, M., & Landenmark, B. N. (2007).Handbook for vulnerability mapping. EU Asia Pro Ecoproject, Disaster Reduction through Awareness, Prepared-ness and Prevention Mechanisms in Coastal Settlements inAsia, Demonstration in Tourism Destinations. SwedishRescue Services Agency, EU and International AffairsDepartment, p. 18.
Fedra, K., & Feoli, E. (1998). GIS technology and spatialanalysis in coastal zone management. EEZ Technology,Edition 3, pp. 171–179.
Gallopin, G. C. (2006). Linkages between vulnerability, resil-ience and adaptive capacity. Global EnvironmentalChange, 16(3), 293–303.
J Indian Soc Remote Sens (March 2013) 41(1):157–176 175

Jayanthi, N. (1998). Cyclone hazard, coastal vulnerability anddisaster risk assessment along the Indian coasts. Vayumandal,28, 3–4.
Jenks, G. F. (1967). The data model concept in statistical map-ping. International Yearbook of Cartography, 7, 186–190.
Kelly, P. M., & Adger, W. N. (2000). Theory and practice inassessing vulnerability to climate change and facilitatingadaptation. Climatic Change, 47, 325–352.
Kumpulainen, S. (2006). Vulnerability concepts in hazard andrisk assessment in natural and technological hazards andrisks affecting the spatial development of Europeanregions. In P. Schmidt-Thomé (Ed.), Geological survey ofFinland, Special Paper 42, pp. 65–74.
Malczewski, J. (1999). GIS and multicriteria decision analysis.New York: Wiley.
Mani, J. S. (2000). Coastal processes in Tamil Nadu and Kerala:Environmental and socioeconomic aspects. In V. K.Sharma (Ed.), Environmental problems of coastal areasin India (pp. 201–216). New Delhi: Bookwell.
Ministry of Earth Sciences Report (2006). Shoreline manage-ment plan for Ennore coast (Tamilnadu). Integrated Coast-al and marine Area Management Project Directorate,Chennai, p. 169
MoEF Report (2004). India’s Initial National Communication tothe United Nations Framework Convention on ClimateChange, Ministry of Environment and Forests, Govern-ment of India, IND/COM/1 B, New Delhi, p.266.
Murty, K. S. R., Subrahmanyam, A. S., Murty, G. P. S., Sarma, K.V. L. N. S., Subrahmanyam, V., Rao, K. M., et al. (2006).Factors guiding tsunami surge at the Nagapattinam—Cudda-lore shelf, Tamilnadu, East coast of India. Current Science,90(11), 1535–1538.
National Academy of Sciences Report (1989). Measuring andunderstanding coastal processes. Committee on CoastalEngineering Measurement Systems, Marine Board, Nation-al Research Council, p. 130
NRIS (1997). National (Natural) Resources Information System—node design and standards, Doc. No. SAC/RSA/NRIS-SIP/SD-01/97, Space Applications Centre, Ahmedabad, p. 222.
O’Brien, K., Eriksen, S., Schjolden, A., & Nygaard, L. (2004).Conflicting interpretations of vulnerability in climatechange research, March 2004, CICERO, Center for Inter-national Climate and Environmental Research, Norway,CICERO Working Paper 2004:04, p. 16.
Parker, D. (1999). Criteria for evaluating the condition of a tropicalcyclone warning system. Disasters, 23(3), 193–216.
Perry, R. W., & Lindell, M. K. (1997). Principles for managingcommunity relocation as a hazard mitigation measure. Jour-nal of Contingencies and Crisis Management, 5(1), 49–59.
Rao, L. H. J., Rao, T. S., Reddy, D. R. S., Biswas, N. R.,Mohapatra, G. P., & Murty, P. S. N. (1992). Morphologyand sedimentation of continental slope, rise and abyssalplain of Western part of Bay of Bengal. Geological Surveyof India, Special publication, 29, 209–217.
Renaud, F. G. (2006). In: J. Birkmann (Ed.), Measuring vulner-ability to natural hazards: Towards disaster resilient soci-eties (pp. 119–129). University Press, United NationsUniversity.
UNEP Report (2008). Disaster risk management for coastaltourism destinations responding to climate change—apractical guide for decision makers. United Nations Envi-ronment Programme, Caribbean Alliance for SustainableTourism, UNEP Manuals on Sustainable Tourism, p. 116.
Saaty, T. L. (1980). The analytic hierarchy process. McGraw-Hill International.
Schmoldt, D. L., Kangas, J., & Mendoza, G. A. (2001). Theanalytic hierarchy process in natural resource and envi-ronmental decision making (pp. 1–13). Kluwer.
Selvam, V., Ravishankar, T., Karunagaran, V. M., Ramasubra-manian, R., Eganathan, P., & Parida, A. K. (2005). Toolkitfor establishing Coastal Bioshield, MSSRF/MA/05/26, p.117.
Shetye, S. R., Gouveia, A. D., & Pathak, M. C. (1990). Vulner-ability of the Indian coastal region to damage from sealevel rise. Current Science, 59(3), 152–156.
Shrestha, M. L., Ferdousi, N., & Uddin, S. (1998). The impact oftropical cyclones on the coastal regions of SAARCcountries and their influence in the region (p. 334). Agar-gaon: SAARC Meteorological Research Centre, SMRC—No. 1 Saarc Meteorological Research Centre (SMRC).
Smit, B., & Wandel, J. (2006). Adaptation, adaptive capacityand vulnerability. Global Environmental Change, 16(3),282–292.
Winchester, P. (2000). Cyclone mitigation, resource allocationand post disaster reconstruction in South India: lessonsfrom two decades of research. Disasters, 24(1), 18–37.
WMO (2010). World Meteorological Organization TechnicalDocument, WMO/TD No. 84, TROPICAL CYCLONEPROGRAMME, Report No. TCP21, Tropical Cycloneoperational plan for the Bay of Bengal and the ArabianSea, Edition 2010, Secretariat of the World MeteorologicalOrganization, Geneva, Switzerland, p. 97.
176 J Indian Soc Remote Sens (March 2013) 41(1):157–176