Embed Size (px)
Citation preview

GEOSPATIAL ENERGY MAP OF INDIA USER GUIDE
JULY 2021
Associated Ministries and Departments
Ministry of Power
Ministry of New and Renewable Energy
Ministry of Coal
Ministry of Petroleum and Natural Gases
Department of Atomic Energy

2
PROJECT TEAM
NITI AAYOG
Dr Rakesh Sarwal, Additional Secretary (Energy)
Shri Rajnath Ram, Adviser (Energy)
Shri Navin Kumar Vidyarthi, Director (Energy)
Ms. Saumya Pandey, Young Professional (Energy)
ISRO HEADQUARTER, BANGALORE
Shri Shantanu Bhatawdekar, Director, EDPO
Ms Vijaya Bhanu, Scientist \ Engineer SG
SPACE APPLICATIONS CENTRE, AHMEDABAD
Shri Shashikant Sharma, Group Director, VRG
Dr Gaurav Jain, Scientist \ Engineer SF
Ms. Shweta Mishra, Scientist \ Engineer SE
Shri Pankaj Bodani, Scientist \ Engineer SE
Shri Rajendra Gaikwad, Scientist \ Engineer SE
Shri Arpit Agarwal, Scientist \ Engineer SD
CENTRAL ELECTRICITY AUTHORITY, MINISTRY OF POWER
Shri M. A. K. P. Singh, Chief Engineer (IT)
MINISTRY OF NEW & RENEWABLE ENERGY
Shri Pankaj Saxena, Scientist F
COAL CONTROLLER’S ORGANISATION, MINISTRY OF COAL
Shri V P Singh, Director CCO
PETROLEUM PLANNING AND ANALYSIS CELL, MINISTRY OF PETROLEUM & NATURAL GAS
Dr. Pankaj Sharma, Additional Director (D&ES)
DEPARTMENT OF ATOMIC ENERGY
Shri S. K. Agrawal, SO/G, Member, Nuclear Controls & Planning Wing
Shri S. M. Basha, SO/G, Member, Nuclear Controls & Planning Wing
STANDARDISATION TESTING AND QUALITY CERTIFICATION DIRECTORATE
Shri Suresh Chandra, Director
NATIONAL INFORMATICS CENTRE
Shri Adarsh Saiwal, Scientist F
For Further Information, Please Contact:
Shri Navin Kumar Vidyarthi, Director (Energy), NITI Aayog, Email: [email protected]

3
TABLE OF CONTENTS
PROJECT TEAM 2
PROJECT OVERVIEW 5
GEOSPATIAL ENERGY PORTAL: USER GUIDE 7
Introduction 7
Spatial Data Visualisation 12
Query Functionalities 19
Additional Tools 24

4
LIST OF FIGURES
Figure 1: Geospatial Energy Portal Home Page ................................................................. 7
Figure 2: Functionalities in Geospatial Energy Map of India .................................................. 7
Figure 3: Geospatial Energy Map of India Home Page in Hindi ............................................... 8
Figure 4: Overview Section ......................................................................................... 8
Figure 5: Introduction to Solar Energy Sector ................................................................... 9
Figure 6: Overview Page ............................................................................................ 9
Figure 7: Data Snapshot ............................................................................................ 10
Figure 8: Data Partners and Useful Links ........................................................................ 10
Figure 9: Nodal Officers ............................................................................................ 11
Figure 10: Metadata Search ....................................................................................... 11
Figure 11: Disclaimer ............................................................................................... 12
Figure 12: Web-GIS based Geospatial Energy Map of India .................................................. 12
Figure 13: Legend Panel Display .................................................................................. 14
Figure 14: Legend Display and Metadata Popup ............................................................... 14
Figure 15: Interactive and User-friendly Map Navigation .................................................... 15
Figure 16: Overlay Layers and Base Maps ....................................................................... 15
Figure 17: Hydropower Plants Displayed over Digital Elevation Model .................................... 16
Figure 18: Energy Data View for Conventional Power Plants ................................................ 16
Figure 19: Energy Data View for Fossil Fuel Resources ....................................................... 17
Figure 20: State-level Data Visualisation ........................................................................ 17
Figure 21: Tabular View of State-level Data ................................................................... 18
Figure 22: Chart View of Selected State-level Data ........................................................... 18
Figure 23: Basic Feature Information of Conventional Power Plant ........................................ 19
Figure 24: Basic Feature Information of District-wise Solar Power Plants ................................ 19
Figure 25: Basic Feature Information of Coalmine ............................................................ 20
Figure 26: Basic Feature Information of Refinery ............................................................. 20
Figure 27: Dynamic Information on CIL Coalmine ............................................................. 21
Figure 28: Feature Information of District-wise Wind Power Plants ....................................... 21
Figure 29: Detailed Feature Information of District-wise Wind Power Plants ............................ 22
Figure 30: Text-keyword Filtering of Wind Power Plants .................................................... 22
Figure 31: State Energy Map Query .............................................................................. 23
Figure 32: Zone-wise Energy Data Visualisation ............................................................... 23
Figure 33: Upload KML or GeoJSON Geometry Files ........................................................... 24
Figure 34: Uploaded File on Energy Map ........................................................................ 25
Figure 35: Drawing Tools ........................................................................................... 25

5
PROJECT OVERVIEW
The energy data in India is fragmented and scattered across multiple organisations. While
different ministries may have detailed information and maps, about their respective domain of
expertise as per mandate, there is no consolidated energy map available in India that may provide
a holistic picture of the entire energy sector. Mostly, the available maps are static (i.e. in PDF
or JPG formats), and hence inhibit integration with the associated features of topography and
other physical infrastructure.
Geospatial energy map attempts to identify and locate all primary and secondary sources of
energy and their transportation/transmission networks to provide a comprehensive view of
energy production and distribution in India. Geographic Information System (GIS) of energy assets
will be useful for ensuring integrated planning of energy sector of India, given its large
geographical distribution and interdependence.
Keeping the above perspective in mind, the NITI Aayog collaborated with Indian Space Research
Organisation (ISRO) and signed a Memorandum of Understanding (MoU) on June 07, 2017 to
develop a comprehensive GIS-based Energy Map of India. The GIS-based energy map is intended
to provide valuable inputs for formulating policies such as National Energy Policy (NEP) and Vision
Document - 2035, reviewing such policy interventions, and assisting Energy Ministries in policy
formulation, besides encouraging private sector participation in the energy sector.
The process of developing GIS maps started with an inter-ministerial meeting with Ministry of
Coal, Ministry of Power, Ministry of New and Renewable Energy, Ministry of Petroleum and Natural
Gas, and Department of Atomic Energy. Subsequently these ministries appointed nodal officers
to ascertain requirements of respective ministries, and provide relevant information and data
coordinates. The data thus received was collated, validated, verified, corrected and organized
in a systematic database.
The web-based geospatial energy map of India enables visualisation of spatial and non-spatial
data on renewable and non-renewable power plants, oil and gas downstream sector, renewable
energy potential, fossil fuel resources, and other energy assets in India. The geospatial energy
portal provides unrestricted access to the energy map of India. The web-based geospatial energy
map of India has been currently deployed on VEDAS Server at SAC, Ahmedabad.
The energy map currently provides visualisation of static data of over 25 thematic layers. The
static data of all types of conventional power plants, including thermal (coal, diesel and natural
gas), hydro and nuclear power plants, refineries, LNG terminals, LPG bottling plants, POL
terminals, oil and gas wells, coal fields, coal blocks, district-wise data on renewable energy
(including solar, wind, small hydro, biomass & waste to energy plants), and renewable energy
resource potential (wind & solar energy) have been organized and published on the energy map.
The major functionalities in the geospatial energy map of India include visualisation of static and
dynamic data, interactive and user-friendly map navigation, pre-composed energy data views,
basic feature attribute query, dynamic data visualisation of select-layers, state- and zone- level
energy data visualisation, thematic layer metadata information display, and additional tools
(upload KML/JSON files, area/distance measurement tools, and tools for feature drawing).
The web-based energy map provides access to several reference layers. These reference layers
include Bhuvan WMS of village boundaries, MapMyIndia Base Maps and Annotations, transportation
network and high-resolution satellite data, Cartosat-1 DEM, and other base layers such as
highways, railway lines, rivers, cities and administrative boundaries.

6
The application has been developed using open source technology and in-house software. All
thematic layers are sharable using OGC compliant secure Web Map Service (WMS) for
interoperability.
A three-tier secure data editing application has also been developed to enable Nodal Officers in
modifying and updating the database. This will ensure that the data remains up-to-date.
The GIS-based energy map of India may be useful for geospatial planning of resource. It may be
used for infrastructure planning of upcoming solar parks, coal blocks, crude oil and natural gas
pipelines, investment guidance for financial institutions, disaster management of possible energy
disruption and emergency response, and safety of energy assets due to harsh climatic conditions.
This may also help in resource and environmental conservation measures, and inter-state
coordination on infrastructure planning including different corridors of energy and transport.
In recent years, India has opened up various aspects of energy exploitation (generation/
conversion/ transmission/ consumption) to private sector. Energy markets have immense
potential to bring in efficiency gains.
The GIS-based mapping of energy assets will be advantageous to all concerned stakeholders and
will help in accelerating the policy-making process.

7
GEOSPATIAL ENERGY PORTAL: USER GUIDE
INTRODUCTION
Geospatial energy portal provides interactive and user-friendly access to the energy map of India
over internet. The major functionalities incorporated in the energy portal are:
Visualisation of static energy maps;
Interactive and user-friendly map navigation;
Pre-defined energy data views;
Retrieval of feature information;
Dynamic data visualisation of coal mines;
Visualisation of state and zonal energy maps;
Drawing and measurement tools; and
Figure 1 shows the Home Page of geospatial energy portal (https://vedas.sac.gov.in/energymap).
The image slider provides a quick glance of major functionalities available on the portal (figure 2).
Figure 1: Geospatial Energy Portal Home Page
Figure 2: Functionalities in Geospatial Energy Map of India

8
The portal is currently available in two languages, viz. English and Hindi. The language of portal may
be selected from the language button on top left corner.
Hindi version of Geospatial Energy Map Home Page is shown in figure 3.
Figure 3: Geospatial Energy Map of India Home Page in Hindi
Overview section on home page introduces the website briefly (figure 4). The hyperlinks to thermal,
hydro, coalmines, petroleum refineries, solar energy and wind energy provide a brief note on these
sectors and description of their prominent classification. The hyperlink to Solar Energy open the
webpage on Solar Power Plants (figure 5)
Figure 4: Overview Section

9
Further details on the portal are provided on the separate page explaining the need and utility of
energy portal from the ‘More Info’ Link or the ‘Overview’ button on menu-bar (Figure 6).
Figure 5: Introduction to Solar Energy Sector
Figure 6: Overview Page

10
Data Snapshot section on the home page retrieves feature count of the thematic layers (vector)
populated in the GIS-based energy map (figure 7).
Figure 7: Data Snapshot
Data Partners section on the home page mentions the ministries and department of Government
of India that have contributed in development of this website (figure 8). Each ministry is hyperlinked
to respective official website.
Footer section provides useful links, including the links to NITI Aayog and ISRO.
Figure 8: Data Partners and Useful Links
11
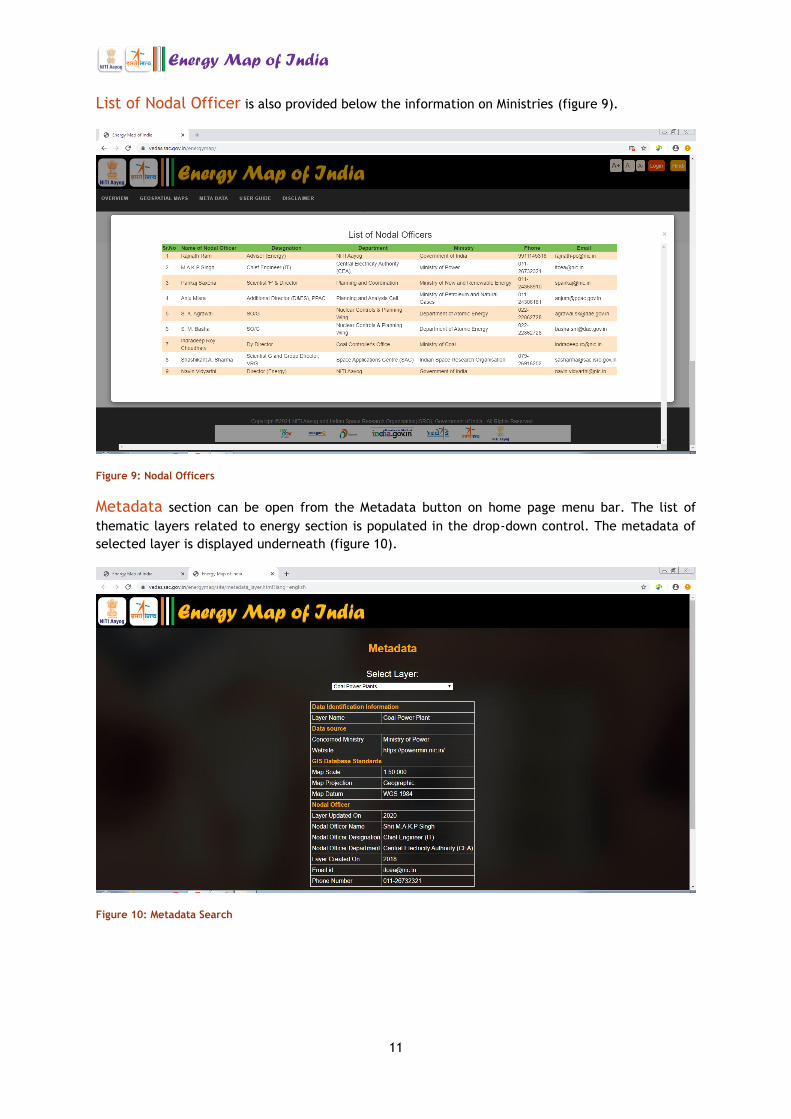
List of Nodal Officer is also provided below the information on Ministries (figure 9).
Figure 9: Nodal Officers
Metadata section can be open from the Metadata button on home page menu bar. The list of
thematic layers related to energy section is populated in the drop-down control. The metadata of
selected layer is displayed underneath (figure 10).
Figure 10: Metadata Search

12
Disclaimer section can be accessed from the button provided in the menu-bar. It explains the
limitation of data and its usability (figure 11).
Figure 11: Disclaimer
SPATIAL DATA VISUALISATION
Energy Map of India (figure 12) can be loaded from the Geospatial Maps button on the menu bar.
List of all thematic & reference layers is provided in the collapsible hierarchical tree in Layer Panel.
Figure 12: Web-GIS based Geospatial Energy Map of India

13
Layers are grouped under seven categories in the Layer Tree, viz. power plants, coal reserves,
petroleum & natural gas, transmission & distribution layers, renewable energy resources, state-wise
information, and reference layers. The List of layers is given in table 1:
Table 1: List of Thematic Layers in Energy Map of India
SN Layer Name Source
1 Coal Power Plants CEA
2 Diesel Power Plants CEA
3 Natural Gas Power Plants CEA
4 Hydro Power Plants CEA
5 Pumped Storage Power CEA
6 Sub-stations CEA
7 Nuclear Power Plants DAE
8 Coal Fields CMPDI
9 Coal Blocks CMPDI
10 Coal Washeries CMPDI
11 Coal Mines CIL/SCCL
12 Lignite Mines CCO
13 Captive Coal Mines CCO
14 District Wind Power MNRE
15 District Solar Power MNRE
SN Layer Name Source
16 District Small Hydro MNRE
17 District Biomass Power MNRE
18 District Waste to Energy MNRE
19 Solar Radiation Resource NIWE
20 Wind Potential (100m) NIWE
21 Bio-energy Potential ISRO
22 Refineries PPAC
23 LPG Bottling Plants PPAC
24 LNG Terminals PPAC
25 POL Terminals PPAC
26 Ethanol Plants PPAC
27 Oil / Gas Wells DGH
28 Sedimentary Basins DGH
29 Petroleum Product Pipelines PNGRB
30 Natural Gas Pipelines PNGRB
Note:
CEA: Central Electricity Authority;
CCO: Coal Controller’s Office;
CMPDIL: Coal Mine Planning and Design Institute;
CIL: Coal India Ltd.;
SCCL: Singareni Collieries Company Ltd.;
DAE: Department of Atomic Energy;
MNRE: Ministry of New and Renewable Energy;
ISRO: Indian Space Research Organisation;
PPAC: Petroleum Planning and Analysis Cell;
DGH: Directorate General of Hydrocarbon;
PNGRB: Petroleum and Natural Gas Regulatory Board.
In addition to the above listed thematic layers, several reference layers have also been provided.
These include the administrative boundaries, transportation network and high-resolution satellite
imageries obtained from Bhuvan Portal, High resolution base map with annotations from MapMyIndia,
infrastructure layers (airports, railway station, railways and highways), Cartosat-1 DEM and natural
resources (rivers and reservoirs).

14
The legend of each layer can be viewed under the Legend Panel (figure 13).
Figure 13: Legend Panel Display
Alternatively, the icon shown next to each layer also shows the legend of corresponding layer
(figure 14). The icon , shown alongside the legend icon, displays the metadata of corresponding
layer in a pop-up window. Metadata provides relevant information of the thematic layer such as its
name, feature type, contact information, concerned ministry, map scale, citation and survey year
(figure 14).
Figure 14: Legend Display and Metadata Popup

15
The website provides user-friendly interface with interactive navigation controls (icon on
map canvas for Zoom in and icon for zoom out) as shown in figure 15. Full zoom ( ) and zoom
to box ( ) buttons are also provided on map canvas to ease navigation. The layer & legend panels
may be collapsed and minimized to increase the view area of map canvas.
Figure 15: Interactive and User-friendly Map Navigation
Reference layers can be selected from the table of content of layers in Layers panel. The GIS-layers
of Infrastructure, Land use \ Land cover, Administrative Boundaries and Natural Features can be
overlaid on the thematic layers (figure 15 and figure 16).
Figure 16: Overlay Layers and Base Maps

16
Digital Elevation Model (DEM) with 10.0 m spatial resolution, derived from Cartosat-1 satellites of
ISRO has been provided to depict terrain.
Figure 17: Hydropower Plants Displayed over Digital Elevation Model
The energy data is further grouped into ten pre-defined views: (1) conventional power plants; (2)
biomass; (3) coal; (4) fossil fuel resources; (5) hydro-electric; (6) natural gas; (7) petroleum; (8)
renewable energy power plants; (9) solar; and (10) wind. In each of these views, relevant layers are
made visible while retaining the state of visibility of other layers.
Figure 18 shows thermal power plants based on coal, natural gas and diesel, hydro power plants and
nuclear power plants, as part of the ‘conventional power plants’ map view.
Figure 18: Energy Data View for Conventional Power Plants

17
The fossil fuel resources shows oil and natural gas wells, captive coalmines, coalfields and coal blocks
(figure 19).
Figure 19: Energy Data View for Fossil Fuel Resources
The energy portal also shows the state-wise information obtained from published reports. The state-
wise estimated reserves of coal, lignite, natural gas and crude oil for years 2014 and 2015, as
published in the Energy Statistics (MOSPI, 2016), are shown by proportionate-symbol maps. The state-
wise renewable energy potential is shown as pie-chart indicating share of different sources of
renewable energy on the basis of data provided in Energy Statistics (MOSPI, 2016) in figure 20.
Figure 20: State-level Data Visualisation
Similarly, mode-wise electricity generation, represented by pie-chart map, and energy consumption
choropleth map, derived from the All India Electricity Statistics (CEA, 2014) are also provided.

18
Data tables (icon on map canvas) and charts (icon on map canvas), based on data in Energy
Statistic (MOSPI, 2016) and All India Electricity Statistics (CEA, 2014) used to generate these maps,
can be viewed as shown in figure 21and figure 22 respectively.
Figure 21: Tabular View of State-level Data
Figure 22: Chart View of Selected State-level Data

19
QUERY FUNCTIONALITIES
The geospatial energy portal supports three types of queries for retrieval of required information:
what-lies query, where-lies query, and state-\zone-level energy map query.
‘What-lies’ query provides attribute information of a feature in the map at a given location. Figure
23 shows the attributes of a coal power plant located in Uttar Pradesh state. User can also zoom-in
to its location from the ‘Zoom to Feature’ button.
Figure 23: Basic Feature Information of Conventional Power Plant
Figure 24 shows the feature information of district-wise solar power plants. The more info tab
provides link to all solar power plants in the selected district.
Figure 24: Basic Feature Information of District-wise Solar Power Plants
20
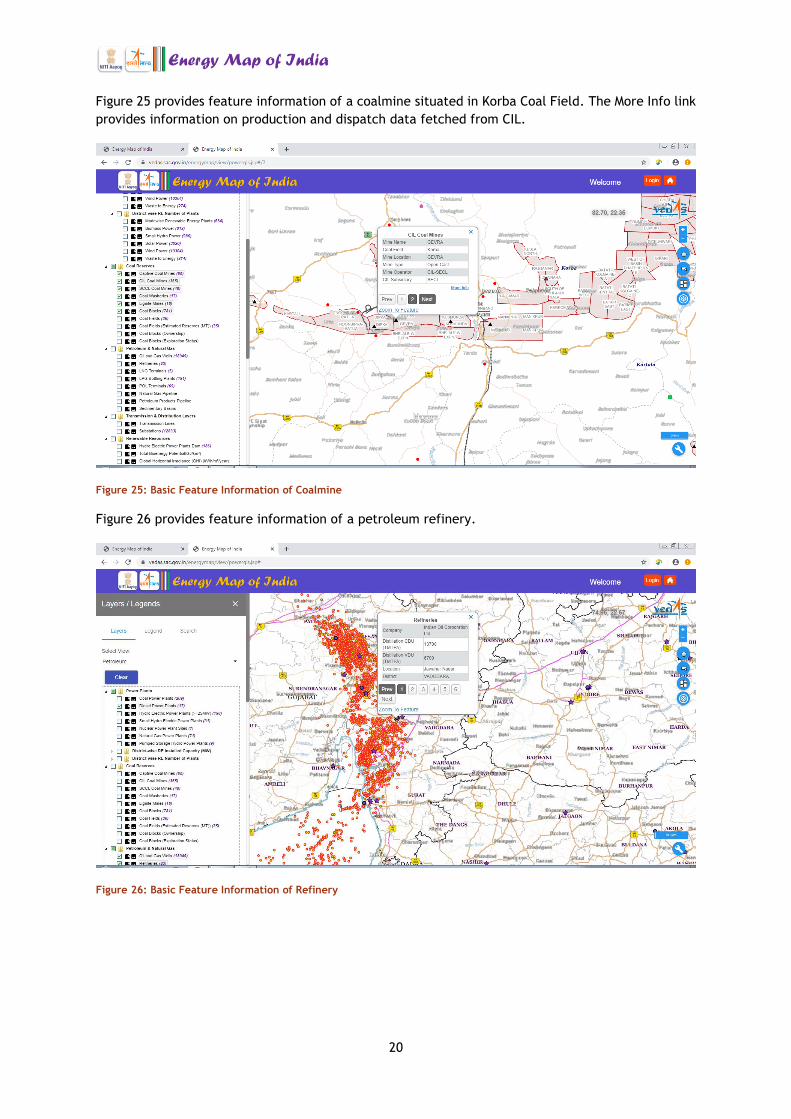
Figure 25 provides feature information of a coalmine situated in Korba Coal Field. The More Info link
provides information on production and dispatch data fetched from CIL.
Figure 25: Basic Feature Information of Coalmine
Figure 26 provides feature information of a petroleum refinery.
Figure 26: Basic Feature Information of Refinery

21
The additional details, such as list of renewable-energy power plants in a given district, coal reserves
of a coal field and historical production/dispatch data of coalmines (if available), can be retrieved
from the hyperlinks to ‘More Info’.
The monthly production and dispatch information of a CIL coalmine for the financial year 2020-21
has been provided as bar chart in figure 27.
Figure 27: Dynamic Information on CIL Coalmine
The new and renewable energy data is organised at district level. The feature information provides
district-level attribute information such as name of district, number of power plants and their total
installed capacity in the district. Figure 28 shows Chitradurga district in Karnataka state has 218 wind
power plants with 630.1 MW installed capacity.
Figure 28: Feature Information of District-wise Wind Power Plants

22
The detailed information on all power plants within a district is provided by hyperlink for more
information in separate window with pagination providing controls for page navigation. Figure 31 lists
all wind power plants in Chitradurga district.
Figure 29: Detailed Feature Information of District-wise Wind Power Plants
Text-keyword based filter has been provided to restrict the results in display. Figure 32 shows the
list of wind power plants in Chitradurga district, while filtering wind power plants in village named
‘Madakeripura’.
Figure 30: Text-keyword Filtering of Wind Power Plants

23
State-wise Search creates as mask of all states other than the selected state, and zooms the map
to the selected state. The list of states is populated in the dropdown list. A report of all energy assets
in the selected state \ zone is also displayed alongside. The query retains visibility status of all other
thematic and reference layers. This type of query will be useful for preparing state-level energy map.
Figure 31 shows geographic distribution of conventional power plants in Maharashtra state.
Figure 31: State Energy Map Query
Zone-wise Search enables similar mask over five major regions covering India, viz. Northern,
North-Eastern, Eastern, Southern & Western. Figure 32 shows the energy map of Western Region.
Figure 32: Zone-wise Energy Data Visualisation

24
ADDITIONAL TOOLS
The energy portal provides a set of additional tools that may be useful in performing various
geographic tasks on the map canvas. The icon ( ) at bottom right side of the map canvas shows (or
hides) these tools as listed in table below.
LIST OF ADDITIONAL TOOLS
Icon Tool
File Upload
Download Drawing Canvas
Draw Polygon
Draw Line
Draw Point
Measure Area
Measure Length
Zoom to Full Extent
Zoom to Box
Show / Hide Grid
The file upload tool enables adding of a KML or GeoJSON file to the map. These files may be created
using any GIS software like QGIS, ArcGIS etc., computer programs like Google Earth, or by GPS
applications, including mobile phone devices. Figure 33 shows the popup window opened for
uploading KML or GeoJSON file, while figure 34 shows the uploaded KML file containing user
information on the energy map. The KML and GeoJSON files are expected to be in geographic
projection with WGS 1984 datum.
Figure 33: Upload KML or GeoJSON Geometry Files

25
Figure 34: Uploaded File on Energy Map
The energy portal provides tools for drawing point, line or polygon features on the map canvas. As
the map uses very high resolution satellite images as base map, drawing tools may be used to create
location maps of proposed infrastructure projects, mapping assets and for marking additional details
on the map. The download tool can be used to subsequently retrieve these added features in KML or
GeoJSON format (figure 38) for further analysis in other GIS software.
Figure 35: Drawing Tools
The tool box also provides navigation tools for zooming to full extent of India and zooming to an area
defined by a user-drawn box. A rectangular graticule grid with a scale-defined spacing interval can
be drawn on map for reference. The measurement tools are provided to enable computation of area
(in square km) and distance (in km) on map canvas.

26


![[Seoul e government] seoul map geospatial information platform](https://img.pdfslide.net/doc/110x75/58776db91a28ab5b568b5269/seoul-e-government-seoul-map-geospatial-information-platform.jpg)

