Embed Size (px)
Citation preview
The City of Winnipeg Appendix ‘B’ Bid Opportunity No. 754-2017 Page 1 of 1
Template Version: C420160226 - RW
APPENDIX ‘B’
TRANSPORT CANADA LETTER 2017-600053 dated August 29, 2017
'C'
'C'GEOTECHNICAL REPORTS
Addendum 1

Quality Engineering | Valued Relationships
August 31, 2017 File No. 0015-021-00 Mr. Andrew Neilson, M.Sc., P.Eng. Morrison Hershfield Ltd. Unit 1 – 59 Scurfield Winnipeg, Manitoba R3Y 1G4 RE RFP No. 180-017 - Promenade Taché Geotechnical Recommendations for Sheet Pile Wall and Lookout Structure Foundations
This letter provides geotechnical recommendations for the structural design of foundations and sheet pile walls for the Promenade Taché sidewalk widening and treetop lookout structure. Morrison Hershfield Ltd. (MHL) was retained by TREK Geotechnical Inc. (TREK) as the structural and civil sub-consultant for the project.
Background and Existing Information
TREK’s understanding of site conditions is based upon site reconnaissance carried out by TREK staff on multiple dates (May to August, 2017), updated instrumentation monitoring by TREK in the summer of 2017, and the results of previous geotechnical investigations and monitoring recently carried out by KGS Group, as well as numerous studies at the site. The following reports form the basis of our understanding:
• St. Boniface Rivertrail Tree Top Lookout and Sidewalk Expansion: Riverbank Condition Assessment and Functional Design Report (KGS Group, Jan. 2016)
• Saint-Boniface Rivertrail: Preliminary Field Investigations, Instrumentation and Monitoring – Summary Geotechnical Report of Findings (KGS Group, Sep 1, 2016)
• Riverbank Stability Assessment Report: De La Cathedrale Outfall (KGS Group, Dec. 2008) • Riverbank Stability Assessment Report: Despins Outfall (KGS Group, Jan. 2008) • Geotechnical Report on Riverbank Stability – Taché Avenue (A. Dean Gould, Nov. 1998) • Geotechnical Investigation: Gate Chamber Replacement: Despins Flood Station (Geokwan
Engineering, Sep. 1989)
Test hole logs from the recent drilling investigation by KGS Group have been provided previously to Morrison Hershfield Ltd.
RFP No. 180-2017 Page 2 of 8 Promenade Taché - Geotechnical Recommendations for Sheet Pile Wall August 31, 2017 and Lookout Structure Foundations
Limit States Design
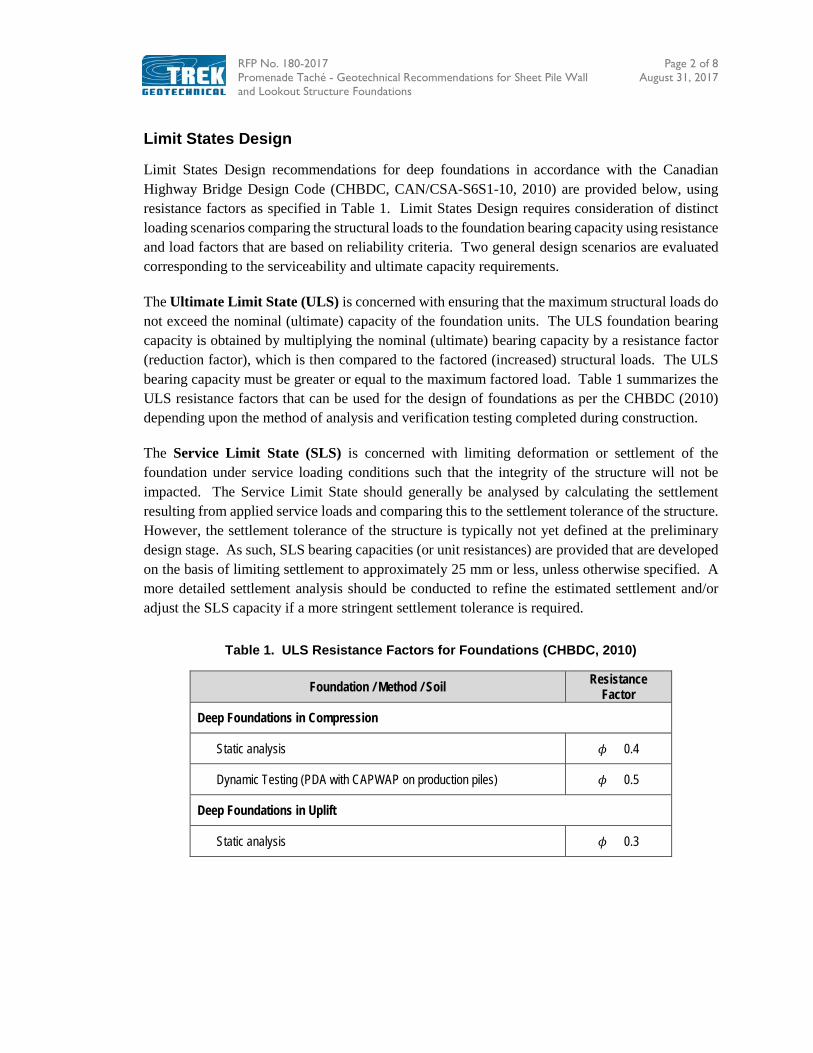
Limit States Design recommendations for deep foundations in accordance with the Canadian Highway Bridge Design Code (CHBDC, CAN/CSA-S6S1-10, 2010) are provided below, using resistance factors as specified in Table 1. Limit States Design requires consideration of distinct loading scenarios comparing the structural loads to the foundation bearing capacity using resistance and load factors that are based on reliability criteria. Two general design scenarios are evaluated corresponding to the serviceability and ultimate capacity requirements.
The Ultimate Limit State (ULS) is concerned with ensuring that the maximum structural loads do not exceed the nominal (ultimate) capacity of the foundation units. The ULS foundation bearing capacity is obtained by multiplying the nominal (ultimate) bearing capacity by a resistance factor (reduction factor), which is then compared to the factored (increased) structural loads. The ULS bearing capacity must be greater or equal to the maximum factored load. Table 1 summarizes the ULS resistance factors that can be used for the design of foundations as per the CHBDC (2010) depending upon the method of analysis and verification testing completed during construction.
The Service Limit State (SLS) is concerned with limiting deformation or settlement of the foundation under service loading conditions such that the integrity of the structure will not be impacted. The Service Limit State should generally be analysed by calculating the settlement resulting from applied service loads and comparing this to the settlement tolerance of the structure. However, the settlement tolerance of the structure is typically not yet defined at the preliminary design stage. As such, SLS bearing capacities (or unit resistances) are provided that are developed on the basis of limiting settlement to approximately 25 mm or less, unless otherwise specified. A more detailed settlement analysis should be conducted to refine the estimated settlement and/or adjust the SLS capacity if a more stringent settlement tolerance is required.
Table 1. ULS Resistance Factors for Foundations (CHBDC, 2010)
Foundation / Method / Soil Resistance Factor
Deep Foundations in Compression
Static analysis 𝜙𝜙 = 0.4
Dynamic Testing (PDA with CAPWAP on production piles) 𝜙𝜙 = 0.5
Deep Foundations in Uplift
Static analysis 𝜙𝜙 = 0.3

RFP No. 180-2017 Page 3 of 8 Promenade Taché - Geotechnical Recommendations for Sheet Pile Wall August 31, 2017 and Lookout Structure Foundations
Lookout Structure Foundations
Cast-in-place end-bearing piles, driven precast concrete piles or driven steel piles are considered to be feasible foundation alternatives for the site, however cast-in-place end-bearing piles are considered most suitable for the single-column pier system proposed for the lookout structure.
End Bearing, Cast-in-Place Concrete Piles
Cast-in-place concrete (CIPC) caissons installed in dense silt till will derive a majority of their resistance in end-bearing with a relatively small contribution from shaft friction. Caissons subjected to frost jacking (exterior piles) and tension loads will derive a majority of their axial-uplift resistance in shaft friction. Table 2 provides the recommended ULS and SLS end bearing and shaft friction (adhesion) resistance values for axial-compressive and axial-tensile (uplift) loading conditions for mechanically-cleaned caissons bearing on dense silt till. The SLS capacity of the caissons is settlement-dependent and is based on a maximum settlement of 25 mm. The elastic shortening of the pile should be added to the tip displacement to calculate the pile head settlement.
Table 2: Unit Resistances for CIPC caissons on Dense Till or Bedrock
Pile Type
ULS End Bearing Resistance (kPa)
ULS Uplift Resistance (kPa) SLS End Bearing
Resistance (kPa)
𝛟𝛟 = 𝟎𝟎.𝟑𝟑 𝛟𝛟 = 𝟎𝟎.𝟒𝟒 Clay Till
CIPC Caissons Note 1 900 10 10 720 Note 1: presence and thickness of competent till is variable, caissons may need to be advanced to sound bedrock
It should be noted that the silt till encountered at the site may soften when exposed to water, which could lead to disturbance of the caisson base and a reduction in capacity. As such, it is critical that water not be permitted to enter the caisson during drilling. Full length sleeves will likely be required to maintain a dry shaft.
Additional Caisson Design Recommendations:
1. The weight of the embedded portion of the pile may be neglected. 2. Shaft adhesion should be neglected within the upper 2.4 m below ground surface for the
calculation of uplift resistance. 3. Caisson bases must be founded on dense silt till. 4. Caissons should have a minimum shaft diameter of 406 mm. 5. Caissons should have a minimum spacing of 2.5 diameters measured centre to centre. If a closer
spacing is required, TREK should be contacted to provide an efficiency (reduction) factor to account for potential group effects.
6. Caissons should be designed by a qualified structural engineer to resist all applied loads induced from the structure as well as tensile forces induced from seasonal movements of the bearing soils.
RFP No. 180-2017 Page 4 of 8 Promenade Taché - Geotechnical Recommendations for Sheet Pile Wall August 31, 2017 and Lookout Structure Foundations
Additional Caisson Installation Recommendations:
1. Caisson bases should be free of debris and any deleterious material. 2. Temporary steel casings (sleeves) should be available and used if sloughing or caving of the
caisson hole occurs and/or to control groundwater seepage if encountered. Care should be taken in removing sleeves to prevent sloughing (necking) of the shaft walls and a reduction in the cross-sectional area of the caisson.
3. Concrete should be placed in one continuous operation immediately after the completion of drilling the shaft to avoid construction problems associated with sloughing or caving of the shaft and groundwater seepage. Concrete should be poured under dry conditions. If groundwater is encountered, it should be controlled and removed. If water cannot be controlled and removed, the concrete should be placed using tremie methods.
4. Concrete placed by free-fall methods should be directed through the middle of the pile shaft and steel reinforcing cage to prevent striking of the drilled shaft walls to protect against soil contamination of the concrete.
5. All piles should be inspected by TREK personnel to verify suitable end-bearing materials, proper base preparation, seepage control and concrete placement.
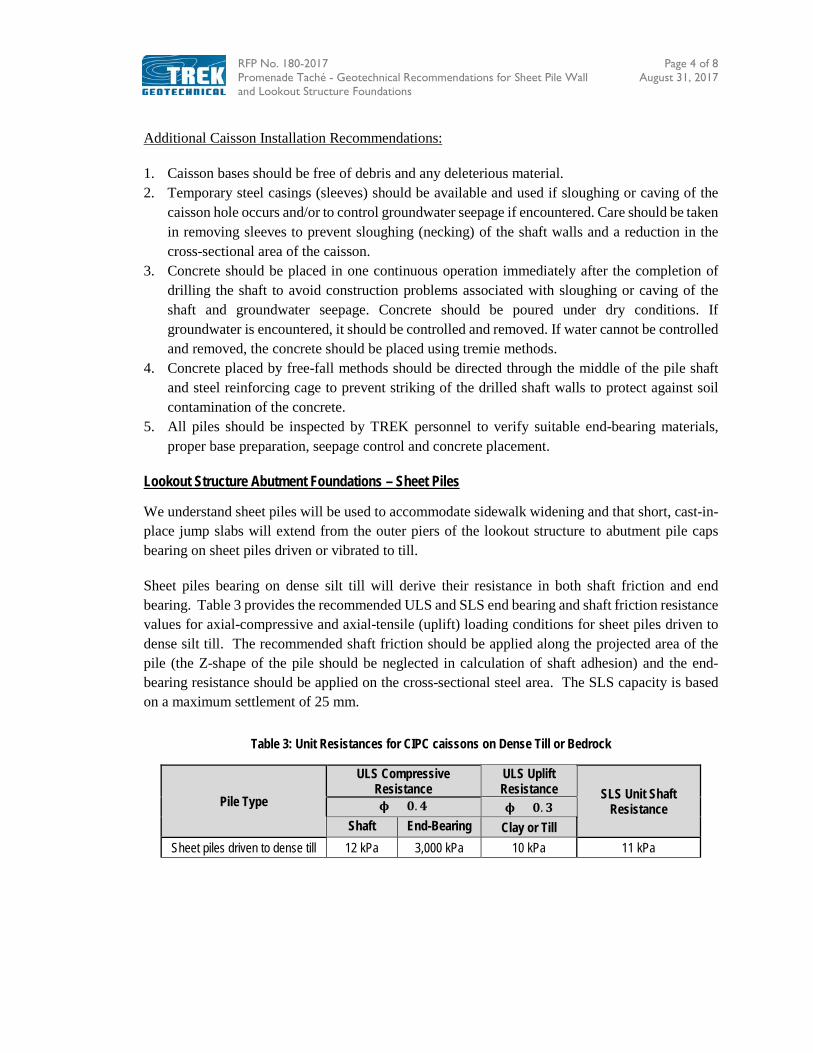
Lookout Structure Abutment Foundations – Sheet Piles
We understand sheet piles will be used to accommodate sidewalk widening and that short, cast-in-place jump slabs will extend from the outer piers of the lookout structure to abutment pile caps bearing on sheet piles driven or vibrated to till.
Sheet piles bearing on dense silt till will derive their resistance in both shaft friction and end bearing. Table 3 provides the recommended ULS and SLS end bearing and shaft friction resistance values for axial-compressive and axial-tensile (uplift) loading conditions for sheet piles driven to dense silt till. The recommended shaft friction should be applied along the projected area of the pile (the Z-shape of the pile should be neglected in calculation of shaft adhesion) and the end-bearing resistance should be applied on the cross-sectional steel area. The SLS capacity is based on a maximum settlement of 25 mm.
Table 3: Unit Resistances for CIPC caissons on Dense Till or Bedrock
Pile Type
ULS Compressive Resistance
ULS Uplift Resistance SLS Unit Shaft
Resistance 𝛟𝛟 = 𝟎𝟎.𝟒𝟒 𝛟𝛟 = 𝟎𝟎.𝟑𝟑 Shaft End-Bearing Clay or Till
Sheet piles driven to dense till 12 kPa 3,000 kPa 10 kPa 11 kPa

RFP No. 180-2017 Page 5 of 8 Promenade Taché - Geotechnical Recommendations for Sheet Pile Wall August 31, 2017 and Lookout Structure Foundations
Additional Sheet Pile Design and Installation Recommendations:
1. The weight of the embedded portion of the pile may be neglected. 2. Shaft adhesion should be neglected within the upper 2.4 m below ground surface for the
calculation of uplift resistance. 3. Sheet piles should be driven to practical refusal on dense silt till, otherwise end-bearing
resistance should be neglected in calculation of axial compressive pile capacity. 4. Sheet pile installation should be inspected by TREK staff to verify proper pile installation.
Lateral Pile Analysis
The soil response (subgrade reaction) to lateral loads can be modeled in a simplified manner that assumes the soil around a pile can be simulated by a series of horizontal springs for the preliminary design of pile foundations. The soil behaviour can be estimated using an equivalent spring constant referred to as the lateral subgrade reaction modulus (ks). Table 4 provides the recommended subgrade reaction modulus for the lateral load analysis. The majority of lateral resistance will typically be offered by the upper 5 to 10 m of soil, depending on the relative stiffness of the pile and soil materials. Any voids surrounding the pile due to temporary or permanent casings should be infilled using lean-mix concrete or grout to provide proper contact with the surrounding soil.
Table 4. Recommended Values for Lateral Sub-grade Reaction Modulus (Ks)
Soil Approximate
Elevation (m)
Ks (kN/m3)
Clayey Sand with GravelNote 2 224.6 to 221.7 1,300*Z/dNote 3 Silty Clay and Clay Fill (Stiff) Grade to 219.0 3,400/d
Silty Clay (Soft to Firm) 219.0 to 216.0 1,700/d Till < 216.0 20,000/d to 50,000/dNote 1
Note 1: ks variable due to natural heterogeneity of till, laboratory testing, and soil description. Note 2: Clayey sand and gravel layer only present in TH14-02. Note 3: ks depends on the layer depth below grade.
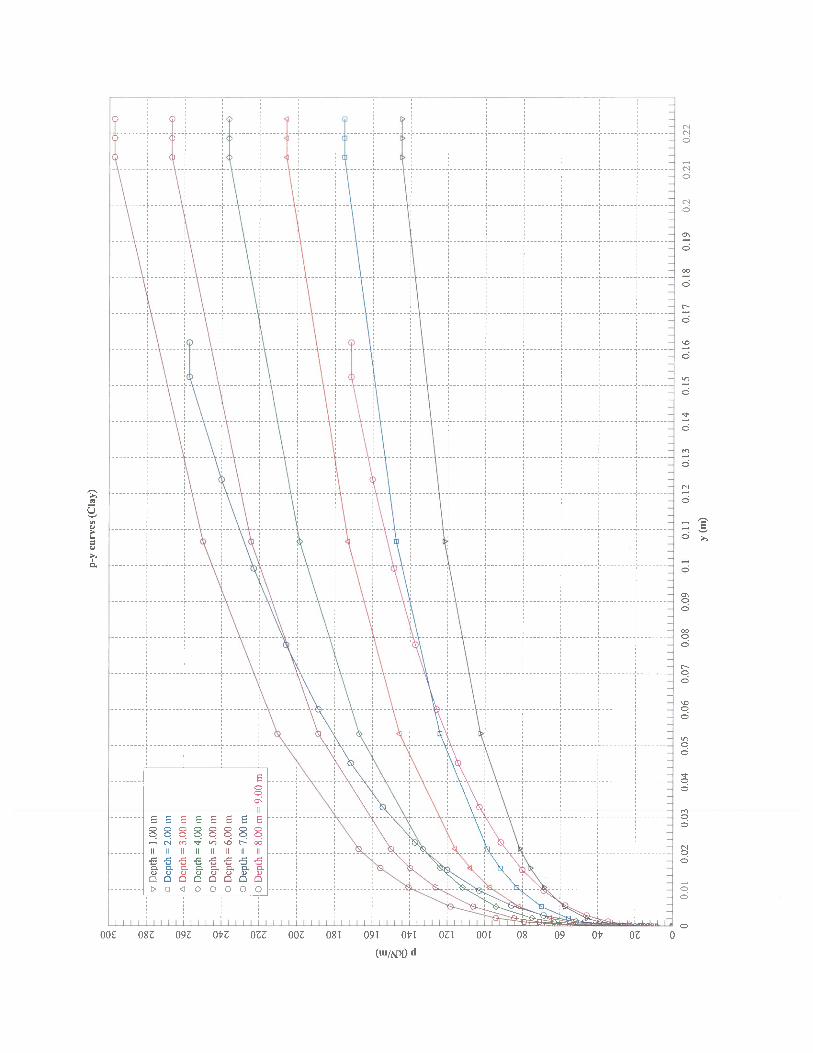
As part of detailed design, a more rigorous lateral pile analysis that incorporates the material and section properties of the pile, applied loads, final lateral deflection criteria and a more realistic elastic-plastic model of the soil response to loading should be carried out by to confirm the lateral load capacity of the piles. Elastic-plastic spring models (p-y curves) for pile increments were provide to MHL in both graphical and digitized format; the graphical p-y curves are attached. The piles can be represented in the structural analysis model using linear springs and varying spring stiffness values along the pile shaft. The stiffness values should be varied in an iterative procedure such that the calculated spring forces and deflections match the p-y curves provided for each pile segment. Once a reasonable match has been obtained, the pile head conditions (force and moments) should be provided to TREK to confirm pile deflection, shear and bending moment distributions using an L-pile model and p-y curves.

RFP No. 180-2017 Page 6 of 8 Promenade Taché - Geotechnical Recommendations for Sheet Pile Wall August 31, 2017 and Lookout Structure Foundations
Cantilevered Walls
Rankine Earth Pressure Parameters
A permanent cantilevered sheet pile wall is proposed to accommodate the sidewalk widening from Rue Despins to the Taché Dock. Table 5 provides the recommended earth pressure coefficients and bulk unit weights of each soil layer for calculation of lateral earth pressures. Surcharge loads and hydrostatic water pressure below the groundwater table should be incorporated into the design of cantilevered walls, as well as an adequate factor of safety against instability. Figure 1 shows the recommended earth pressure diagram for preliminary design of the sheet pile wall. The surcharge pressure should be selected by the structural engineer for any sustained loads.
An active earth pressure coefficient (Ka) should be used to calculate lateral loads against sheet pile walls which are free to translate horizontally away from the retained soil by more than 0.2% of the wall height. A passive earth pressure coefficient (Kp) should be used if the wall is free to translate horizontally towards the retained soil by more than 2% of the wall height. An at-rest earth pressure coefficient (Ko) should be used if the walls undergo less than 2% movement of the wall height towards the retained soil and less than 0.2% of the wall height away from the retained soil. The table below provides Ka, Kp, and Ko values for calculation of lateral earth pressures acting on below grade walls.
Table 5. Recommended Design Parameters for Cantilevered Walls
Design Parameter Granular Fill (Note 1) Silty Clay
Clayey Sand with Gravel
(Note 2) Till
Active Earth Pressure Coefficient (Ka) 0.3 0.5 0.3 0.3
Passive Earth Pressure Coefficient (Kp) 3.7 2.0 3.0 3.7
At-Rest Earth Pressure Coefficient (Ko) 0.4 0.7 0.5 0.4
Bulk Unit Weight, Ƴ (kN/m³) 21.0 17.5 18.0 21.0 Effective Unit Weight, Ƴ'
(kN/m³) 11.2 7.7 8.2 11.2
Finite Element Analysis of Sheet Pile Walls
Following preliminary analysis by MHL based on the earth pressure parameters provided in Table 5, it was determined that excessive sheet pile lengths were required to resolve the force and moment equilibrium calculations (global stability) based on the analytical method selected. The Rankine analysis provides an overly conservative pressure distribution on both the active and passive sides of the sheet piles due to simplifying assumptions of wall deflections that may not accurately represent the deflected wall shape.

RFP No. 180-2017 Page 7 of 8 Promenade Taché - Geotechnical Recommendations for Sheet Pile Wall August 31, 2017 and Lookout Structure Foundations
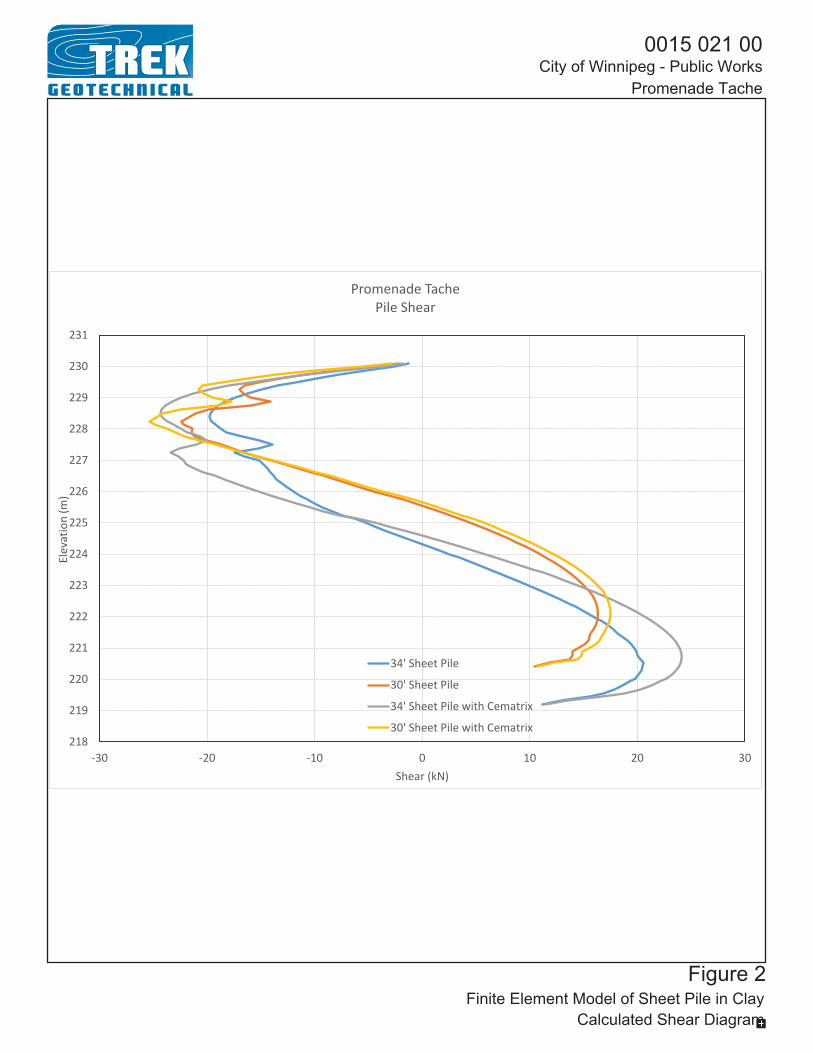
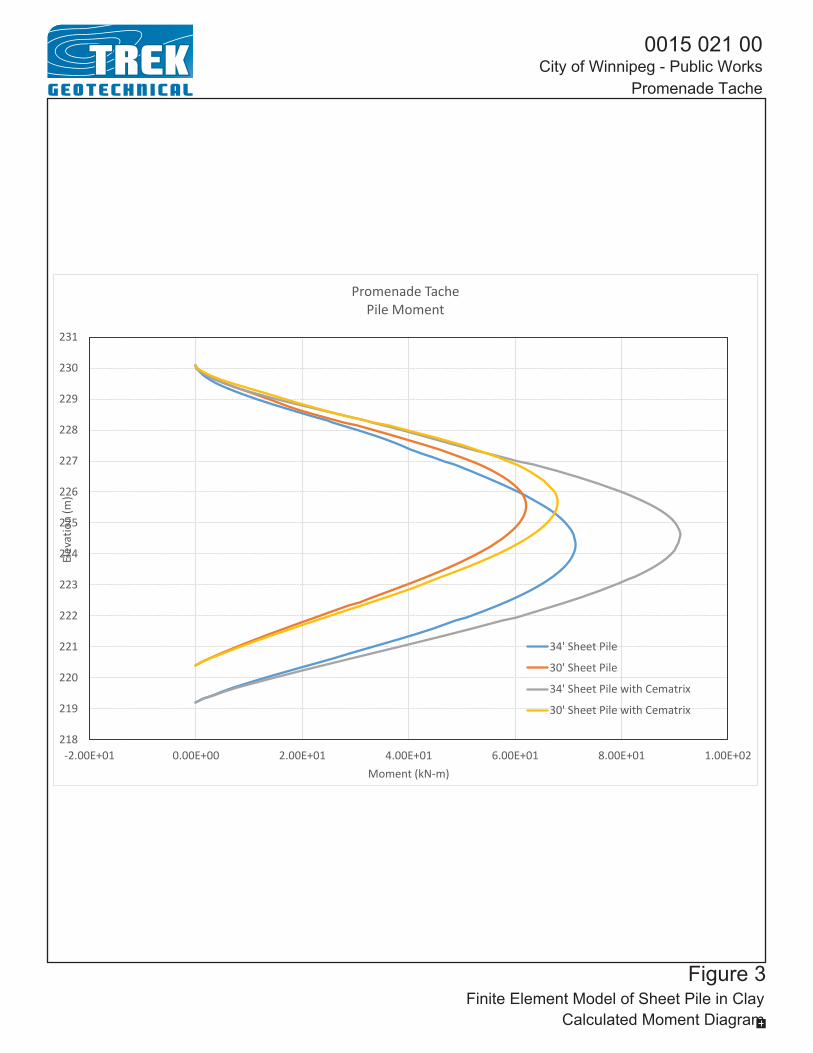
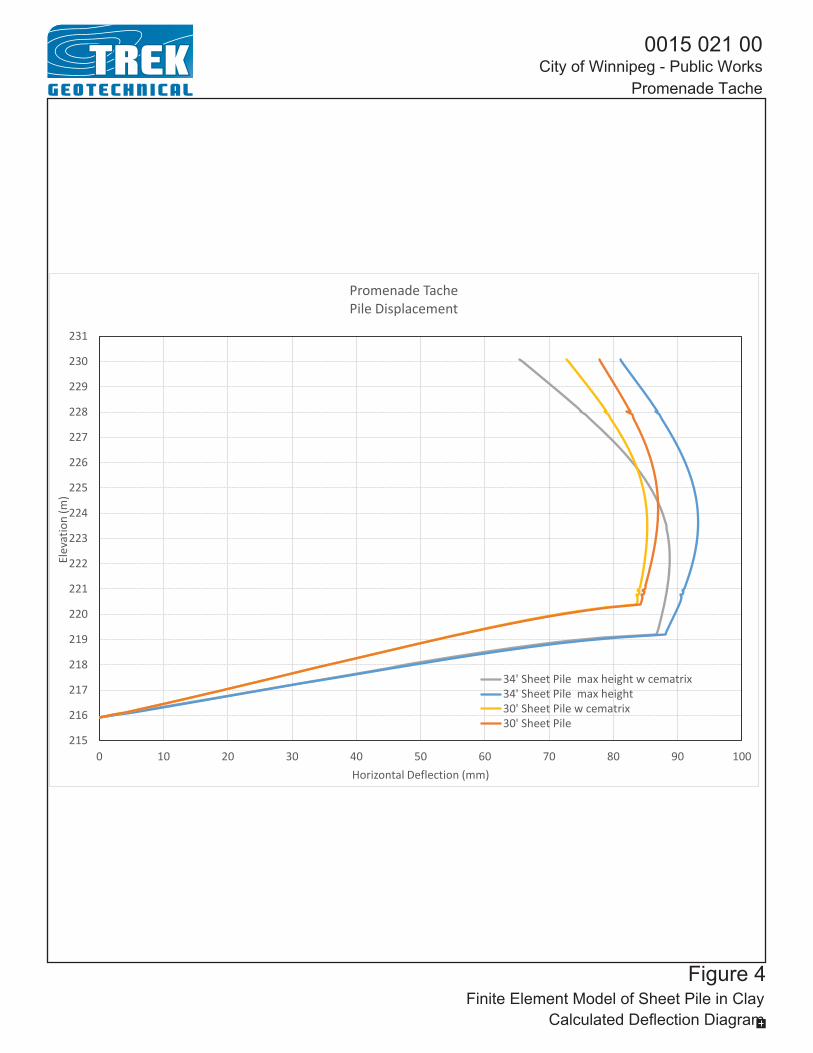
A finite element model was developed by TREK to provide a more realistic representation of the constitutive behaviour of the soil, in order to better evaluate the mechanism of global stability. The wall was represented as structural beam elements within a continuum of elastic-plastic soil elements and the deflected shape, shear and moment were calculated by applying the soil unit weight and surface surcharge load (5 kPa) in one time step, representing the upper bound condition whereby the entire slope undergoes movement. The shear, moment and deflection plots are shown in Figures 2 to 4, respectively. A 10.4 m sheet pile was analysed with the maximum cantilever height of 2.4 m, and a 9.1 m long sheet pile was analysed with a cantilever height of 1.3 m. As shown in the figures, the shear force distribution shows a reversal towards zero near the pile tip and the deflected wall shape also shows restraint at the toe, which is considered an indication that global stability of the wall is satisfied. A 1.5 m thick layer of cellular concrete was also incorporated into the model and resulted in reduced top of pile deflections.
The results of the analysis are generally considered qualitative, and the maximum values of shear, moment and deflection should not be used for structural design purposes.
On the basis of the finite element analysis results, the sheet pile embedment should be calculated as follows:
1. Sheet pile lengths should allow for up to 0.5 m of cut-off that may be required due to the irregularity of sheet pile embedment that will occur during construction. We have assumed based on existing corbel details that the sheet pile cutoff is 0.5 m below the upslope grade. Therefore, the depth of embedment can be taken as the sheet pile supply length, minus the cantilever height.
2. A minimum pile embedment of 8.5 m is required for global stability of the maximum cantilever of 2.4 m. Therefore, a minimum sheet pile length of 10.9 m (36 ft) is required in this zone. We anticipate 12.2 m (40 ft) long sheet piles will be used in this area.
3. A minimum pile embedment of 4.0 times the cantilever height should be used elsewhere. The following maximum cantilever heights can be used for standard 10-ft increments of supplied pile length:
• 30 ft (9.1 m) length – 1.8 m maximum cantilever height • 20 ft (6.1 m) length – 1.2 m maximum cantilever height • 10 ft (3.0 m) length – 0.6 m maximum cantilever height

NOTES:
1. WALL DRAINAGE TO BE PROVIDED TO BASE OF EXPOSED WALL / FREE DRAINING BACKFILL.
2. ɣ'
c
= 7.7 kN/m
3
3. ɣ
g
= 21 kN/m
3
4. k
a,c
= 0.5
5. k
a,g
= 0.3
6. k
p,c
= 2.0
7. q
s
= SURCHARGE TO BE SELECTED BY WALL DESIGNER.
Z:\P
ro
je
cts\0
01
5 C
ity o
f W
in
nip
eg
\0
01
5 0
21
0
0 P
ro
me
na
de
T
ach
e\3
S
urve
y a
nd
D
wg
\3
.4
C
AD
\3
.4
.3
W
orkin
g F
old
er\D
D\F
IG
0
01
2
01
7-0
7-1
5 L
ate
ra
l E
arth
P
re
ssu
re
D
istrib
utio
n 0
_A
_B
T 0
01
5 0
21
0
0.d
wg
, 7
/2
5/2
01
7 1
1:4
1:4
4 A
M
Lateral Earth Pressure Distribution
0015 021 00
City of Winnipeg
Promenade Tache
Lateral Retaining Wall
SURCHARGE, q
s
FR
EE
D
RA
IN
IN
G
GR
AN
UL
AR
F
IL
L
CL
AY
k
a,c
ɣ'
c
d
2
d
2
d
1
k
a,c
ɣ
g
d
1
k
p,c
ɣ'
c
d
2
k
a,c
q
s
k
a,g
q
s
k
p,c
ɣ'
c
BASE OF EXPOSED WALL
CANTILEVER
RETAINING WALL
BOTTOM OF PILE
ACTIVE EARTH
PRESSURE
PASSIVE EARTH
PRESSURE
TOP OF RETAINING WALL
k
a,c
ɣ'
c
k
a,g
ɣ
g
k
a,g
ɣ
g
d
1
Figure 01
0015 021 00City of Winnipeg - Public Works
Promenade Tache
218
219
220
221
222
223
224
225
226
227
228
229
230
231
-30 -20 -10 0 10 20 30
Elev
atio
n (m
)
Shear (kN)
Promenade TachePile Shear
34' Sheet Pile
30' Sheet Pile
34' Sheet Pile with Cematrix
30' Sheet Pile with Cematrix
Figure 2Finite Element Model of Sheet Pile in Clay
Calculated Shear Diagram
0015 021 00City of Winnipeg - Public Works
Promenade Tache
218
219
220
221
222
223
224
225
226
227
228
229
230
231
-2.00E+01 0.00E+00 2.00E+01 4.00E+01 6.00E+01 8.00E+01 1.00E+02
Elev
atio
n (m
)
Moment (kN-m)
Promenade TachePile Moment
34' Sheet Pile
30' Sheet Pile
34' Sheet Pile with Cematrix
30' Sheet Pile with Cematrix
Figure 3Finite Element Model of Sheet Pile in Clay
Calculated Moment Diagram
0015 021 00City of Winnipeg - Public Works
Promenade Tache
215
216
217
218
219
220
221
222
223
224
225
226
227
228
229
230
231
0 10 20 30 40 50 60 70 80 90 100
Elev
atio
n (m
)
Horizontal Deflection (mm)
Promenade TachePile Displacement
34' Sheet Pile max height w cematrix34' Sheet Pile max height30' Sheet Pile w cematrix30' Sheet Pile
Figure 4Finite Element Model of Sheet Pile in Clay
Calculated Deflection Diagram


Quality Engineering | Valued Relationships
www.trekgeotechnical.ca 1712 St. James Street | Winnipeg, Manitoba R3H 0L3 | Tel 1.204.975.9433 | Fax 1.204.975.9435
October 25, 2017 File No. 0015-021-00 Mr. Cam Ward P.Eng. Bridge Projects Engineer Engineering Division, Public Works Department City of Winnipeg 106-1155 Pacific Ave. Winnipeg, MB R3E 3P1
RE Bid Opp. 754-2017: Promenade Taché – Final Riverbank Stability Report
This letter report provides a summary of riverbank stability analysis of permanent works conducted as part of the Promenade Taché project. TREK Geotechnical (TREK) was retained by the City of Winnipeg (City) for Detailed Design of riverbank development along Avenue Taché, including riverbank stabilization, erosion protection, a Treetop Lookout structure, sidewalk widening with a sheet-pile wall and an off-street mid-bank pathway to be constructed between the cross-streets of Provencher Blvd. and Rue Despins.
TREK previously submitted a Functional Design confirmation report, which included riverbank stability analysis of existing conditions and proposed works. A summary of existing information and historical reports utilized in our assessment is provided in this previous report.
The current report summarizes the results of updated slope stability analysis for existing conditions and stabilization works based on the Issued for Tender drawings (included separately with this letter), in support of a Waterways Permit application for the project.
Slope Stability Analysis
Slope stability analysis was conducted to evaluate the existing stability of the riverbank and to design stabilization works. Sections A, B, C and D are shown in plan on Figure 01 along with a general layout of the site and proposed works. Sections A, B and C are consistent with the typical cross-sections shown on the IFT Drawings; Section A coincides with the Treetop Lookout structure, Section B is located upstream of the Taché Dock and Section C is located upstream of Esplanade Riel pedestrian bridge. Section D is located coincident with the maximum proposed pathway fill near the Ave. de la Cathedrale outfall. The section locations have been revised from those used for previous stability reports during the FD (by KGS) and the FD Confirmation stage of the current assignment to better coincide with the planned works.
Numerical Model Description
The stability analysis was conducted using a limit-equilibrium slope stability model (Slope/W) from the GeoStudio 2016 software package (Geo-Slope International Inc.). The slope stability model used the Morgenstern-Price method of slices with a half-sine interslice force function to calculate factors of safety. Critical local and global slip surfaces were determined using a grid and

RFP NO. 180-2017 – Promenade Taché Page 2 of 16 Final Riverbank Stability Report – Permanent October 25, 2017
Z:\Projects\0015 City of Winnipeg\0015 021 00 Promenade Tache\4 Docs\4.4 Deliverables\3 - Final Riverbank Stability Report\LTR 2017-10-25 Final Riverbank Stability Report 0_FINAL_MVH 0015-021-00.docx
radius slip surface method. Static piezometric lines were used to represent groundwater conditions, and therefore downward seepage gradients that exist along global slip surfaces were neglected in the analysis.
Material Properties
The soil units used in the model include lacustrine clay and till, as well as materials used for proposed works such as granular fill, rockfill column backfill and rock riprap. The till layer was included in the stability models with the clay-till interface situated at the average elevation found in test holes along each cross-section.
Table 1 lists the soil properties used for the soil units in the stability modeling. The lacustrine clay was divided into discrete zones reflective of varying degrees of strain weakening due to observed movements. A zone of lower strength (strain weakened) was assumed down-slope of previous failure scarps, generally consistent with the zones assumed by KGS. The properties of the down-slope zone were back-analysed along each cross-section to obtain a factor of safety of approximately unity (FS ± 1.0) for a slip surface coinciding with observed differential shear displacements (prior to any stabilization works). However, given that existing rockfill columns along Section A have improved the level of stability and the analysis of Section A assumed a factor of safety between 1.1 and 1.2 as being representative of existing conditions and the associated (reduced) displacement rates. Back-analysed strength parameters along all cross-sections were consistent with the KGS report (c’=3.5 kPa, ϕ’=12°). However, a lower strength zone above till along Section A was required to achieve a reasonable factor of safety for existing conditions. The back-analysis strength parameters are within the range of residual strength parameters for Winnipeg clays.
A constant-volume (large-strain) friction angle of ϕ’=35° representative of loose rockfill was applied to the existing rockfill columns along Section A, given that the rockfill was not compacted, uncertainty in the quality of the till socket achieved, and since the columns have likely undergone significant shear movements. A small-strain friction angle of ϕ’=50° representative of dense rockfill was applied to proposed rockfill columns, which will require a socket into dense till. It should be noted that auger refusal was reached with shallow embedment into till in the test holes and may occur during rock column installation. We anticipate that the design friction angle can be achieved with minimal socket into dense till, provided the base is in full contact with dense till and adequately machine cleaned.
Groundwater Conditions and Design Criteria
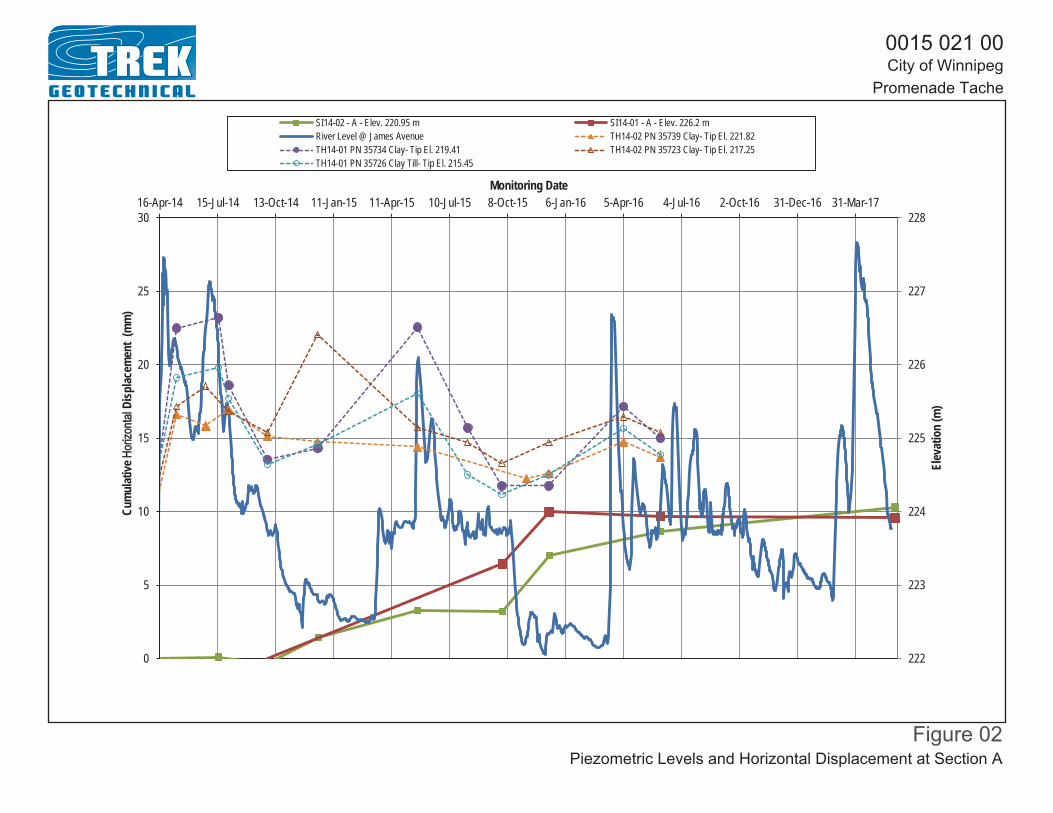
Figures 02 and 03 compare cumulative horizontal ground displacements (slope movement) with piezometric levels along Sections A and B respectively, dating back to 2014. The results indicate a majority of observed slope movement coincided with fall drawdown of the river (although some sections had insufficient monitoring frequency to confirm this observation). Historical reports confirm that a majority of movement at this location typically follows the fall drawdown event, with smaller movements occurring occasionally following spring flood events. As such, the back-analysis assumed piezometric levels within the bank in agreement with those observed immediately
RFP NO. 180-2017 – Promenade Taché Page 3 of 16 Final Riverbank Stability Report – Permanent October 25, 2017
Z:\Projects\0015 City of Winnipeg\0015 021 00 Promenade Tache\4 Docs\4.4 Deliverables\3 - Final Riverbank Stability Report\LTR 2017-10-25 Final Riverbank Stability Report 0_FINAL_MVH 0015-021-00.docx
prior to fall drawdown with the river at the unregulated winter river level (UWRL). Table 02 summarizes the range of piezometric levels observed in piezometers, as well as those assumed in the back-analysis and critical design cases for comparison.
Piezometric conditions for stability analysis consisted of either “short-term extreme” (elevated groundwater level and an unregulated winter river level (UWRL of 222.0 m ±) or “normal” consisting of typical summer groundwater conditions and a regulated summer river level (RSRL) of 223.7 m. For Sections B and C, the groundwater levels assumed for the “short-term extreme” cases were increased from back-analysis levels to account for possible escalation of levels within the design life of the proposed work. However, along Section A, the back-analysed levels were higher than the highest on record and therefore were assumed to be applicable to the short-term extreme case.
Stabilization works were designed based on a target factor of safety of 1.30 under short-term extreme conditions and 1.50 under normal conditions, for global slip surfaces that impact structures (e.g. Treetop Lookout Structure, Taché Avenue roadway). The same targets have also been applied to riverbank pathways, although a reduced factor of safety in these areas may be acceptable if justified from a cost-benefit perspective. The design targets are assumed to apply for global slip surfaces initiating within the upper and mid bank areas, exiting below the toe of slope. Smaller, localized slip surfaces with calculated factors of safety that do not meet the stability targets have been dismissed or designed to achieve an acceptable relative improvement over back-analysed conditions.
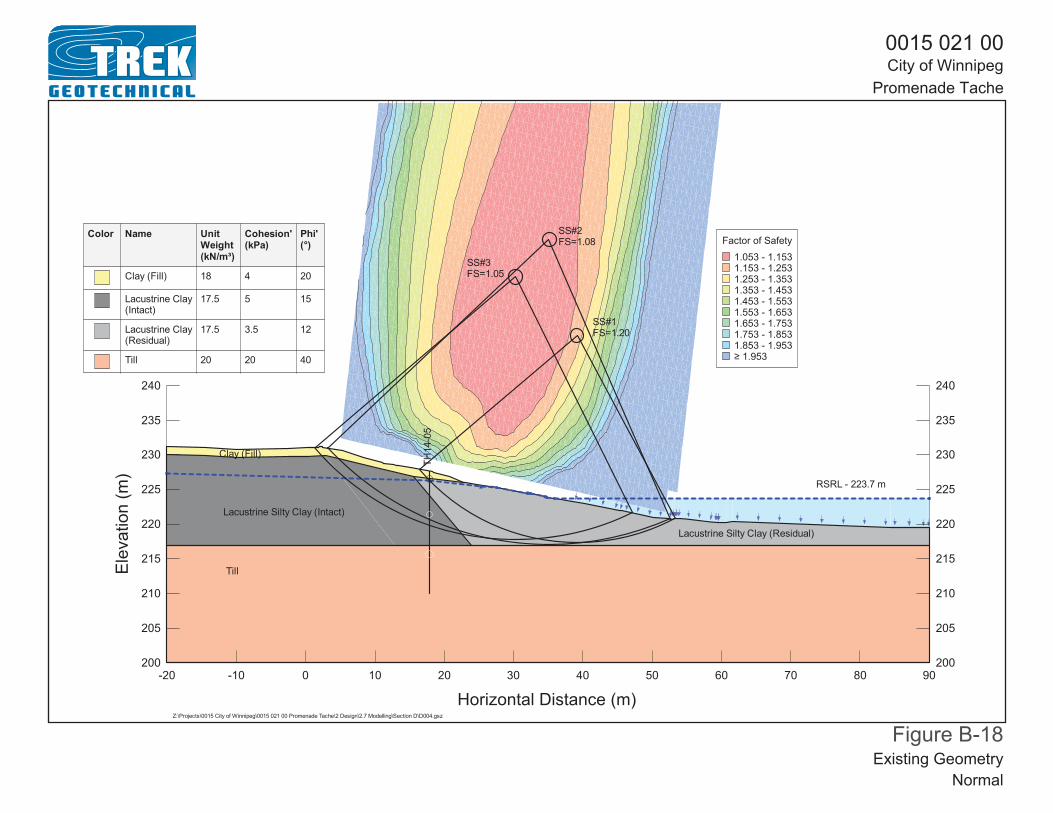
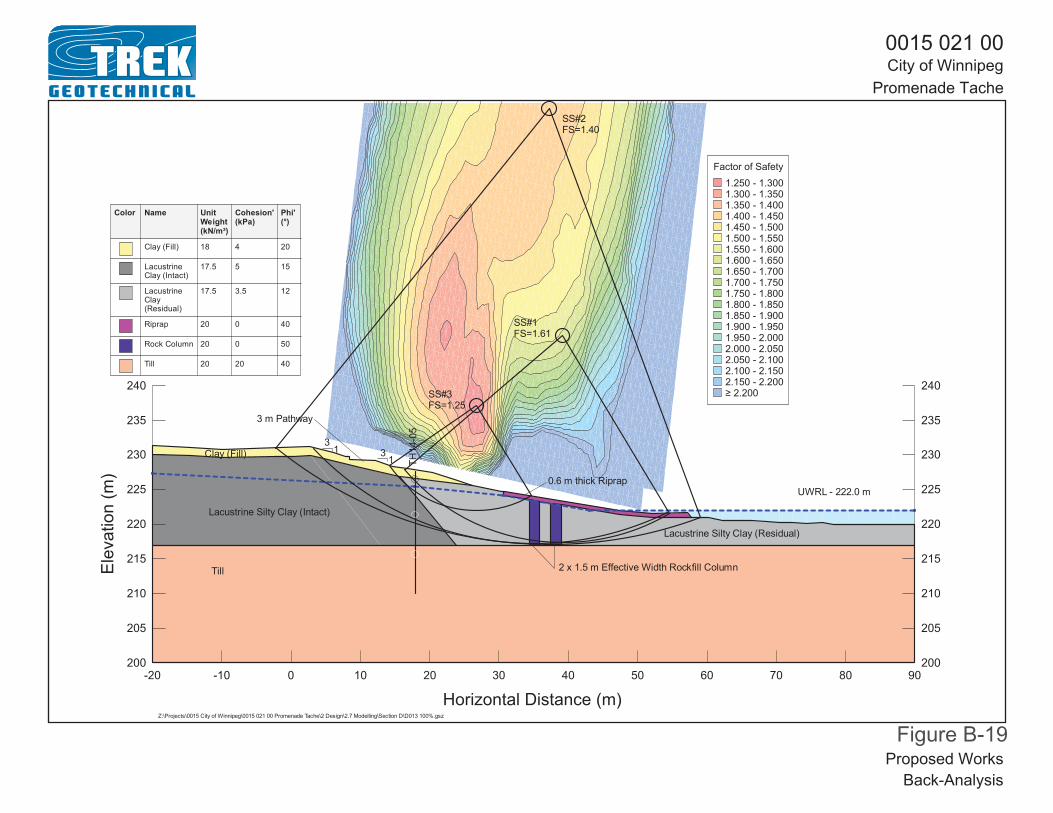
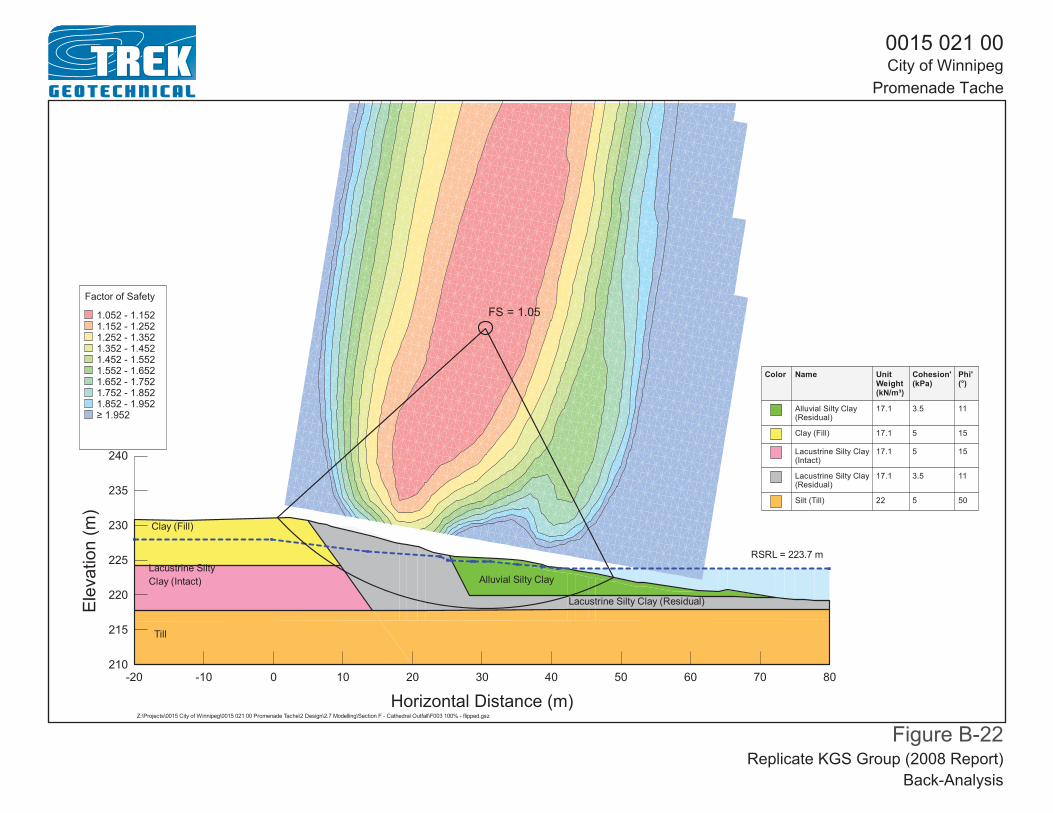
Along Section D, coincident with the Ave. de la Cathedrale outfall, the analysis focused only on evaluating the relative impact to stability from the proposed pathway fill, and to confirm that an acceptable level of stability (associated with existing stabilization works) is maintained. As such, the analysis of existing conditions was intended to replicate the analysis summarized by KGS Group in their stabilization report for the outfall (2008) and the relative change in factor of safety due to fill placement was evaluated.
Stability Modeling Results
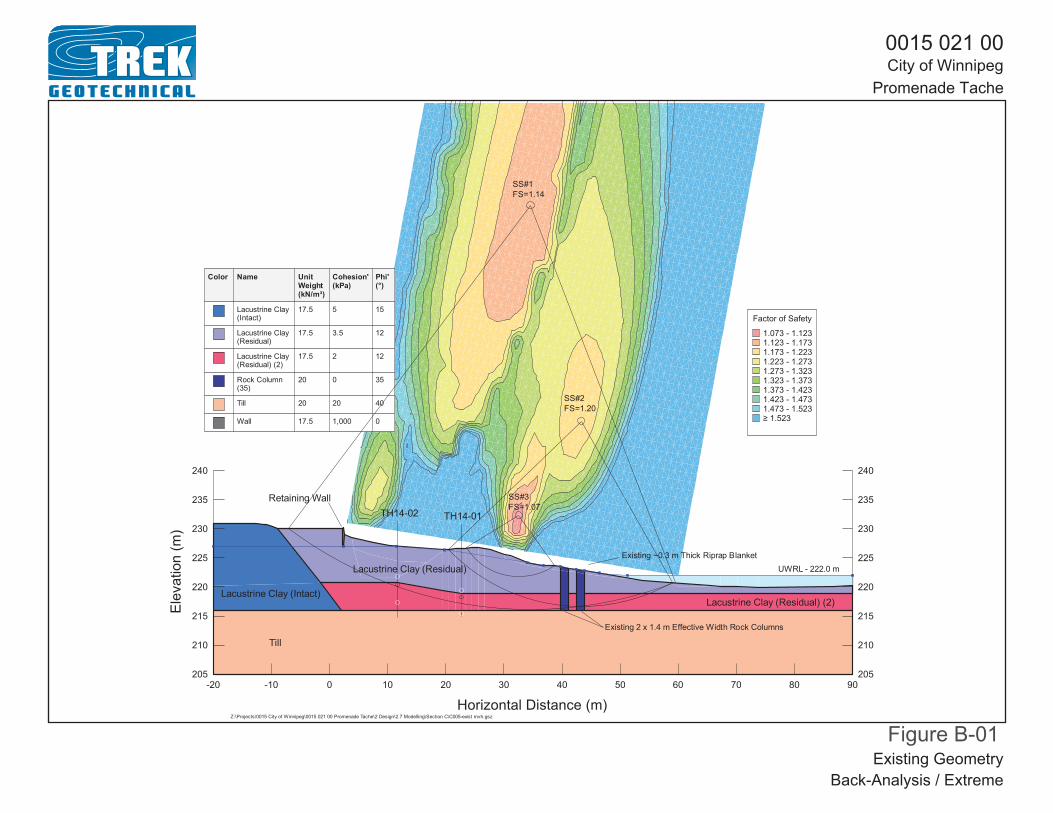
Tables 3 to 6 summarize the stability modeling cases and associated factors of safety calculated using the numerical model for Sections A to D. Figures showing the stability analysis results for each case have been included in Appendix A, as referenced in the tables. A detailed summary of the analysis cases and results in provided below.
Back Analysis / Existing Conditions
The back-analysis of Sections B and C resulted in factors of safety (FS) between 0.97 and 1.02 for slip surfaces in the mid and upper-bank areas, including SS#1 which is considered representative of the observed movements which occurred in the mid-bank areas along these two sections. Along Section A, the observed global upper-bank movement had a FS of 1.14 and closely matched the observed zones of differential shear displacement in the slope inclinometers; the mid-bank slip
RFP NO. 180-2017 – Promenade Taché Page 4 of 16 Final Riverbank Stability Report – Permanent October 25, 2017
Z:\Projects\0015 City of Winnipeg\0015 021 00 Promenade Tache\4 Docs\4.4 Deliverables\3 - Final Riverbank Stability Report\LTR 2017-10-25 Final Riverbank Stability Report 0_FINAL_MVH 0015-021-00.docx
surface had a FS of 1.20 and a localized lower-bank slip surface had a FS of 1.07. The results are considered representative of movements that have occurred along Sections B and C (rates in the order of 25 mm per year or more) and movements along Section A (rates in the order of 7 mm per year or less).
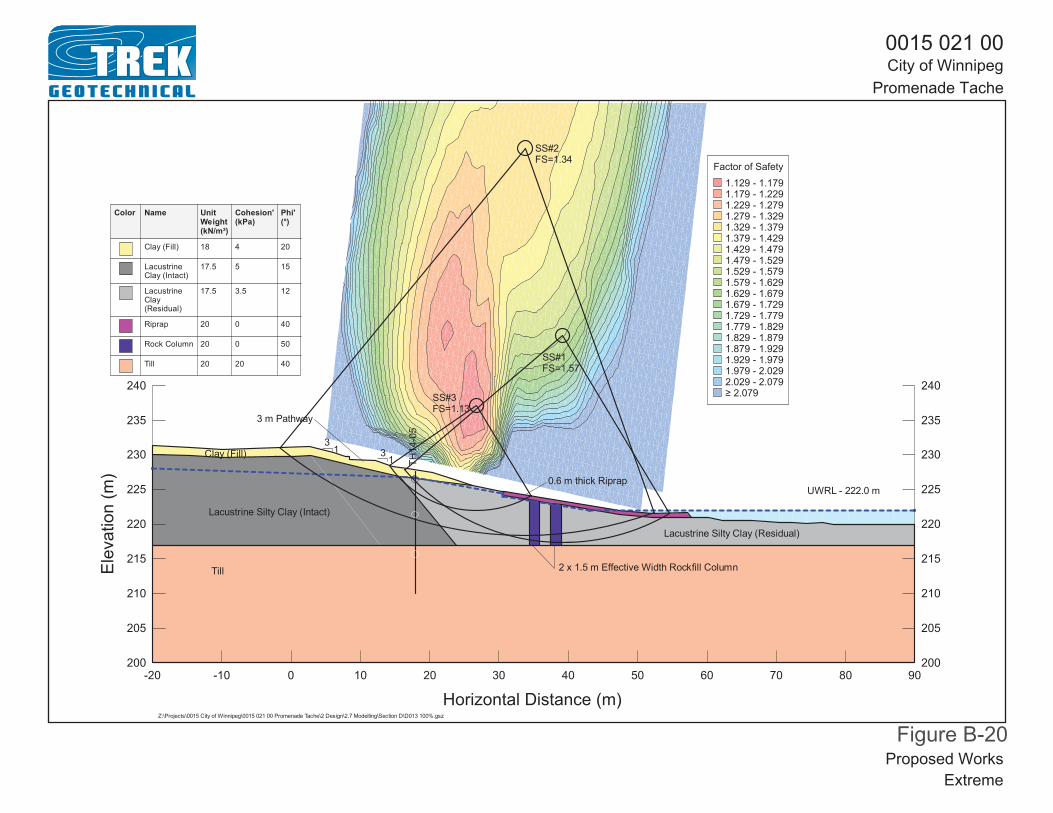
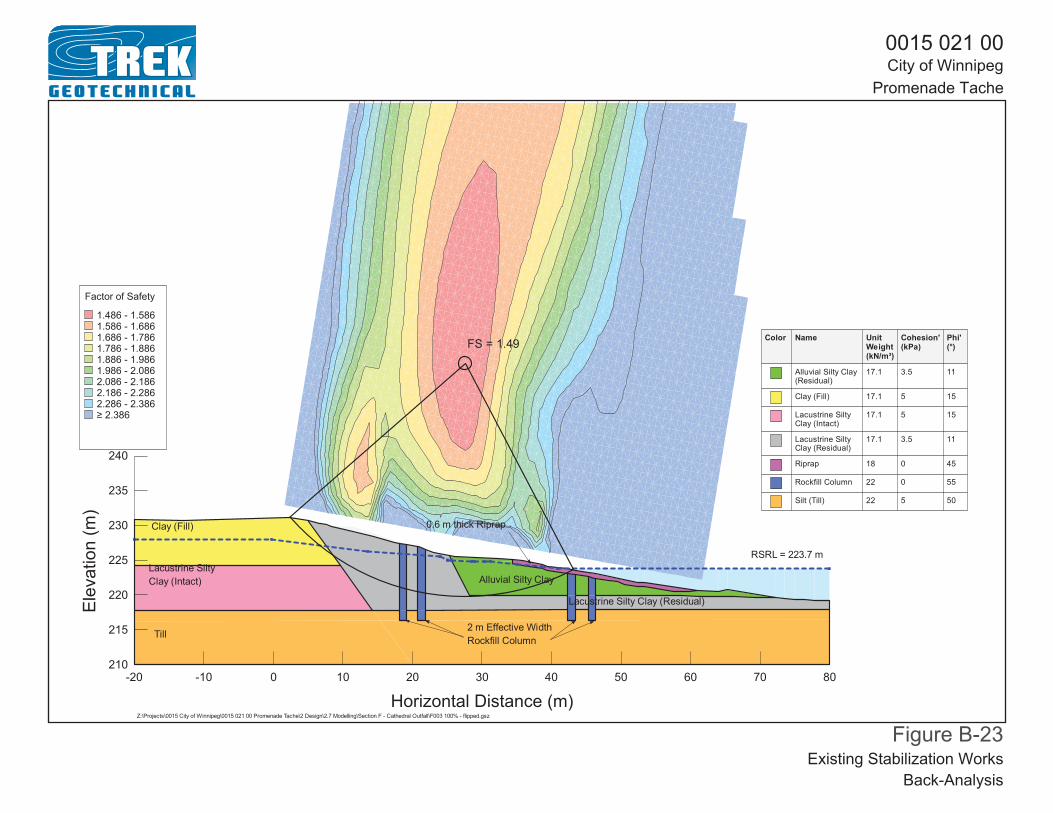
At Section D (Cathedrale Outfall), the existing slope geometry was modeled with assumptions consistent with KGS Group’s previous back-analysis and stabilization design included in their 2008 report for the outfall. The calculated factor of safety for the critical global slip surface is 1.05. The existing stabilization works at this location consist of two 2 m effective-width rockfill column shear keys, in the mid-bank and lower bank areas. The calculated factor of safety for the critical global slip surface is 1.63 (55% improvement) with existing stabilization works.
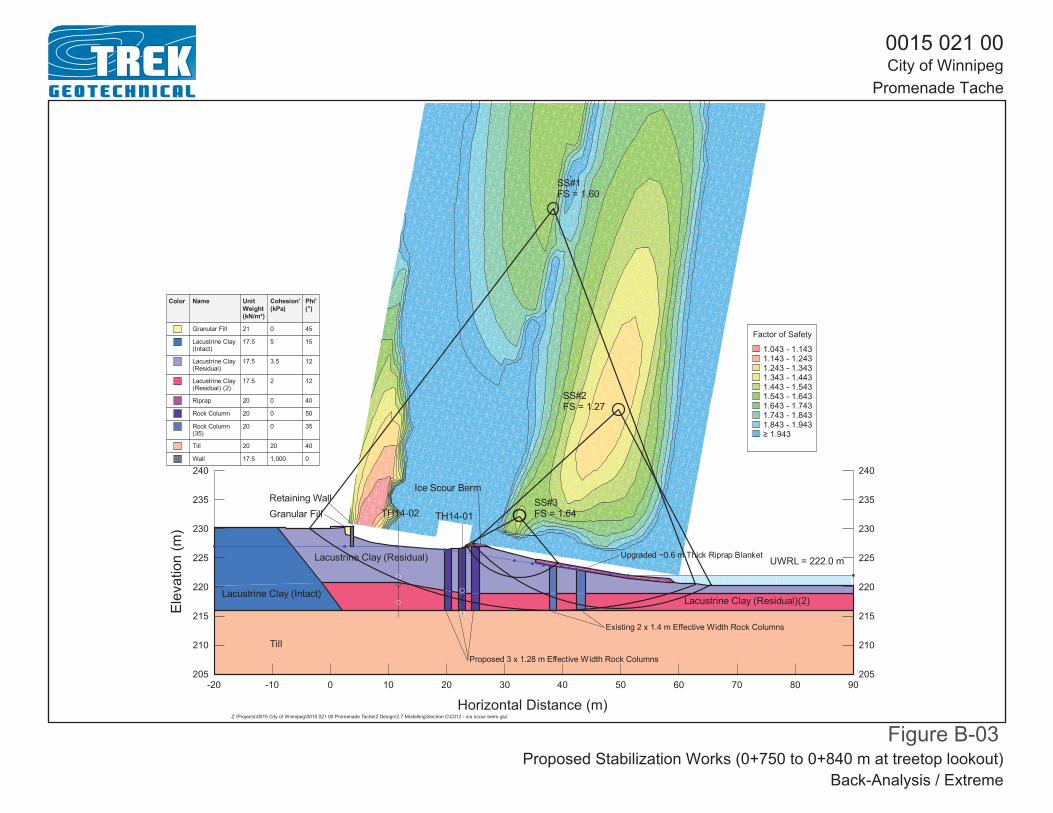
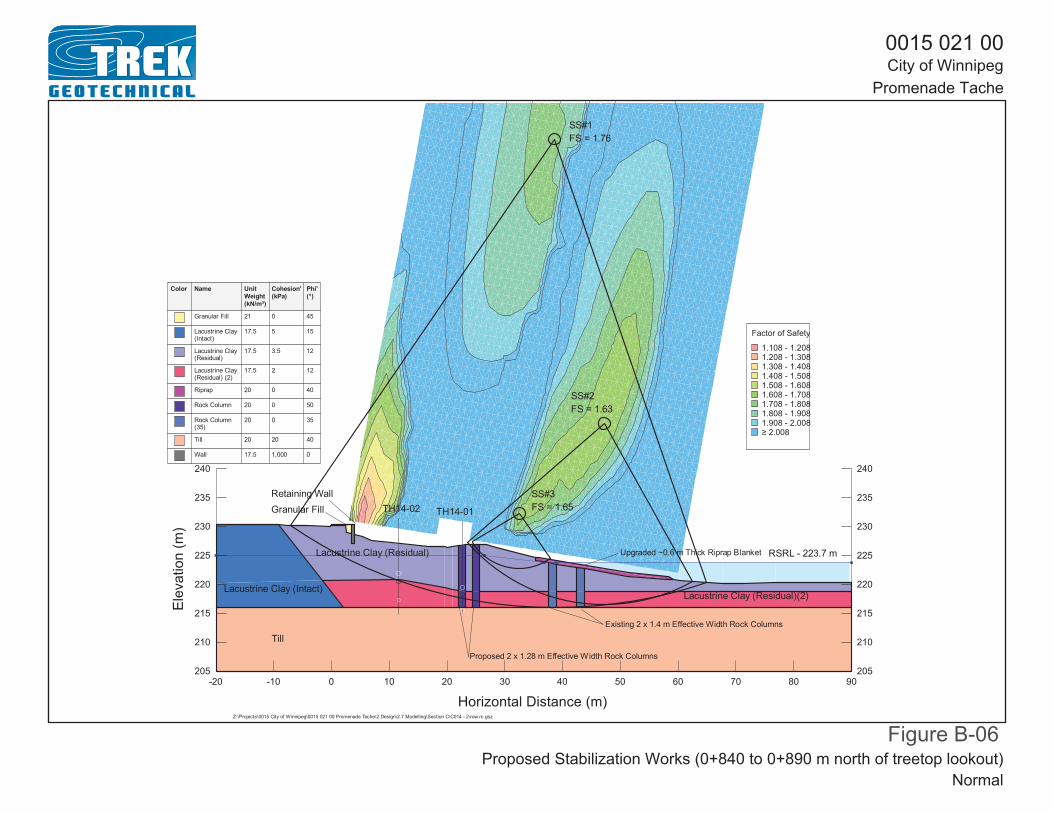
Proposed Works
The proposed works shown on the IFT Drawings and considered in the analysis include:
• Riprap erosion protection to maintain or provide minor improvement to stability, and rockfill columns as required to achieve slope stability targets for global slip surfaces (Sheets 09 to 14)
• A 3.0 m wide upper-bank pathway (net fill) from the Taché Dock to Esplanade Riel (Sheets 15 and 16)
• A sidewalk widened to 4.0 m and sheet piles wall at the south end of the site (Sheets 17 to 26 of the IFT Drawings)
• A Treetop Lookout structure founded on deep foundations within the extent of the widened sidewalk (Sheets 27 to 58 of the IFT Drawings)
• Final site restoration and landscaping works (Sheets 59 to 67)
The upper-bank pathway will be situated in the mid to upper-bank at an elevation ranging from 229 to 230 m, which will result in a net fill. Fill required for the upper-bank pathway has been minimized by cutting into the existing slope as much as possible with a 0.5 m high limestone block retaining wall along the upslope edge of the path. Grades surrounding the path will be approximately 4H:1V (similar to existing slopes) upslope of the pathway, and 3H:1V downslope of the pathway. Naturalised vegetation will be placed downslope of the pathway where the proposed slope is too steep for mowing grass. The fill for the pathway extends within sections of new stabilization works (Section C) as well as existing stabilization works surrounding the Ave. de la Cathedrale outfall.
The 4.0 m wide sidewalk will require additional fill and a retaining wall along most of its length (Section A), which will terminate just downstream of Section B. Any global slope stability improvement offered by the retaining wall has been neglected in the analysis. Cellular concrete is included as backfill for the retaining wall, although the reduced weight of backfill has been neglected in the slope stability analysis.
The Treetop Lookout structure is founded on deep foundations end-bearing on till or bedrock. The structure design has assumed that the majority of slope movement following rockfill column
RFP NO. 180-2017 – Promenade Taché Page 5 of 16 Final Riverbank Stability Report – Permanent October 25, 2017
Z:\Projects\0015 City of Winnipeg\0015 021 00 Promenade Tache\4 Docs\4.4 Deliverables\3 - Final Riverbank Stability Report\LTR 2017-10-25 Final Riverbank Stability Report 0_FINAL_MVH 0015-021-00.docx
installation have occurred prior to installation of foundation units. The structural foundation units have been excluded from the slope stability analysis.
The proposed riprap geometry is intended to match the lower bank geometry through most of the site and thus provide a smooth hydraulic shoreline profile. The riprap will be sub-cut at the upper edge (Elev. 224.7 m ±), partially to fully sub-cut (vary to achieve smooth profile) at the winter river level shoreline (Elev. 222.0 m ±), and laid on top of existing river bottom below the winter river level. In the vicinity of Section B, the riprap will need to be thickened near the winter river level shoreline. An ice scour protection berm has been included at the crest of the lower bank slope (see Sheet 12) to protect the structure piers.
The rockfill column layout proposed consists of the following (from south to north) referenced to the Control Line Stationing shown on the Drawings and associated cross-section used in the analysis:
Section Sta. (m) Rockfill Column Layout Effective Shear Key Width (m)
A 0+750 to 0+840 m (treetop lookout) 99 x 2.1 m dia. (three rows) in mid-bank 3.8 m
A 0+840 to 0+890 m 36 x 2.1 m dia. (two rows) in mid-bank 2.6 m
B 0+890 to 0+940 m 24 x 3.0 m dia. (two rows) in lower bank 3.0 m
0+990 to 1+060 m Existing 25 x 2.1 m dia. (two rows) in lower bank and 40 x 2.1 m dia. (two rows) in mid-bank 2 x 2.0 m
C 1+060 to 1+120 m 26 x 3.0 m dia. (two rows) in lower bank 3.0 m
At Section A within the extent of the treetop lookout, the proposed stabilization works (incl. 3 rows of rockfill columns) achieve factors of safety for mid to upper bank global slip surfaces ranging from 1.27 to 1.64 (extreme) and 1.50 to 1.90 (normal). The associated relative improvement is 39% to 40% for the global upper bank slip surface (SS#1) that most closely matches the observed zones of inclinometer movement (for extreme and normal conditions, respectively). A localized slip surface initiating within the pier ice scour protection berm has a factor of safety of 1.27 (slightly lower than target of 1.30), but has a 6% improvement over existing conditions; given the geometry of the associated slip surface relative to the piers, we consider this to be acceptable. The factor of safety at the location of the proposed retaining wall exceeds the FS targets of 1.30 and 1.50 without incorporating strength offered by the wall, and therefore the wall can be designed to support only the height of the cantilever above grade (i.e. does not need to be designed to accommodate downslope riverbank movement). North of this area where only two rows of rockfill columns are proposed in the mid-bank area, factors of safety of 1.50 to 1.61 (extreme) and 1.63 to 1.76 (normal) are achieved, resulting in a 29% to 32% improvement to the observed upper-bank global slip surface.
At Section B (at the north end of the retaining wall), the proposed stabilization works achieve factors of safety for mid to upper bank global slip surfaces ranging from 1.30 to 1.72 (extreme) and 1.45 to 1.96 (normal) with the proposed stabilization works, with an associated relative

RFP NO. 180-2017 – Promenade Taché Page 6 of 16 Final Riverbank Stability Report – Permanent October 25, 2017
Z:\Projects\0015 City of Winnipeg\0015 021 00 Promenade Tache\4 Docs\4.4 Deliverables\3 - Final Riverbank Stability Report\LTR 2017-10-25 Final Riverbank Stability Report 0_FINAL_MVH 0015-021-00.docx
improvement of 72% to 89% to the mid-bank slip surface that most closely matches the observed zones of inclinometer movement (for back-analysis, extreme and normal conditions). An overall improvement of at least 26% was achieved on the most critical global mid or upper bank slip surfaces. A localized slip surface initiating in the upper bank and exiting above the rockfill columns has a factor of safety of 1.18 (extreme) to 1.27 (normal), but is improved by 26% to 36% with the proposed stabilization works; we consider this to be acceptable considering the geometry of the slip surface relative to the works. A few metres downstream of Section B, the wall is terminated and slight fill (up to 0.7 m thick) is required to widen the sidewalk. With the fill in place, the factors of safety for upper bank global slip surfaces are slightly below the targets at 1.28 (extreme) and 1.43 (normal), which is considered acceptable since no structures are present at this location. A critical slip surface initiating downslope of the crest and exiting above the rockfill columns has a factor of safety of 1.14 (extreme) and 1.23 (normal) but overall has a 22% to 31% improvement over existing conditions, which we consider to be acceptable.
At Section C (upstream of Esplanade Riel), the proposed stabilization works achieve factors of safety within the roadway/sidewalk ranging from 1.34 (extreme) to 1.42 (normal), or a 72% to 89% improvement to the FS of the mid-bank slip surface (SS#1) that most closely matches the observed zones of inclinometer movement (for back-analysis, extreme and normal conditions). A localized slip surface initiating within the upper bank pathway and exiting above the rockfill columns has a factor of safety of 1.13 (extreme) and 1.14 (normal), but has a 26% to 36% improvement over existing conditions, which we consider acceptable.
At Section D (Cathedrale Outfall), the proposed pathway fill results in a small reduction in the factor of safety relative to existing conditions, however the net stability improvement over back-analysed conditions (without existing stabilization works) is at least 50% and is considered acceptable.
Conclusions and Recommendations
We conclude that the proposed works achieve target factors of safety or an acceptable relative improvement over existing conditions.
Some degree of slope movement during and after construction of rockfill columns is inevitable, as the rockfill materials require shear straining in order to mobilize sufficient resistance for the slope to come to an equilibrium condition. We anticipate the immediate post-construction movement (occurring during and within the first few months after rockfill column installation) may be on the order of 25 mm to 50 mm, while long-term movements are expected to be 25 mm or less, but up to 50 mm in the worst-case. These estimates are based on empirical data on slope performance for similar stabilization projects within the City of Winnipeg, as well as specific characteristics of the current site. The current sheet pile wall and lookout structure foundations are design to accommodate long-term slope movements, therefore immediate post-construction movements must have occurred prior to installation of these elements. The current structure design (as shown on IFT drawings) includes fixed connections at all piers and expansion joints at the abutments, where long-term slope movements can reasonably be accommodated in the structure, but may result
RFP NO. 180-2017 – Promenade Taché Page 7 of 16 Final Riverbank Stability Report – Permanent October 25, 2017
Z:\Projects\0015 City of Winnipeg\0015 021 00 Promenade Tache\4 Docs\4.4 Deliverables\3 - Final Riverbank Stability Report\LTR 2017-10-25 Final Riverbank Stability Report 0_FINAL_MVH 0015-021-00.docx
in serviceability issues that would require repair. Long-term movements are anticipated to be essentially complete within the first 2 to 5 years, with annual movement rates decreasing progressively over this period (i.e. a majority of movement occurring within the first year or two).
The installation of rockfill columns will take place during the winter of 2018 (January to March). Sheet piles for sidewalk widening and foundation piles for the Treetop Lookout Structure (regardless of pier connection type) are scheduled for the following summer to allow for the spring freshet to occur and once the movements associated with rockfill column mobilization have taken place.
An inspection and monitoring program will be developed in consultation with the City’s Riverbank Management Engineer, to satisfy requirements of the Waterways Permit, and the Public Works department, as it pertains to the structure.
A change in the pier to superstructure connection is currently being examined to accommodate long-term riverbank movements, for which a separate design report will be submitted. If accepted, the modified connection detail will be issued by Addendum during the tender period, or following tender closing by a change in work. The report will include recommendations for structure monitoring and maintenance requirements. We do not recommend installation of the structural elements earlier than recommended above, regardless of the pier to superstructure connection detail.
Closure
The geotechnical information provided in this report is in accordance with current engineering principles and practices (Standard of Practice). The findings of this report were based on information provided (field investigation and laboratory testing). Soil conditions are natural deposits that can be highly variable across a site. If subsurface conditions are different than the conditions previously encountered on-site or those presented here, we should be notified to adjust our findings if necessary.
All information provided in this report is subject to our standard terms and conditions for engineering services, a copy of which is provided to each of our clients with the original scope of work or standard engineering services agreement. If these conditions are not attached, and you are not already in possession of such terms and conditions, contact our office and you will be promptly provided with a copy.
This report has been prepared by TREK Geotechnical Inc. (the Consultant) for the exclusive use of the City of Winnipeg (the Client) and their agents for the work product presented in the report. Any findings or recommendations provided in this report are not to be used or relied upon by any third parties, except as agreed to in writing by the Client and Consultant prior to use.


FIGURES

R
E
D
R
IV
E
R
RU
E M
AS
SO
N
AV
EN
UE
D
E L
A C
AT
HE
DR
AL
E
RU
E D
ES
PIN
S
TA
CHÉ
AV
E
3 m WIDE
OFF-STREET
PATHWAY
RIPRAP
UWRL - 222.0 m ELEV.
RSRL - 223.7 m ELEV.
3.05 m Ø LOWER BANK
ROCKFILL COLUMN (TYP.)
SIDEWALK
WIDENED TO 4 m
TREE-TOP LOOKOUT STRUCTURE
RIPRAP
2.1 m Ø MID BANK
ROCKFILL COLUMN (TYP.)
EXISTING ROCKFILL COLUMN (TYP.)
EXISTING RIPRAP
3.05 m Ø LOWER BANK
ROCKFILL COLUMN (TYP.)
TACHÉ DOCK
NOTE 2
PIER ICE SCOUR PROTECTION BERM
TH14-05
TH08-01
TH08-02
TH08-03
TH09-02
TH14-03
TH14-04
TH14-02
TH14-01
SI-3
SP-2
SI-4
TH09-01
PN-3P, PN-4
TOE OF
PROPOSED SLOPE
EXISTING
ROCKFILL COLUMN
E
S
P
L
A
N
A
D
E
R
I
E
L
P
E
D
E
S
T
R
I
A
N
B
R
I
D
G
E
2
2
0
2
2
0
2
2
1
2
2
1
2
2
2
2
2
3
2
2
4
2
2
5
2
2
6
2
2
7
2
2
8
2
2
9
2
3
0
2
3
1
2
3
1
LEGEND:
EXISTING TEST HOLE WITH OPERATIONAL
MONITORING INSTRUMENTATION
NOTES:
1.EXISTING GROUND CONTOURS ARE BASED ON SURVEY PROVIDED BY CITY OF
WINNIPEG DATED 2008 AND 2015 .
2.ROCKFILL COLUMN LOCATIONS TO BE ADJUSTED DURING CONSTRUCTION TO
AVOID CONFLICTS WITH PIER FOUNDATION PILES AND MINIMIZE TREE REMOVALS.
0 10
SCALE = 1 : 1 250
20 30 40 50 m
Figure 01
General Site Plan
0015 021 00
City of Winnipeg
Promenade Tache
Z:\P
ro
je
cts\0
01
5 C
ity o
f W
in
nip
eg
\0
01
5 0
21
0
0 P
ro
me
na
de
T
ach
e\3
S
urve
y a
nd
D
wg
\3
.4
C
AD
\3
.4
.3
W
orkin
g F
old
er\1
00
% S
um
bissio
n\F
ig
ure
0
1 - 1
00
% D
esig
n.d
wg, 1
0/2
5/2
01
7 9
:4
7:1
7 P
MA
NS
I fu
ll b
le
ed
B
(1
1.0
0 x 1
7.0
0 In
ch
es)
(279 mm x 432 mm)
C
- -
B
- -
A
- -
EXISTING TEST HOLE WITH ABANDONED
MONITORING INSTRUMENTATION
D
- -
0015 021 00City of Winnipeg
Promenade Tache
222
223
224
225
226
227
228
0
5
10
15
20
25
3016-Apr-14 15-Jul-14 13-Oct-14 11-Jan-15 11-Apr-15 10-Jul-15 8-Oct-15 6-Jan-16 5-Apr-16 4-Jul-16 2-Oct-16 31-Dec-16 31-Mar-17
Elev
atio
n (m
)
Cum
ulat
ive H
orizo
ntal D
isplac
emen
t (m
m)
Monitoring Date
SI14-02 - A - Elev. 220.95 m SI14-01 - A - Elev. 226.2 mRiver Level @ James Avenue TH14-02 PN 35739 Clay- Tip El. 221.82TH14-01 PN 35734 Clay- Tip El. 219.41 TH14-02 PN 35723 Clay- Tip El. 217.25TH14-01 PN 35726 Clay Till- Tip El. 215.45
Piezometric Levels and Horizontal Displacement at Section A

0015 021 00City of Winnipeg
Promenade Tache
222
223
224
225
226
227
228
-10
-5
0
5
10
15
20
25
30
35
40
45
50
Elev
atio
n (m
)
Cum
ulat
ive H
orizo
ntal D
isplac
emen
t (m
m)
Monitoring Date
SI14-04 - A - Elev. 227.72 m SI14-03 - A - Elev. 228.37 m River Level @ James AvenueTH14-04 PN 35735 Clay- Tip El. 223.15 TH14-03 PN 35725 Clay- Tip El. 220.73 TH14-04 PN 35736 Clay- Tip El. 218.88TH14-03 PN 35722 Clay- Tip El. 217.68
Piezometric Levels and Horizontal Displacement at Section B

TABLES
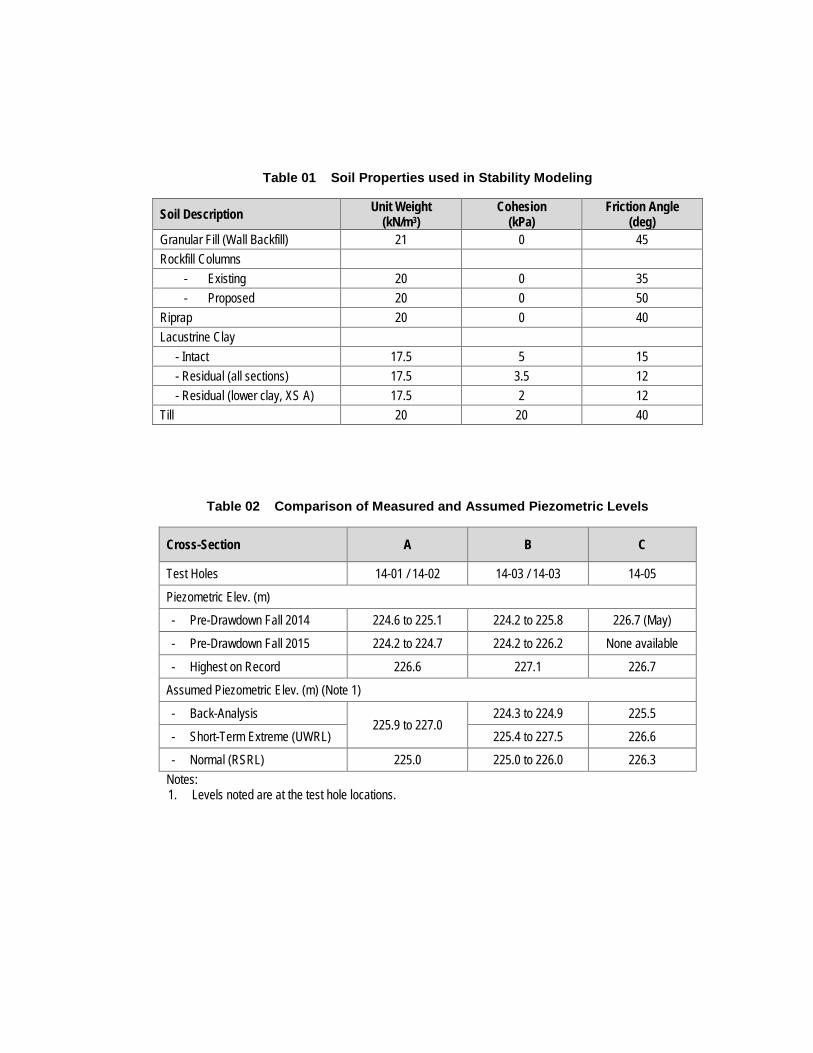
Table 01 Soil Properties used in Stability Modeling
Soil Description Unit Weight (kN/m3)
Cohesion (kPa)
Friction Angle (deg)
Granular Fill (Wall Backfill) 21 0 45 Rockfill Columns
- Existing 20 0 35 - Proposed 20 0 50
Riprap 20 0 40 Lacustrine Clay
- Intact 17.5 5 15 - Residual (all sections) 17.5 3.5 12 - Residual (lower clay, XS A) 17.5 2 12
Till 20 20 40
Table 02 Comparison of Measured and Assumed Piezometric Levels
Cross-Section A B C
Test Holes 14-01 / 14-02 14-03 / 14-03 14-05
Piezometric Elev. (m)
- Pre-Drawdown Fall 2014 224.6 to 225.1 224.2 to 225.8 226.7 (May)
- Pre-Drawdown Fall 2015 224.2 to 224.7 224.2 to 226.2 None available
- Highest on Record 226.6 227.1 226.7
Assumed Piezometric Elev. (m) (Note 1)
- Back-Analysis 225.9 to 227.0
224.3 to 224.9 225.5
- Short-Term Extreme (UWRL) 225.4 to 227.5 226.6
- Normal (RSRL) 225.0 225.0 to 226.0 226.3 Notes: 1. Levels noted are at the test hole locations.
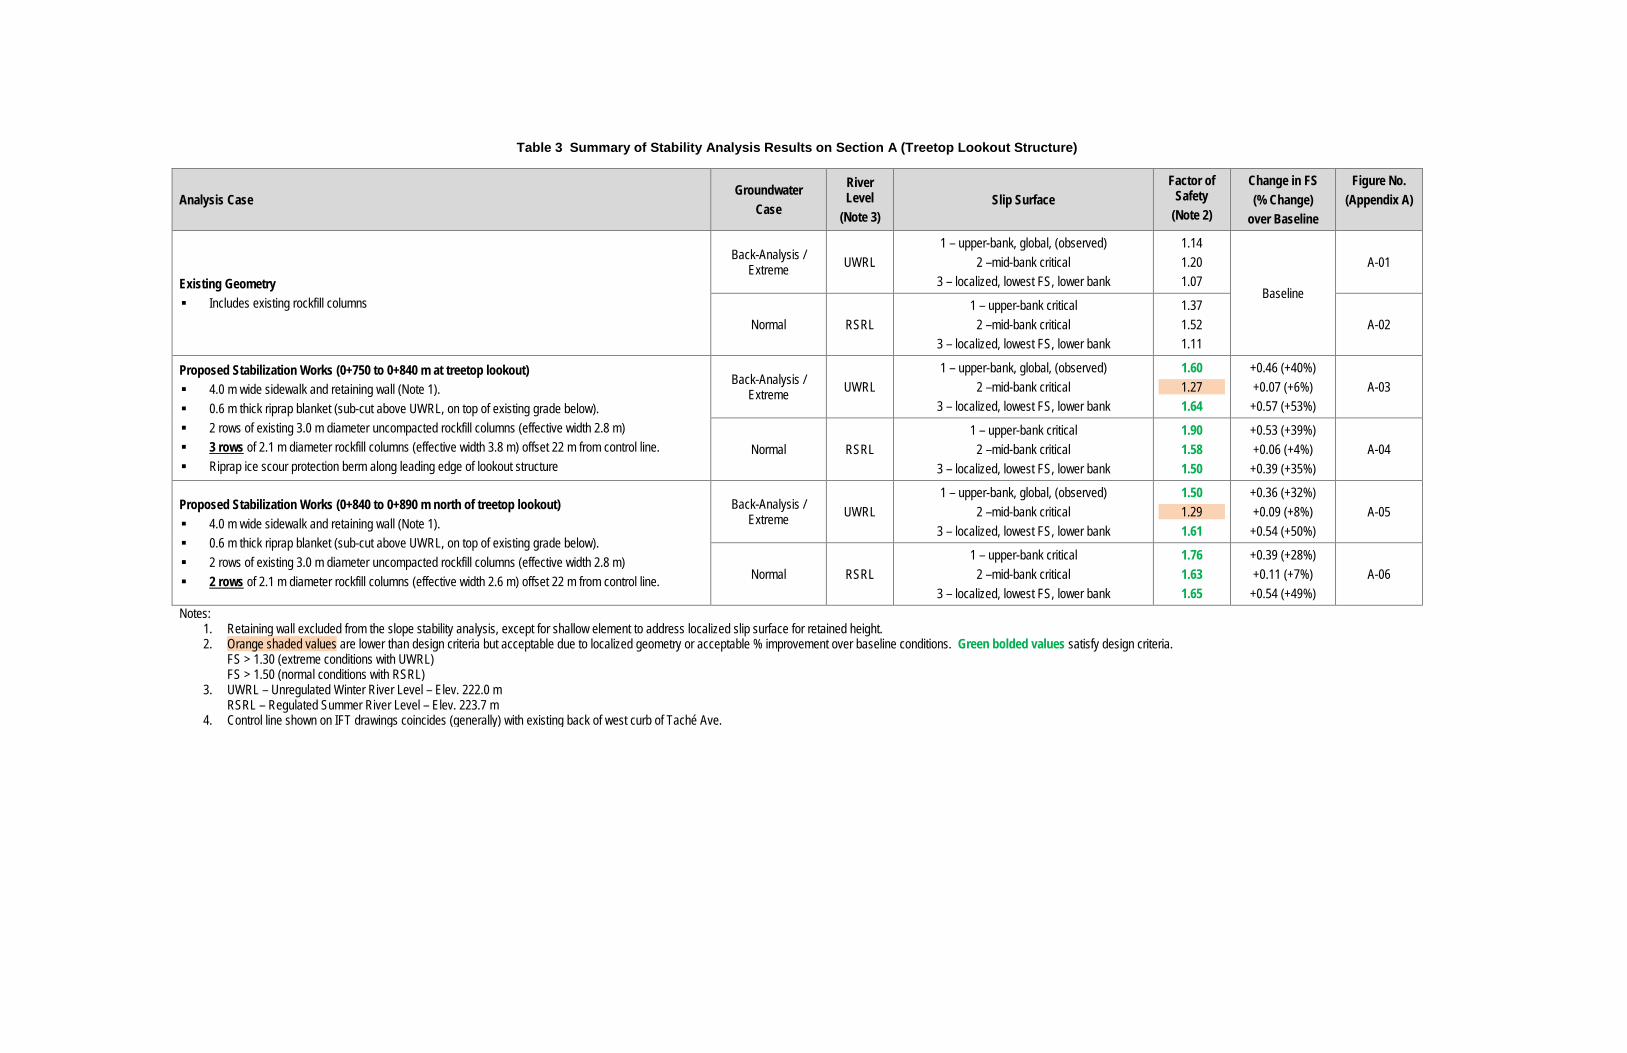
Table 3 Summary of Stability Analysis Results on Section A (Treetop Lookout Structure)
Analysis Case Groundwater
Case
River Level
(Note 3) Slip Surface
Factor of Safety
(Note 2)
Change in FS (% Change)
over Baseline
Figure No. (Appendix A)
Existing Geometry Includes existing rockfill columns
Back-Analysis / Extreme UWRL
1 – upper-bank, global, (observed) 2 –mid-bank critical
3 – localized, lowest FS, lower bank
1.14 1.20 1.07
Baseline
A-01
Normal RSRL 1 – upper-bank critical
2 –mid-bank critical 3 – localized, lowest FS, lower bank
1.37 1.52 1.11
A-02
Proposed Stabilization Works (0+750 to 0+840 m at treetop lookout) 4.0 m wide sidewalk and retaining wall (Note 1). 0.6 m thick riprap blanket (sub-cut above UWRL, on top of existing grade below). 2 rows of existing 3.0 m diameter uncompacted rockfill columns (effective width 2.8 m) 3 rows of 2.1 m diameter rockfill columns (effective width 3.8 m) offset 22 m from control line. Riprap ice scour protection berm along leading edge of lookout structure
Back-Analysis / Extreme UWRL
1 – upper-bank, global, (observed) 2 –mid-bank critical
3 – localized, lowest FS, lower bank
1.60 1.27 1.64
+0.46 (+40%) +0.07 (+6%)
+0.57 (+53%) A-03
Normal RSRL 1 – upper-bank critical
2 –mid-bank critical 3 – localized, lowest FS, lower bank
1.90 1.58 1.50
+0.53 (+39%) +0.06 (+4%)
+0.39 (+35%) A-04
Proposed Stabilization Works (0+840 to 0+890 m north of treetop lookout) 4.0 m wide sidewalk and retaining wall (Note 1). 0.6 m thick riprap blanket (sub-cut above UWRL, on top of existing grade below). 2 rows of existing 3.0 m diameter uncompacted rockfill columns (effective width 2.8 m) 2 rows of 2.1 m diameter rockfill columns (effective width 2.6 m) offset 22 m from control line.
Back-Analysis / Extreme UWRL
1 – upper-bank, global, (observed) 2 –mid-bank critical
3 – localized, lowest FS, lower bank
1.50 1.29 1.61
+0.36 (+32%) +0.09 (+8%)
+0.54 (+50%) A-05
Normal RSRL 1 – upper-bank critical
2 –mid-bank critical 3 – localized, lowest FS, lower bank
1.76 1.63 1.65
+0.39 (+28%) +0.11 (+7%)
+0.54 (+49%) A-06
Notes: 1. Retaining wall excluded from the slope stability analysis, except for shallow element to address localized slip surface for retained height. 2. Orange shaded values are lower than design criteria but acceptable due to localized geometry or acceptable % improvement over baseline conditions. Green bolded values satisfy design criteria.
FS > 1.30 (extreme conditions with UWRL) FS > 1.50 (normal conditions with RSRL)
3. UWRL – Unregulated Winter River Level – Elev. 222.0 m RSRL – Regulated Summer River Level – Elev. 223.7 m
4. Control line shown on IFT drawings coincides (generally) with existing back of west curb of Taché Ave.
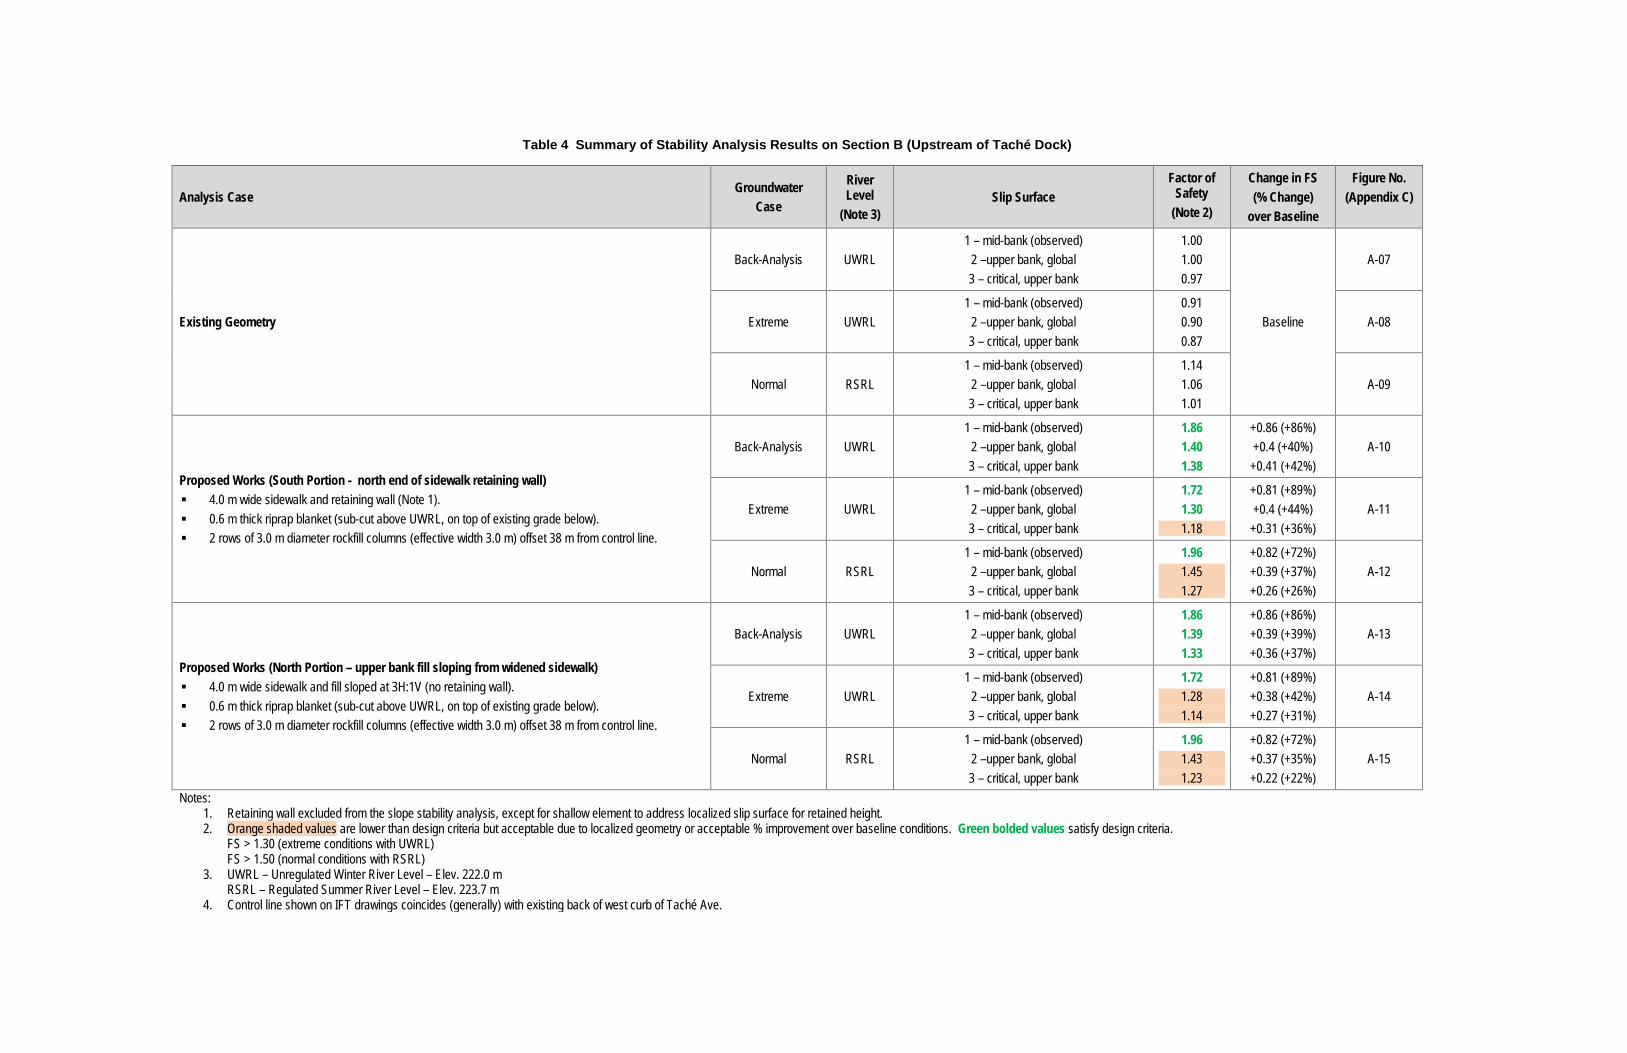
Table 4 Summary of Stability Analysis Results on Section B (Upstream of Taché Dock)
Analysis Case Groundwater
Case
River Level
(Note 3) Slip Surface
Factor of Safety
(Note 2)
Change in FS (% Change)
over Baseline
Figure No. (Appendix C)
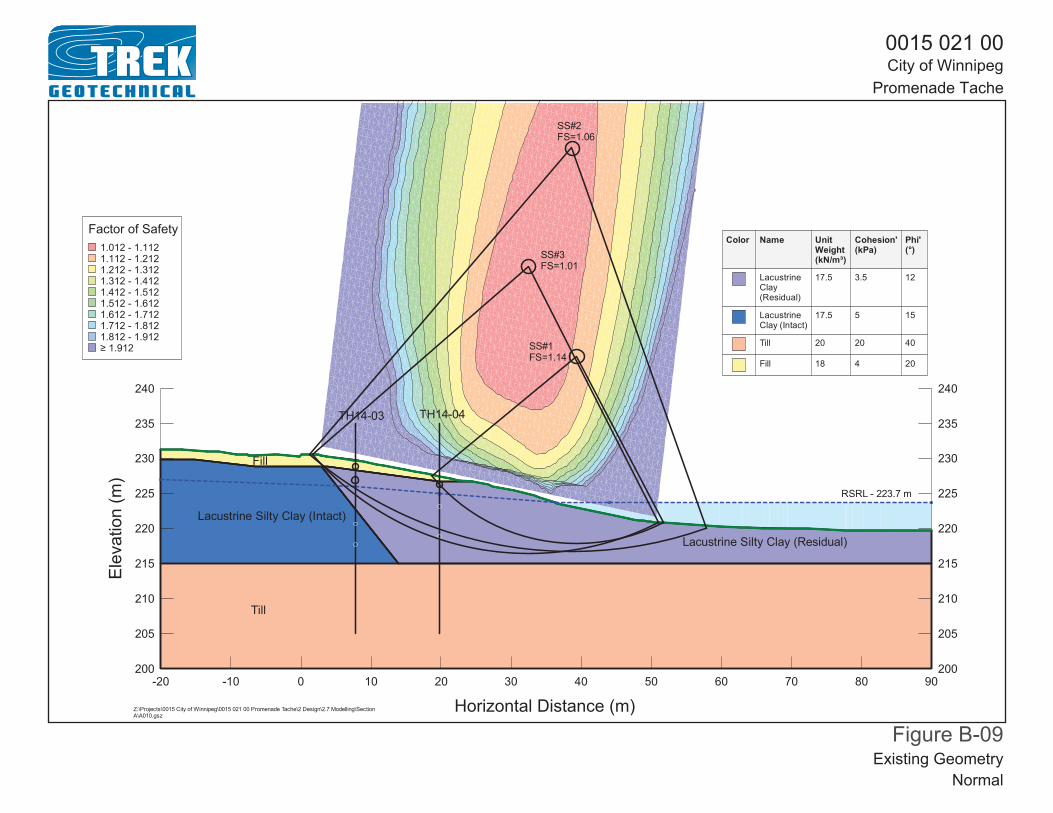
Existing Geometry
Back-Analysis UWRL 1 – mid-bank (observed)
2 –upper bank, global 3 – critical, upper bank
1.00 1.00 0.97
Baseline
A-07
Extreme UWRL 1 – mid-bank (observed)
2 –upper bank, global 3 – critical, upper bank
0.91 0.90 0.87
A-08
Normal RSRL 1 – mid-bank (observed)
2 –upper bank, global 3 – critical, upper bank
1.14 1.06 1.01
A-09
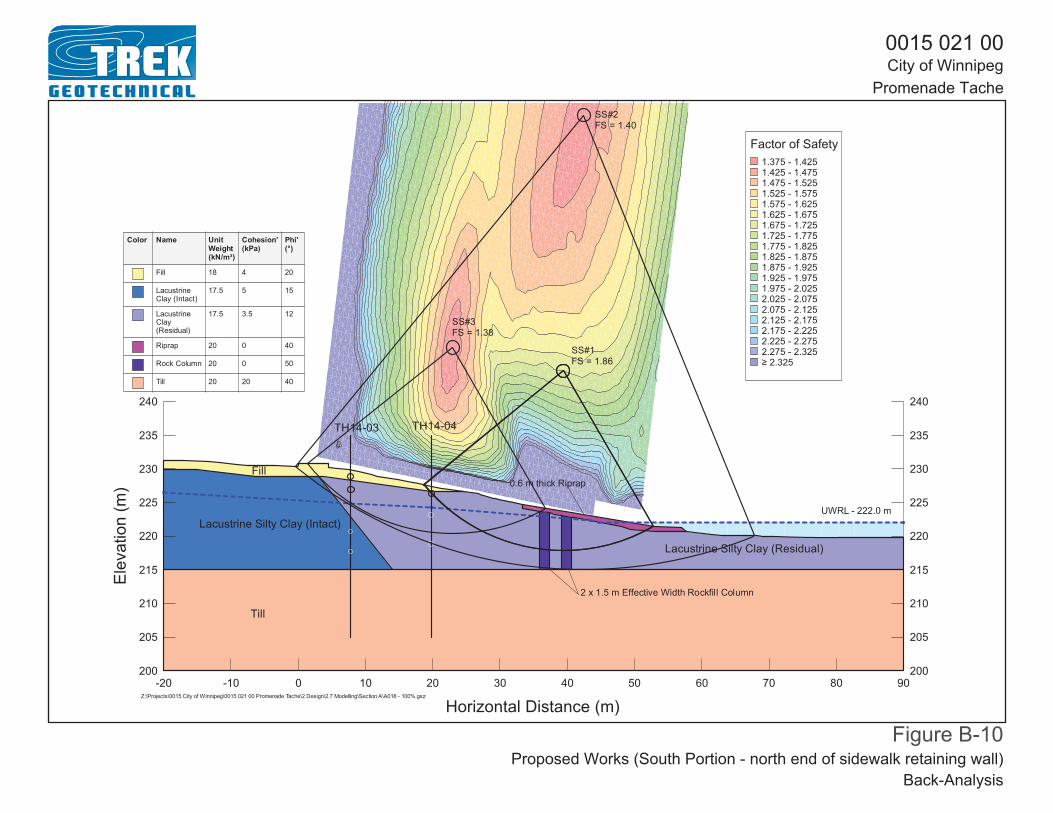
Proposed Works (South Portion - north end of sidewalk retaining wall) 4.0 m wide sidewalk and retaining wall (Note 1). 0.6 m thick riprap blanket (sub-cut above UWRL, on top of existing grade below). 2 rows of 3.0 m diameter rockfill columns (effective width 3.0 m) offset 38 m from control line.
Back-Analysis UWRL 1 – mid-bank (observed)
2 –upper bank, global 3 – critical, upper bank
1.86 1.40 1.38
+0.86 (+86%) +0.4 (+40%)
+0.41 (+42%) A-10
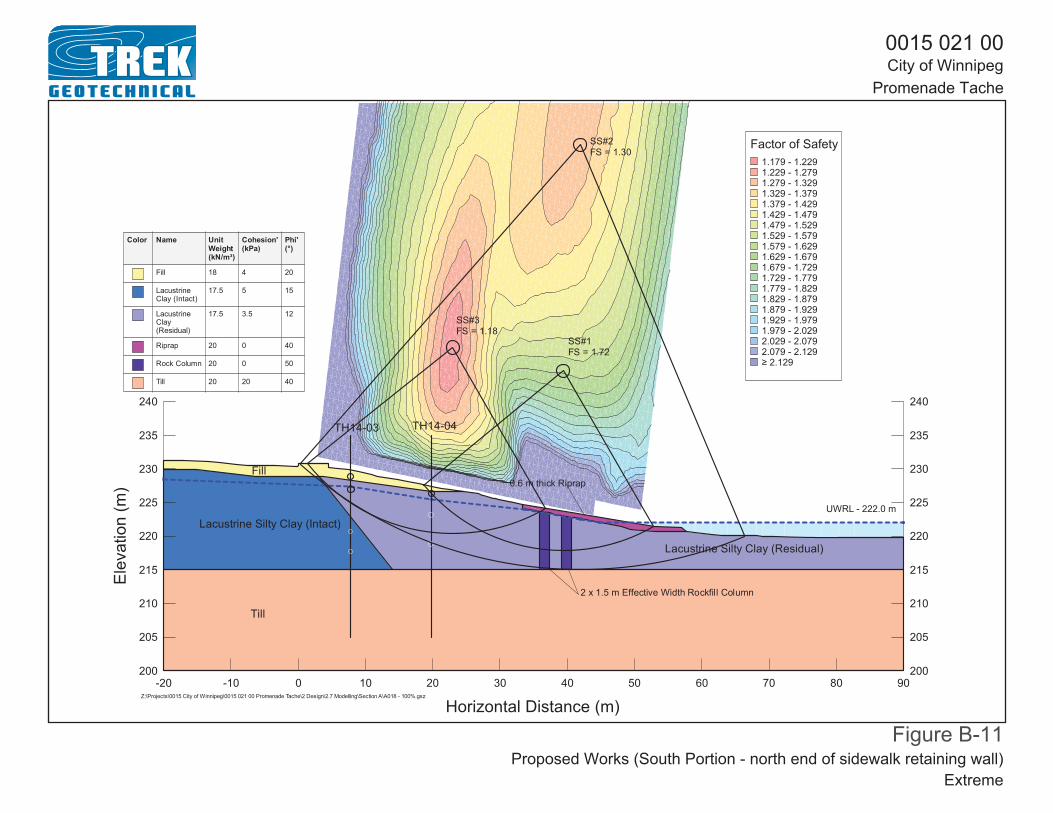
Extreme UWRL 1 – mid-bank (observed)
2 –upper bank, global 3 – critical, upper bank
1.72 1.30 1.18
+0.81 (+89%) +0.4 (+44%)
+0.31 (+36%) A-11
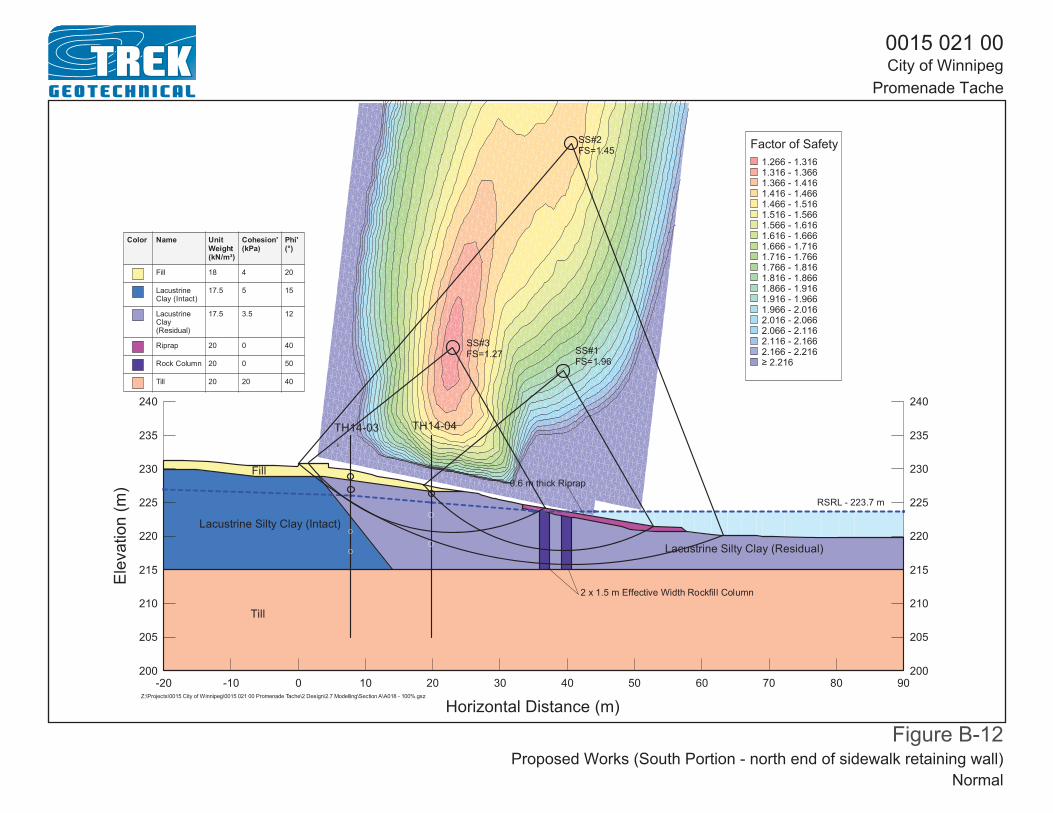
Normal RSRL 1 – mid-bank (observed)
2 –upper bank, global 3 – critical, upper bank
1.96 1.45 1.27
+0.82 (+72%) +0.39 (+37%) +0.26 (+26%)
A-12
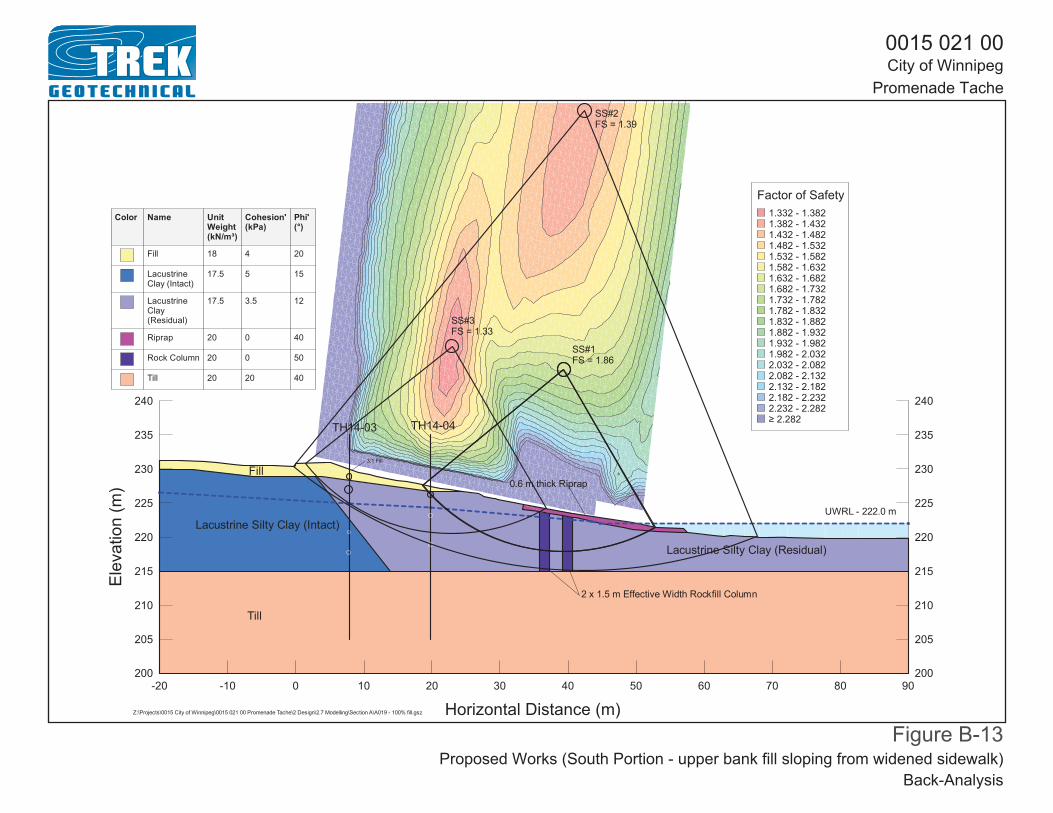
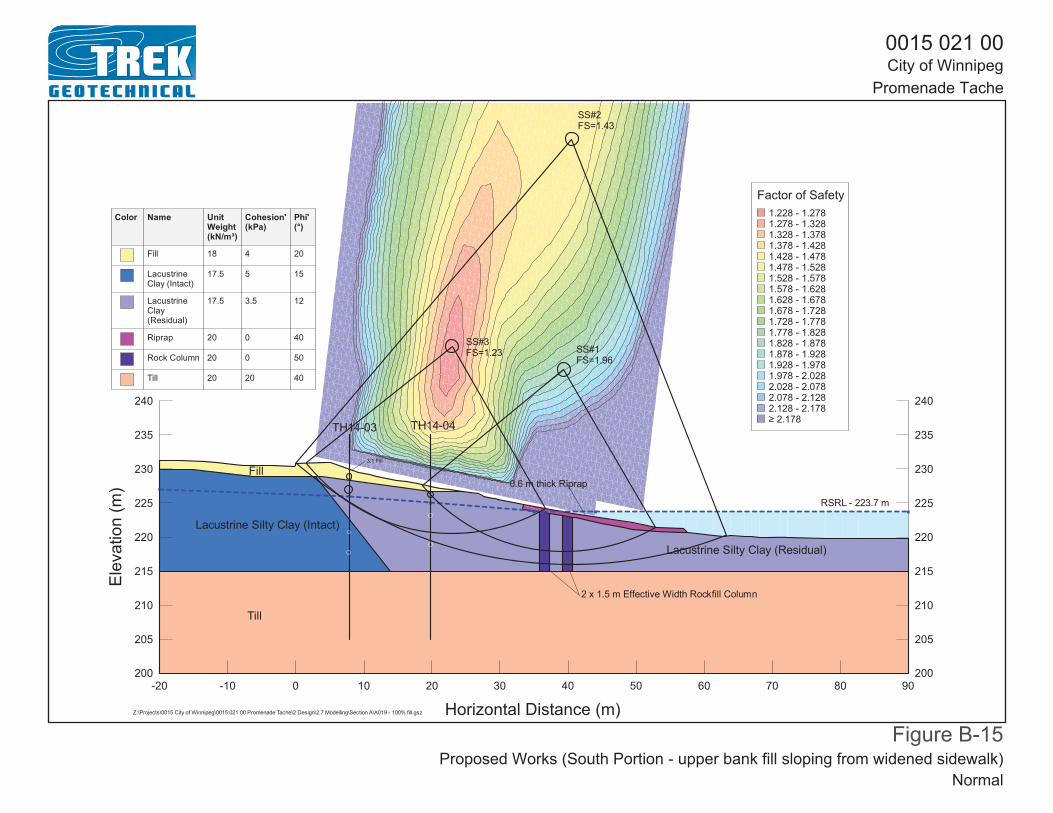
Proposed Works (North Portion – upper bank fill sloping from widened sidewalk) 4.0 m wide sidewalk and fill sloped at 3H:1V (no retaining wall). 0.6 m thick riprap blanket (sub-cut above UWRL, on top of existing grade below). 2 rows of 3.0 m diameter rockfill columns (effective width 3.0 m) offset 38 m from control line.
Back-Analysis UWRL 1 – mid-bank (observed)
2 –upper bank, global 3 – critical, upper bank
1.86 1.39 1.33
+0.86 (+86%) +0.39 (+39%) +0.36 (+37%)
A-13
Extreme UWRL 1 – mid-bank (observed)
2 –upper bank, global 3 – critical, upper bank
1.72 1.28 1.14
+0.81 (+89%) +0.38 (+42%) +0.27 (+31%)
A-14
Normal RSRL 1 – mid-bank (observed)
2 –upper bank, global 3 – critical, upper bank
1.96 1.43 1.23
+0.82 (+72%) +0.37 (+35%) +0.22 (+22%)
A-15
Notes: 1. Retaining wall excluded from the slope stability analysis, except for shallow element to address localized slip surface for retained height. 2. Orange shaded values are lower than design criteria but acceptable due to localized geometry or acceptable % improvement over baseline conditions. Green bolded values satisfy design criteria.
FS > 1.30 (extreme conditions with UWRL) FS > 1.50 (normal conditions with RSRL)
3. UWRL – Unregulated Winter River Level – Elev. 222.0 m RSRL – Regulated Summer River Level – Elev. 223.7 m
4. Control line shown on IFT drawings coincides (generally) with existing back of west curb of Taché Ave.
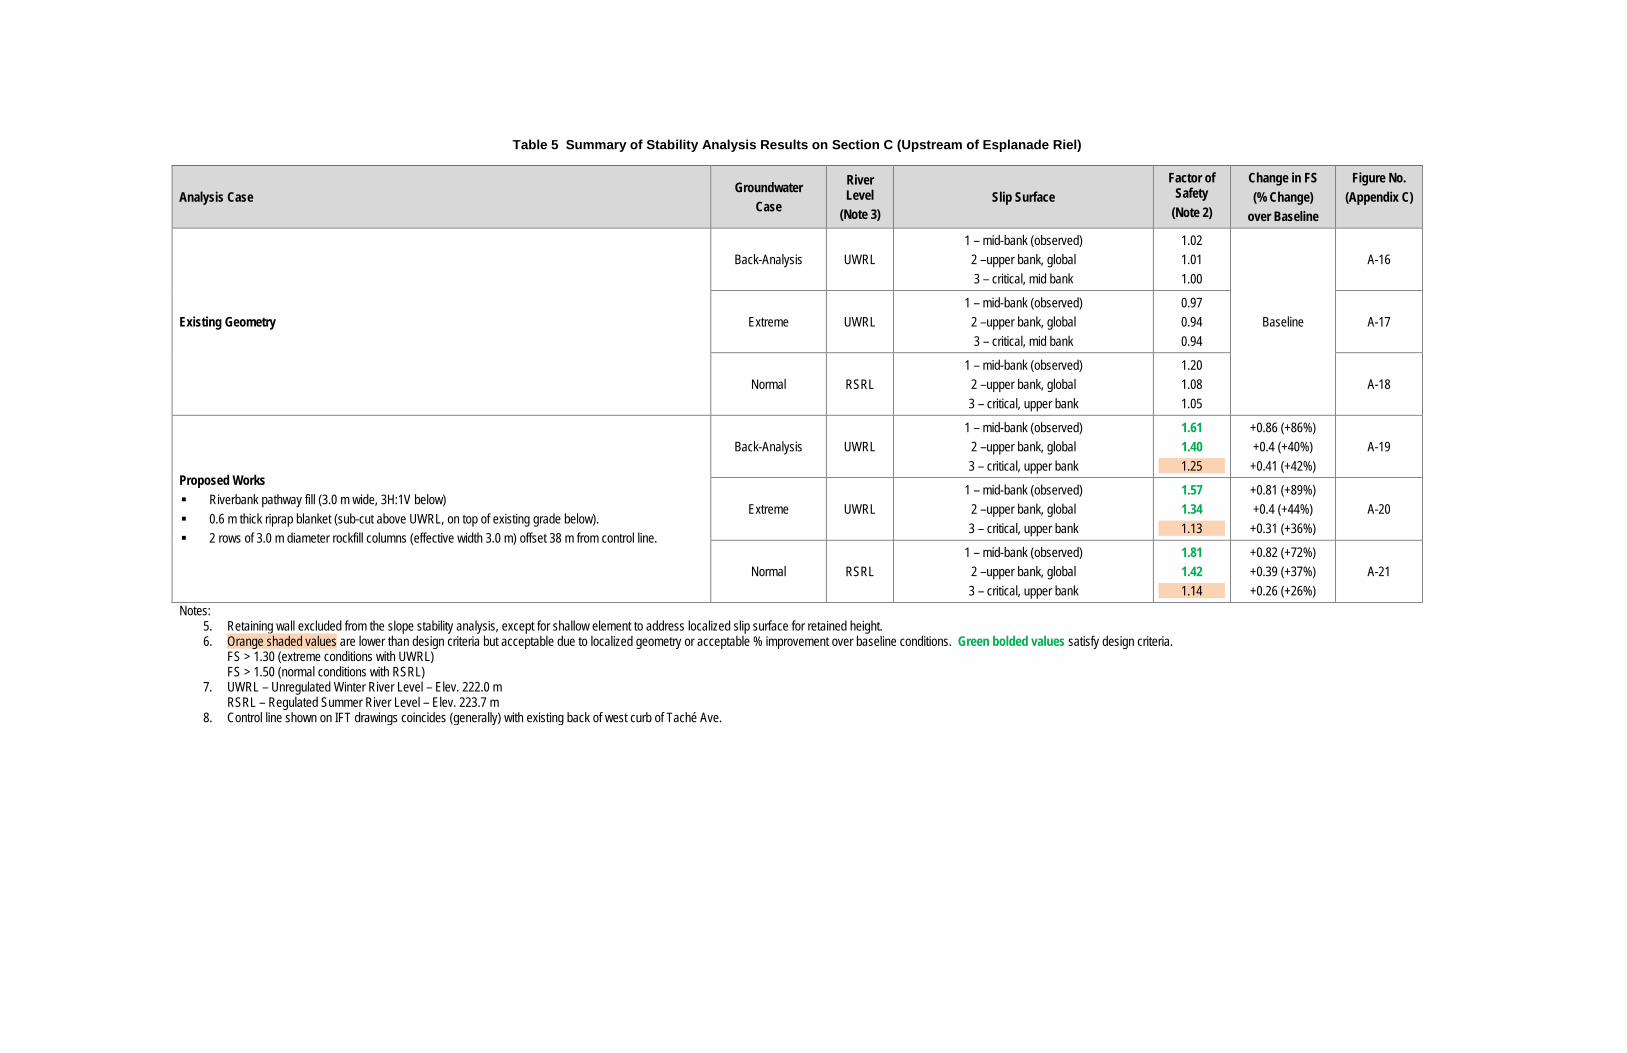
Table 5 Summary of Stability Analysis Results on Section C (Upstream of Esplanade Riel)
Analysis Case Groundwater
Case
River Level
(Note 3) Slip Surface
Factor of Safety
(Note 2)
Change in FS (% Change)
over Baseline
Figure No. (Appendix C)
Existing Geometry
Back-Analysis UWRL 1 – mid-bank (observed)
2 –upper bank, global 3 – critical, mid bank
1.02 1.01 1.00
Baseline
A-16
Extreme UWRL 1 – mid-bank (observed)
2 –upper bank, global 3 – critical, mid bank
0.97 0.94 0.94
A-17
Normal RSRL 1 – mid-bank (observed)
2 –upper bank, global 3 – critical, upper bank
1.20 1.08 1.05
A-18
Proposed Works Riverbank pathway fill (3.0 m wide, 3H:1V below) 0.6 m thick riprap blanket (sub-cut above UWRL, on top of existing grade below). 2 rows of 3.0 m diameter rockfill columns (effective width 3.0 m) offset 38 m from control line.
Back-Analysis UWRL 1 – mid-bank (observed)
2 –upper bank, global 3 – critical, upper bank
1.61 1.40 1.25
+0.86 (+86%) +0.4 (+40%)
+0.41 (+42%) A-19
Extreme UWRL 1 – mid-bank (observed)
2 –upper bank, global 3 – critical, upper bank
1.57 1.34 1.13
+0.81 (+89%) +0.4 (+44%)
+0.31 (+36%) A-20
Normal RSRL 1 – mid-bank (observed)
2 –upper bank, global 3 – critical, upper bank
1.81 1.42 1.14
+0.82 (+72%) +0.39 (+37%) +0.26 (+26%)
A-21
Notes: 5. Retaining wall excluded from the slope stability analysis, except for shallow element to address localized slip surface for retained height. 6. Orange shaded values are lower than design criteria but acceptable due to localized geometry or acceptable % improvement over baseline conditions. Green bolded values satisfy design criteria.
FS > 1.30 (extreme conditions with UWRL) FS > 1.50 (normal conditions with RSRL)
7. UWRL – Unregulated Winter River Level – Elev. 222.0 m RSRL – Regulated Summer River Level – Elev. 223.7 m
8. Control line shown on IFT drawings coincides (generally) with existing back of west curb of Taché Ave.

Table 6 Summary of Stability Analysis Results on Section D (Ave. de la Cathedrale Outfall)
Analysis Case Groundwater Case
River Level
(Note 3) Slip Surface
Factor of Safety
(Note 2)
Change in FS (% Change)
over Baseline
Figure No. (Appendix C)
Back-Analysis Replicate KGS Group Back-analysis (2008 Report) Back-Analysis UWRL 1 – upper-bank critical 1.05 Baseline A-22
Existing Stabilization Works 2 m effective width shear key (rockfill columns) in mid-bank 2 m effective width shear key (rockfill columns) in lower-bank 0.6 m thick riprap blanket (as per KGS stability report) Existing slope geometry
Back-Analysis UWRL 1 – upper-bank critical 1.49 +0.44 (+42%) A-23
Existing Stabilization Works + Upper Bank Pathway Fill 2 m effective width shear key (rockfill columns) in mid-bank 2 m effective width shear key (rockfill columns) in lower-bank 0.6 m thick riprap blanket (as per KGS stability report) Existing slope geometry + 3.0 m wide upper bank pathway, 3H:1V transition downslope
Back-Analysis UWRL 1 – upper-bank critical 1.41 +0.36 (+34%) A-24
Notes: 1. UWRL – Unregulated Winter River Level – Elev. 222.0 m
RSRL – Regulated Summer River Level – Elev. 223.7 m

Appendix B – Slope Stability Analysis Results
Figure
0015 021 00City of Winnipeg
Promenade Tache
Existing Geometry Back-Analysis / Extreme

Figure
0015 021 00City of Winnipeg
Promenade Tache
Existing Geometry Normal
Figure
0015 021 00City of Winnipeg
Promenade Tache
Proposed Stabilization Works (0+750 to 0+840 m at treetop lookout) Back-Analysis / Extreme

Figure
0015 021 00City of Winnipeg
Promenade Tache
Proposed Stabilization Works (0+750 to 0+840 m at treetop lookout) Normal

Figure
0015 021 00City of Winnipeg
Promenade Tache
Proposed Stabilization Works (0+840 to 0+890 m north of treetop lookout) Back-Analysis / Extreme
Figure
0015 021 00City of Winnipeg
Promenade Tache
Proposed Stabilization Works (0+840 to 0+890 m north of treetop lookout) Normal

0015 021 00City of Winnipeg
Promenade Tache
Figure Existing Geometry
Back-Analysis

0015 021 00City of Winnipeg
Promenade Tache
Figure Existing Geometry
Extreme
0015 021 00City of Winnipeg
Promenade Tache
Figure Existing Geometry
Normal
0015 021 00City of Winnipeg
Promenade Tache
Figure Proposed Works (South Portion - north end of sidewalk retaining wall)
Back-Analysis
0015 021 00City of Winnipeg
Promenade Tache
Figure Proposed Works (South Portion - north end of sidewalk retaining wall)
Extreme
0015 021 00City of Winnipeg
Promenade Tache
Figure Proposed Works (South Portion - north end of sidewalk retaining wall)
Normal
0015 021 00City of Winnipeg
Promenade Tache
Figure Proposed Works (South Portion - upper bank fill sloping from widened sidewalk)
Back-Analysis

0015 021 00City of Winnipeg
Promenade Tache
Figure Proposed Works (South Portion - upper bank fill sloping from widened sidewalk)
Extreme
0015 021 00City of Winnipeg
Promenade Tache
Figure Proposed Works (South Portion - upper bank fill sloping from widened sidewalk)
Normal

0015 021 00City of Winnipeg
Promenade Tache
Figure Existing Geometry
Back-Analysis

0015 021 00City of Winnipeg
Promenade Tache
Figure Existing Geometry
Extreme
0015 021 00City of Winnipeg
Promenade Tache
Figure Existing Geometry
Normal
0015 021 00City of Winnipeg
Promenade Tache
Figure Proposed Works
Back-Analysis
0015 021 00City of Winnipeg
Promenade Tache
Figure Proposed Works
Extreme

0015 021 00City of Winnipeg
Promenade Tache
Figure Proposed Works
Normal
0015 021 00City of Winnipeg
Promenade Tache
Figure Replicate KGS Group (2008 Report)
Back-Analysis
0015 021 00City of Winnipeg
Promenade Tache
Figure Existing Stabilization Works
Back-Analysis

0015 021 00City of Winnipeg
Promenade Tache
Figure Existing Stabilization Works + Upper Bank Pathway Fill
Back-Analysis